Effects of Thymol Supplementation on Goat Rumen Fermentation and Rumen Microbiota In Vitro

 ,
,
Abstract
:1. Introduction
2. Materials and Methods
2.1. Animal and Rumen Fluid Collection
2.2. In Vitro Batch Fermentation
2.3. Parameters Analysis Post Rumen Fermentation
2.4. Analysis of Rumen Microbial Communities
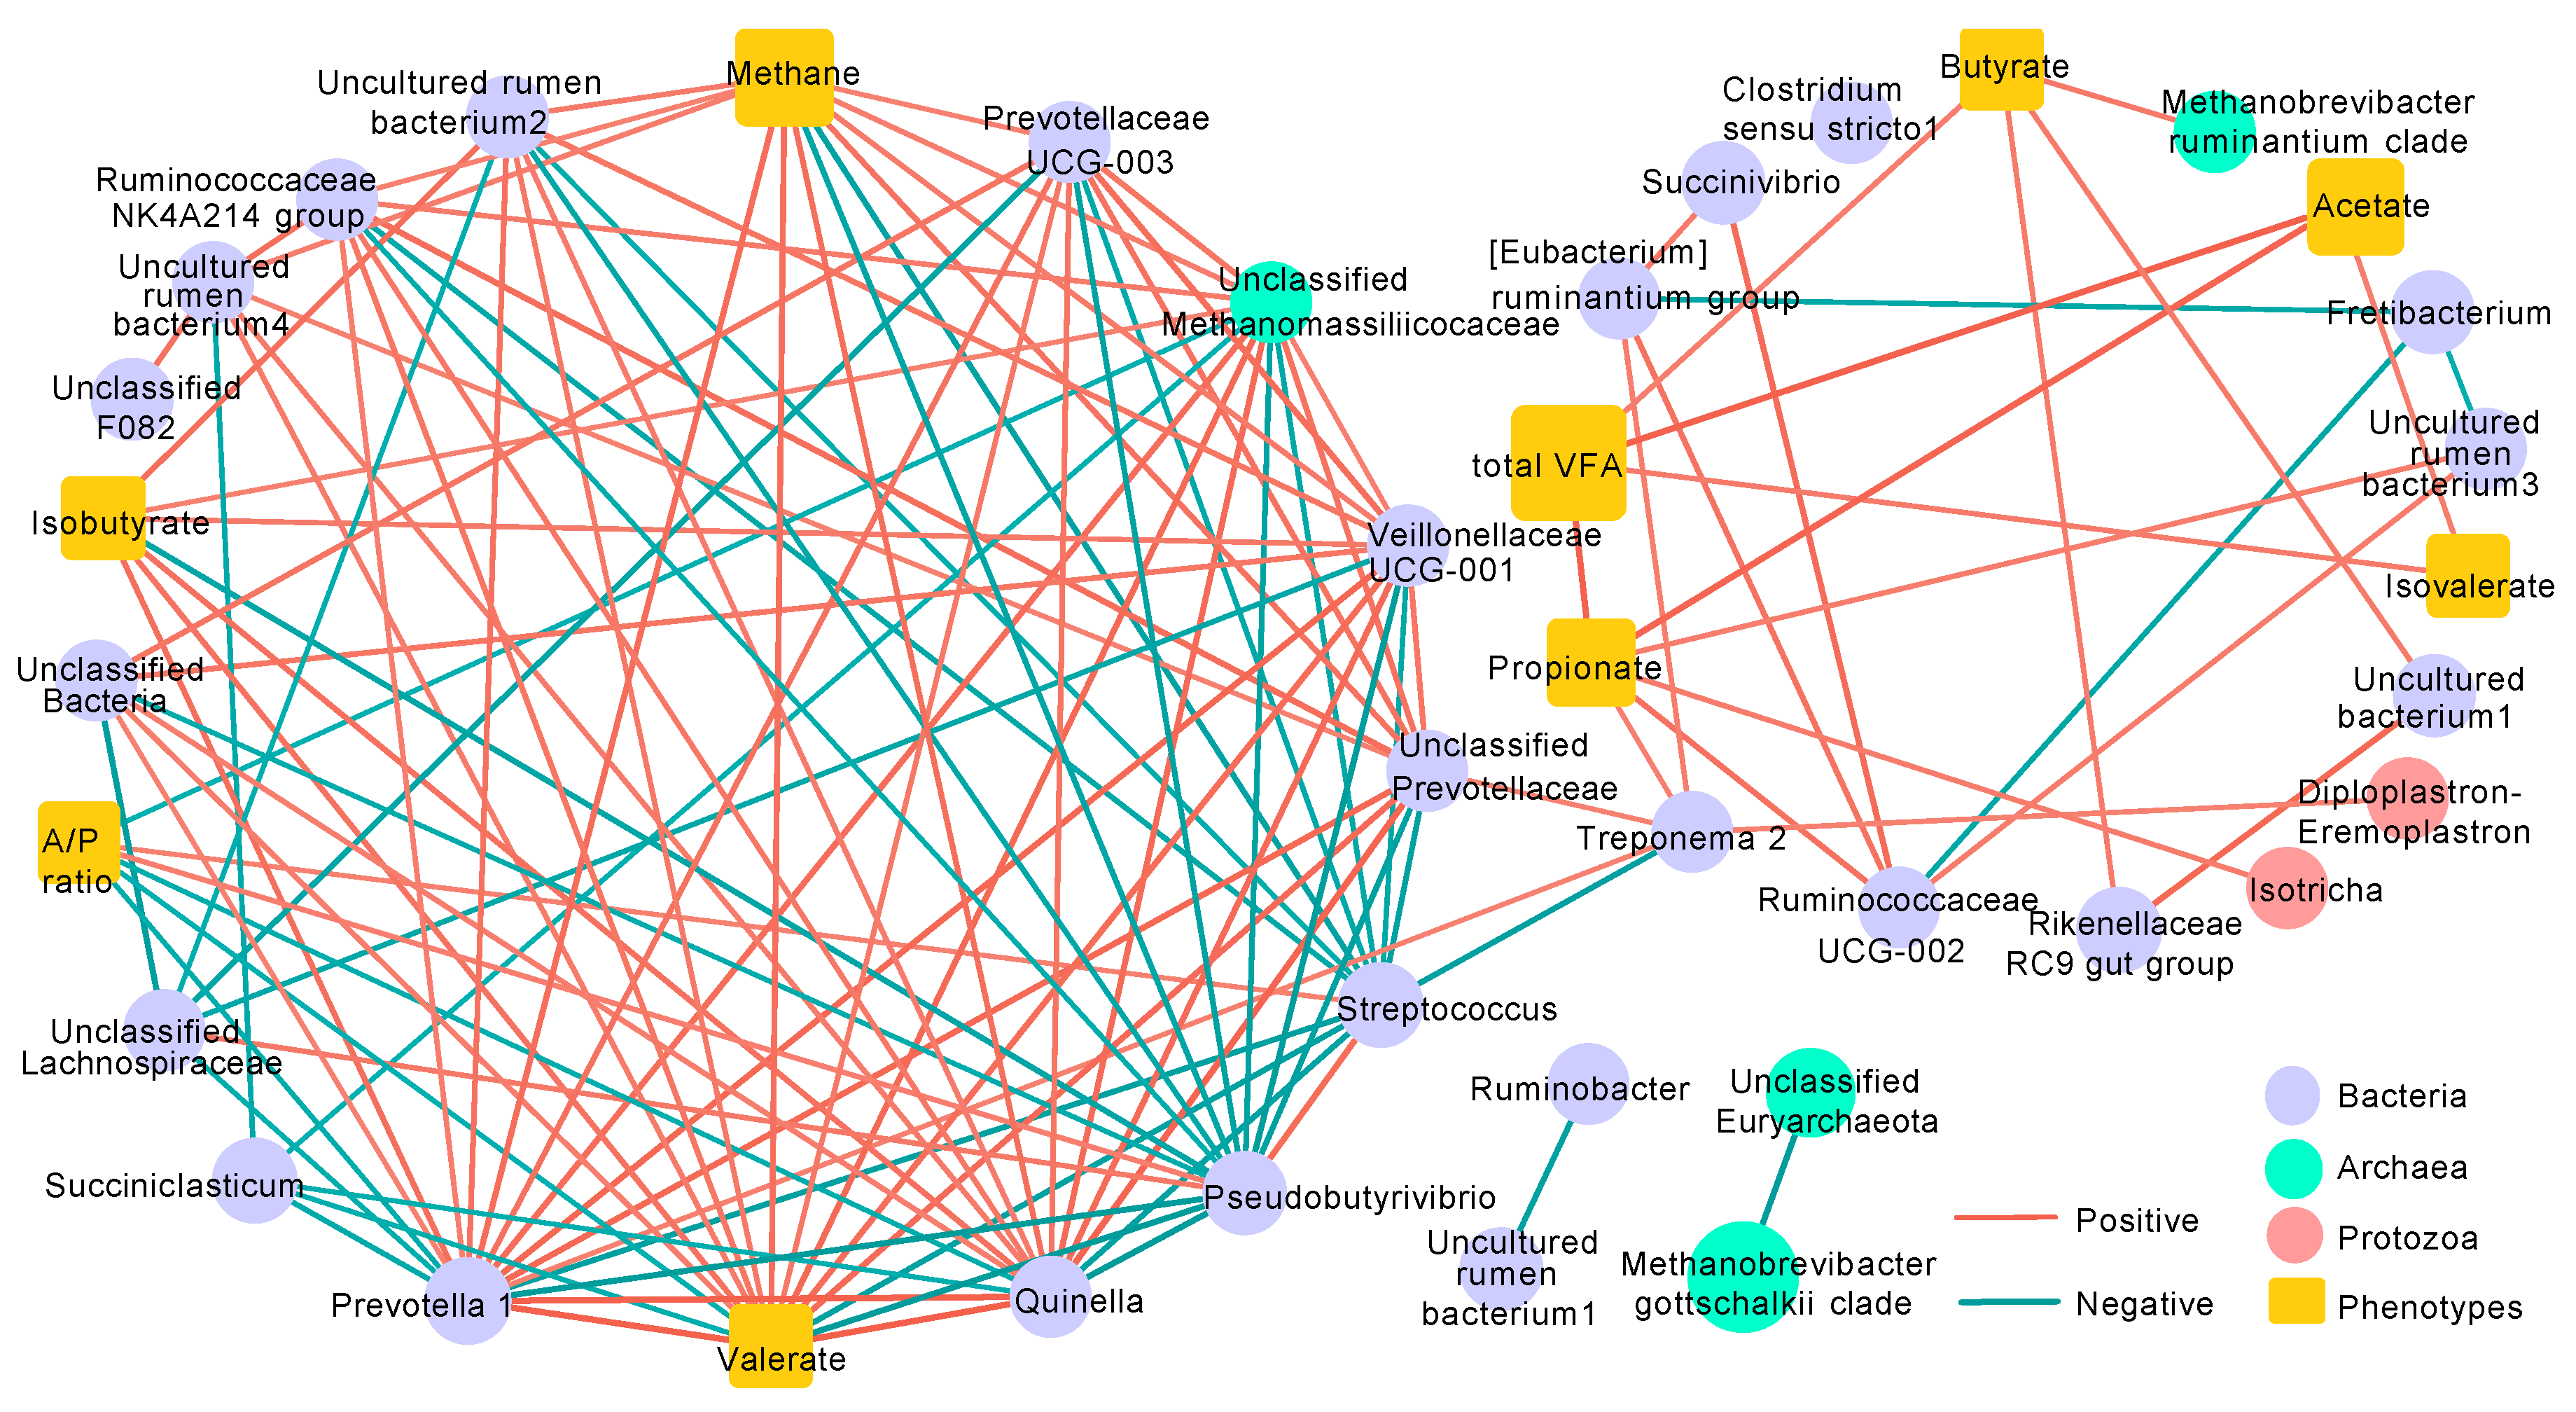
2.5. Network Analysis
2.6. Statistical Analysis
2.7. Data Submission
3. Results
3.1. Total Gas and Methane Production, pH, Digestibility, and Ammonia Concentration
3.2. Volatile Fatty Acids (VFA) Concentrations
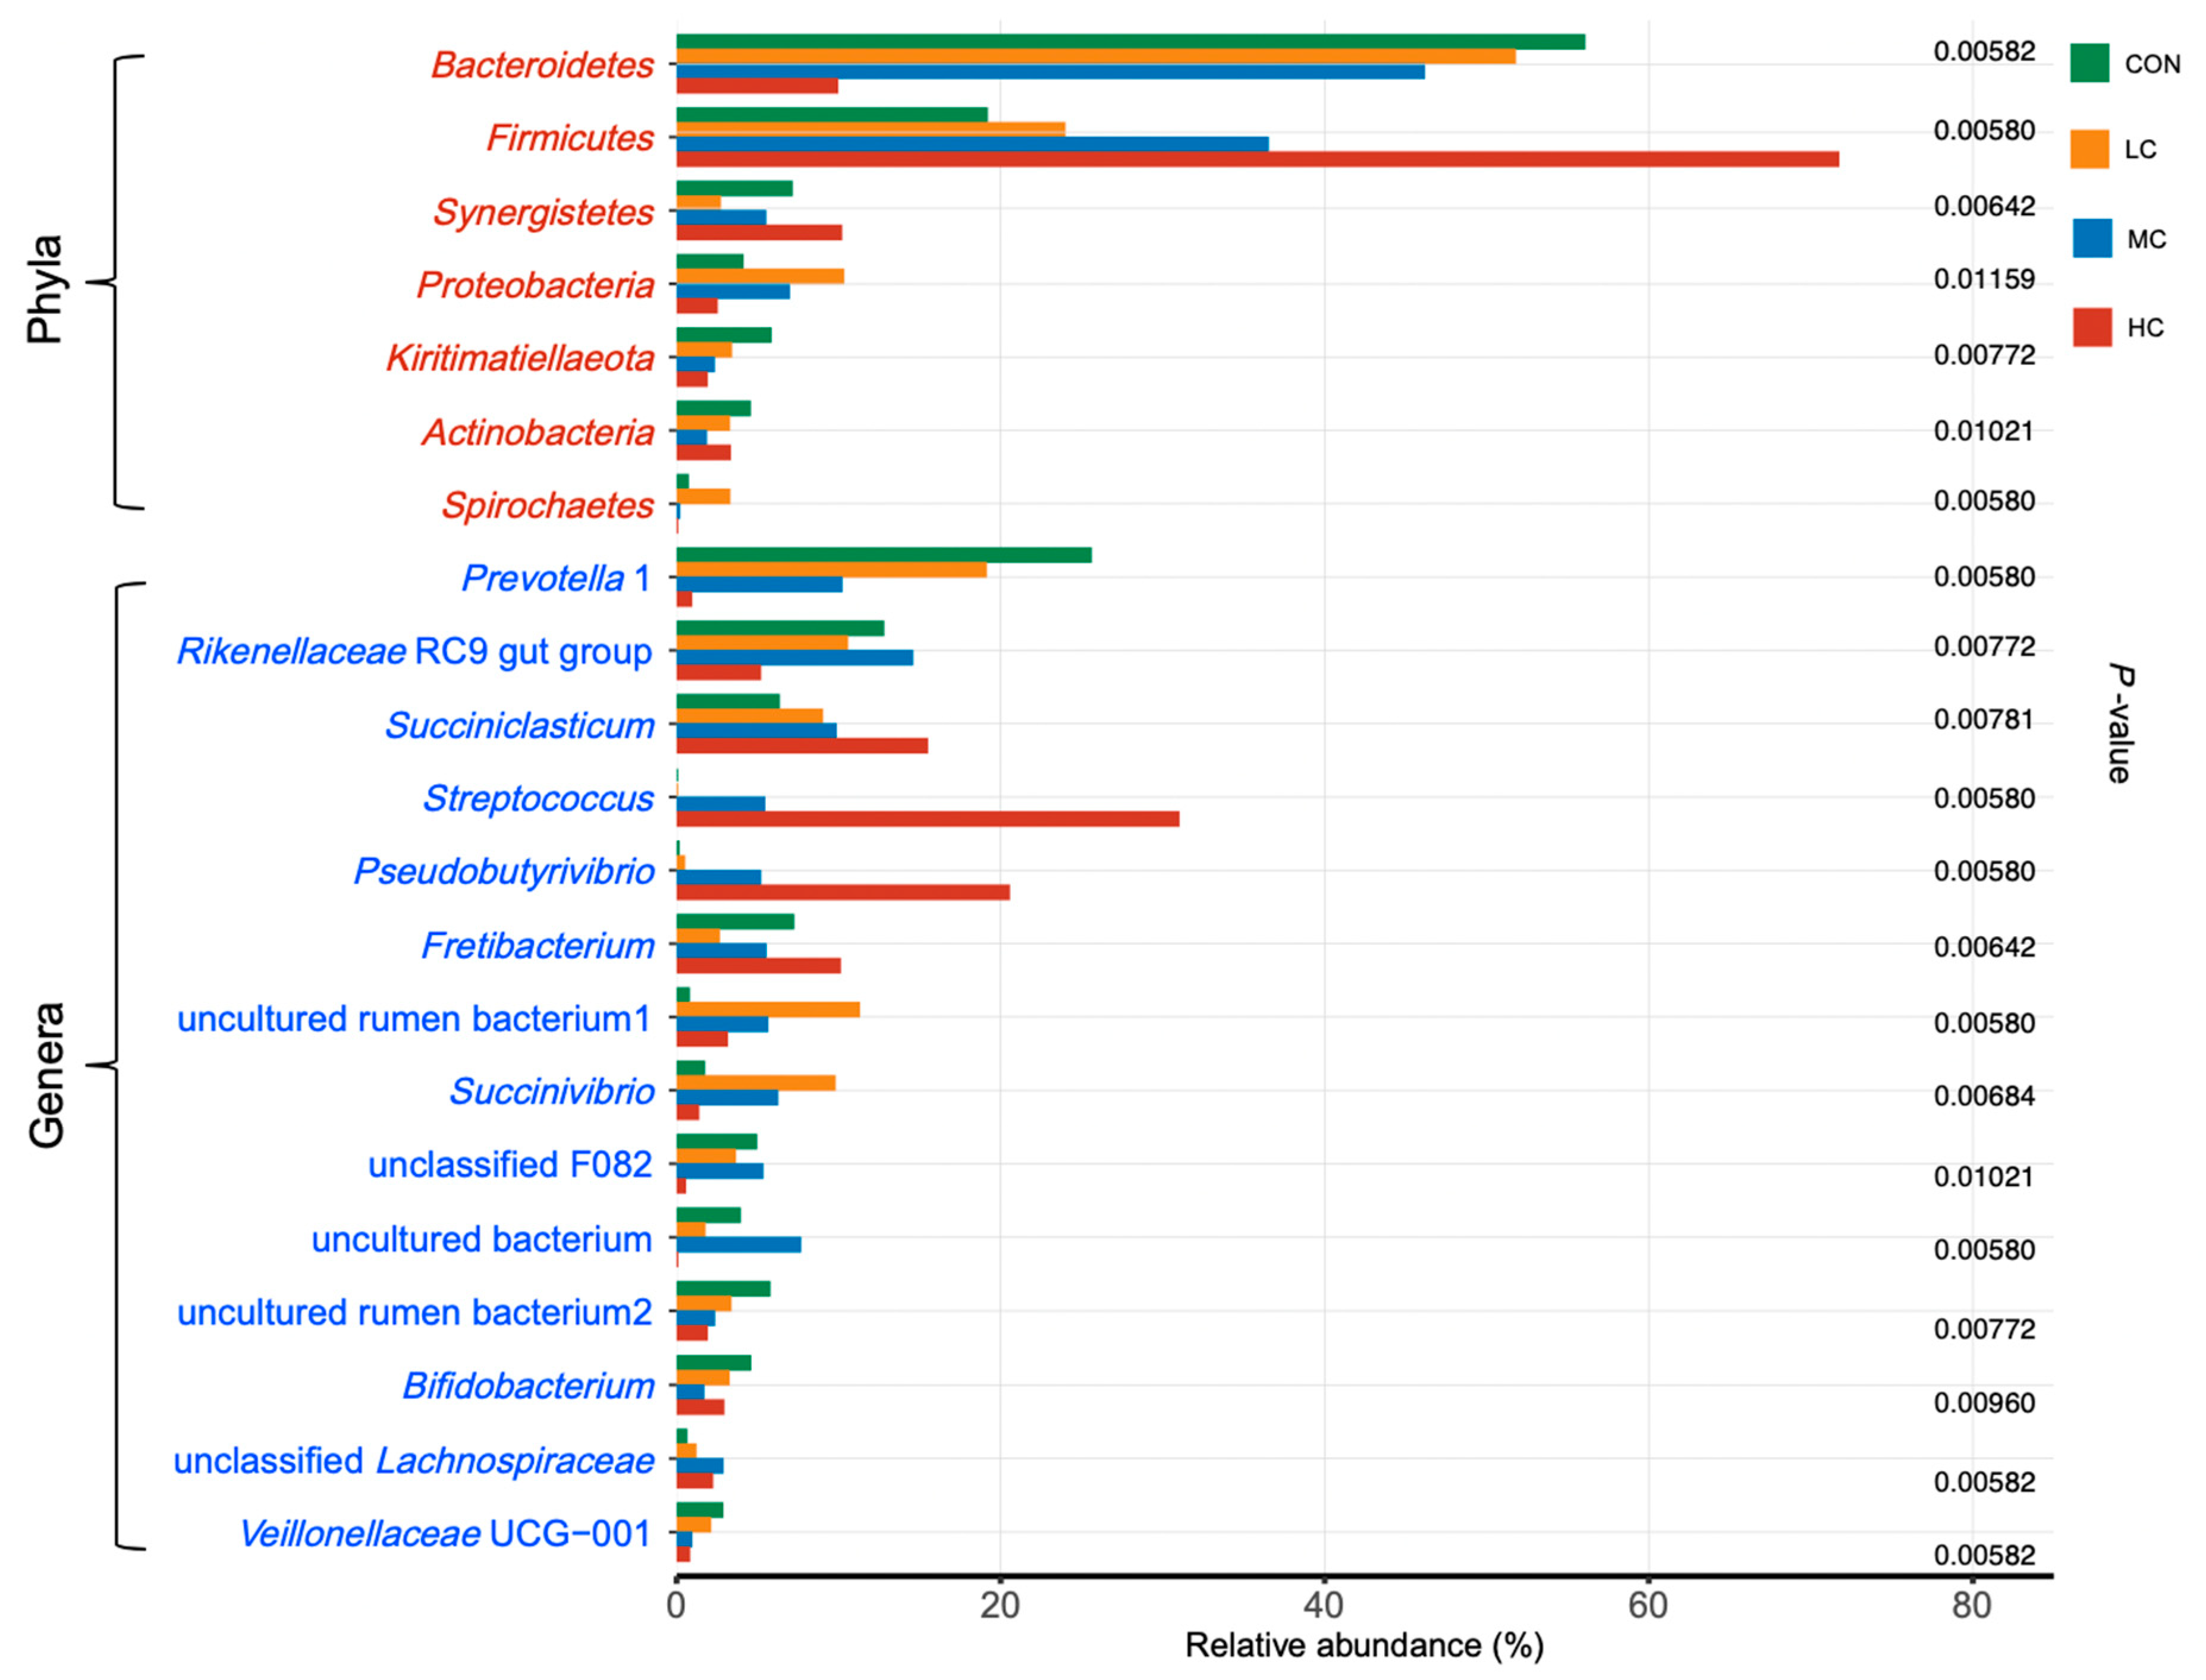
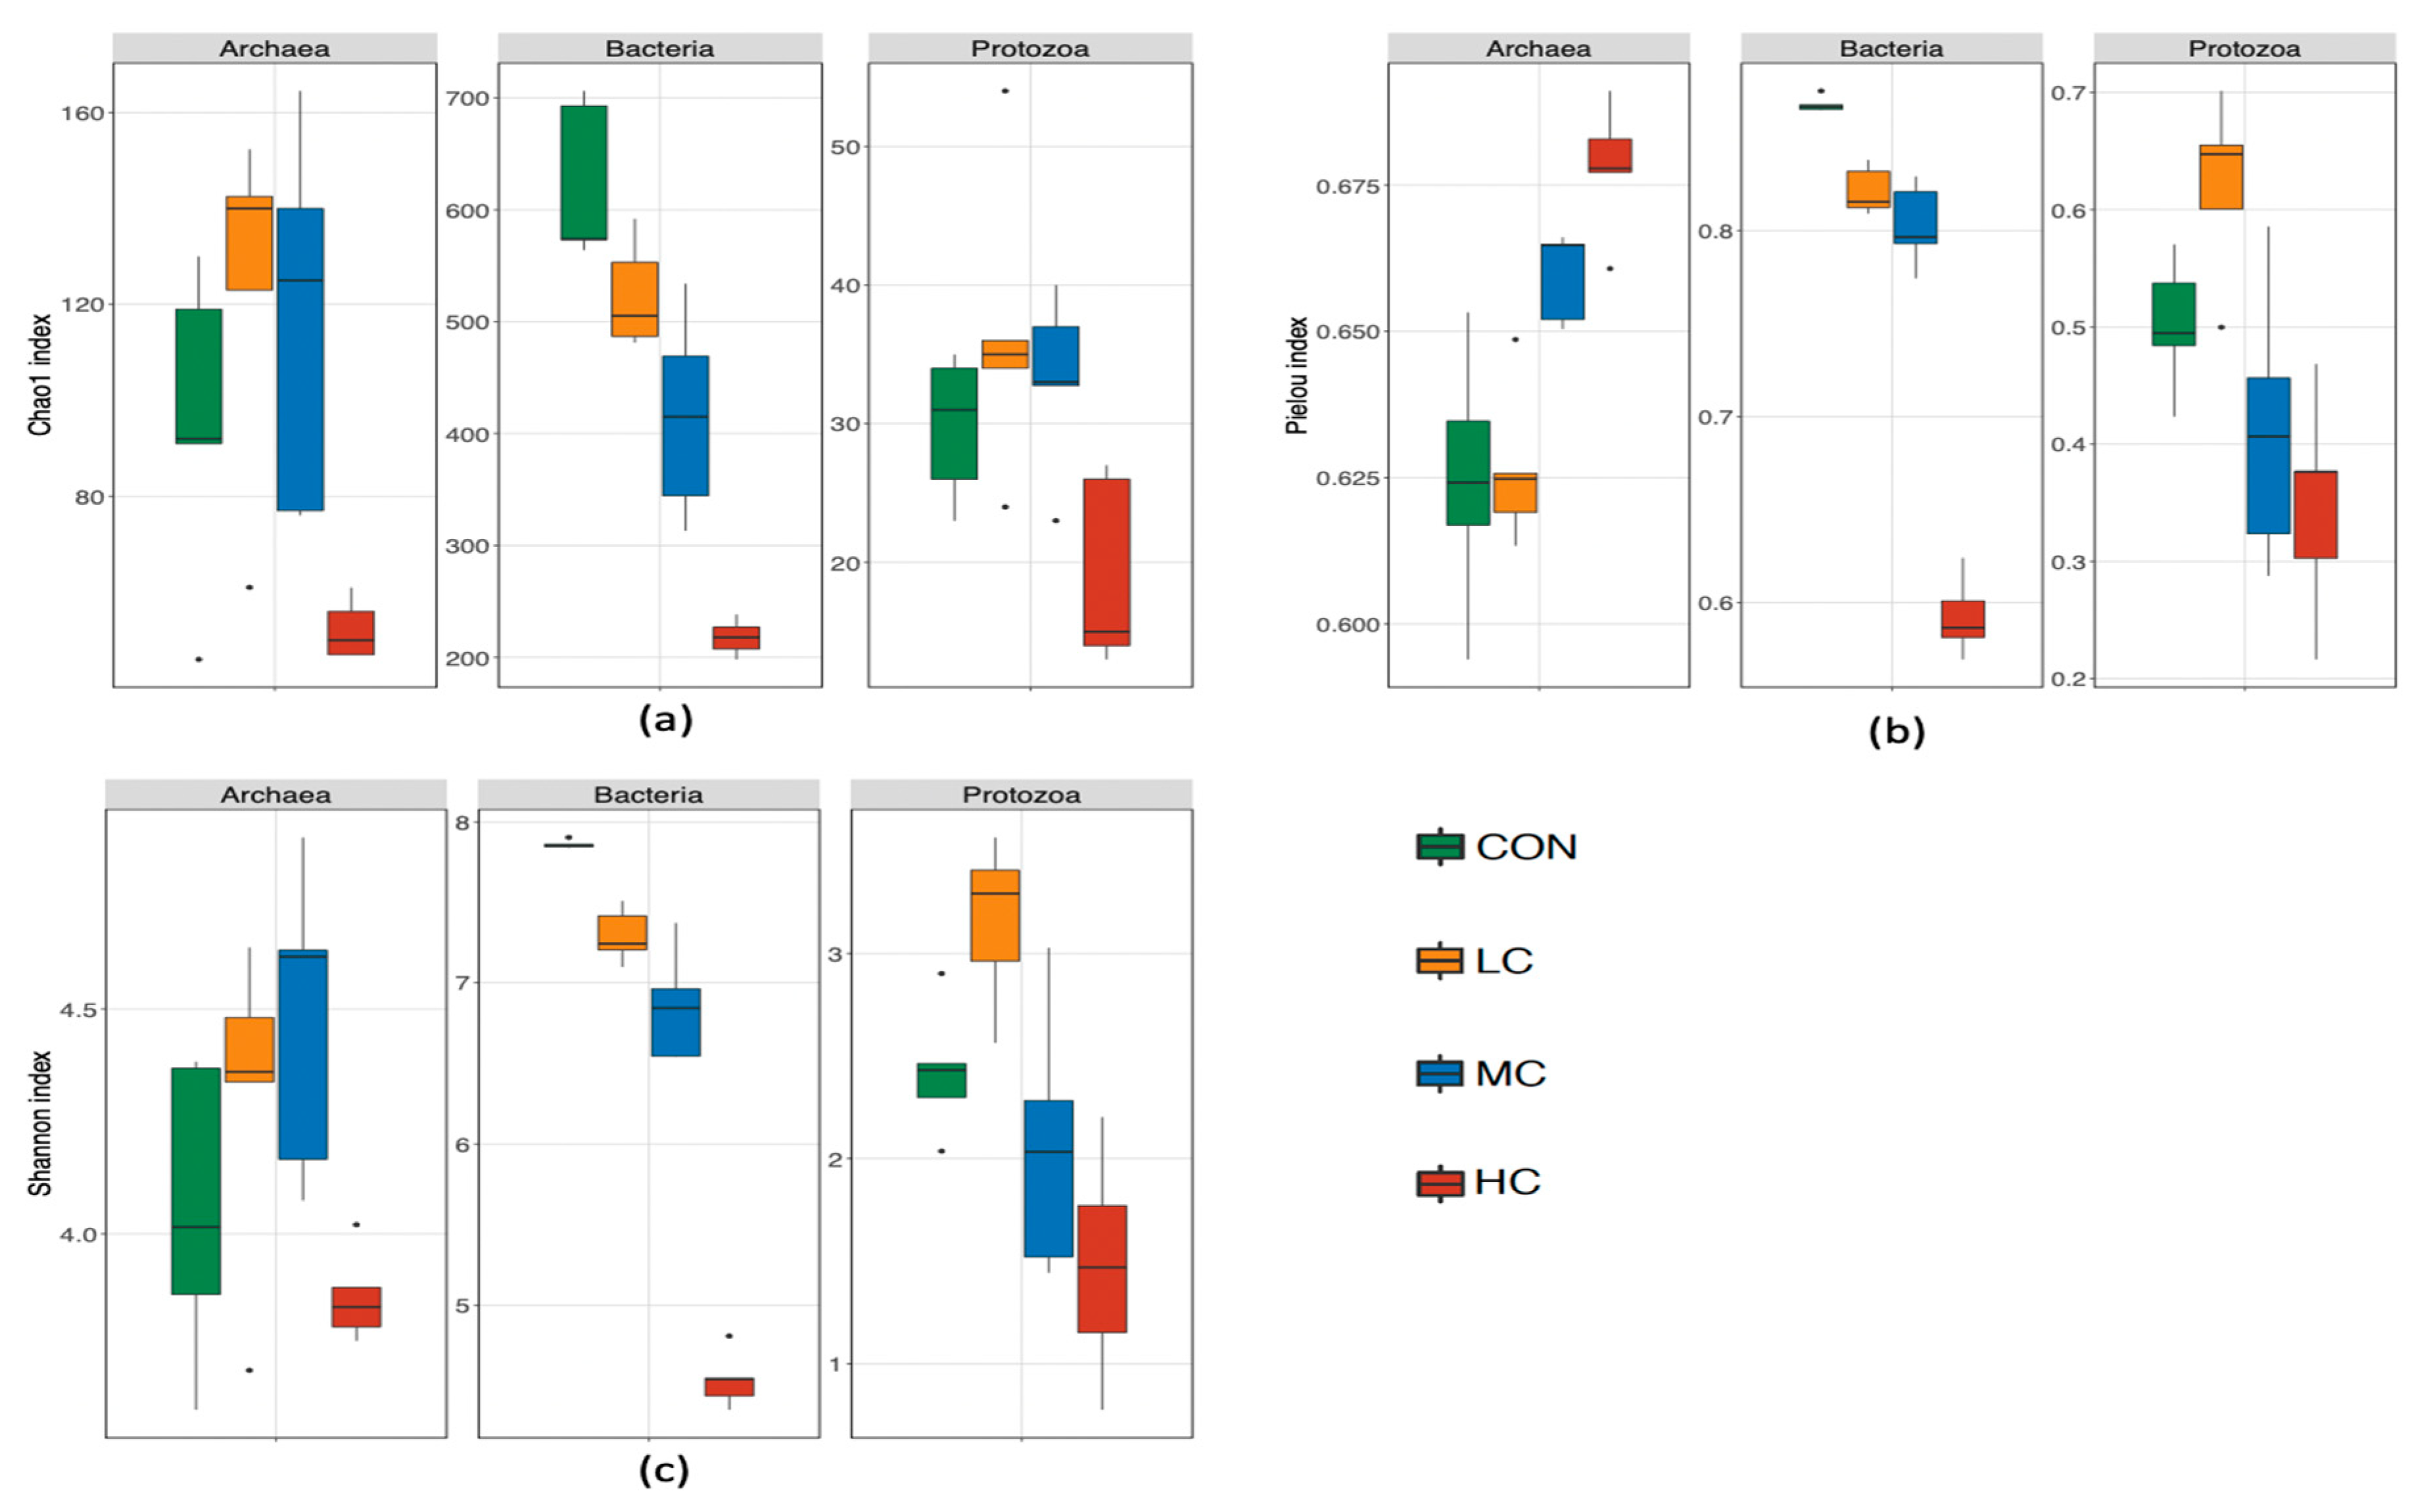
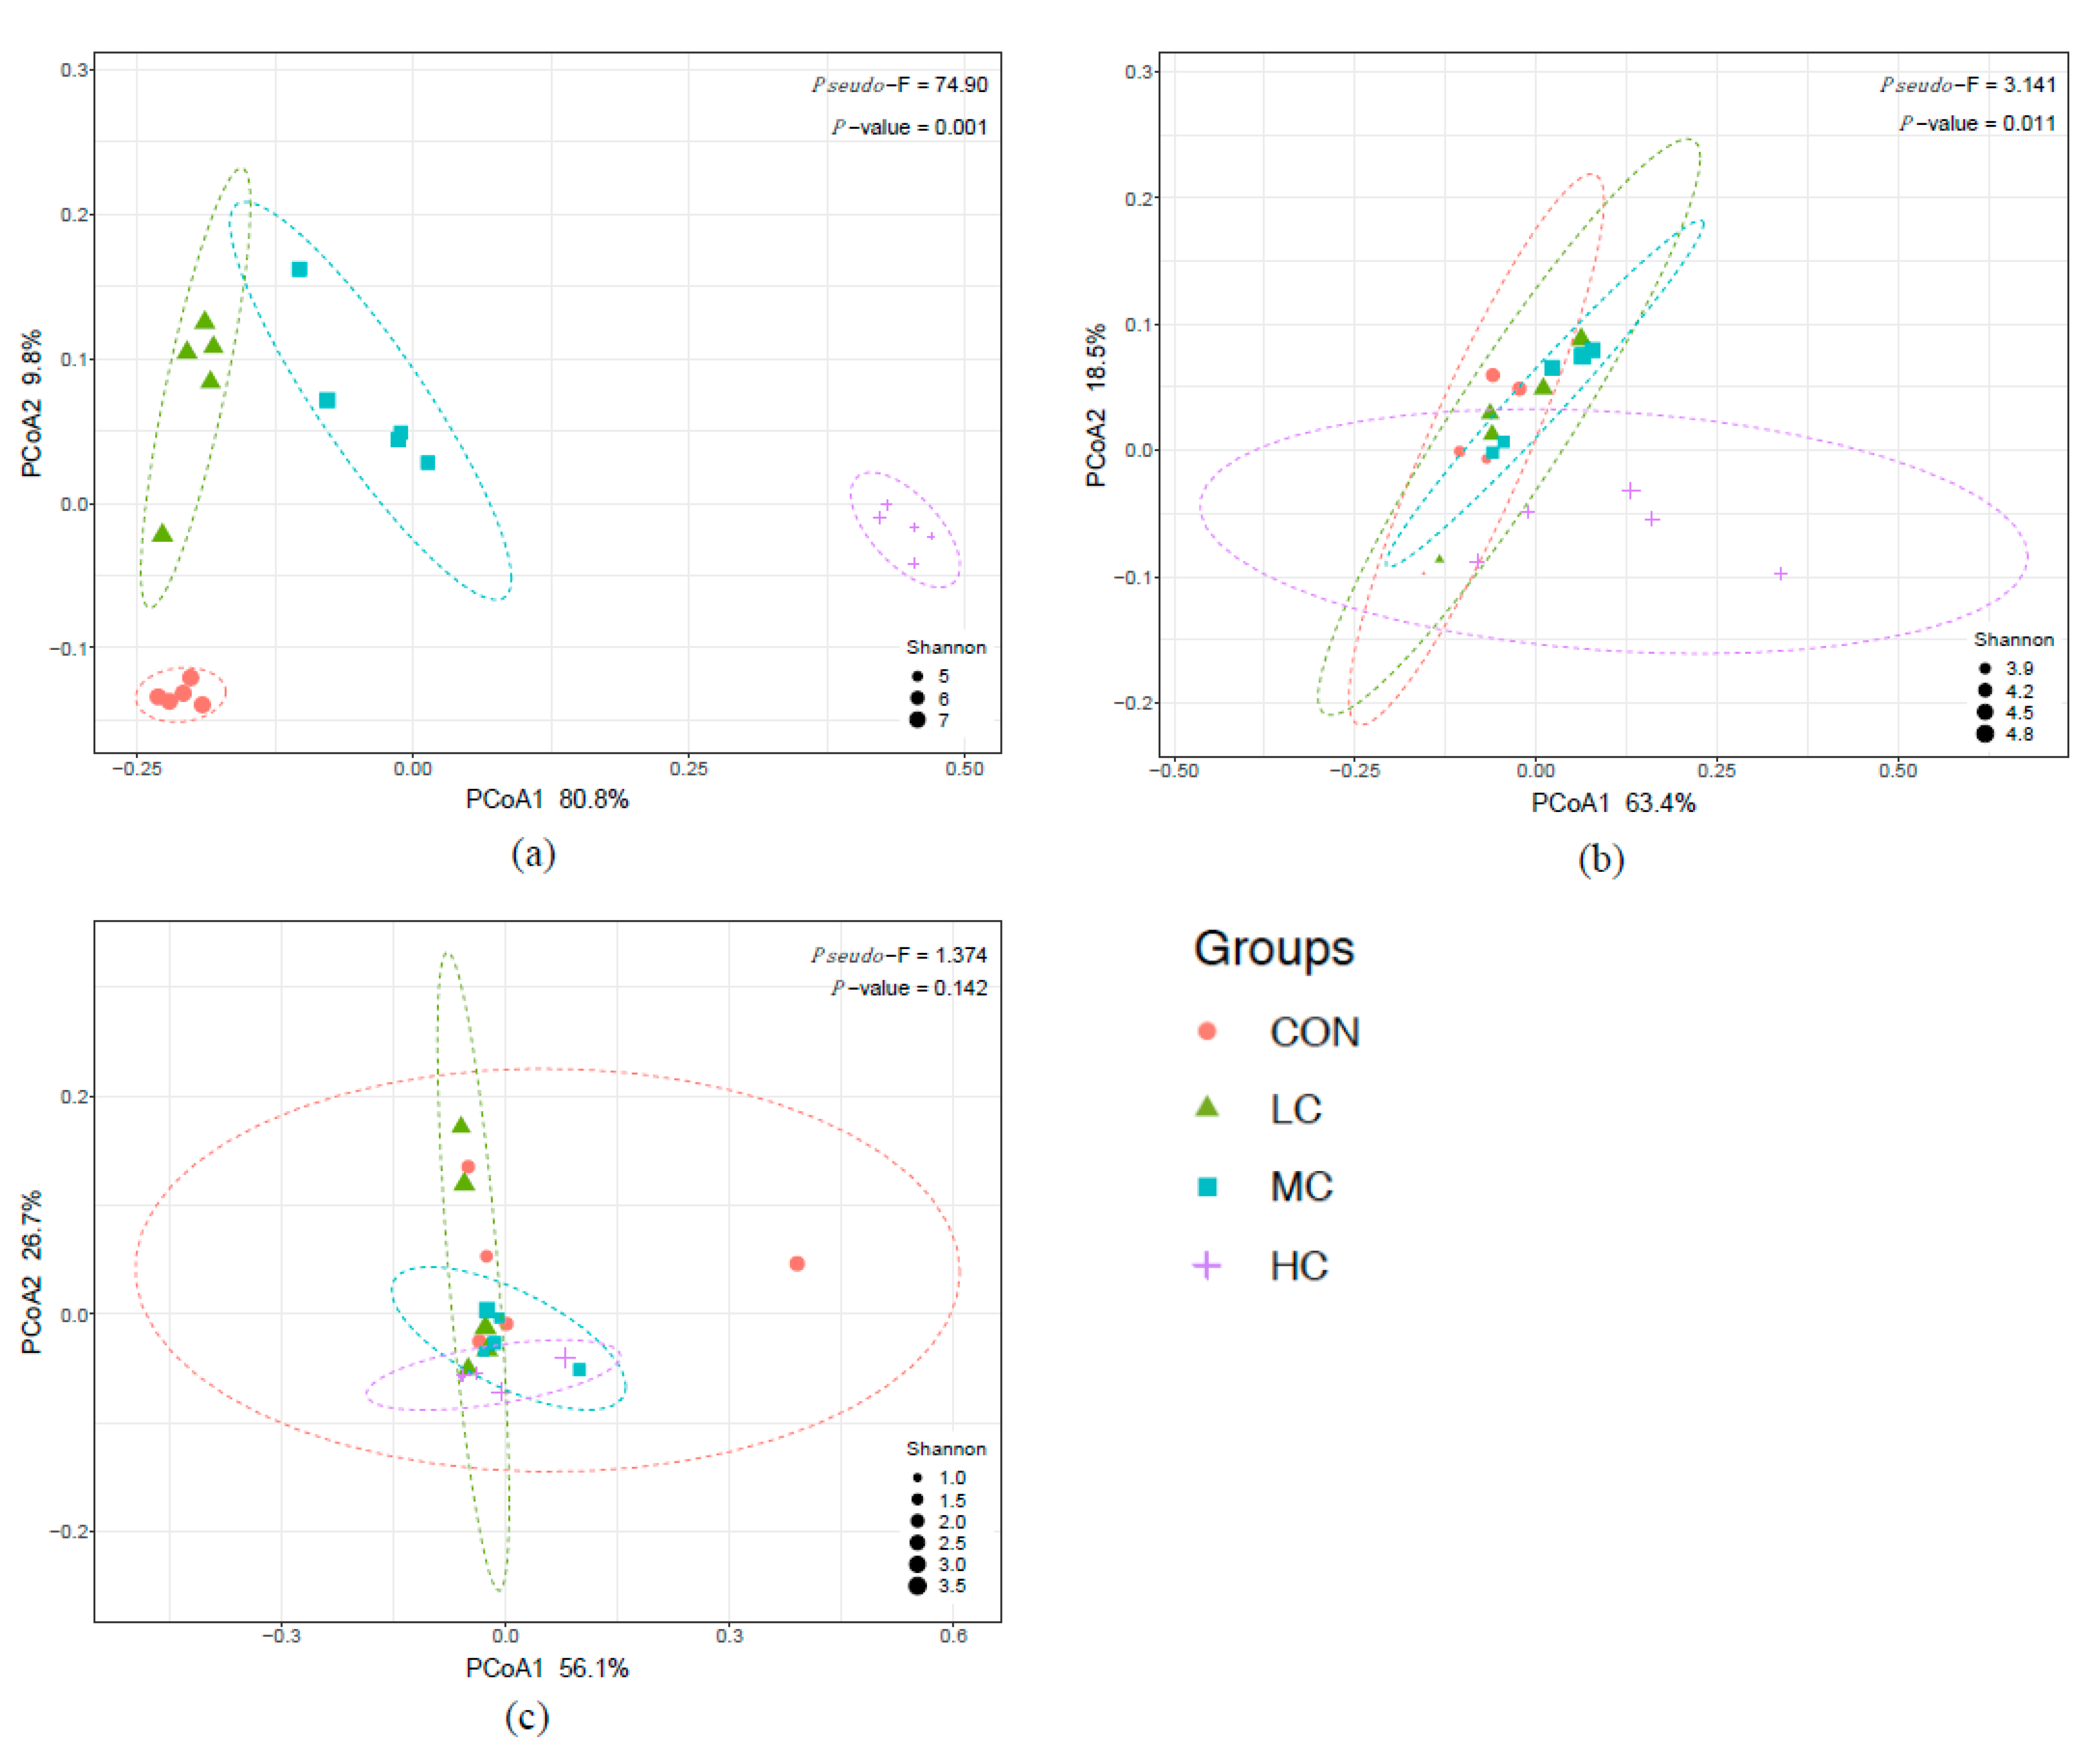
3.3. Rumen Bacteria
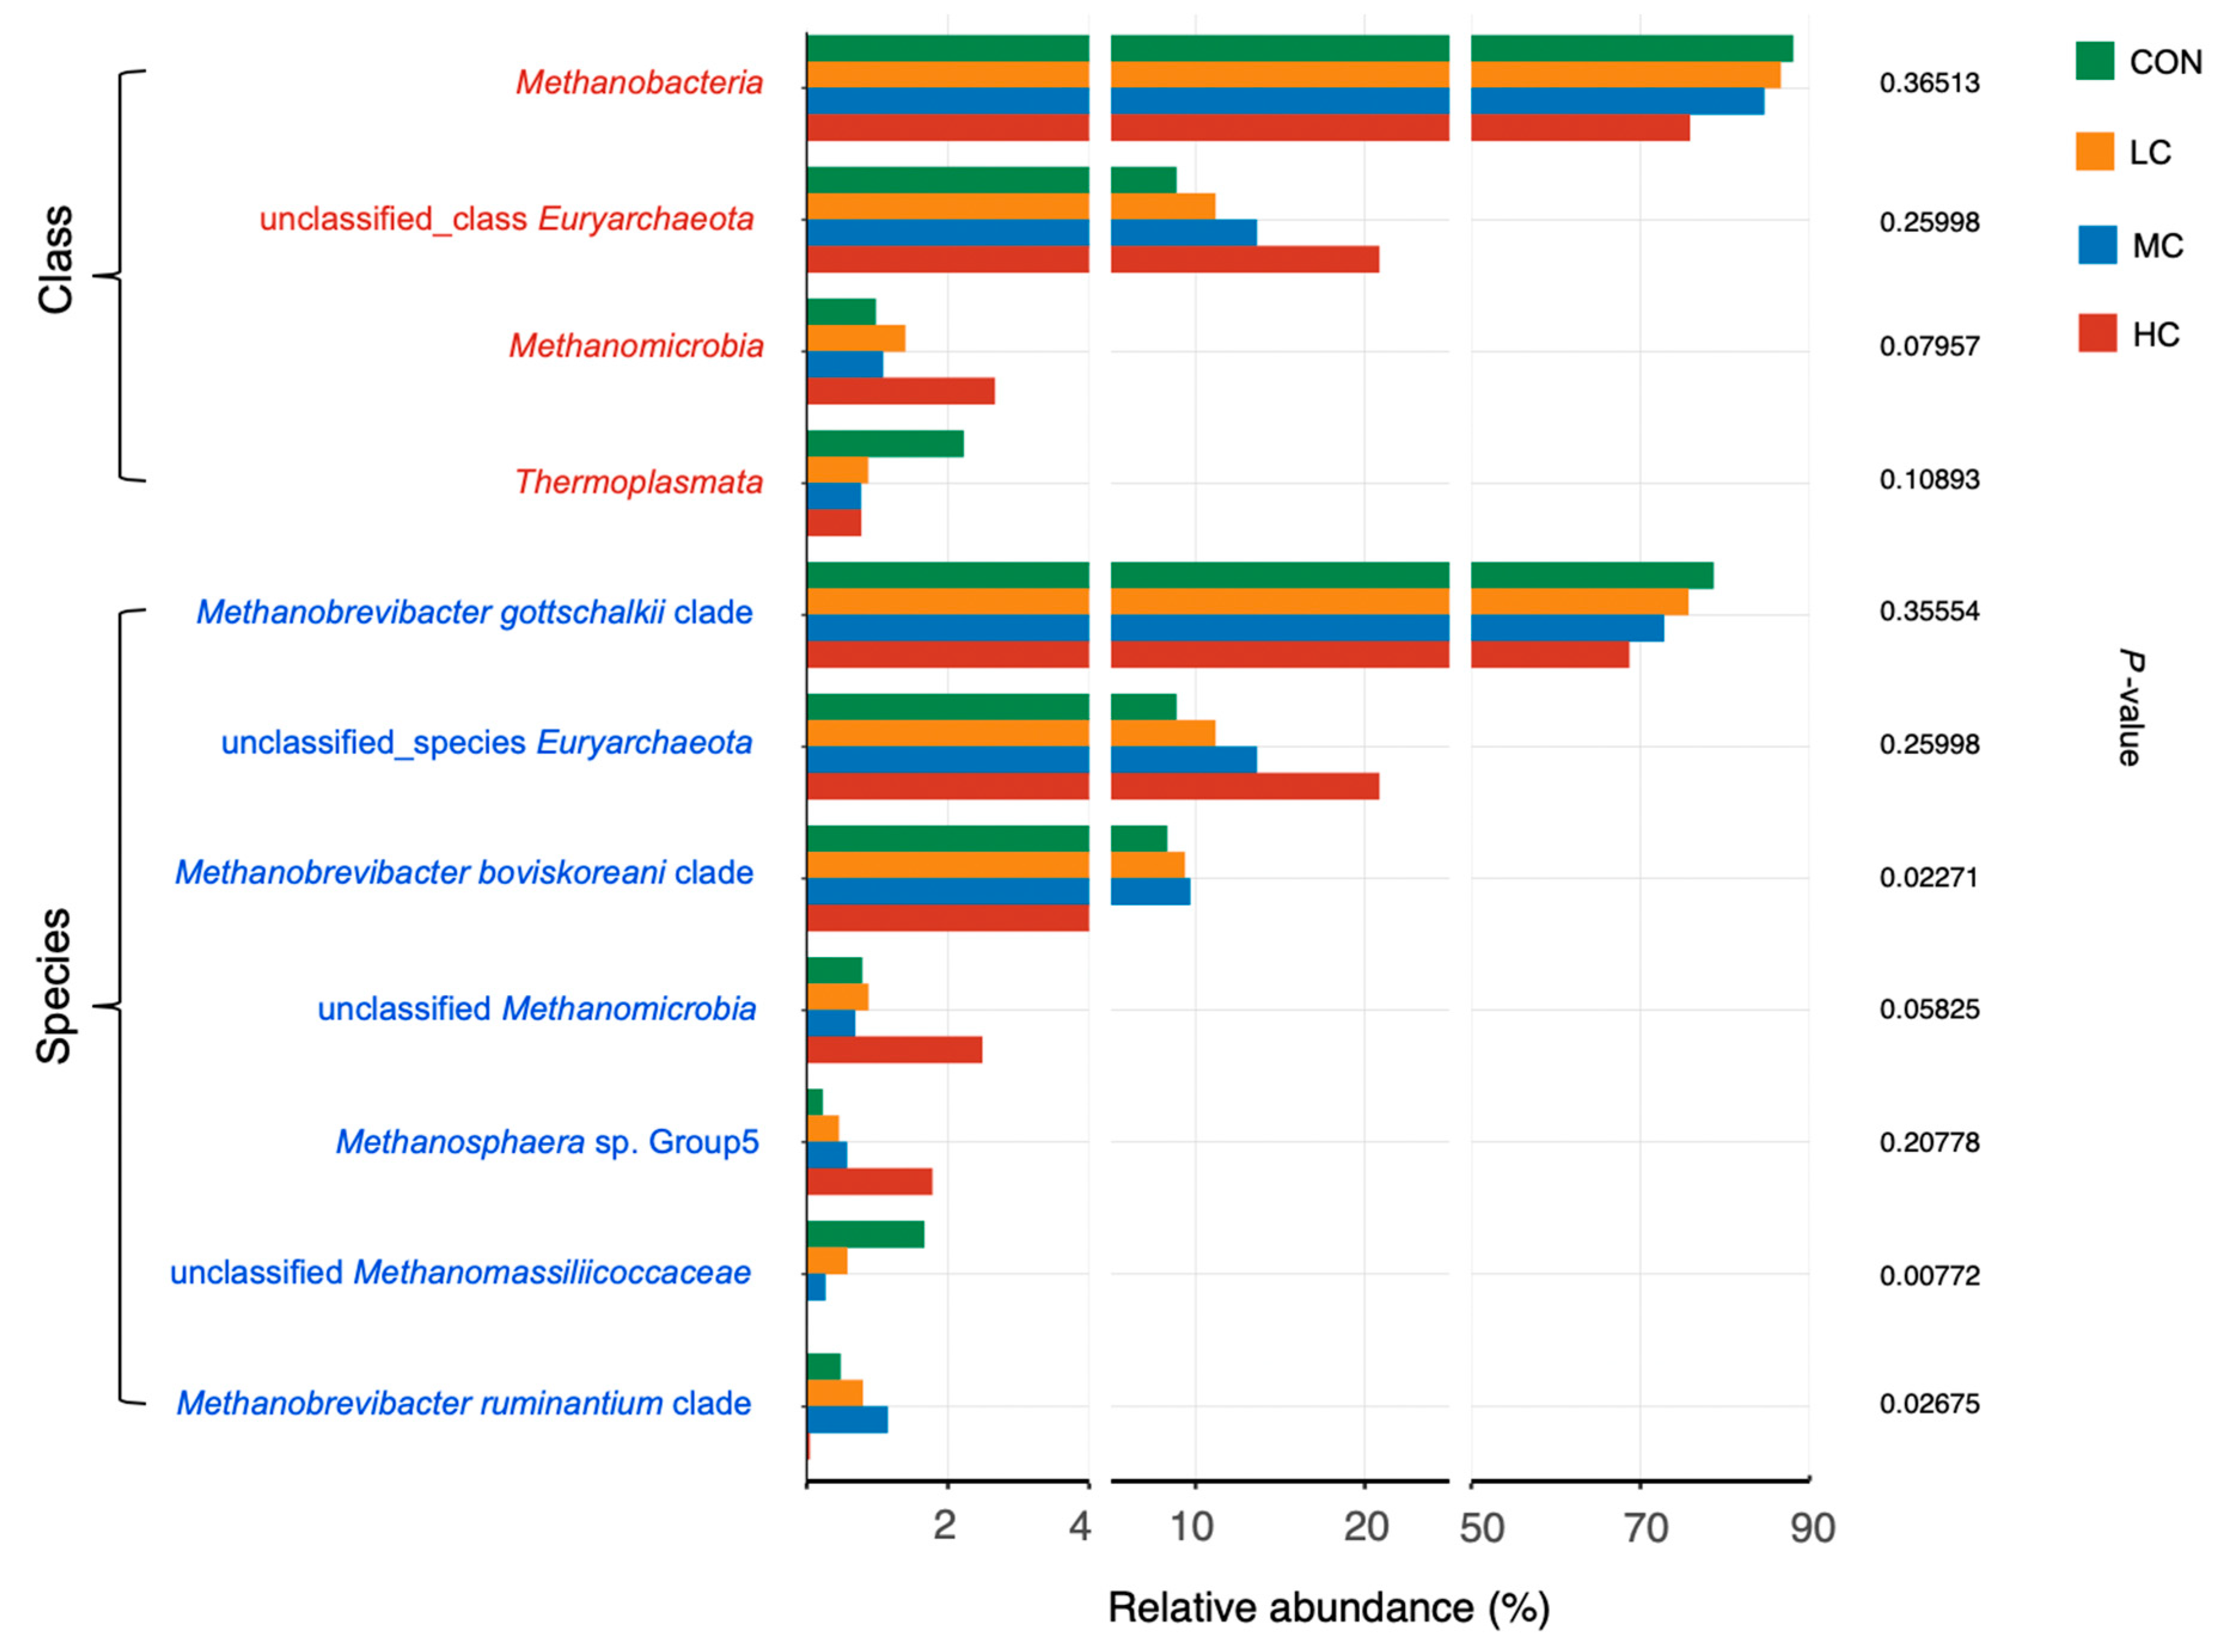
3.4. Rumen Archaea
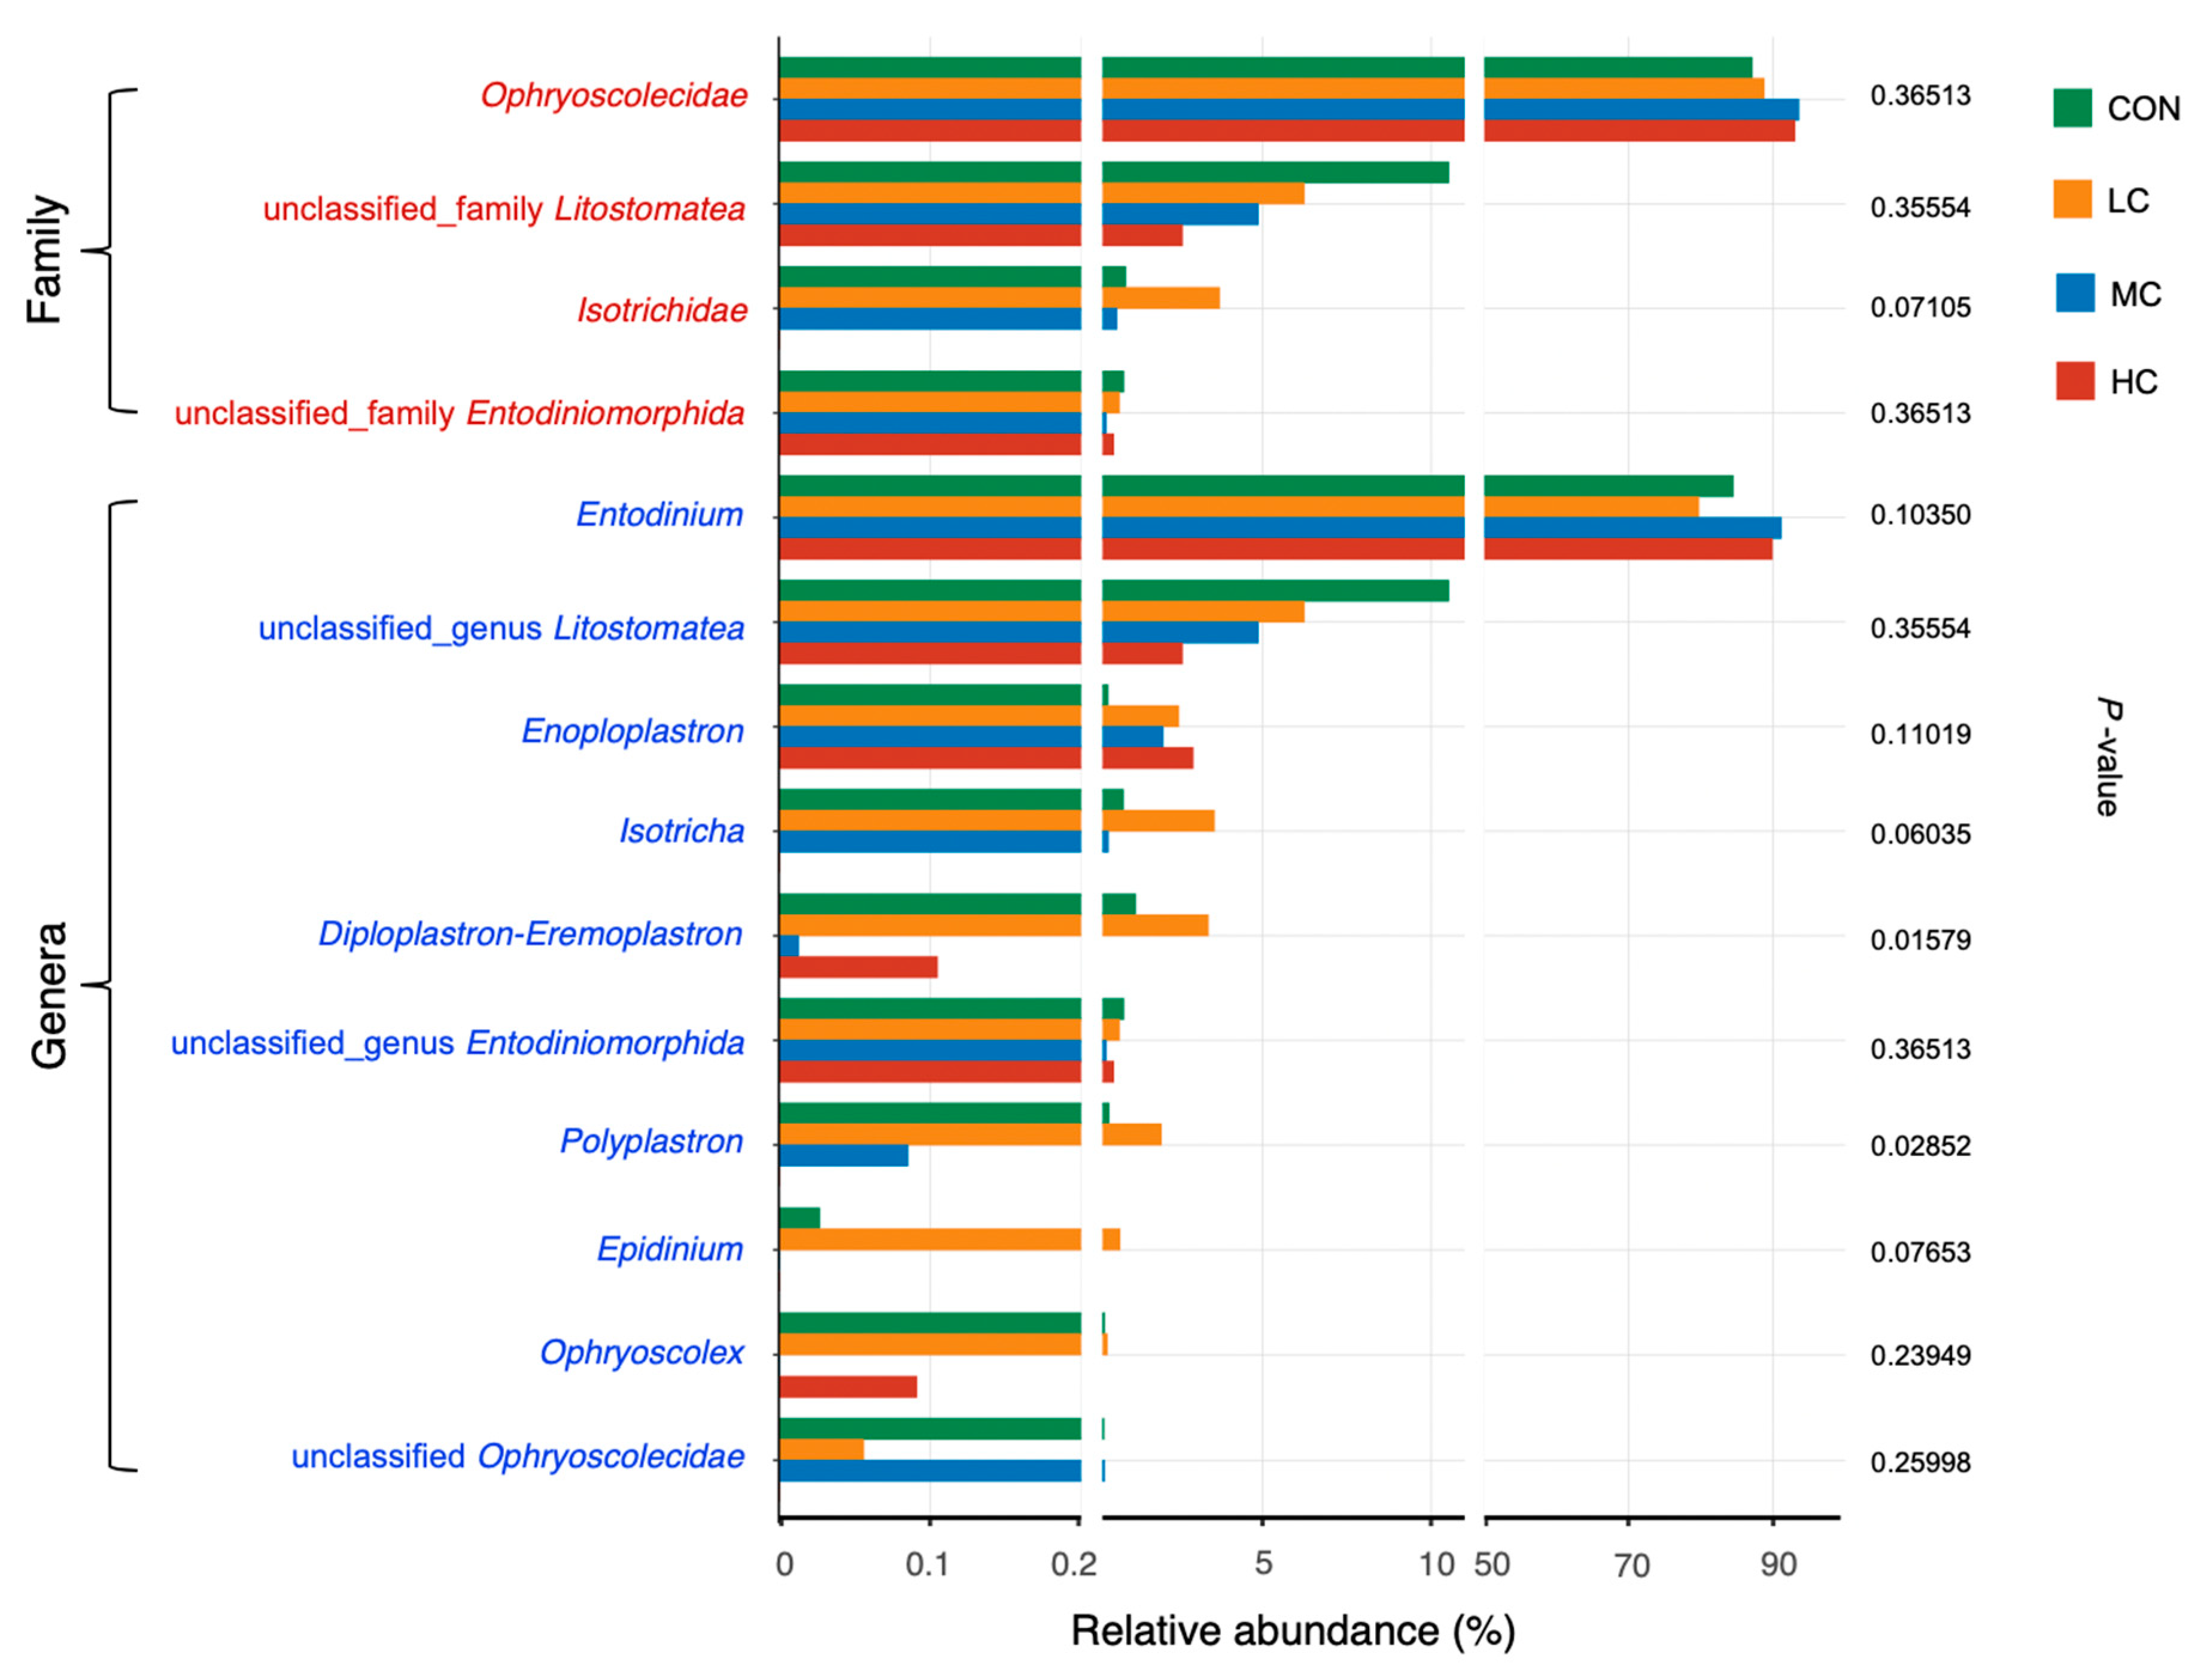
3.5. Rumen Ciliate Protozoa
3.6. Co-Occurrence Network Analysis
4. Discussion
4.1. Rumen Fermentation Production
4.2. Rumen Microbiota
5. Conclusions
Supplementary Materials
Author Contributions
Funding
Acknowledgments
Conflicts of Interest
References
- Jami, E.; White, B.A.; Mizrahi, I. Potential role of the bovine rumen microbiome in modulating milk composition and feed efficiency. PLoS ONE 2014, 1, e85423. [Google Scholar] [CrossRef] [PubMed]
- Mccann, J.C.; Wickersham, T.A.; Loor, J.J. High-throughput Methods Redefine the Rumen Microbiome and Its Relationship with Nutrition and Metabolism. Bioinform. Biol. Insights 2014, 8, 109–125. [Google Scholar] [CrossRef]
- Nagaraja, T.G. Microbiology of the Rumen. In Rumenology, 1st ed.; Millen, D., De Beni Arrigoni, M., Lauritano Pacheco, R.D., Eds.; Springer: Cham, Switzerland, 2016; pp. 39–62. ISBN 978-3-319-30533-2. [Google Scholar]
- Malmuthuge, N.; Griebel, P.J.; Guan, L.L. The gut microbiome and its potential role in the development and function of newborn calf gastrointestinal tract. Front. Vet. Sci. 2015, 2, 36. [Google Scholar] [CrossRef] [PubMed] [Green Version]
- Steinfeld, H.; Gerber, P.J.; Wassenaar, T.; Castel, V.; Rosales, M.; De Haan, C. Livestock’s Long Shadow: Environmental Issues and Options; FAO: Roma, Italy, 2006. [Google Scholar]
- Morgavi, D.P.; Rathahaoparis, E.; Popova, M.; Boccard, J.; Nielsen, K.F.; Boudra, H. Rumen microbial communities influence metabolic phenotypes in lambs. Front. Microbiol. 2015, 6, 1060. [Google Scholar] [CrossRef] [PubMed] [Green Version]
- Calsamiglia, S.; Busquet, M.; Cardozo, P.W.; Castillejos, L.; Ferret, A. Invited review: Essential oils as modifiers of rumen microbial fermentation. J. Dairy Sci. 2007, 6, 2580–2595. [Google Scholar] [CrossRef] [PubMed] [Green Version]
- Zeng, Z.; Zhang, S.; Wang, H.; Piao, X. Essential oil and aromatic plants as feed additives in non-ruminant nutrition: A review. J. Anim. Sci. Biotechnol. 2015, 1, 7. [Google Scholar] [CrossRef] [PubMed] [Green Version]
- Cobellis, G.; Trabalzamarinucci, M.; Marcotullio, M.C.; Yu, Z. Evaluation of different essential oils in modulating methane and ammonia production, rumen fermentation, and rumen bacteria in vitro. Anim. Feed Sci. Technol. 2016, 215, 25–36. [Google Scholar] [CrossRef] [Green Version]
- Cobellis, G.; Trabalza-Marinucci, M.; Yu, Z. Critical evaluation of essential oils as rumen modifiers in ruminant nutrition: A review. Sci. Total Environ. 2016, 545, 556–568. [Google Scholar] [CrossRef]
- Burt, S. Essential oils: Their antibacterial properties and potential applications in foods-a review. Int. J. Food Microbiol. 2004, 3, 223–253. [Google Scholar] [CrossRef]
- Evans, J.D.; Martin, S.A. Effects of thymol on ruminal microorganisms. Curr. Microbiol. 2000, 5, 336–340. [Google Scholar] [CrossRef]
- Joch, M.; Mrazek, J.; Skřivanova, E.; Cermak, L.; Marounek, M. Effects of pure plant secondary metabolites on methane production, rumen fermentation and rumen bacteria populations in vitro. J. Anim. Physiol. Anim. Nutr. 2018, 4, 869–881. [Google Scholar] [CrossRef]
- Castañeda-Correa, A.; Corral-Luna, A.; Hume, M.E.; Anderson, R.C.; Ruiz-Barrera, O.; Castillo-Castillo, Y.; Rodriguez-Almeida, F.; Salinas-Chavira, J.; Arzola-Alvarez, C. Effects of thymol and carvacrol, alone or in combination, on fermentation and microbial diversity during in vitro culture of bovine rumen microbes. J. Environ. Sci. Heal. B 2019, 3, 170–175. [Google Scholar] [CrossRef]
- Biricik, H.; Oral, H.H.; Taluğ, A.M.; Cengiz, S.S.; Koyuncu, M.; Dikmen, S. The effects of carvacrol and/or thymol on the performance, blood and rumen parameters, and carcass traits of Merino sheep. Turk. J. Vet. Anim. Sci. 2016, 5, 651–659. [Google Scholar] [CrossRef]
- Roy, D.; Tomar, S.K.; Sirohi, S.; Kumar, V.; Kumar, M. Efficacy of different essential oils in modulating rumen fermentation in vitro using buffalo rumen liquor. Vet. World 2014, 4, 213–218. [Google Scholar] [CrossRef]
- Schären, M.; Drong, C.; Kiri, K.; Riede, S.; Gardener, M.; Meyer, U.; Hummel, J.; Urich, T.; Breves, G.; Dänicke, S. Differential effects of monensin and a blend of essential oils on rumen microbiota composition of transition dairy cows. J. Dairy Sci. 2017, 4, 2765–2783. [Google Scholar] [CrossRef] [PubMed] [Green Version]
- Malekkhahi, M.; Tahmasbi, A.M.; Naserian, A.A.; Mesgaran, M.D.; Kleen, J.L.; Parand, A.A. Effects of essential oils, yeast culture and malate on rumen fermentation, blood metabolites, growth performance and nutrient digestibility of Baluchi lambs fed high-concentrate diets. J. Anim. Physiol. Anim. Nutr. 2015, 2, 221–229. [Google Scholar] [CrossRef]
- Alemu, A.W.; Romero-Pérez, A.; Araujo, R.C.; Beauchemin, K.A. Effect of Encapsulated Nitrate and Microencapsulated Blend of Essential Oils on Growth Performance and Methane Emissions from Beef Steers Fed Backgrounding Diets. Animals 2019, 1, 21. [Google Scholar] [CrossRef] [PubMed] [Green Version]
- Vatta, A.F.; Abbot, M.A.; Villiers, J.F.; Gumede, S.A.; Harrison, L.J.; Krecek, R.C.; Letty, B.A.; Mapeyi, N.; Pearson, R.A. Goat Keepers’ Animal Health Care Manual, 2nd ed.; Onderstepoort Veterinary Institute with KwaZulu-Natal Department of Agriculture and Environmental Affairs: Onderstepoort, South Africa, 2006; p. 60. ISBN 13-978-1-86849-352-4.
- Menke, K.H.; Steingass, H. Estimation of the energetic feed value obtained from chemical analysis and in vitro gas production using rumen liquid. Anim. Res. Dev. 1988, 28, 7–55. [Google Scholar]
- Chaney, A.L.; Marbach, E.P. Modified Reagents for Determination of Urea and Ammonia. Clin. Chem. 1962, 2, 130–132. [Google Scholar] [CrossRef]
- Yang, W.Z.; Beauchemin, K.A.; Rode, L.M. Effects of grain processing, forage to concentrate ratio, and forage particle size on rumen pH and digestion by dairy cows. J. Dairy Sci. 2001, 2, 203–216. [Google Scholar] [CrossRef]
- Blummel, M.; Steingaβ, H.; Becker, K. The relationship between in vitro gas production, in vitro microbial biomass yield and 15N incorporation and its implications for the prediction of voluntary feed intake of roughages. Br. J. Nutr. 1997, 6, 911–921. [Google Scholar] [CrossRef] [PubMed] [Green Version]
- Yu, Z.; Morrison, M. Improved extraction of PCR-quality community DNA from digesta and fecal samples. BioTechniques 2004, 5, 808–812. [Google Scholar] [CrossRef] [PubMed]
- Walters, W.A.; Caporaso, J.G.; Lauber, C.L.; Berglyons, D.; Fierer, N.; Knight, R. PrimerProspector: De novo design and taxonomic analysis of barcoded polymerase chain reaction primers. Bioinformatics 2011, 8, 1159–1161. [Google Scholar] [CrossRef] [Green Version]
- Kittelmann, S.; Seedorf, H.; Walters, W.A.; Clemente, J.C.; Knight, R.; Gordon, J.I.; Janssen, P.H. Simultaneous amplicon sequencing to explore co-occurrence patterns of bacterial, archaeal and eukaryotic microorganisms in rumen microbial communities. PLoS ONE 2013, 2, e47879. [Google Scholar] [CrossRef] [PubMed]
- Seedorf, H.; Kittelmann, S.; Henderson, G.; Janssen, P.H. RIM-DB: A taxonomic framework for community structure analysis of methanogenic archaea from the rumen and other intestinal environments. PeerJ 2014, 2, e494. [Google Scholar] [CrossRef] [Green Version]
- Kittelmann, S.; Devente, S.R.; Kirk, M.R.; Seedorf, H.; Dehority, B.A.; Janssen, P.H. Phylogeny of intestinal ciliates, including Charonina ventriculi, and comparison of microscopy and 18S rRNA gene pyrosequencing for rumen ciliate community structure analysis. Appl. Environ. Microbiol. 2015, 7, 2433–2444. [Google Scholar] [CrossRef] [PubMed] [Green Version]
- Caporaso, J.G.; Kuczynsk, J.; Stombaugh, J.; Bittinger, K.; Bushman, F.D.; Costello, E.K.; Fierer, N.; Gonzalez Peña, A.; Goodrich, J.K.; Gordon, J.I.; et al. QIIME allows analysis of high-throughput community sequencing data. Nat. Methods 2010, 5, 335. [Google Scholar] [CrossRef] [Green Version]
- Callahan, B.J.; Mcmurdie, P.J.; Rosen, M.J.; Han, A.W.; Johnson, A.; Holmes, S. DADA2: High-resolution sample inference from Illumina amplicon data. Nat. Methods 2016, 7, 581. [Google Scholar] [CrossRef] [Green Version]
- Bokulich, N.A.; Kaehler, B.D.; Rideout, J.R.; Dillon, M.; Bolyen, E.; Knight, R.; Huttley, G.A.; Caporaso, J.G. Optimizing taxonomic classification of marker-gene amplicon sequences with QIIME 2′s q2-feature-classifier plugin. Microbiome 2018, 1, 90. [Google Scholar] [CrossRef]
- Quast, C.; Pruesse, E.; Yilmaz, P.; Gerken, J.; Schweer, T.; Yarza, P.; Peplies, J.; Glöckner, F.O. The SILVA ribosomal RNA gene database project: Improved data processing and web-based tools. Nucleic Acids Res. 2013, 41, D590–D596. [Google Scholar] [CrossRef]
- Katoh, K.; Standley, D.M. MAFFT Multiple Sequence Alignment Software Version 7: Improvements in Performance and Usability. Mol. Biol. Evol. 2013, 4, 772–780. [Google Scholar] [CrossRef] [PubMed] [Green Version]
- Lane, D.J. 16S/23S rRNA sequencing. In Nucleic Acid Techniques in Bacterial Systematics; Stackebrandt, E., Goodfellow, M., Eds.; John Wiley and Sons: New York, NY, USA, 1991; pp. 115–175. ISBN 0-471-92906-9. [Google Scholar]
- Price, M.N.; Dehal, P.S.; Arkin, A.P. FastTree 2–approximately maximum-likelihood trees for large alignments. PLoS ONE 2010, 3, e9490. [Google Scholar] [CrossRef] [PubMed]
- Lozupone, C.A.; Hamady, M.; Knight, R. UniFrac—An online tool for comparing microbial community diversity in a phylogenetic context. BMC Bioinform. 2006, 1, 371. [Google Scholar] [CrossRef] [Green Version]
- R Core Team. R: A Language and Environment for Statistical Computing; R Foundation for Statistical Computing: Vienna, Austria, 2019. [Google Scholar]
- Harrell, F.E., Jr.; Harrell, M.F.E., Jr. Package ‘Hmisc’. CRAN2018 2019, 2019, 235–236. [Google Scholar]
- Benjamini, Y.; Krieger, A.M.; Yekutieli, D. Adaptive linear step-up procedures that control the false discovery rate. Biometrika 2006, 3, 491–507. [Google Scholar] [CrossRef]
- Shannon, P.; Markiel, A.; Ozier, O.; Baliga, N.S.; Wang, J.T.; Ramage, D.; Amin, N.; Schwikowski, B.; Ideker, T. Cytoscape: A software environment for integrated models of biomolecular interaction networks. Genome Res. 2003, 11, 2498–2504. [Google Scholar] [CrossRef]
- Anderson, M.J. A new method for non-parametric multivariate analysis of variance. Austral. Ecol. 2001, 1, 32–46. [Google Scholar]
- Benchaar, C.; Chaves, A.V.; Fraser, G.R.; Beauchemin, K.A.; Mcallister, T.A. Effects of essential oils and their components on in vitro rumen microbial fermentation. Can. J. Anim. Sci. 2007, 3, 413–419. [Google Scholar] [CrossRef]
- Kamalak, A.; Canbolat, Ö.; Özkan, Ç.Ö.; Ataley, A.I. Effect of thymol on in vitro gas production, digestibility and metabolizable energy content of alfalfa hay. Kafkas Univ. Vet. Fak. Derg. 2011, 2, 211–216. [Google Scholar]
- Membrive, C.M.B. Anatomy and Physiology of the Rumen. In Rumenology, 1st ed.; Millen, D., De Beni Arrigoni, M., Lauritano Pacheco, R.D., Eds.; Springer: Cham, Switzerland, 2016; pp. 1–38. ISBN 978-3-319-30533-2. [Google Scholar]
- Macheboeuf, D.; Morgavi, D.P.; Papon, Y.; Arturo-Schaan, M. Dose–response effects of essential oils on in vitro fermentation activity of the rumen microbial population. Anim. Feed Sci. Technol. 2008, 145, 335–350. [Google Scholar] [CrossRef]
- Vendramini, T.H.A.; Takiya, C.S.; Silva, T.H.; Zanferari, F.; Rentas, M.F.; Bertoni, J.C.; Consentini, C.E.C.; Gardinal, R.; Acedo, T.S.; Rennó, F.P. Effects of a blend of essential oils, chitosan or monensin on nutrient intake and digestibility of lactating dairy cows. Anim. Feed Sci. Technol. 2016, 214, 12–21. [Google Scholar] [CrossRef]
- de Souza, K.A.; de Oliveira Monteschio, J.; Mottin, C.; Ramos, T.R.; de Moraes Pinto, L.A.; Eiras, C.E.; Guerrero, A.; do Prado, I.N. Effects of diet supplementation with clove and rosemary essential oils and protected oils (eugenol, thymol and vanillin) on animal performance, carcass characteristics, digestibility, and ingestive behavior activities for Nellore heifers finished in feedlot. Livest. Sci. 2019, 220, 190–195. [Google Scholar]
- Borchers, R. Proteolytic activity of rumen fluid in vitro. J. Anim. Sci. 1965, 4, 1033–1038. [Google Scholar] [CrossRef]
- Castillejos, L.; Calsamiglia, S.; Ferret, A. Effect of essential oil active compounds on rumen microbial fermentation and nutrient flow in in vitro systems. J. Dairy Sci. 2006, 7, 2649–2658. [Google Scholar] [CrossRef]
- Khiaosa-ard, R.; Zebeli, Q. Meta-analysis of the effects of essential oils and their bioactive compounds on rumen fermentation characteristics and feed efficiency in ruminants. J. Anim. Sci. 2013, 4, 1819–1830. [Google Scholar] [CrossRef] [PubMed]
- Khorrami, B.; Vakili, A.R.; Mesgaran, M.D.; Klevenhusen, F. Thyme and cinnamon essential oils: Potential alternatives for monensin as a rumen modifier in beef production systems. Anim. Feed Sci. Technol. 2015, 200, 8–16. [Google Scholar] [CrossRef]
- Vakili, A.R.; Khorrami, B.; Mesgaran, M.D.; Parand, E. The effects of thyme and cinnamon essential oils on performance, rumen fermentation and blood metabolites in Holstein calves consuming high concentrate diet. Asian-Australas. J. Anim. Sci. 2013, 7, 935. [Google Scholar] [CrossRef] [Green Version]
- Pirondini, M.; Colombini, S.; Malagutti, L.; Rapetti, L.; Galassi, G.; Zanchi, R.; Crovetto, G.M. Effects of a selection of additives on in vitro ruminal methanogenesis and in situ and in vivo NDF digestibility. Anim. Sci. J. 2015, 1, 59–68. [Google Scholar] [CrossRef]
- Oh, J.; Harper, M.; Hristov, A.N. Effects of lowering crude protein supply alone or in a combination with essential oils on productivity, rumen function and nutrient utilization in dairy cows. Animal 2019, 13, 2510–2518. [Google Scholar] [CrossRef]
- Brockman, J. Glucose and short-chain fatty acid metabolism. In Quantitative Aspects of Ruminant Digestion and Metabolism, 2nd ed.; Dijkstra, J., Forbes, J.M., France, J., Eds.; CAB International Wallingford: Wallingford, UK, 2005; pp. 291–310. ISBN 9780851998145. [Google Scholar]
- Blanch, M.; Carro, M.D.; Ranilla, M.J.; Viso, A.; Vázquez-Añón, M.; Bach, A. Influence of a mixture of cinnamaldehyde and garlic oil on rumen fermentation, feeding behavior and performance of lactating dairy cows. Anim. Feed Sci. Technol. 2016, 219, 313–323. [Google Scholar] [CrossRef] [Green Version]
- El-Zaiat, H.M.; Abdalla, A.L. Potentials of patchouli (Pogostemon cablin) essential oil on ruminal methanogenesis, feed degradability, and enzyme activities in vitro. Environ. Sci. Pollut. Res. 2019, 26, 30220–30228. [Google Scholar] [CrossRef] [PubMed]
- Miguel, M.; Lee, S.S.; Mamuad, L.; Choi, Y.J.; Jeong, C.D.; Son, A.; Cho, K.K.; Kim, E.T.; Kim, S.B.; Lee, S.S. Enhancing Butyrate Production, Ruminal Fermentation and Microbial Population through Supplementation with Clostridium saccharobutylicum. J. Microbiol. Biotechnol. 2019, 7, 1083–1095. [Google Scholar] [CrossRef] [PubMed]
- Baldwin, R.L.; Li, R.W.; Jia, Y.; Li, C. Transcriptomic Impacts of Rumen Epithelium Induced by Butyrate Infusion in Dairy Cattle in Dry Period. Gene Regul. Syst. Biol. 2018, 12, 1177625018774798. [Google Scholar] [CrossRef] [Green Version]
- Nasrollahi, S.M.; Zali, A.; Ghorbani, G.R.; Shahrbabak, M.M.; Abadi, M.H. Variability in susceptibility to acidosis among high producing mid-lactation dairy cows is associated with rumen pH, fermentation, feed intake, sorting activity, and milk fat percentage. Anim. Feed Sci. Technol. 2017, 228, 72–82. [Google Scholar] [CrossRef]
- Andries, J.I.; Buysse, F.X.; De Brabander, D.L.; Cottyn, B.G. Isoacids in ruminant nutrition: Their role in ruminal and intermediary metabolism and possible influences on performances—A review. Anim. Feed Sci. Technol. 1987, 3, 169–180. [Google Scholar] [CrossRef]
- Patra, A.K.; Yu, Z. Essential oils affect populations of some rumen bacteria in vitro as revealed by microarray (RumenBactArray) analysis. Front. Microbiol. 2015, 6, 297. [Google Scholar] [CrossRef] [Green Version]
- Gibiino, G.; Lopetuso, L.R.; Scaldaferri, F.; Rizzatti, G.; Binda, C.; Gasbarrini, A. Exploring Bacteroidetes: Metabolic key points and immunological tricks of our gut commensals. Dig. Liver Dis. 2018, 7, 635–639. [Google Scholar] [CrossRef]
- Henderson, G.; Yilmaz, P.; Kumar, S.; Forster, R.J.; Kelly, W.J.; Leahy, S.C.; Guan, L.L.; Janssen, P.H. Improved taxonomic assignment of rumen bacterial 16S rRNA sequences using a revised SILVA taxonomic framework. PeerJ 2019, 7, e6496. [Google Scholar] [CrossRef]
- Wu, C.; Johnson, J.L.; Moore, W.E.; Moore, L.V. Emended Descriptions of Prevotella denticola, Prevotella loescheii, Prevotella veroralis, and Prevotella melaninogenica. Int. J. Syst. Evol. Microbiol. 1992, 4, 536–541. [Google Scholar] [CrossRef] [Green Version]
- Marounek, M.; Dušková, D. Metabolism of pectin in rumen bacteria Butyrivibrio fibrisolvens and Prevotella ruminicola. Lett. Appl. Microbiol. 1999, 6, 429–433. [Google Scholar] [CrossRef]
- Wallace, R.J.; Mckain, N.; Broderick, G.A.; Rode, L.M.; Walker, N.D.; Newbold, C.J.; Kopecny, J. Peptidases of the rumen bacterium, Prevotella ruminicola. Anaerobe 1997, 1, 35–42. [Google Scholar] [CrossRef] [PubMed]
- Deramus, H.A.; Clement, T.C.; Giampola, D.D.; Dickison, P.C. Methane Emissions of Beef Cattle on Forages. J. Environ. Qual. 2003, 1, 269–277. [Google Scholar]
- Poudel, P.; Froehlich, K.; Casper, D.P.; St-Pierre, B. Feeding Essential Oils to Neonatal Holstein Dairy Calves Results in Increased Ruminal Prevotellaceae Abundance and Propionate Concentrations. Microorganisms 2019, 5, 120. [Google Scholar] [CrossRef] [PubMed] [Green Version]
- Pitta, D.W.; Pinchak, E.; Dowd, S.E.; Osterstock, J.; Gontcharova, V.; Youn, E.; Dorton, K.; Yoon, I.; Min, B.R.; Fulford, J.D.; et al. Rumen bacterial diversity dynamics associated with changing from bermudagrass hay to grazed winter wheat diets. Microb. Ecol. 2010, 3, 511–522. [Google Scholar] [CrossRef]
- Ramos, A.F.; Terry, S.A.; Holman, D.B.; Breves, G.; Pereira, L.G.; Silva, A.G.; Chaves, A.V. Tucumã Oil Shifted Ruminal Fermentation, Reducing Methane Production and Altering the Microbiome but Decreased Substrate Digestibility Within a RUSITEC Fed a Mixed Hay—Concentrate Diet. Front. Microbiol. 2018, 9, 1647. [Google Scholar] [CrossRef]
- van Gylswyk, N.O. Succiniclasticum ruminis gen. nov., sp. nov., a ruminal bacterium converting succinate to propionate as the sole energy-yielding mechanism. Int. J. Syst. Bacteriol. 1995, 2, 297–300. [Google Scholar] [CrossRef] [Green Version]
- Whitford, M.F.; McPherson, M.A.; Forster, R.J.; Teather, R.M. Identification of bacteriocin-like inhibitors from rumen Streptococcus spp. and isolation and characterization of bovicin 255. Appl. Environ. Microbiol. 2001, 2, 569–574. [Google Scholar] [CrossRef] [Green Version]
- Mrazek, J.; Tepsic, K.; Avgustin, G.; Kopecný, J. Diet-dependent shifts in ruminal butyrate-producing bacteria. Folia Microbiol. 2006, 4, 294–298. [Google Scholar] [CrossRef]
- Kumar, S.; Pitta, D.W. Revolution in rumen microbiology. In Rumen Microbiology: From Evolution to Revolution, 1st ed.; Puniya, A.K., Singh, R., Kamra, D.N., Eds.; Springer: New Delhi, India, 2015; pp. 357–379. ISBN 978-81-322-2401-3. [Google Scholar]
- Cancino-Padilla, N.; Romero, J.; Huws, S.; Vargas, E. Effect of dietary olive oil and palm oil on rumen bacterial composition in dairy cows. Access Microbiol. 2019, 1, 888. [Google Scholar]
- Huws, S.A.; Kim, E.J.; Cameron, S.J.; Girdwood, S.E.; Davies, L.; Tweed, J.; Vallin, H.; Scollan, N.D. Characterization of the rumen lipidome and microbiome of steers fed a diet supplemented with flax and echium oil. Microb. Biotechnol. 2015, 2, 331–341. [Google Scholar] [CrossRef] [Green Version]
- Patra, A.K.; Yu, Z. Effects of essential oils on methane production and fermentation by, and abundance and diversity of, rumen microbial populations. Appl. Environ. Microbiol. 2012, 12, 4271–4280. [Google Scholar] [CrossRef] [PubMed] [Green Version]
- Benchaar, C.; Greathead, H. Essential oils and opportunities to mitigate enteric methane emissions from ruminants. Anim. Feed Sci. Technol. 2011, 166, 338–355. [Google Scholar] [CrossRef]
- Lee, J.H.; Kumar, S.; Lee, G.H.; Chang, D.H.; Rhee, M.S.; Yoon, M.H.; Kim, B.C. Methanobrevibacter boviskoreani sp. nov., isolated from the rumen of Korean native cattle. Int. J. Syst. Evol. Microbiol. 2013, 11, 4196–4201. [Google Scholar] [CrossRef] [PubMed] [Green Version]
- Leahy, S.C.; Kelly, W.J.; Altermann, E.; Ronimus, R.S.; Yeoman, C.J.; Pacheco, D.M.; Li, D.; Kong, Z.; McTavish, S.; Sang, C.; et al. The genome sequence of the rumen methanogen Methanobrevibacter ruminantium reveals new possibilities for controlling ruminant methane emissions. PLoS ONE 2010, 1, e8926. [Google Scholar] [CrossRef] [Green Version]
- Ye, D.; Karnati, S.K.R.; Wagner, B.; Firkins, J.L.; Eastridge, M.L.; Aldrich, J.M. Essential oil and monensin affect ruminal fermentation and the protozoal population in continuous culture. J. Dairy Sci. 2018, 6, 5069–5081. [Google Scholar] [CrossRef] [Green Version]
- Cedrola, F.; Dias, R.J.P.; Martinele, I.; D’Agosto, M. Description of Diploplastron dehorityi sp. nov. (Entodiniomorphida, Ophryoscolecidae), a new rumen ciliate from Brazilian sheep. Zootaxa 2017, 6, 581–585. [Google Scholar] [CrossRef]
- Czauderna, M.; Wereszka, K.; Michalowski, T. The utilization and digestion of cellulose by the rumen ciliate Diploplastron affine. Eur. J. Protistol. 2019, 68, 17–24. [Google Scholar] [CrossRef]
- Wang, B.; Ma, M.P.; Diao, Q.Y.; Tu, Y. Saponin-Induced Shifts in the Rumen Microbiome and Metabolome of Young Cattle. Front. Microbiol. 2019, 10, 356. [Google Scholar] [CrossRef] [Green Version]
- Krumholz, L.R.; Bryant, M.P.; Brulla, W.J.; Vicini, J.L.; Clark, J.H.; Stahl, D.A. Proposal of Quinella ovalis gen. nov., sp. nov., based on phylogenetic analysis. Int. J. Syst. Evol. Microbiol. 1993, 2, 293–296. [Google Scholar] [CrossRef] [Green Version]
- Li, L.; Qu, M.; Liu, C.; Xu, L.; Pan, K.; OuYang, K.; Song, X.; Li, Y.; Liang, H.; Chen, Z.; et al. Effects of recombinant swollenin on the enzymatic hydrolysis, rumen fermentation, and rumen microbiota during in vitro incubation of agricultural straws. Int. J. Biol. Macromol. 2019, 122, 348–358. [Google Scholar] [CrossRef]
- Oh, S.; Shintani, R.; Koike, S.; Kobayashi, Y. Ginkgo fruit extract as an additive to modify rumen microbiota and fermentation and to mitigate methane production. J. Dairy Sci. 2017, 3, 1923–1934. [Google Scholar] [CrossRef] [PubMed]
- Lan, W.; Yang, C. Ruminal methane production: Associated microorganisms and the potential of applying hydrogen-utilizing bacteria for mitigation. Sci. Total Environ. 2019, 654, 1270–1283. [Google Scholar] [CrossRef] [PubMed]
- Yang, C.; McKain, N.; Mccartney, C.A.; Wallace, R.J. Consequences of inhibiting methanogenesis on the biohydrogenation of fatty acids in bovine ruminal digesta. Anim. Feed Sci. Technol. 2019, 254, 114189. [Google Scholar] [CrossRef]


| Names | Primers (Forward and Reverse) Sequence [5′→3′] | Annealing | Reference |
|---|---|---|---|
| Bacteria | 338F (ACTCCTACGGGAGGCAGCA) | 55 °C | [26] |
| 806R (GGACTACHVGGGTWTCTAAT) | |||
| Archaea | Ar915Af (AGGAATTGGCGGGGGAGCAC) | 59 °C | [27] |
| Ar1386R (GCGGTGTGTGCAAGGAGC) | |||
| Protozoa | RP841F (GAC TAG GGATTG GAG TGG) | 55 °C | [27] |
| Reg1302R (AAT TGC AAAGAT CTA TCCC) |
| Parameters | CON | LC | MC | HC | SEM | p-Value |
|---|---|---|---|---|---|---|
| pH | 6.13 c | 6.19 bc | 6.23 ab | 6.26 a | 0.01 | 0.010 |
| TGP (ml) | 50.36 a | 49.22 a | 43.68 ab | 11.15 b | 3.72 | 0.006 |
| CH4 (g/kg fermented DM) | 53.93 a | 53.25 a | 45.56 ab | 11.83 b | 4.05 | 0.008 |
| CH4 (g/kg fermented OM) | 56.97 a | 54.62 ab | 46.62 bc | 12.33 c | 4.20 | 0.006 |
| IVDMD (%) | 46.31 a | 45.01 a | 43.73 a | 32.81 b | 1.48 | 0.020 |
| IVOMD (%) | 50.63 a | 50.68 a | 49.73 a | 36.34 b | 1.81 | 0.024 |
| NH3-N (mg/100 mL) | 14.81 a | 14.05 a | 12.57 ab | 9.04 b | 0.59 | 0.011 |
| Total VFA (mmol/L) | 83.80 ab | 93.45 a | 87.91 ab | 64.25 b | 3.03 | 0.015 |
| Acetate (mmol/L) | 34.29 ab | 42.36 a | 39.24 ab | 30.40 b | 1.47 | 0.032 |
| Propionate (mmol/L) | 17.09 ab | 19.88 a | 17.67 ab | 11.49 b | 0.79 | 0.010 |
| Isobutyrate (mmol/L) | 7.62 a | 6.00 ab | 5.83 b | 5.07 b | 0.24 | 0.008 |
| Butyrate (mmol/L) | 12.48 ab | 13.42 a | 14.40 a | 8.32 b | 0.66 | 0.012 |
| Isovalerate (mmol/L) | 5.30 | 5.73 | 5.28 | 4.30 | 0.21 | 0.080 |
| Valerate (mmol/L) | 7.02 a | 6.06 ab | 5.49 bc | 4.68 c | 0.20 | 0.006 |
| A/P Ratio | 1.98 b | 2.13 b | 2.23 ab | 2.65 a | 0.06 | 0.011 |
© 2020 by the authors. Licensee MDPI, Basel, Switzerland. This article is an open access article distributed under the terms and conditions of the Creative Commons Attribution (CC BY) license (http://creativecommons.org/licenses/by/4.0/).
Share and Cite
Yu, J.; Cai, L.; Zhang, J.; Yang, A.; Wang, Y.; Zhang, L.; Guan, L.L.; Qi, D. Effects of Thymol Supplementation on Goat Rumen Fermentation and Rumen Microbiota In Vitro. Microorganisms 2020, 8, 1160. https://doi.org/10.3390/microorganisms8081160
Yu J, Cai L, Zhang J, Yang A, Wang Y, Zhang L, Guan LL, Qi D. Effects of Thymol Supplementation on Goat Rumen Fermentation and Rumen Microbiota In Vitro. Microorganisms. 2020; 8(8):1160. https://doi.org/10.3390/microorganisms8081160
Chicago/Turabian StyleYu, Jiangkun, Liyuan Cai, Jiacai Zhang, Ao Yang, Yanan Wang, Lei Zhang, Le Luo Guan, and Desheng Qi. 2020. "Effects of Thymol Supplementation on Goat Rumen Fermentation and Rumen Microbiota In Vitro" Microorganisms 8, no. 8: 1160. https://doi.org/10.3390/microorganisms8081160