Article

Determination of the Total Polyphenols Content and Antioxidant Activity of Echinacea Purpurea Extracts Using Newly Manufactured Glassy Carbon Electrodes Modified with Carbon Nanotubes

1
Department of Pharmacy, Faculty of Medicine and Pharmacy, University of Oradea, 29 N. Jiga St., 410028 Oradea, Romania
2
Chitkara College of Pharmacy, Chitkara University, Punjab 140401, India
3
Faculty of the Physical Culture, Palacký University Olomouc, 77111 Olomouc, Czech Republic
4
Department of Analytical Chemistry, Faculty of Applied Chemistry and Materials Science University Politehnica of Bucharest,1-7 Polizu St., 011061 Bucharest, Romania
5
Department of Preclinical Disciplines, Faculty of Medicine and Pharmacy, University of Oradea, 410073 Oradea, Romania
*
Authors to whom correspondence should be addressed.
Processes 2020, 8(7), 833; https://doi.org/10.3390/pr8070833
Submission received: 17 June 2020 / Revised: 7 July 2020 / Accepted: 8 July 2020 / Published: 13 July 2020

Abstract

:
A sensitive electrochemical method was used for the determination of the total phenolic content and antioxidant activity of Echinacea purpurea extracts. In this study, 3 glassy carbon electrodes (GCE) were used: one unmodified and the other two newly manufactured glassy carbon electrodes modified with carbon nanotubes (CNTs) and chitosan (CS) in different concentrations, having the following composition: 1 mg/mL CNTs/CS 5%/GCE and 20 mg/mL CNTs/CS 0.5%/GCE. The determinations were performed on 3 different pharmaceutical forms (capsules, tablets and tincture), which contain E. pururea extract from the root or aerial part of the plant. Standard chicoric and caftaric polyphenolic acids, as well as food supplements extracts, were characterized using voltammetry, in a Britton-Robinson (B-R) electrolyte buffer. The modified 1 mg/mL CNTs/CS 5%/GCE electrode has superior properties compared to the other two (the unmodified and 20 mg/mL CNTs/CS 0.5%/GCE-modified) electrodes used in the study. Echinacea tincture had the highest antioxidant capacity and the biggest total amount of polyphenols (28.72 mg/equivalent of 500 mg powder). Echinacea capsules had the lowest antioxidant capacity, but also the lowest total amount of polyphenols (19.50 mg/500 mg powder); similarly, tablets had approximately the same values of polyphenols content (19.80 mg/500 mg powder), and also antioxidant capacity. The total polyphenol content was consistent with the one indicated by the manufacturers. Pulse-differential cyclic voltammetry represents a rapid, simple and sensitive technique to establish the entire polyphenolic amount and the antioxidant activity of the E. purpurea extracts.

Graphical Abstract

1. Introduction

Echinacea purpurea (L.) Moench, which is included in the Asteraceae (Compositae) family, is acknowledged to be one of the most significant medicinal plants worldwide. The extracts obtained from different parts of Echinacea purpurea were traditionally used in North America as remedies for wounds and different types of infections, and came to be extremely well-known herbal remedies [1]. Dietary supplements and extracts of this plant present antiviral, antibacterial, antifungal and antioxidant action, different parts of many plants being used from antiquity [2] to treat viral and inflammatory illnesses [1,3]. Many studies have revealed that Echinacea extracts promote the secretion of cytokines like interleukins (Il-1, Il-6, Il-8, Il-12), tumour necrosis factor alfa (TNF-α) and nitric oxide (NO), and an increased activation of macrophages [4,5,6]. The most significant potential active substances found in E. purpurea are represented by polyphenols—derivatives of caffeic acid, as follows: chicoric acid, chlorogenic acid, caftaric acid, echinacoside and cynarin [7,8].
All species of Echinacea that were studied presented radical scavenging action, the most efficient being E. purpurea [8]. The principal component of Echinacea root—chicoric acid (Figure 1A)—is considered a significant antioxidant in the plant, being a suitable marker for the quality of products containing this plant, due to its powerful immunostimulatory, antioxidant and antiviral characteristics and due to its degradation susceptibility [9,10]. Another important phenolic component in E. purpurea is caftaric acid (Figure 1B), which inhibits the oxidation of low-density lipoprotein (LDL) cholesterol isolated from human plasma and removes 2,2-diphenyl-1-picrylhydrazyl (DPPH) free radicals in a cell-free assay [11].
Various researchers have focused on studying the antioxidant activity and polyphenolic composition of Echinacea extracts using different methods, such as High-Performance Liquid Chromatography (HPLC) and Ultra-High Performance Liquid Chromatography (UPLC) techniques [12,13,14], colorimetric methods—chemical 2,2-diphenyl-1-picrylhydrazyl (DPPH) and 2,2’-Azino-bis(3-ethyl-benzothiazoline-6-sulfonic acid) (ABTS)—radical scavenging techniques [3,8,10]. In general, chemical methods need various preparation stages and extended duration to finish the measurement. Nevertheless, prolonged steps and complexness in some of the methods above makes them inappropriate for precise determination. Therefore, rapid and simple techniques have become a significant requirement. Lately, it has been noted that electrochemical methods may be established to determine the polyphenolic composition [15,16,17,18]. Electrochemical methods that are used for the determination are simple and sensitive. Furthermore, voltammetric methods show very good functioning in terms of enhanced sensitivity, reduced overpotential and decreased detection limit [19,20]. Square Wave Voltammetry was used to determination of the antioxidant activity in Echinacea purpurea roots [21].
At present, carbon nanotubes (CNTs) are extensively used as modifiers due to their physicochemical attributes, distinctive structure and compatibility with biological molecules. CNTs are considered an essential category of nanomaterials. Because of their specific properties—mechanical, chemical and electrical—they have been seen as analytical tools, being considered as rolled up graphite sheets connected by Van der Waal’s bonds [22]. The reactivity of graphene sheet as compared to the nanotubes’ chemical reactivity improved as a direct outcome of the CNT surface curvature [23].
Recent studies showed that transforming electrodes by adding carbon CNTs makes the electrochemical processes that involve biomolecules easier and enhances the measured signal. The development of electrochemical sensors has attracted considerable attention as a low-cost method for the sensitive detection of a variety of pharmaceutical analytes. Since the discovery of CNTs in 1991 [24], research on them has grown rapidly. In recent years, CNTs have also been used as electrode-modified materials because they offer unique advantages, including enhanced electronic properties, a large edge plane/basal plane ratio, and electron transfer reactions [25]. Thus, CNTs-based sensors generally have higher sensitivities in a low concentration or in the complex matrix, lower limits of detection and faster electron transfer kinetics than traditional carbon electrodes.
Many factors need to be investigated in order to create an optimal CNTs-based sensor. Electrode performance can be influenced by the pretreatment of the nanotube, CNTs surface modification, the method of electrode attachment and the addition of electron mediators. With the further development of CNTs and nanotechnology, studies on preparation, properties and application of CNTs-based modified electrodes have still been a hot topic attracting lots of researchers around the world. This research focused on the application of CNTs-modified electrodes in different pharmaceutical analytes, which mainly includes the electrochemical studies on weak basic/acidic pharmaceuticals and other related small biological molecules. The physical and catalytic properties make CNTs ideal for use in sensors with extremely varied applications [26]. Most notably, CNTs display high electrical conductivity, chemical stability and mechanical strength [27]. A disadvantage of using CNTs can be considered the low wettability of their surface, which induces a weak surface bond [28]. This involves improving the mechanical properties of CNTs with chitosan (CS), a natural polysaccharide used in pharmaceutical [29] and medical applications [30,31], having the role of fixing CNTs to the glassy carbon electrode (GCE) surface and to functionalize the CNTs in order to increase their electroactive surface.
The aim of this study was to determine the total polyphenolic content and, secondary, the antioxidant capacity of commercial food supplements containing extracts of Echinacea purpurea, through differential pulse voltammetry, using both an unmodified glassy carbon electrode (GCE) and two modified with CNTs. The novelty of the paper consists precisely in the use of these glassy carbon electrodes modified with CNTs, newly manufactured by the authors, which, after being characterized by cyclic voltammetry, were observed to generate oxidation/reduction peaks, higher than other types of electrodes. The method of analysis with the modified electrode is original due to the fact that, to our knowledge, no voltammetric dosing of polyphenols has been performed using electrodes modified with CNTs and CS.

2. Materials and Methods

2.1. Reagents

In this research, standard chicoric and caftaric polyphenolic acids, as well as food supplement extracts, were characterized using voltammetry, in a Britton-Robinson (B-R) electrolyte buffer. The characteristics of the standard substances and reagents that were used are described in Table 1. Double-distilled water was used to prepare the solutions. The studied products are commercial and were purchased from pharmaceutical units, and they are presented in Table 2.

2.2. Solutions and Sample Preparation

The stock solutions of chicoric acid and caftaric acid, both 25 mmol/L, were prepared in a volumetric mixture of ethanol/water (1:1), and B-R buffer was used for the range of pH 2 to 10, with the buffer consisting of a mixture of 3 acids, as follows: H3PO4, H3BO3 and CH3COOH, all of them at a concentration of 0.04 mol/L. pH adjustment was done with 0.01 mol/L NaOH.
Extraction of caffeic acid derivatives from the pharmaceutical forms was performed by dissolving/diluting a quantity/volume of powder/solution in a mixture of 20 mL acetone: water = 60:40, under continuous stirring, for 30 min, after which the mixture was centrifuged for 15 min at 5000 rpm. The acetone:water extract was dried in a rotary evaporator at 30 °C, then dissolved in a mixture of methanol:water = 1:1 [21]. The solution obtained is diluted with B-R buffer, obtaining solutions of different concentrations for which the voltammograms are recorded.
Stock solutions were stored at −5 °C, protected from light. When using the solutions, they are protected by wrapping the voltammetric cell with aluminum foil. Stock solutions can be stored for up to 5 weeks.
All measurements were performed in triplicate.

2.3. Apparatus

Voltammetric measurements were performed with an Autolab PGSTAT 128N electrochemical device (Utrecht, Kingdom of the Netherlands), using Nova 2.1.2 software, in a 20 mL electrochemical cell, equipped with 3 electrodes: reference electrode Ag/AgCl, auxiliary platinum (Pt) electrode wire and working glass carbon electrode (GCE, 3 mm diameter, Metrohm-Autolab, Switzerland). All of the measurements were performed at room temperature (25 ± 2 °C). The voltammetric peak intensities were measured using the baseline corresponding to each peak. The pH of the B-R buffer solution was adjusted with 0.01 M NaOH solution, using the Brinkmann Metrohm 632 pH-meter (Metrohm AG, Herisau, Switzerland) equipped with a combined pH electrode. Spectrophotometric determinations were performed using T70 ultraviolet-visible (UV-VIS) spectrometer with sequential automatic scanning (PG Instruments Ltd., Leicestershire, United Kingdom), controlled by UVWIN software.

2.4. Preparation of CNTs in CS

For the modification of the GCE, a solution of CS 5% in 2% acetic acid solution was prepared. CNTs were dispersed in this solution so as to obtain a solution of concentration 1 mg CNTs/mL, in an ultrasonication bath SONOREX SUPER (Bandelin-Electronic GmbH & Co. KG, Berlin, Germany), at a temperature of 25 ± 2 °C, for 30 min (1 mg/mL CNTs/CS 5%/GCE). Another suspension prepared for electrode modification contained 20 mg CNTs/mL 0.5% CS solution in 2% acetic acid solution (20 mg/mL CNTs/CS 0.5%/GCE) [32,33]. CS has the role of fixing the strong electroactive material of CNTs to the surface of the glassy carbon electrode.

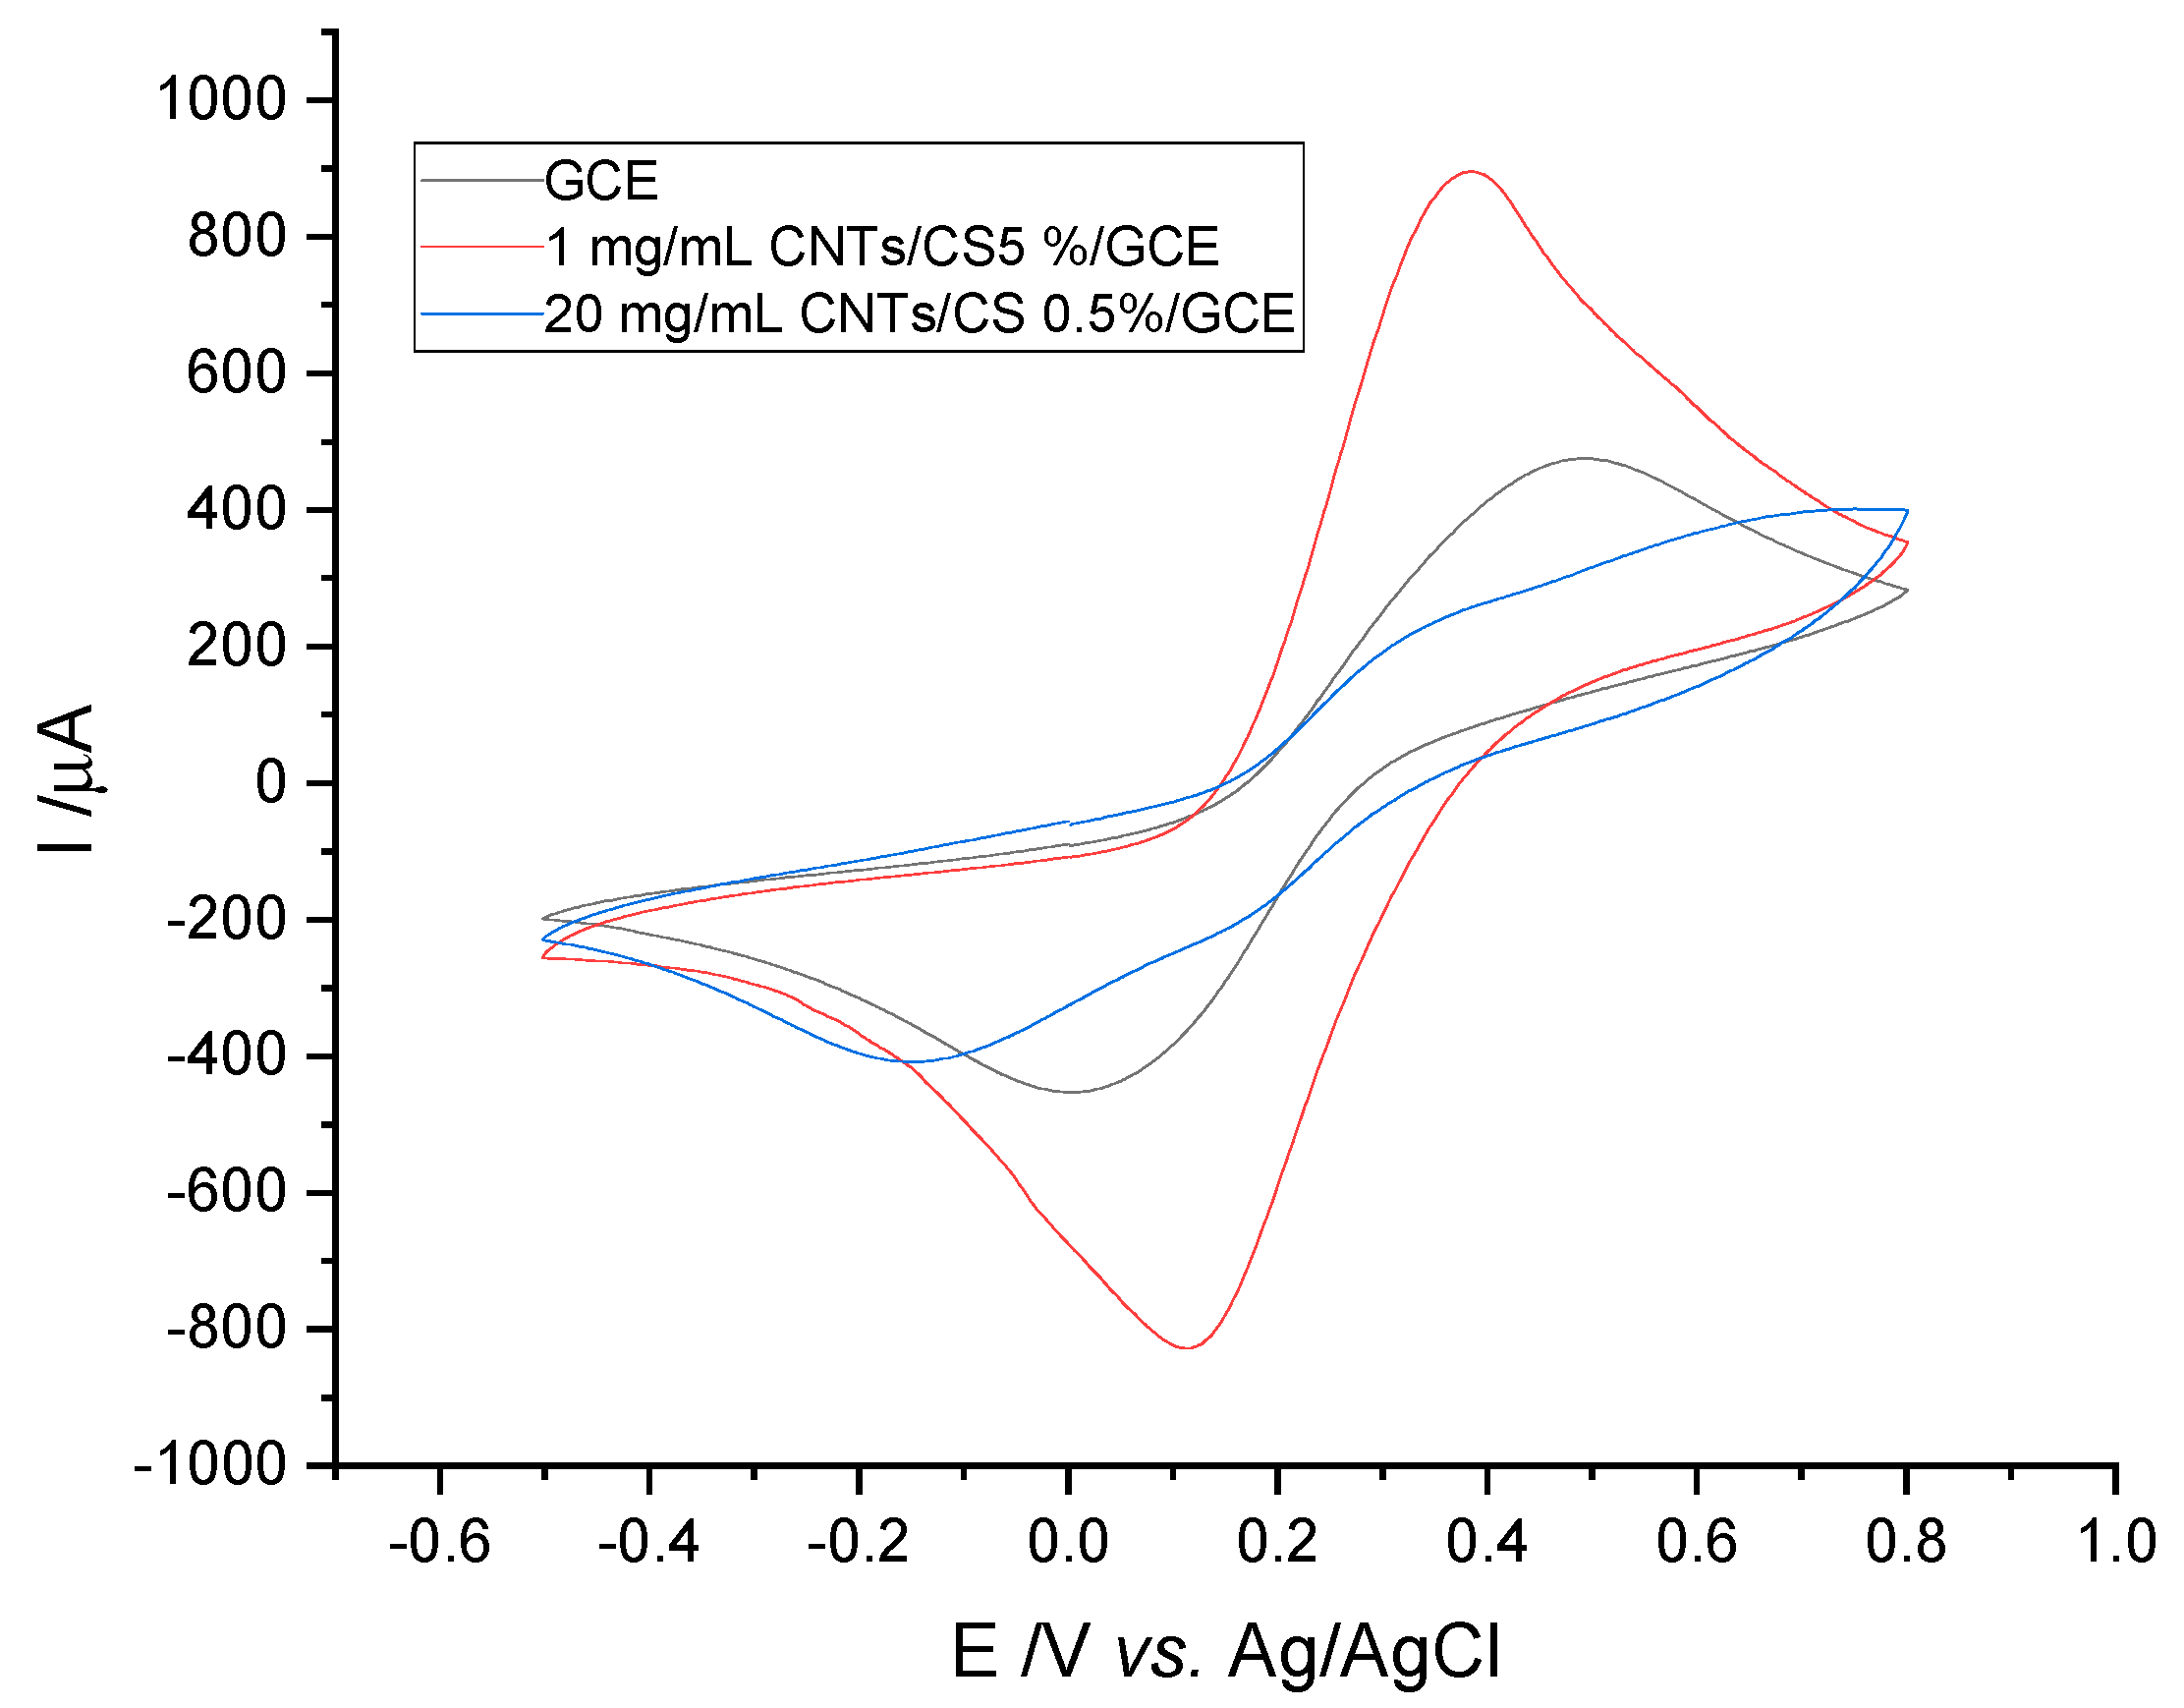
2.5. Preparation of Modified GCE

Two types of methods (physical and chemical) were used to clean the electrode for every work phase. The physical treatment consisted of polishing the electrode manually, using alumina power (Ø = 0.3 micron), for one minute, then rinsing it using deionized water. The chemical treatment consisted of sonicating the electrode in 6 M HCl solution for three minutes and rinsing it using deionized water, followed by sonication in ethanol for three minutes, then rinsing with deionized water. The modification of the glass carbon electrode was performed by depositing 5 µL suspension of CNTs in CS, followed by air drying.

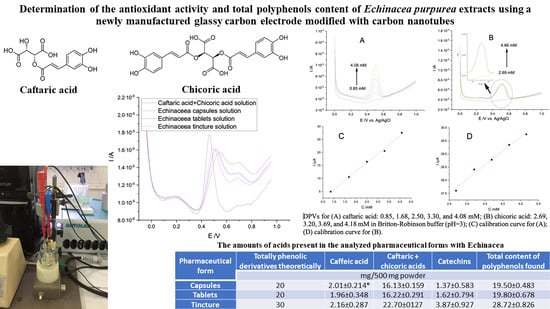
2.6. Determination of the Total Polyphenol Content

2.6.1. Differential Pulse Voltammetry

To calculate the amount of caffeic acid and catechins in pharmaceutical forms, the following steps were taken: knowing the current intensity for the mixture of standard solution of caffeic and chicoric acids, the current intensities for caffeic acid (approximately 0.203 ± 0.007 V), mixture of caffeic acid + chicoric (approximately 0.520 ± 0.024 V) and catechins (approximately 0.690 ± 0.005 V) were combined, and a proportionality calculation determined the respective compounds. These calculations were performed due to the fact that in Echinacea extracts, there are polyphenols that could be attributed to caffeic acid and catechins.

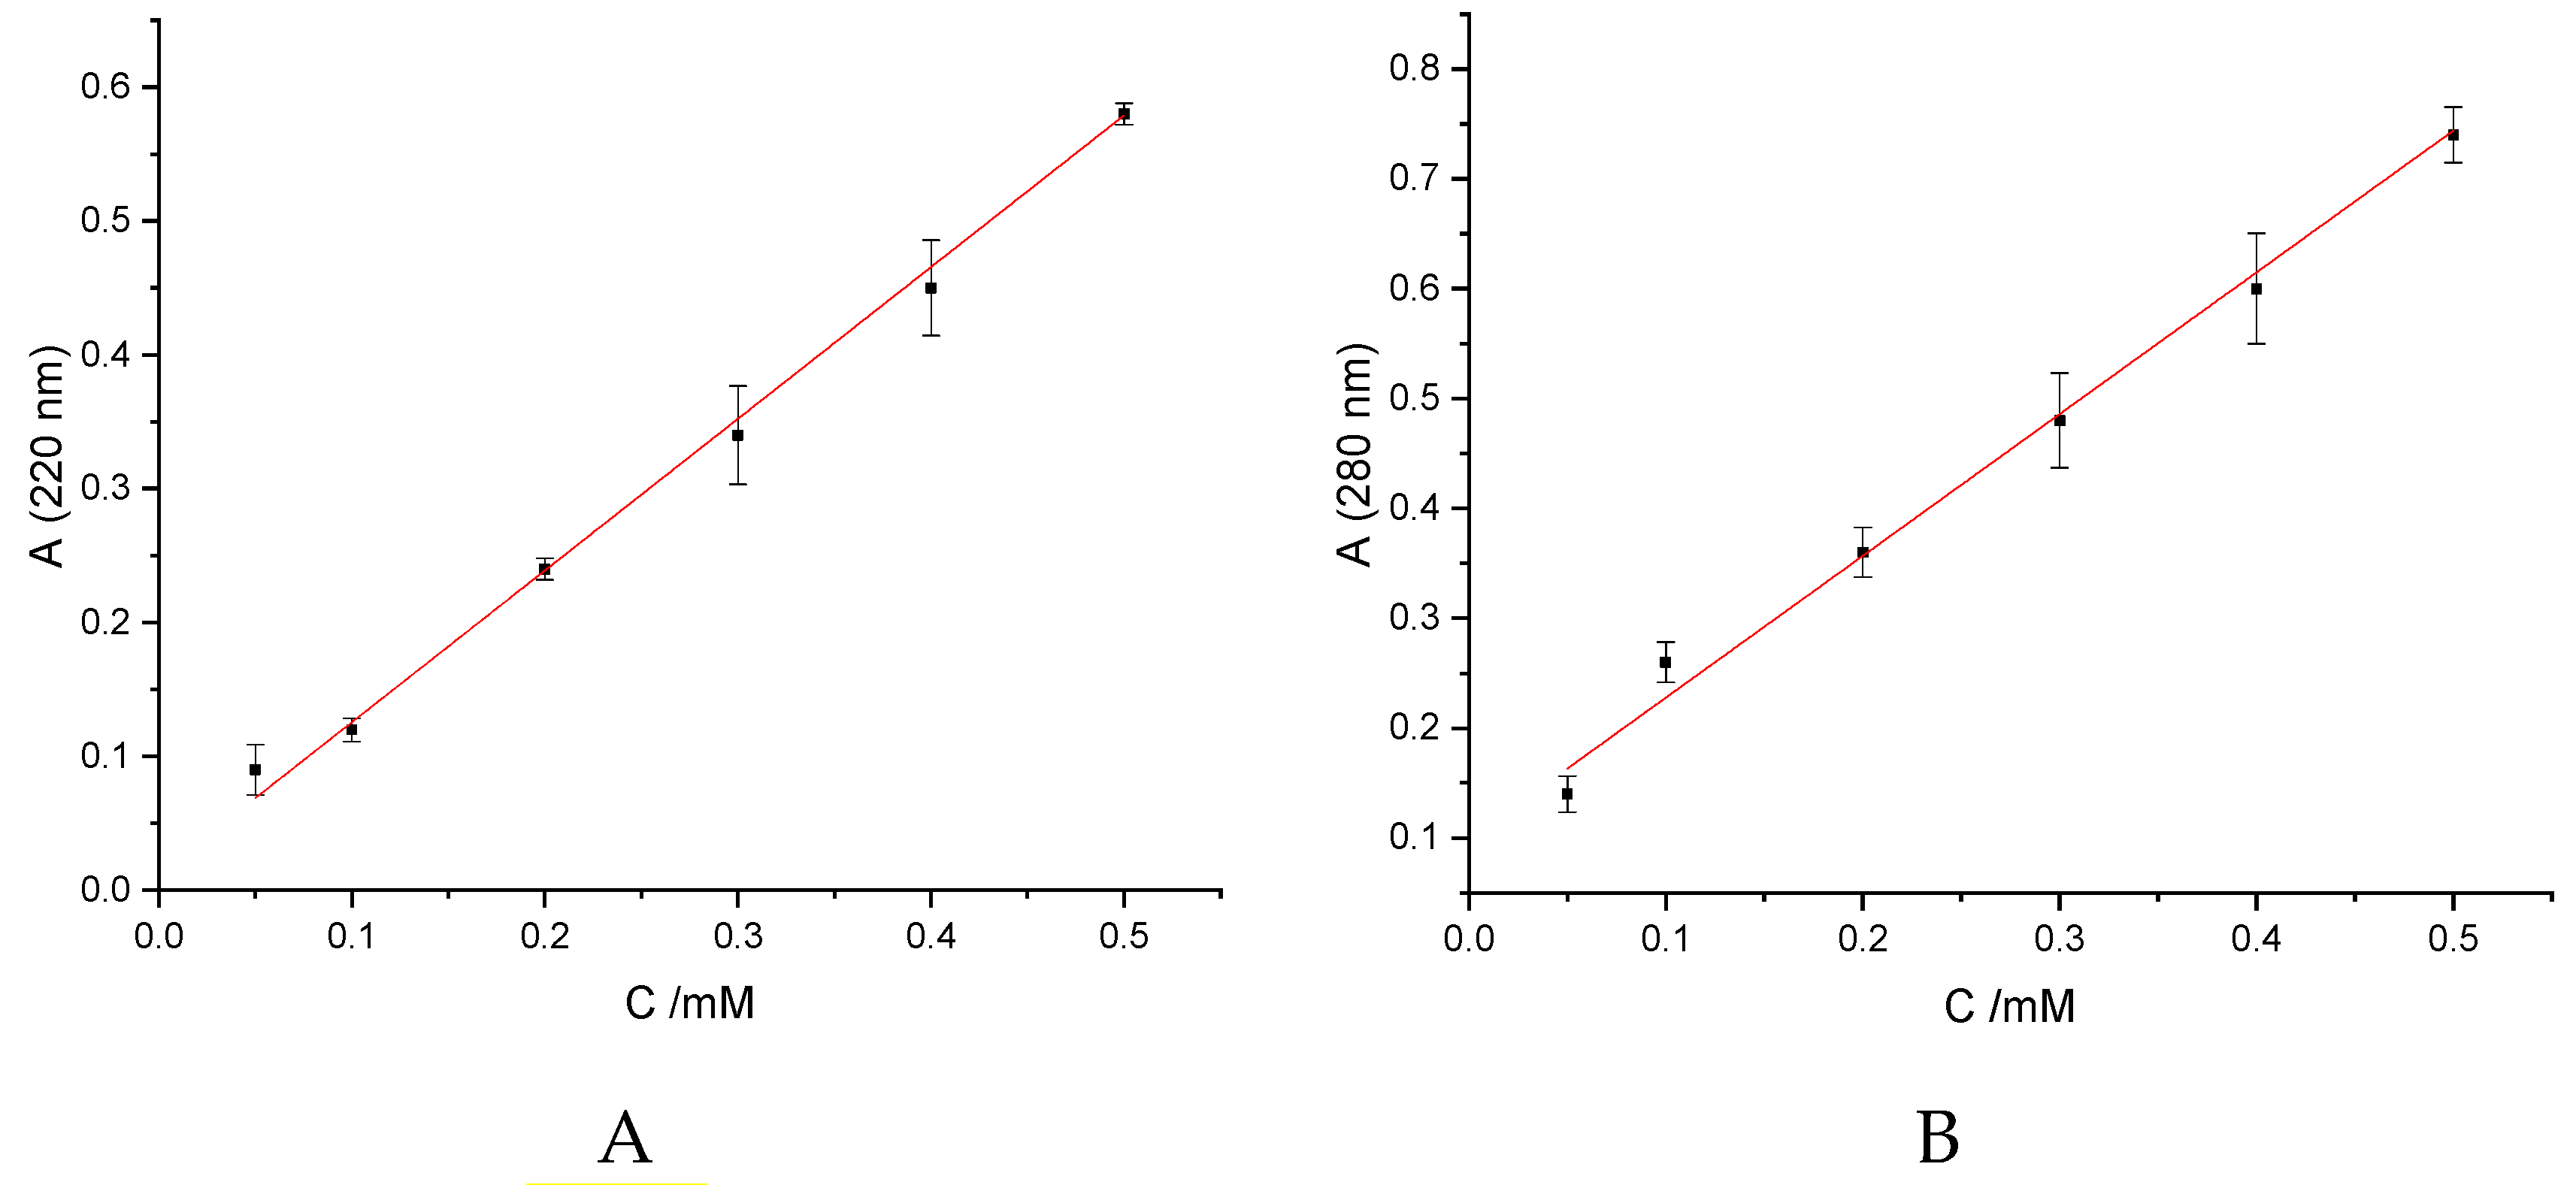
2.6.2. Spectrophotometry

The total content of polyphenolic compounds in Echinacea purpurea extracts was colorimetrically determined, using Folin-Ciocalteu reagent and gallic acid (GA) [34]. The selection of GA as a standard was based on its availability to be stable in the pure substance state. Folin-Ciocalteu reagent is used for colorimetric analysis of phenolic and polyphenolic antioxidants. Basically, a sample of 0.2 mL of Echinacea purpurea extract was added to a test tube and mixed with 2 mL of Folin-Ciocalteu reagent; after 5 min of reaction, 1.8 mL of sodium carbonate (7.5%) was added. The absorbance was measured at 750 nm, using the UV-VIS spectrophotometer. The curve was established for analysis using GA. The polyphenolic content was determined using the standard GA calibration curve and expressed in mg of GA equivalents (GAE).

2.7. Antioxidant Activity Determination

2.7.1. Cyclic Voltammetry

To draw a calibration line, a 10−2 M ascorbic acid (AA) solution was prepared and was used to record the differential pulse voltammograms for 7 AA solutions (with concentrations between 0.25 and 4.59 mM) in B-R buffer. Similarly, a 10−2 M GA solution was prepared for tracing a calibration line that was used to record differential pulse voltammograms for 10 GA solutions (with concentrations between 0.25 and 6.55 mM) in B-R buffer.

2.7.2. DPPH Method

The antioxidant activity of the standardized Echinacea purpurea extract was measured with a stable free radical 1,1-diphenyl-2-picrilhydrazyl (DPPH) according to the Briefly method [35]. The method involves reducing the DPPH staining (from purple to yellow) in the presence of a phenolic antioxidant (FeOH), in methanolic solution, according to the reactions:
DPPH· + FeOH → DPPH-H + FeO·
DPPH-H + FeO·→ Degradation/oxidation products
The DPPH method is based on the reaction with electron donors or hydrogen radicals (H·) producing antioxidant compounds. It was found that the ability to capture free radicals from extracts increases with increasing concentrations of antioxidants. The reduction in DPPH is directly proportional to the amount of antioxidant present in the reaction mixture.
Each analyzed extract (0.20 mL of the previously prepared solutions) was mixed with 2.80 mL 0.1 mM of freshly prepared solution of DPPH radical in methanol. The mixture was kept in the dark for 15 min at 37 °C, after which its absorbance was read at 517 nm in 1 cm quartz cuvettes, compared to a solution of DPPH radical in methanol. Antioxidant activity was expressed as mM equivalents of AA per g dry weight (DW), using the calibration curve constructed with 0.05, 0.1, 0.2, 0.3, 0.4 and 0.5 mM AA dissolved in methanol and with the same concentrations of GA (0.05, 0.1, 0.2, 0.3, 0.4 and 0.5 mM) also dissolved in methanol.

3. Results

3.1. Electrochemical Characterization of Electrodes by Cyclic Voltammetry

In order to characterize the modified electrode, cyclic voltammetry was used for a redox probe, consisting of 2 electroactive species K3[Fe(CN)6]/K4[Fe(CN)6], in the form of a 10 mM solution in B-R buffer. Scanning voltammetry was performed in the range −0.500 to 0.800 V in anodic direction, returning to the initial point in the cathodic direction with a scanning speed of 0.1 V/s (Figure 2).
An intensity of the oxidation peak for 1 mg/mL CNTs/CS 5%/GCE-modified electrode can be observed at 803 µA, for GCE, at 349 µA, and for 20 mg/mL CNTs/CS 0.5%/GCE electrode, at 114 µA. This indicates a clearly superior electroactive surface of 1 mg/mL CNTs/CS 5%/GCE-modified electrode compared to the other two electrodes. It is a fact also confirmed by the calculation of the electroactive surface with the Randels–Sevcik Equation (Equation (1)) [36], for all three electrodes investigated in the cyclic voltammograms recorded in the redox probe K3[Fe(CN)6]/K4[Fe(CN)6] 10 mM, in B-R buffer, as follows:
Ip = 2.69 × 10⁵ × n3/2 AD1/2ν1/2C
where Ip is current intensity (A), n is number of electrons transferred (usually 1), A is the electroactive surface of the electrode (cm2), D is the diffusion coefficient (cm2/s), C is concentration (mol/mL) and ν is scan speed (V/s).
For the anodic peak, the largest electroactive surface is at the electrode 1 mg/mL CNTs/CS 5%/GCE (0.342 cm2) and the smallest at the electrode 20 mg/mL CNTs/GCE (0.048 cm2), increasing by 7.125 times. In these calculations, the unmodified GCE is intermediate (0.149 cm2) in terms of signal. Regarding the cathodic peak, the signal difference is no longer very different due to the higher cathodic peak of the electrode 20 mg/mL CNTs/CS 0.5%/GCE. In the following, the best performing electrode 1 mg/mL CNTs/CS 5%/GCE will be denoted as CNTs/CS/GCE.

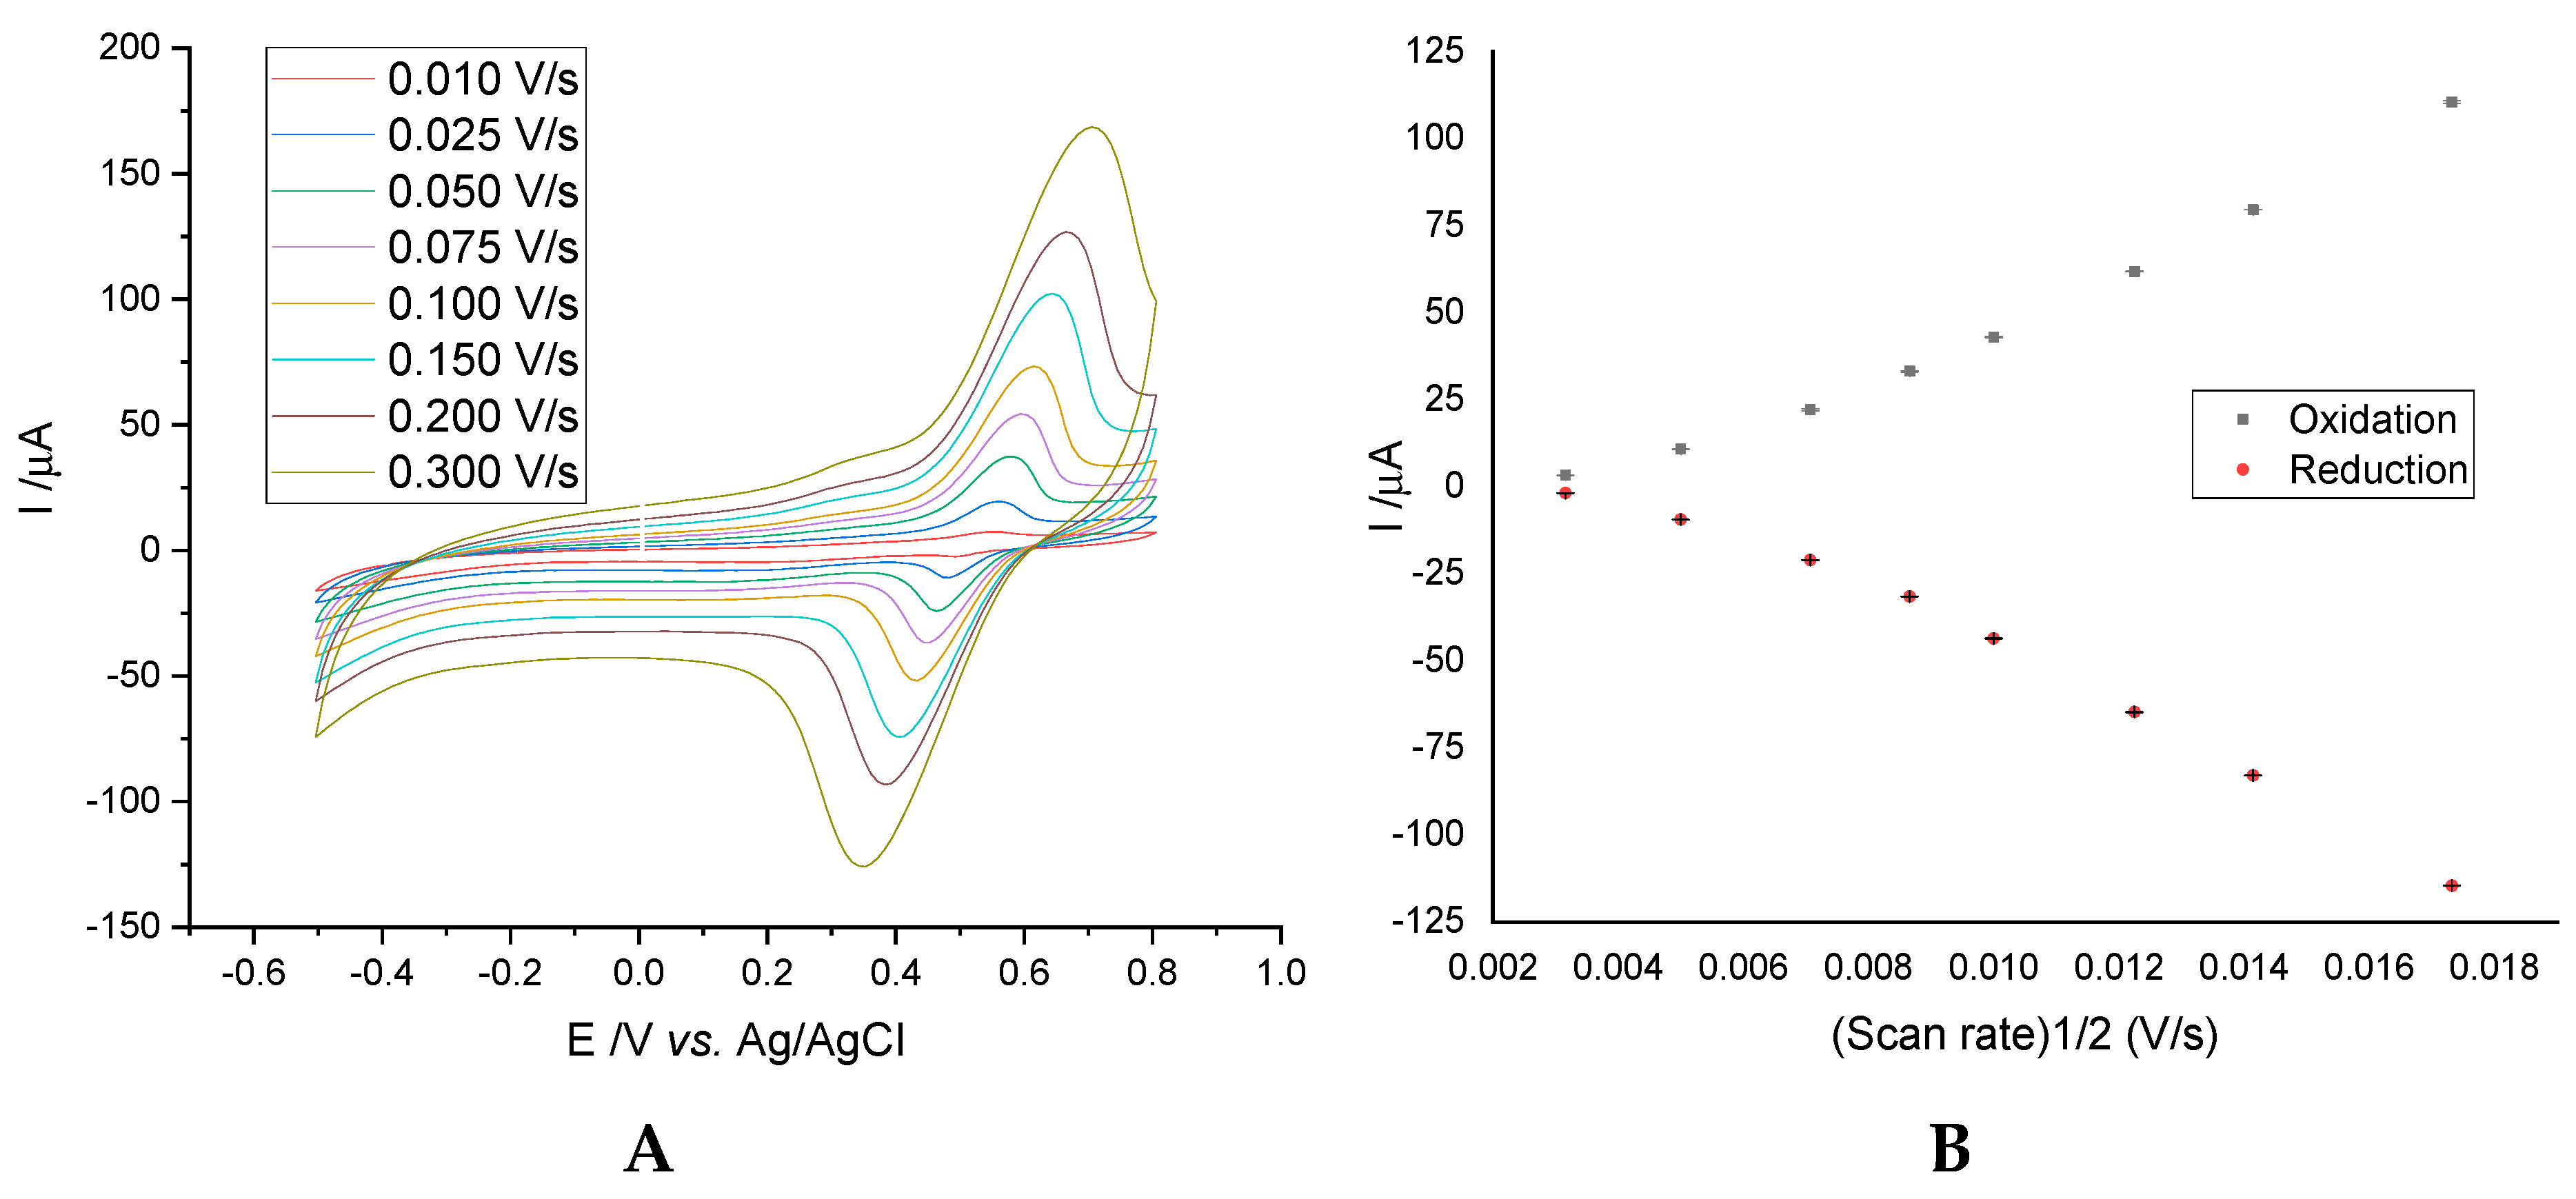
3.1.1. Influence of Scanning Speed on the Intensity of the Anodic/Cathodic Peak

Cyclic voltammograms were recorded in the range −0.500 to 0.800 V for a 10 mM chicoric acid solution, at different scanning speeds (0.010, 0.025, 0.050, 0.075, 0.100, 0.150, 0.200 and 0.300 V/s), in solution of B-R buffer (Figure 3A). As the scanning speed intensifies, voltammograms describe a sharp increase in oxidation peaks, and the potential of these peaks shifts to higher values. Also, the maximum potentials moved to increased (0.610 ± 0.060 V) and decreased (0.435 ± 0.055 V) values for the oxidation and reduction processes. The intensities of oxidation and reduction currents also vary in direct proportion with the square root of the scanning speed (Figure 3B). This is demonstrated by linear regression equations:
Ipa(µA) = −28.52645 + 0.0076 × v1/2 (V/s)
Ipc(µA) = 32.45163 − 0.0081 × v1/2 (V/s)
with a correlation coefficient of 0.98191 and 0.98067, which indicates that the electrochemical reaction is a controlled diffusion process that occurs in all solutions and is due to unequal local concentrations of reagents.
At a slow scanning speed, the diffusion layer will develop at a greater distance from the electroactive surface of the sensor compared to a rapid scanning of the potential. Electron flux at the electrode is lower at slow scanning speeds versus faster scanning speeds.

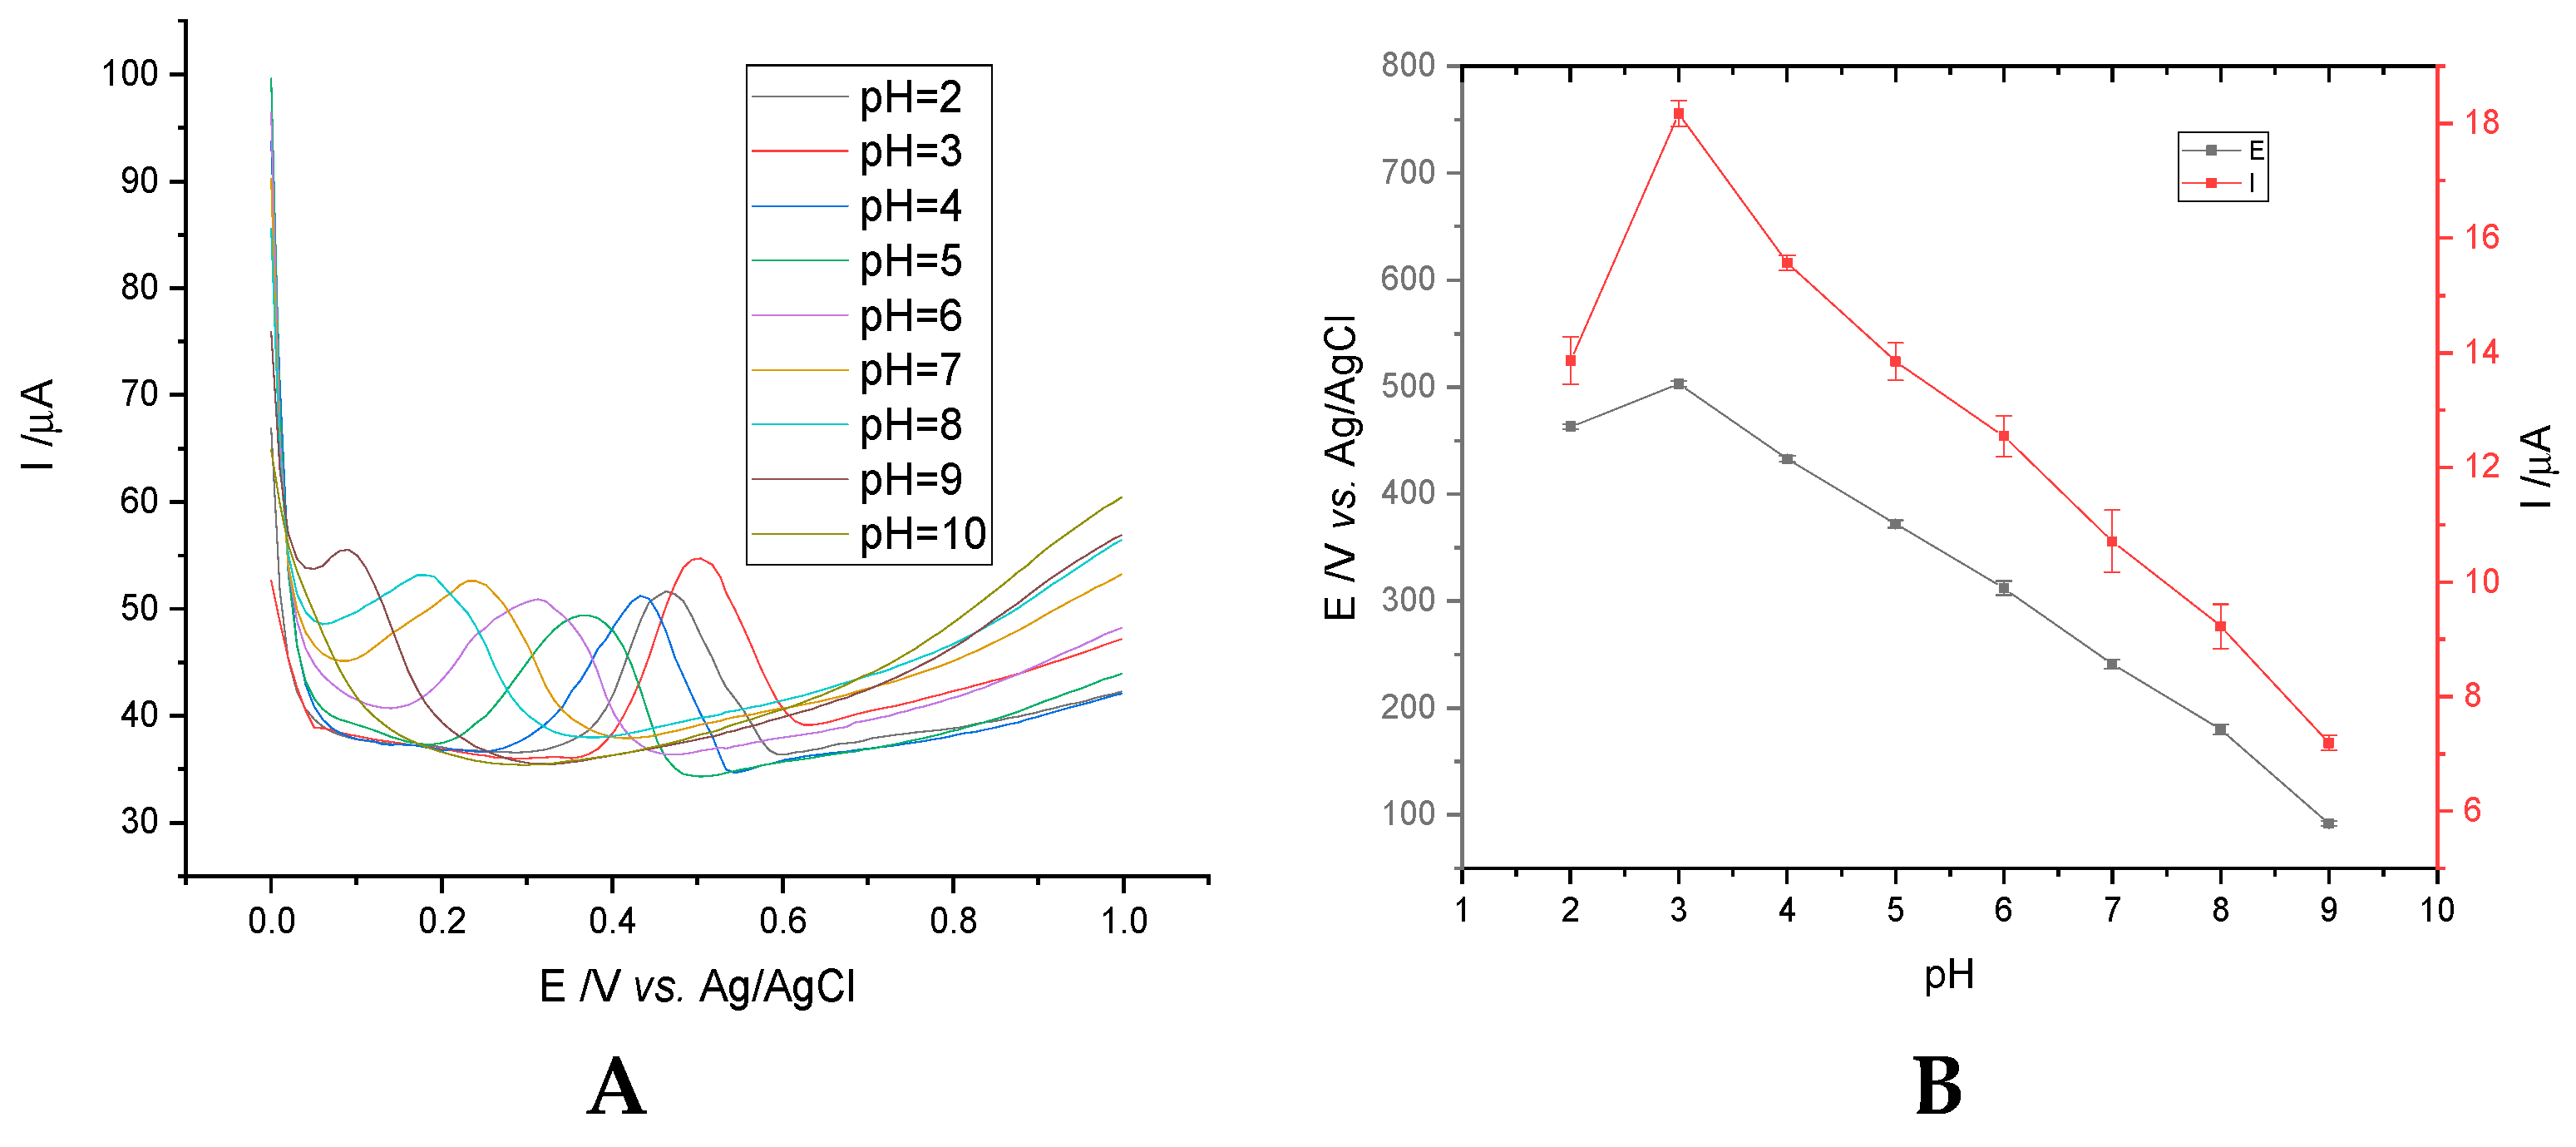
3.1.2. Optimization of the pH Value

The solution with 10 mM concentration of chicoric acid in B-R buffer, at different pH values, was tested. Differential pulse voltammograms recorded in the range 0 to 1.0 V are shown in Figure 4A. A high current intensity is observed for a solution with pH = 3 intensity that decreases with increasing pH of the B-R buffer. Moreover, the shift of the oxidation peak to lower potential values can be observed simultaneously with the increase of the pH values of the B-R solution (except the pH = 2 B-R solution) (Figure 4B).

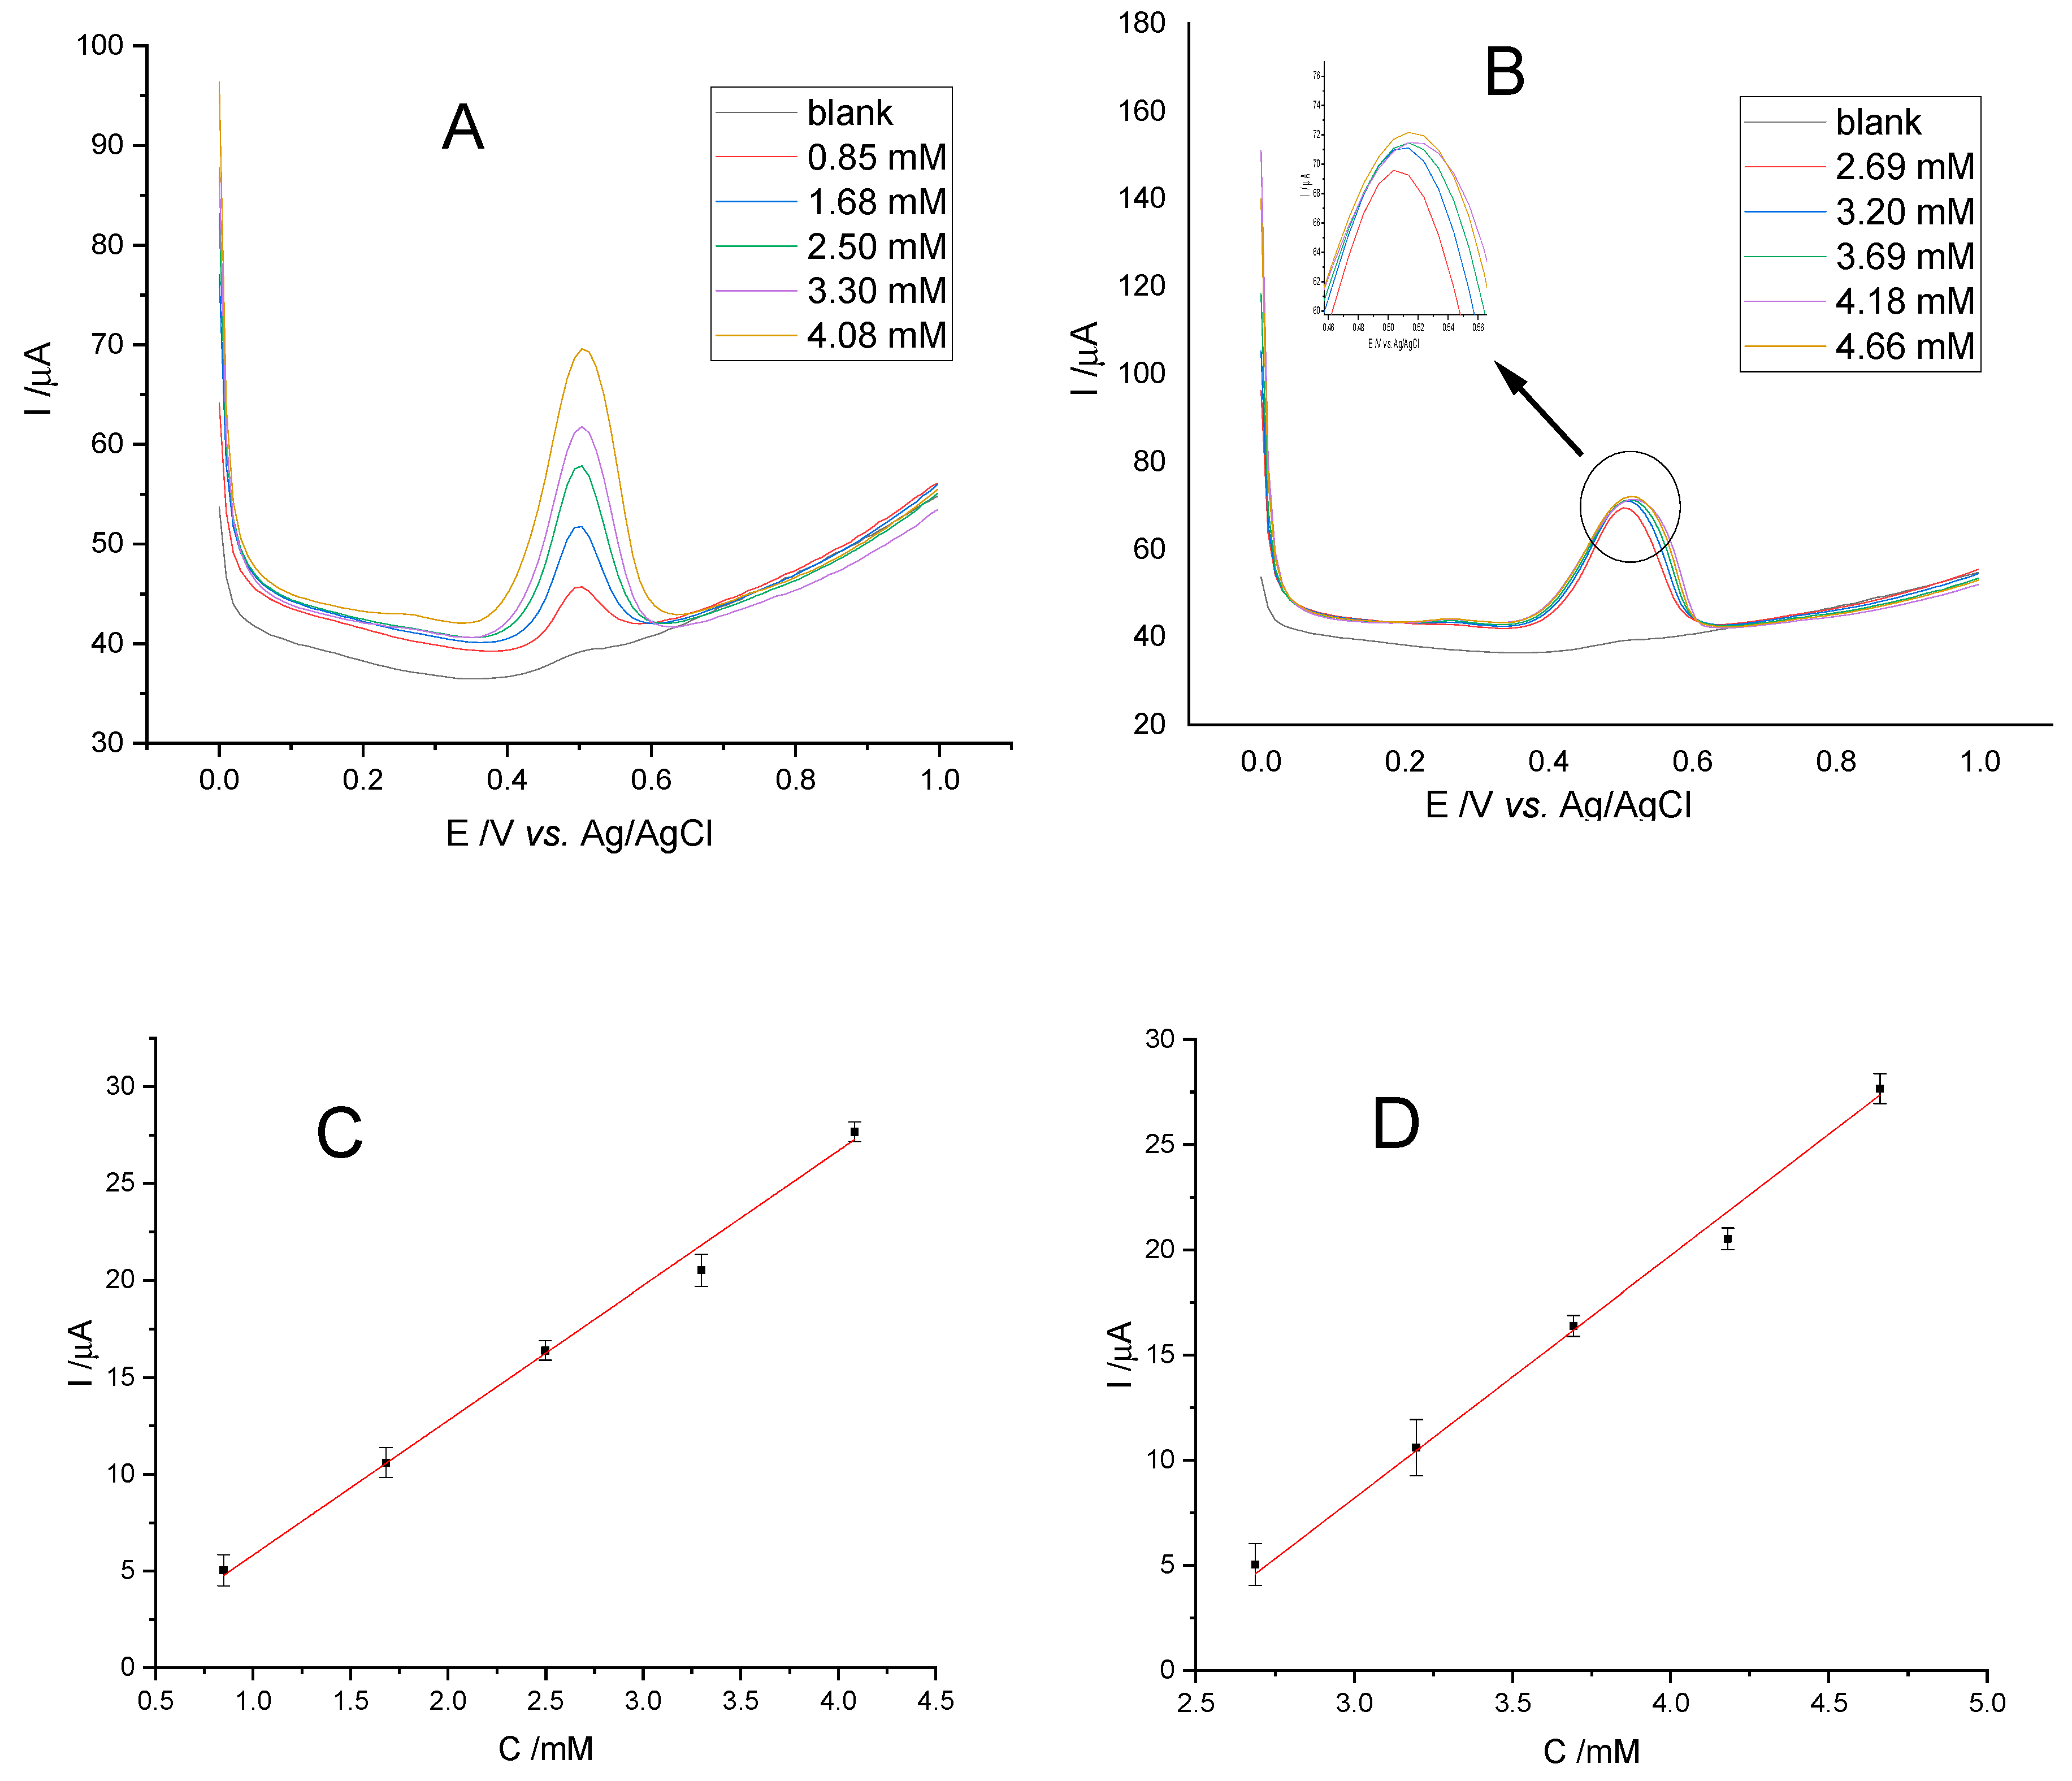
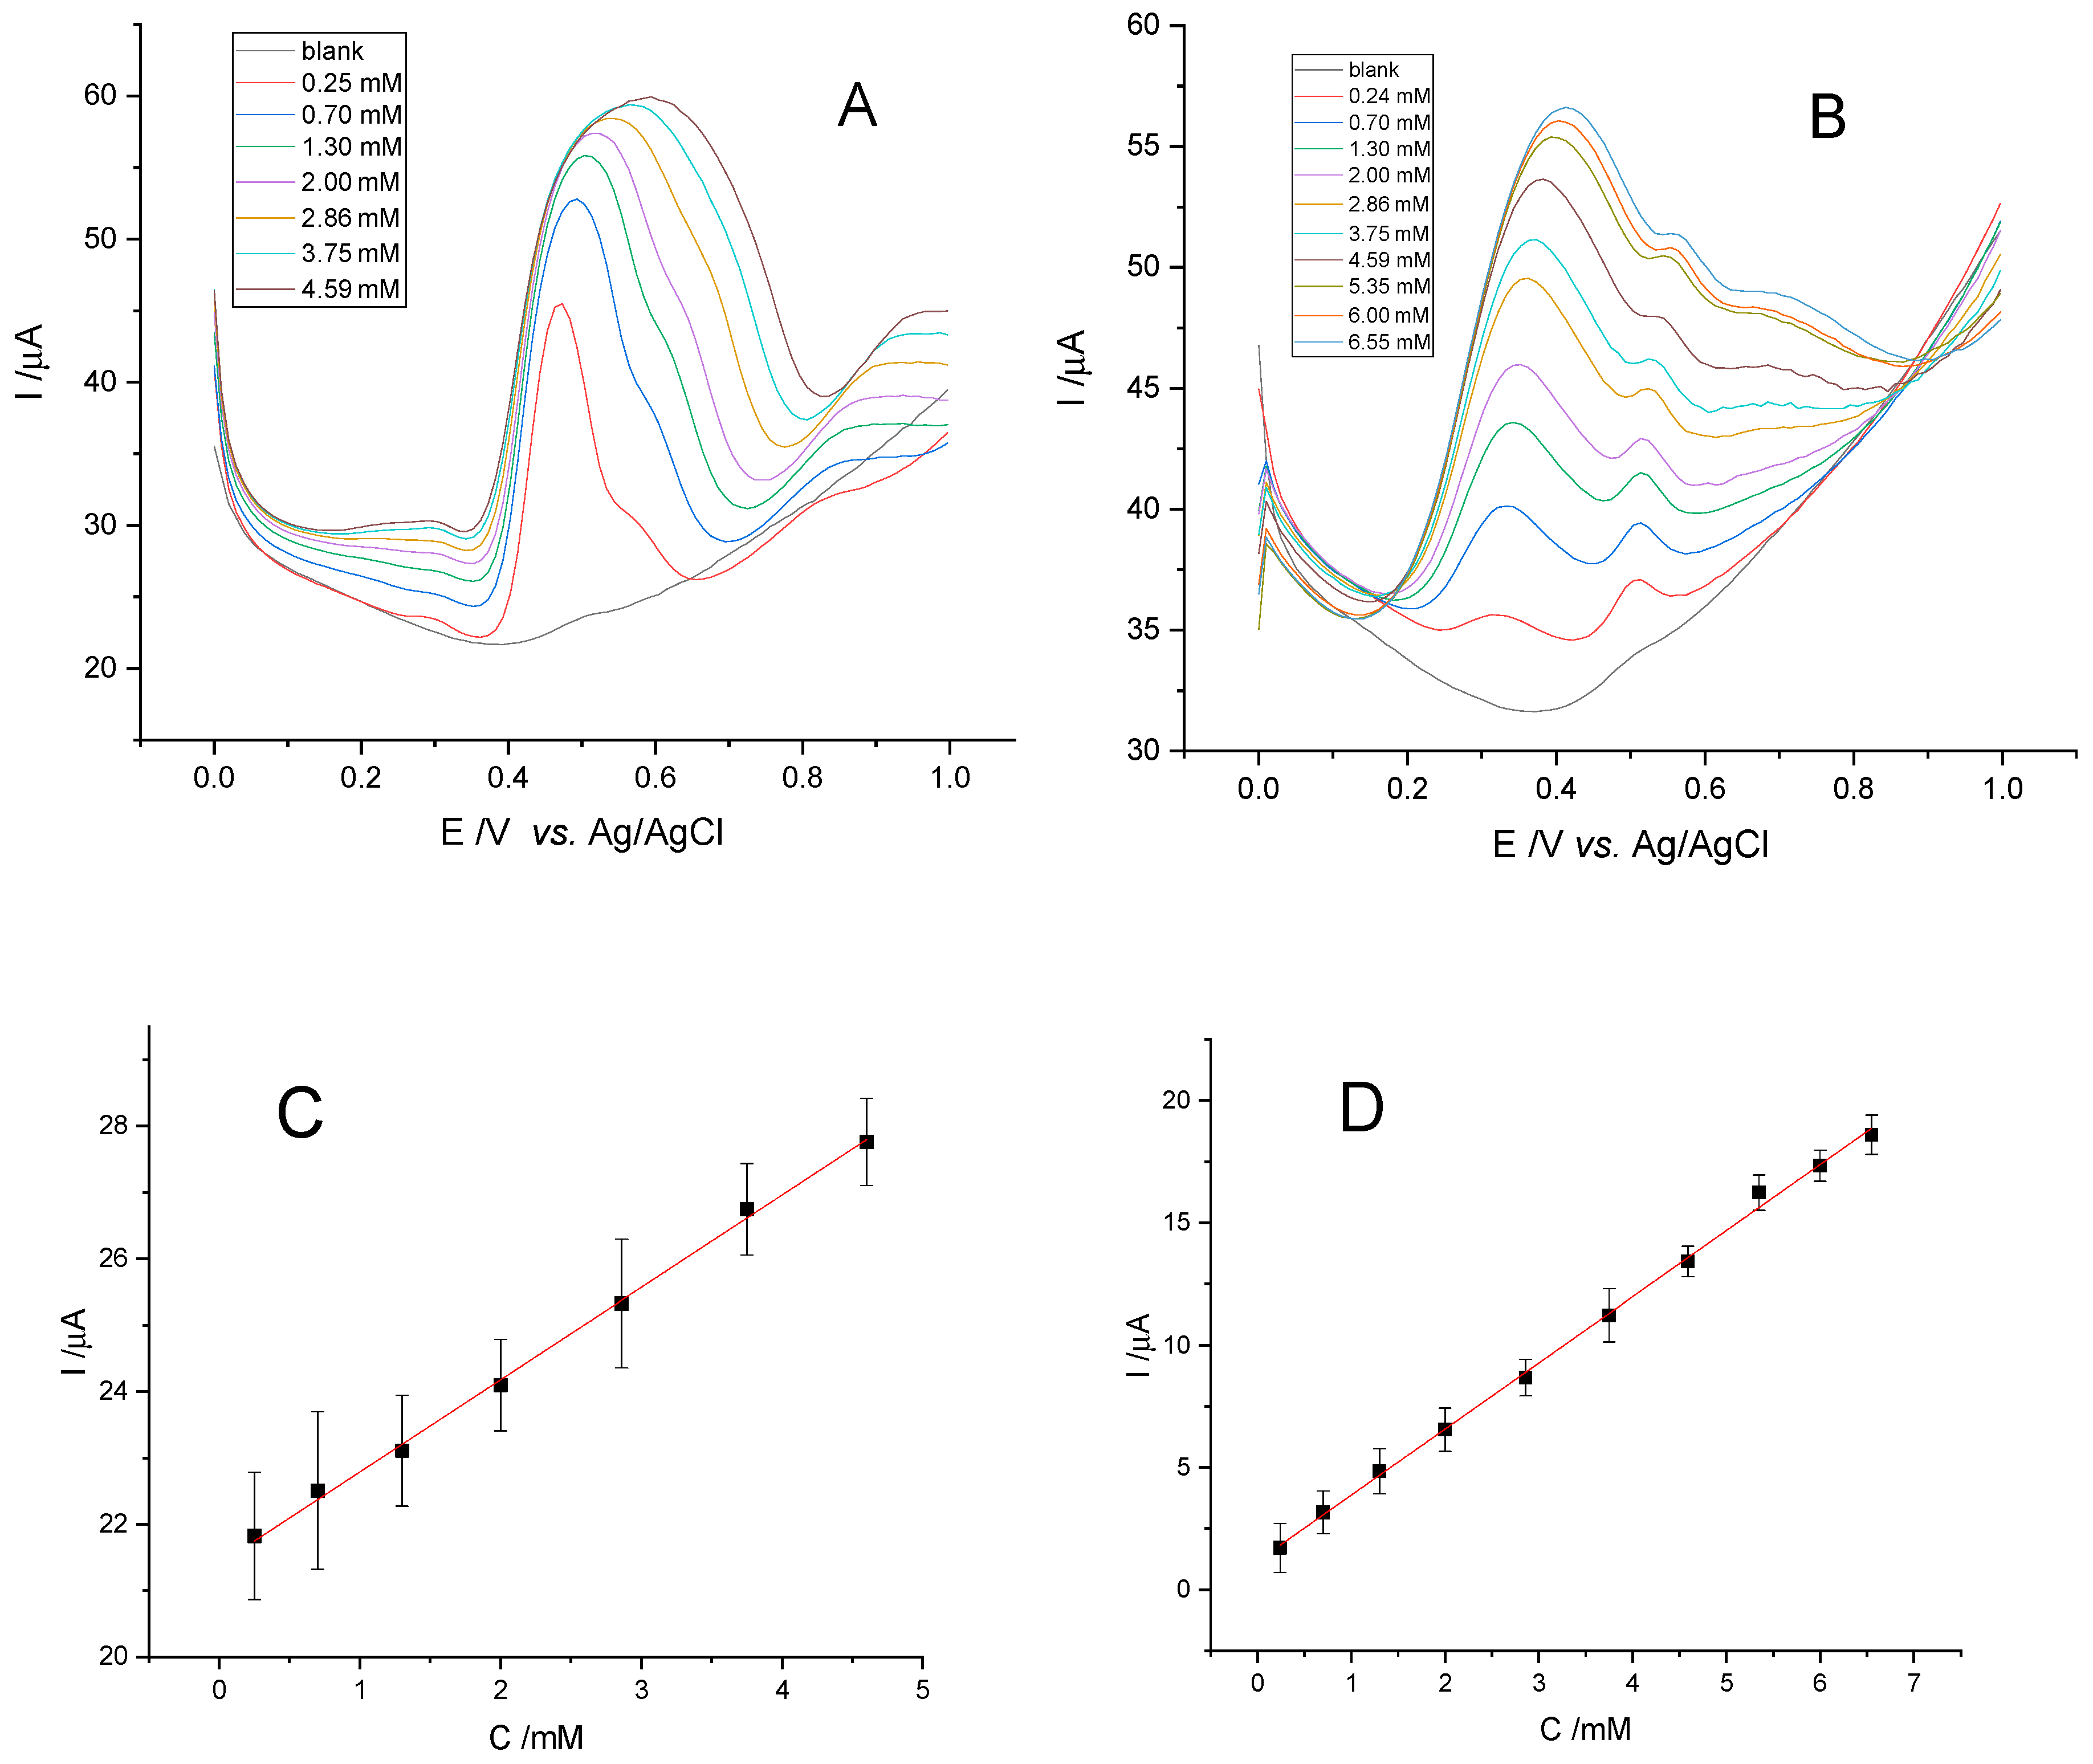
3.1.3. Calibration Iines

The calibration lines were determined by differential pulse voltammetry in the range 0.0 to 1.0 V. Stock solutions of caftaric and chicoric acids were prepared, both with a concentration of 25 mM, in a mixture of ethanol:water (1:1). Aliquots of acids were successively added over 10 mL of B-R electrolyte solution. The measurements were recorded with the same system of three electrodes: Ag/AgCl electrode (reference electrode), platinum wire electrode (counter electrode) and CNTs/CS/GCE (working electrode). Differential pulse voltammograms are shown in Figure 5A,B. The calibration diagrams resulted in arranging the peak amplitude against the standard solutions concentration. The peak current amplitude against concentration dependence was registered in the concentration interval of the analyte (Figure 5C,D).
The two calibration lines are expressed through the following equations:
I(µA) = −0.96521 + 6.8482 °C (mM)
I(µA) = 24.85987 + 1.0636 °C (mM)
having values of R = 0.99500 and R = 0.98484, respectively. The amplitude of the peak current was considered as the interval between the baseline and the maximum value of the current.
In Figure 5A,B, the oxidation peak of caftaric acid occurs at 0.505 ± 0.002 V, and that of chicoric acid at 0.515 ± 0.001 V.
The amplitude of the peak current was considered as the interval between the baseline and the maximum value of the current. Limits of detection (LOD) were calculated using the 3σ/S ratio, (σ—standard deviation of the response, S—slope of the calibration curve) and limits of quantification (LOQ) were specified using the 10σ/S ratio, and their values are summarized in Table 3.

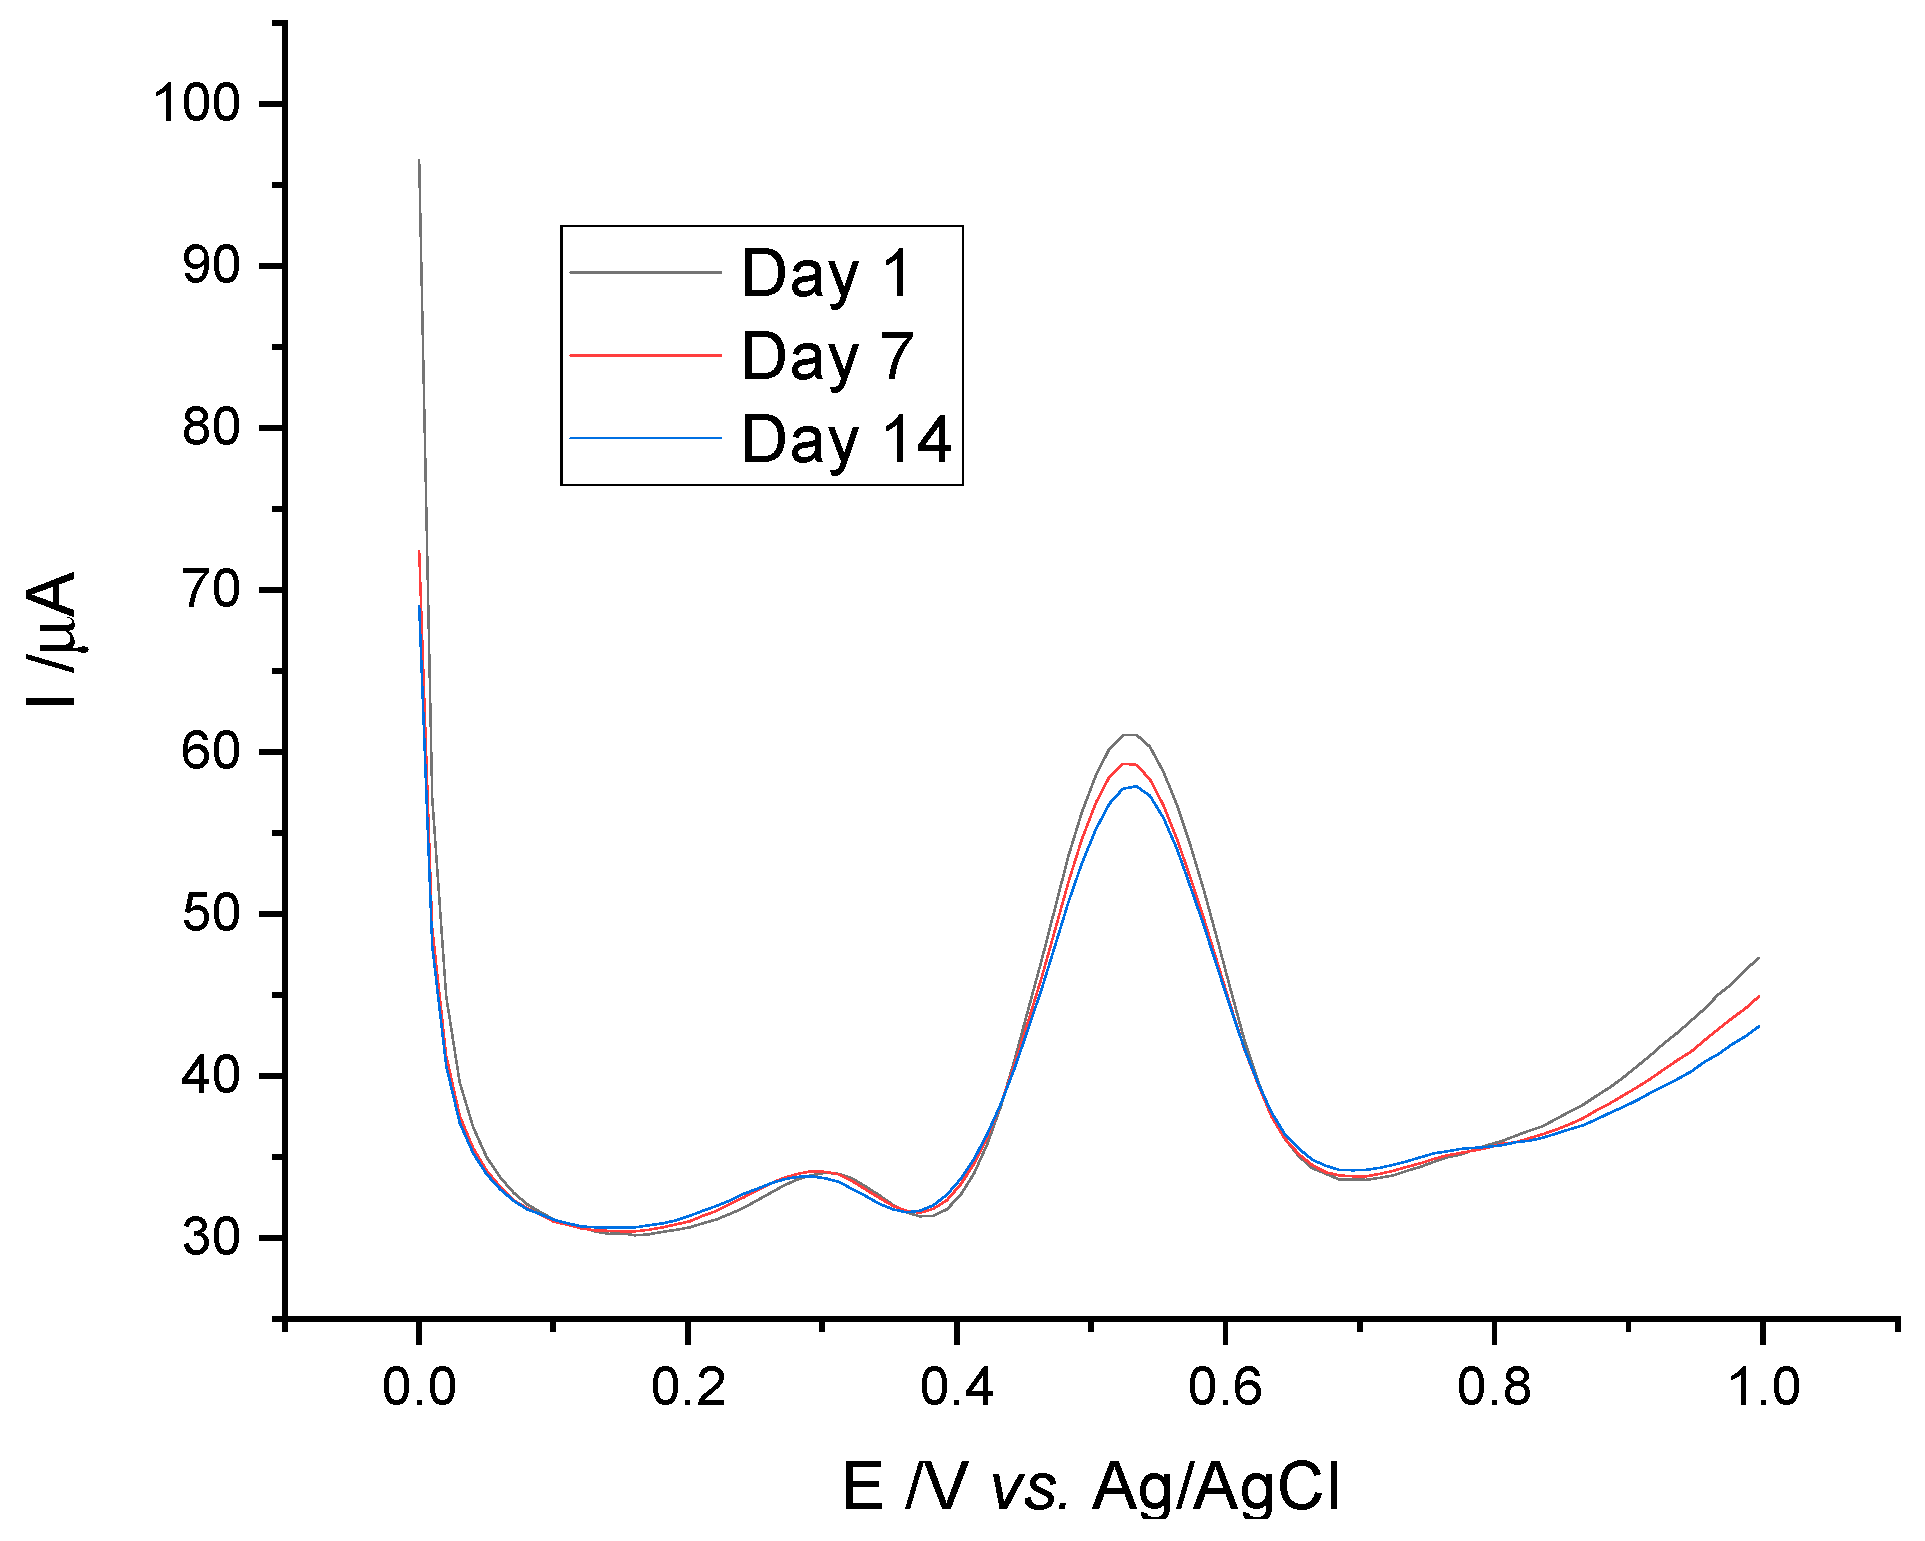
3.1.4. Electrode Stability

The reproducibility of the modified electrode with CNTs was investigated. Thus, differential pulse voltammograms were recorded for a 10 mM chicoric acid solution for two consecutive weeks (Figure 6). The standard deviation of the oxidation peaks measured 3 times for each day was 2.69%, which means that the CNTs/CS/GCE electrode has a good reproducibility.

3.1.5. Interference Studies

For a solution containing both caftaric and chicoric acids, in concentrations of 6.40 and 5.55 mM, the influence of interferences was studied. Organic substances (such as resorcinol, glucose, uric acid, phenol and tartaric acid) with a concentration of 10 mM in solution, brought an increase in the intensity of the oxidation peaks corresponding to caftaric acid and caffeic acid, with a maximum of 3.2%. Inorganic ions (i.e., Na+, K+, Mg2+, Ni2+, Cu2+, Cl, NO3 and SO42−, Table 1), having concentrations of 100 mM in the solution of caftaric acid and chicoric acid, also did not significantly alter the signal of the oxidation peak. So, the CNTs/CS/GCE electrode had a good selectivity in determining the two acids (caftaric and chicoric).

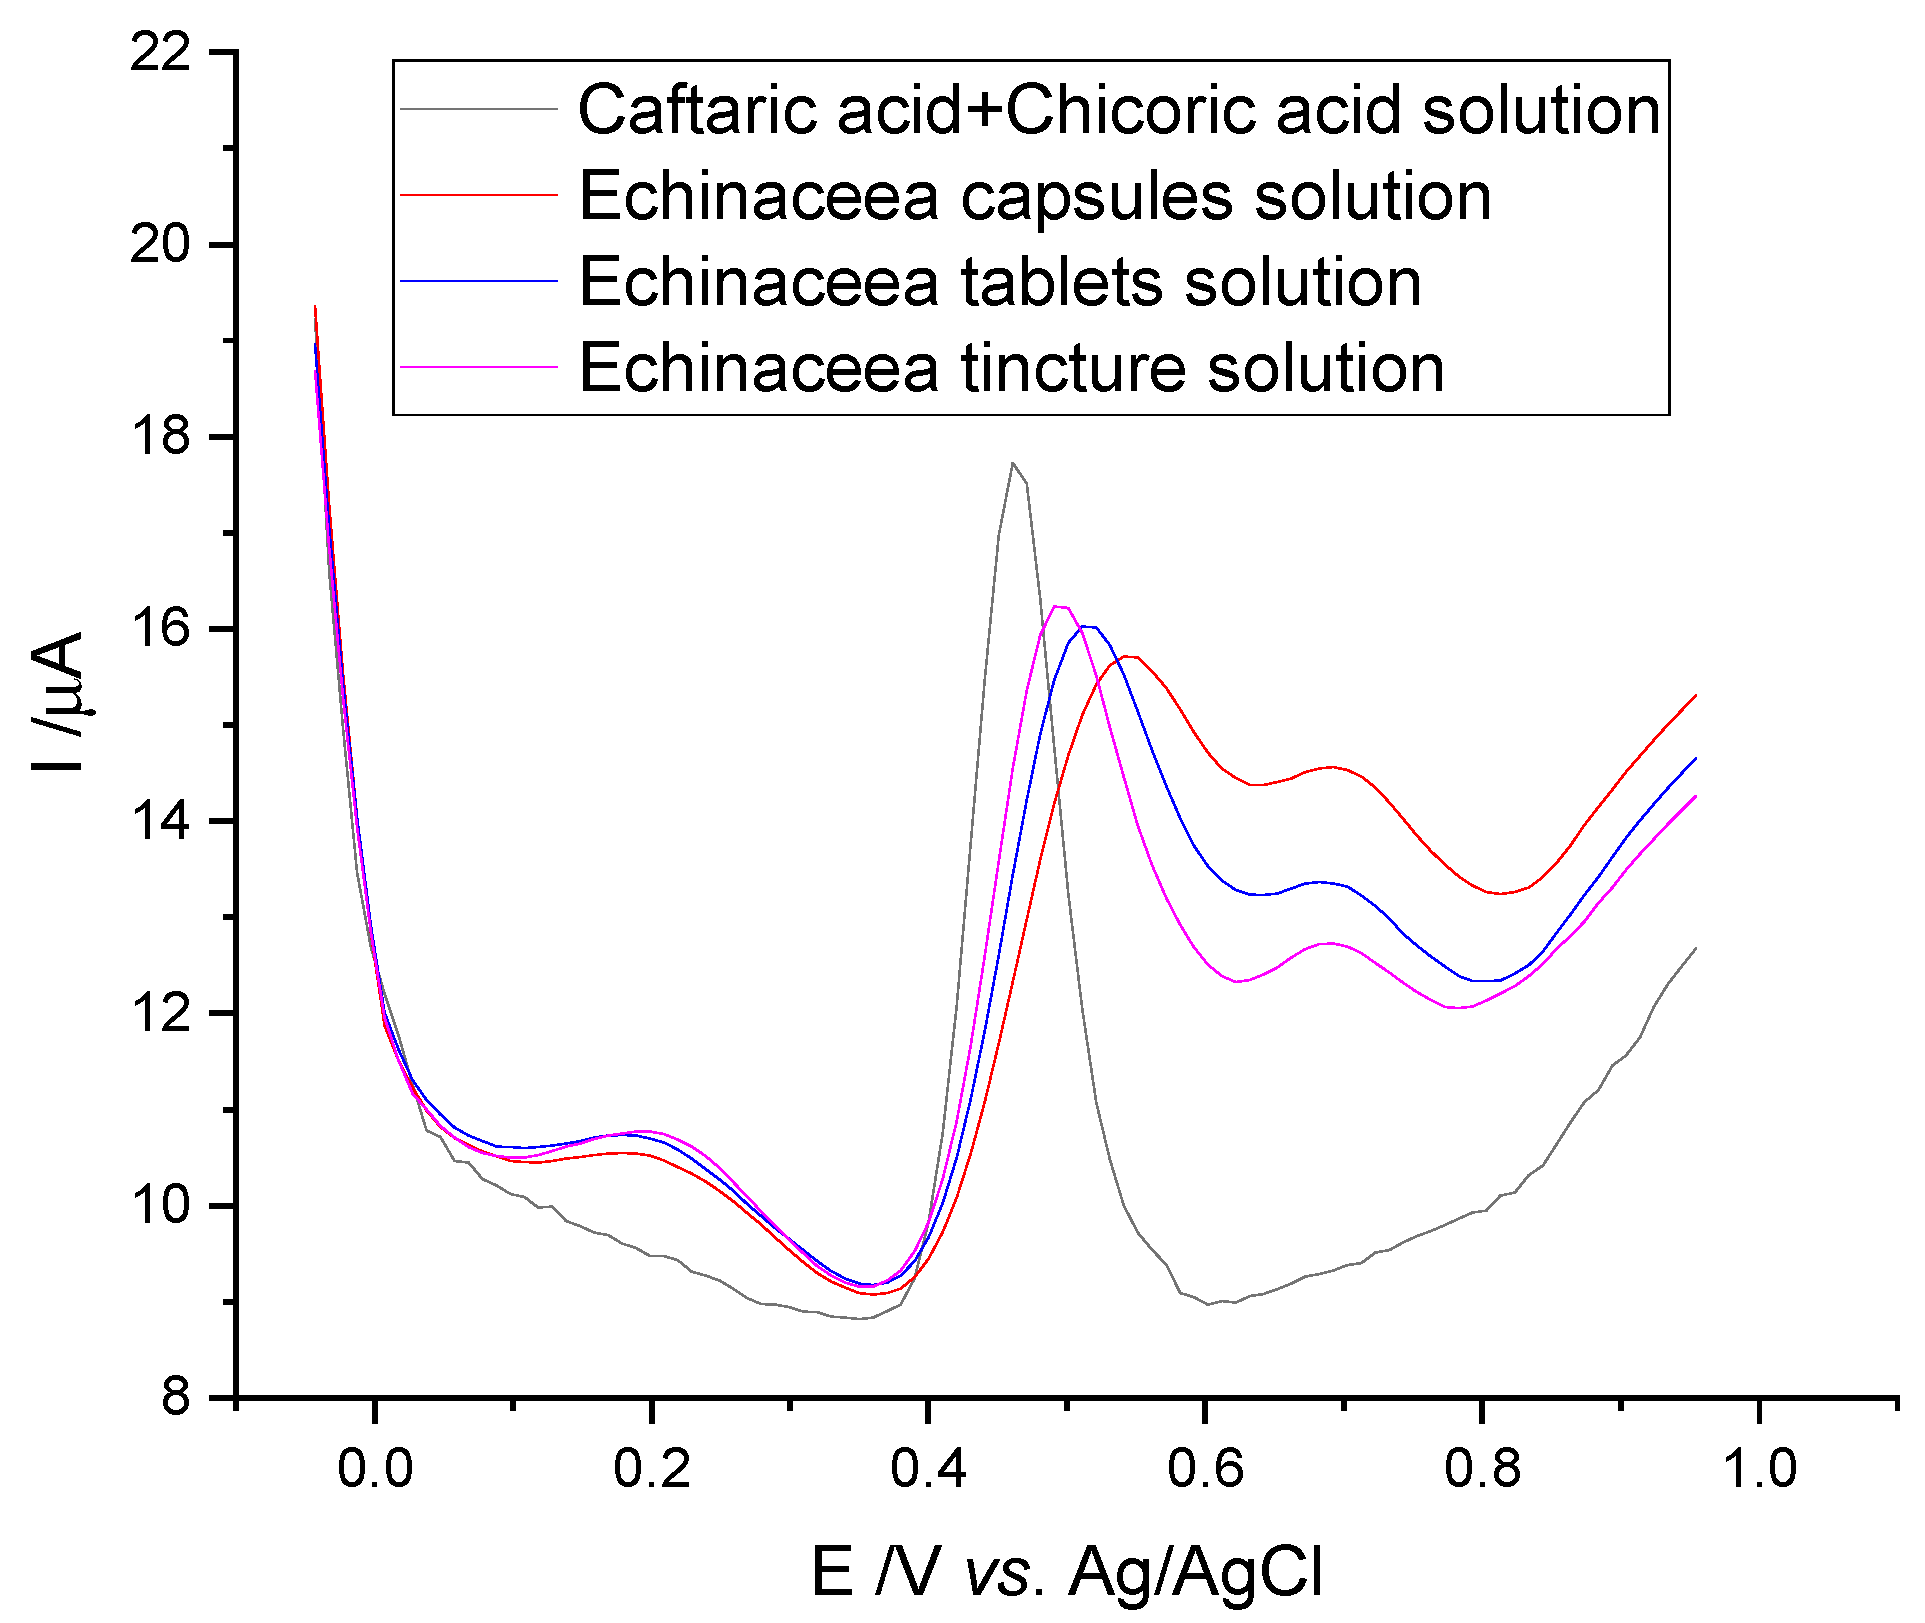
3.2. Voltammetric Study of Echinacea Purpurea in Pharmaceutical Forms

Differential pulse voltammograms were recorded in the same range of 0.0 to 1.0 V in B-R buffer.
Figure 7 shows the differential pulse voltammograms for a solution of caftaric acid and chicoric acid (concentration of 6.40 and 5.55 mM) along with 3 other solutions of Echinacea purpurea extract 3.00 mg/mL from capsules/tablets/tincture in B-R buffer. The presence of strong oxidation peaks at 0.515 ± 0.025 V, due to the oxidation of 3,4-dihydroxyl substituents (caftaric acid and chicoric acid), is noted.
The presence of the other two oxidation peaks from 0.209 ± 0.002 V and 0.697 ± 0.005 V of the studied pharmaceutical forms can be attributed to caffeic acid or quercetin [21] respectively, to malvidin-3-glucoside, catechin or chlorogenic acid [37,38]. Amounts of polyphenols have similar values to those found by Oniszczuk et al. [39].
By correlating the oxidation peaks for both caftaric and chicoric acids with the current intensities for the oxidation peaks of the analyzed pharmaceutical forms, the quantities of polyphenols existing in the Echinacea extracts were obtained. The polyphenolic content was determined by the spectrophotometric method, and the standard GA calibration curve (expressed in GAE) was used. The values obtained are specified in Table 4.

3.3. Antioxidant Activity

The differential pulse voltammograms for the gallic and ascorbic polyphenolic acids standards are shown in Figure 8A,B. Characteristic irreversible oxidation processes were registered for both compounds, similar to those observed for other antioxidant compounds (with one anodic peak Epa = 0.515 ± 0.035 V for ascorbic acid [40,41,42,43], and two anodic peaks E(I)pa = 0.370 ± 0.040 V, E(II)pa = 0.550 ± 0.030 V for gallic acid [44,45]).
The equations of the calibration lines (Figure 8C,D) of AA (Equation (6)) and GA (Equation (7)) are:
I(µA) = 21.42588 + 1376.17861 °C(mol/L); R = 0.99806
I(µA) = 1.12068 + 2708.14749 °C(mol/L); R = 0.99827
Using the equations of the calibration lines for the two acids, the equivalent concentration was calculated for the three pharmaceutical forms analyzed in relation to the respective acids. Thus, the antioxidant capacity of Echinacea extract powder, relative to AA and GA, is shown in Table 5.
In the case of determination by the DPPH method, the calibration curves for AA and GA are linear (with a correlation coefficient >0.99), which indicates a good correspondence between the concentration of the analyzed solutions and the respective absorbance: AAA = 0.02079 + 1.0937 C (mM), R = 0.99663 and R2 = 0.99579, and AGA = 0.10301 + 1.26575 C (mM), R = 0.99290 and R2 = 0.99112, as it is also shown in Figure 9.
The possible association between the total polyphenol content and the antioxidant activity was tested, and it resulted in a direct, positive and strong association in intensity, regardless of the report (r = 0.93542, R2 = 0.87502, p = 0.23—equivalent to AA; r = 0.880797, R2 = 0.65282, p = 0.4—equivalent to GA).

4. Discussion

The determination of total content of polyphenols and antioxidant activity of natural pharmaceutical products is a difficult goal, being both selective and sensitive at the same time. For this purpose, simple and fast techniques are needed. Our research presented a sensitive electrochemical method of determination (both for the total polyphenols content and for the antioxidant activity of Echinacea purpurea extracts), benefiting from a newly manufactured glassy carbon electrode, modified with CNTs. CNTs are the most relevant representatives of the nanomaterials that are used in the manufacturing process of the electrochemical sensors, having high performance. Multiwalled CNTs are usually selected, taking into account their many advantages (high electrocatalytic activity and rapid electron transfer rate).
The structure of the caffeic acid derivatives that have ortho-dihydroxyl groups is highly connected to their reaction of oxidation [46]. The oxidation process of the catechol moiety implies a two-electron transfer that takes place stepwise through one-electron processes, succeeded by a permanent/unchangeable chemical reaction for every stage to yield an o-quinone end-product [47]. Accordingly, at the glassy carbon electrode (GCE) surface, the Echinacea extracts, chicoric or caftaric acid, that have comparable moiety of caffeic acid, will be oxidized. The modification of glassy carbon electrodes increases the redox peak current; also, it could be used with higher sensitivity.
For the electrode characterization, a redox system was used, with 2 electroactive species, which offers the advantage of showing a peak of oxidation, and respectively, a peak of reduction, regardless of the scanning direction of the cyclic voltammetry. Thus, if scanned to positive potentials, the oxidation peak of K4[Fe(CN)6] will be observed, and if the scanning direction is changed to negative potentials, the reduction peak of K3[Fe(CN)6] will be observed. If only K3[Fe(CN)6] is used, under conditions of scanning to positive potentials, no signal will be observed in the anodic half-cycle, but a K3[Fe(CN)6] reduction signal will appear in the cathodic half-cycle as well as the oxidation of K4[Fe(CN)6] generated in the next anodic half-cycle. The results indicated that the tested electrode has a higher sensitivity than the other two electrodes used and can be used to determine the number of polyphenols and antioxidant activity.
In cyclic voltammetry, Ip depends on several factors: scanning speed, concentration of electroactive species, diffusion properties of electroactive species at the electrode surface, etc. Based on these considerations, and the first two factors listed above being identical for the three electrodes used, it is obvious that a net higher value of Ip for the electrode CNTs/CS/GCE is due to a very good electroactive surface compared to the other two electrodes used. If referring to the two modified electrodes, it can be stated that a smaller amount of added CS cannot fix a large quantity of CNTs to the electrode surface (based on the Ip values corresponding to the two modified electrodes).
Voltammetry studies have shown the presence of oxidation peaks at 0.505 V for caftaric acid and 0.515 V for chicoric acid, and they increase in direct proportion with the increase of the acid concentration in the range of 0.85–4.08 mM, and respectively in the range of 2.69–4.66 mM (Figure 5). These peaks are due to the oxidation of the -OH groups to the quinoline form, oxidation that consumes 2 electrons and 2 protons to form o-quinone for the studied acids [48].
Oxidation peaks in voltammograms demonstrate the existence of electroactive phenolic species in the extract and can be used to determine the total polyphenol content. This finding confirms that, based on the current intensities, the two acids mentioned above are the main polyphenols existing in the extract, because similar results were obtained for the standard phenolic compounds of caftaric and chicoric acid. Oxidation potentials that occur at 0.505 V (Figure 7) and 0.515 V (Figure 7) for both acids have close values that cannot be split by the electrode used. It should be noted that the shift of the oxidation peak towards more negative and positive potential values for the analyzed forms is due to the presence of other polyphenolic compounds in the studied extracts.
The antioxidant activity was examined by comparing and reporting two substances with strong antioxidant effects: ascorbic acid and gallic acid. Of the three pharmaceutical forms studied, Echinacea tincture had the highest antioxidant capacity (relative to ascorbic acid and gallic acid) and the total amount of polyphenols (28.72 mg/equivalent of 500 mg powder). Echinacea capsules had the lowest antioxidant capacity, but also the lowest total amount of polyphenols (19.50 mg/500 mg powder). Similarly, the tablets had approximately the same values of polyphenols content (19.80 mg/500 mg powder), and also antioxidant capacity. The positive association between total polyphenol content and antioxidant activity demonstrates the importance of polyphenolic compounds that contribute to the antioxidant activity of echinacea extracts, but also to the total antioxidant effect. These results are consistent with other studies that evaluated the antioxidant activity of Echinacea purpurea by spectrophotometric or electrochemical methods [21,49].

5. Conclusions

The results of this study indicate that the pulse-differential cyclic voltammetry represents a rapid, simple and sensitive technique to establish the entire polyphenolic amount and the antioxidant activity of the E. purpurea extracts. The modified 1 mg/mL CNTs/CS 5%/GCE electrode has superior properties compared to the other two (the unmodified and 20 mg/mL CNTs/CS 0.5%/GCE-modified) electrodes used and can be operated with to determine the polyphenol content and antioxidant capacity of natural extracts, supplements and foods. Due to the very good correlation between the antioxidant action obtained and the total polyphenolic content, it is considered that the antioxidant activity of the studied products containing Echinacea comes largely from the derivatives of caffeic acid that are present in the extracts of this plant. The use of dietary supplements containing Echinacea extracts, due to their action in preventing oxidative reactions induced by free radicals, may bring health benefits.

Author Contributions

All authors contributed equally to this paper. Conceptualization, F.B., D.M.T. and S.N.; Data curation, P.O., A.C.N. and D.G.; Formal analysis, F.B.; Investigation, F.B., T.B., D.G., F.-M.P. and S.N.; Methodology, S.B. and T.B.; Software, F.B. and T.B.; Supervision, S.B. and T.B.; Validation, P.O. and F.-M.P.; Writing—original draft, F.B., S.B., D.M.T., P.O., A.C.N. and S.N.; Writing—review and editing, S.B., D.M.T. and A.C.N. All authors have read and agreed to the published version of the manuscript.

Funding

This research received no external funding.

Acknowledgments

The authors are thankful to the University of Oradea for all the laboratory facilities.

Conflicts of Interest

The authors declare no conflict of interest.

References

  1. Hudson, J.B. Applications of the Phytomedicine Echinacea Purpurea (Purple Coneflower) in Infectious Diseases. J. Biomed. Biotechnol. 2012, 2012, 1–16. [Google Scholar] [CrossRef] [PubMed] [Green Version]
  2. Bungau, S.G.; Popa, V.C. Between Religion and Science Some Aspects Concerning Illness and Healing in Antiquity. Transylv. Rev. 2015, 24, 3–18. [Google Scholar]
  3. Hu, C.; Kitts, D.D. Studies on the Antioxidant Activity of Echinacea Root Extract. J. Agric. Food Chem. 2000, 48, 1466–1472. [Google Scholar] [CrossRef]
  4. Vimalanathan, S.; Arnason, J.T.; Hudson, J.B. Anti-inflammatory Activities of Echinacea Extracts Do Not Correlate with Traditional Marker Components. Pharm. Biol. 2009, 47, 430–435. [Google Scholar] [CrossRef]
  5. Burns, J.J.; Zhao, L.; Taylor, E.W.; Spelman, K. The Influence of Traditional Herbal Formulas on Cytokine Activity. Toxicology 2010, 278, 140–159. [Google Scholar] [CrossRef] [PubMed]
  6. Mishima, S.; Saito, K.; Maruyama, H.; Inoue, M.; Yamashita, T.; Ishida, T.; Gu, Y. Antioxidant and Immuno-Enhancing Effects of Echinacea Purpurea. Biol. Pharm. Bull. 2004, 27, 1004–1009. [Google Scholar] [CrossRef] [PubMed] [Green Version]
  7. Zhang, Y.; Tang, T.; He, H.; Wu, H.; Hu, Z. Influence of several postharvest processing methods on polyphenol oxidase activity and cichoric acid content of Echinacea purpurea roots. Ind. Crops Prod. 2011, 34, 873–881. [Google Scholar] [CrossRef]
  8. Pellati, F.; Benvenuti, S.; Magro, L.; Melegari, M.; Soragni, F. Analysis of Phenolic Compounds and Radical Scavenging Activity of Echinacea Spp. J. Pharm. Biomed. Anal. 2004, 35, 289–301. [Google Scholar] [CrossRef]
  9. Zolgharnein, J.; Niazi, A.; Afiuni-Zadeh, S.; Zamani, K. Determination of Cichoric Acid as a Biomarker in Echinacea Purpurea Cultivated in Iran Using High Performance Liquid Chromatography. Chin. Med. 2010, 1, 23–27. [Google Scholar] [CrossRef] [Green Version]
  10. Thygesen, L.; Thulin, J.; Mortensen, A.; Skibsted, L.H.; Molgaard, P. Antioxidant Activity of Cichoric Acid and Alkamides from Echinacea purpurea, Alone and in Combination. Food Chem. 2007, 101, 74–81. [Google Scholar] [CrossRef]
  11. Villaño, D.; Fernández-Pachón, M.S.; Moyá, M.L.; Troncoso, A.M.; García-Parrilla, M.C. Radical Scavenging Ability of Polyphenolic Compounds Towards DPPH Free Radical. Talanta 2007, 71, 230–235. [Google Scholar] [CrossRef] [PubMed]
  12. Bauer, R.; Remiger, P.; Wagner, H. Comparative TLC and HPLC analysis of herbal drugs from Echinacea purpurea, E. pallida and E. angustifolia. Dtsch. Apoth. Ztg. 1988, 128, 174–180. [Google Scholar]
  13. Perry, N.B.; Burgess, E.J.; Glennie, V.L. Echinacea Standardization: Analytical Methods for Phenolic Compounds and Typical Levels in Medicinal Species. J. Agric. Food Chem. 2001, 49, 1702–1706. [Google Scholar] [CrossRef] [PubMed]
  14. Brown, P.N.; Chan, M.; Paley, L.; Betz, J.M. Determination of Major Phenolic Compounds in Echinacea Spp. Raw Materials and Finished Products by High-Performance Liquid Chromatography With Ultraviolet Detection: Single-Laboratory Validation Matrix Extension. J. AOAC Int. 2011, 94, 1400–1410. [Google Scholar] [CrossRef] [PubMed] [Green Version]
  15. Kilmartin, P.A. Electrochemistry applied to the analysis of wine: A mini-review. Electrochem. Commun. 2016, 67, 39–42. [Google Scholar] [CrossRef]
  16. Karaosmanoglu, H.; Suthanthangjai, W.; Travas-Sejdic, J.; Kilmartin, P.A. Electrochemical analysis of beverage phenolics using an electrode modified with poly(3,4-ethylenedioxythiophene). Electrochim. Acta 2016, 201, 366–373. [Google Scholar] [CrossRef]
  17. Abdel-Hamid, R.; Newair, E.F. Adsorptive stripping voltammetric determination of gallic acid using an electrochemical sensor based on polyepinephrine/glassy carbon electrode and its determination in black tea sample. J. Electroanal. Chem. 2013, 704, 32–37. [Google Scholar] [CrossRef]
  18. Makhotkina, O.; Kilmartin, P.A. The use of cyclic voltammetry for wine analysis: Determination of polyphenols and free sulfur dioxide. Anal. Chim. Acta 2010, 668, 155–165. [Google Scholar] [CrossRef]
  19. Zhao, Y.; Tang, Y.; He, J.; Xu, Y.; Gao, R.; Zhang, J.; Chong, T.; Wang, L.; Tang, X. Surface Imprinted Polymers Based on Amino-Hyperbranched Magnetic Nanoparticles for Selective Extraction and Detection of Chlorogenic Acid in Honeysuckle Tea. Talanta 2018, 181, 271–277. [Google Scholar] [CrossRef]
  20. Ribeiro, C.M.; Miguel, E.M.; Silva, J.D.S.; Silva, C.B.D.; Goulart, M.O.F.; Kubota, L.T.; Gonzaga, F.B.; Santos, W.J.R.; Lima, P.R. Application of a Nanostructured Platform and Imprinted Sol-Gel Film for Determination of Chlorogenic Acid in Food Samples. Talanta 2016, 156–157, 119–125. [Google Scholar] [CrossRef]
  21. Newair, E.F.; Kilmartin, P.A.; Garcia, F. Square wave voltammetric analysis of polyphenol content and antioxidant capacity of red wines using glassy carbon and disposable carbon nanotubes modified screen-printed electrodes. Eur. Food Res. Technol. 2018, 244, 1225–1237. [Google Scholar] [CrossRef]
  22. Daniel, S.; Rao, T.P.; Rao, K.S.; Rani, S.U.; Lee, H.Y.; Kawai, T.; Naidu, G.R.K. A review of DNA functionalized/grafted carbon nanotubes and their characterization. Sens. Actuators B Chem. 2007, 122, 672–682. [Google Scholar] [CrossRef]
  23. Ovádeková, R.; Labuda, J. Electrochemical DNA biosensors for the investigation of dsDNA host-guest interactions and damage. Curr. Opin. Electrochem. 2006, 11, 21–56. [Google Scholar]
  24. Iijima, S. Helical Microtubules of Graphitic Carbon. Nature 1991, 354, 56–58. [Google Scholar] [CrossRef]
  25. Wang, Y.R.; Hu, P.; Liang, Q.L.; Luo, G.A.; Wang, Y.M. Application of Carbon Nanotube Modified Electrode in Bioelectroanalysis. Chin. J. Anal. Chem. 2008, 36, 1011–1016. [Google Scholar] [CrossRef]
  26. Otrisal, P.; Obsel, V.; Forus, S.; Bungau, C.; Aleya, L.; Bungau, S. Protecting emergency workers and armed forces from volatile toxic compounds: Applicability of reversible conductive polymer-based sensors in barrier materials. Sci. Total Environ. 2019, 694. [Google Scholar] [CrossRef]
  27. Qu, L.; Yang, S. Application of Carbon Nanotubes Modified Electrode in Pharmaceutical Analysis. In Carbon Nanotubes—Growth and Applications; Naraghi, M., Ed.; IntechOpen: Rijieka, Croatia, 2011. [Google Scholar]
  28. Zhao, L.; Gao, L. Novel In Situ Synthesis of MWNTs–Hydroxyapatite Composites. Carbon 2004, 42, 423–426. [Google Scholar] [CrossRef]
  29. Ruel-Gariépy, E.; Chenite, A.; Chaput, C.; Guirguis, S.; Leroux, J. Characterization of Thermosensitive Chitosan Gels for the Sustained Delivery of Drugs. Int. J. Pharm. 2000, 203, 89–98. [Google Scholar] [CrossRef]
  30. Cirillo, G.; Vittorio, O.; Kunhardt, D.; Valli, E.; Voli, F.; Farfalla, A.; Curcio, M.; Spizzirri, U.G.; Hampel, S. Combining Carbon Nanotubes and Chitosan for the Vectorization of Methotrexate to Lung Cancer Cells. Materials 2019, 12, 2889. [Google Scholar] [CrossRef] [Green Version]
  31. Sengiz, C.; Congur, G.; Eksin, E.; Erdem, A. Multiwalled Carbon Nanotubes-Chitosan Modified Single-Use Biosensors for Electrochemical Monitoring of Drug-DNA Interactions. Electroanalysis 2015, 27, 1855–1863. [Google Scholar] [CrossRef]
  32. Fritea, L.; Bănică, F.; Costea, T.O.; Moldovan, L.; Iovan, C.; Cavalu, S. A gold nanoparticles-Graphene based electrochemical sensor for sensitive determination of nitrazepam. J. Electroanal. Chem. 2018, 830–831, 63–71. [Google Scholar] [CrossRef]
  33. Cavalu, S.; Simon, V.; Banica, F. In vitro study of collagen coating by electrodeposition on acrylic bone cement with antimicrobial potential. Dig. J. Nanomater. Biostruct. 2010, 6, 89–97. [Google Scholar]
  34. Singleton, V.L.; Rossi, J.A. Colorimetry of Total Phenolics with Phosphomolybdic-Phosphotungstic Acid Reagents. Am. J. Enol. Vitic. 1965, 16, 144–158. [Google Scholar]
  35. Bondet, V.; Brand-Williams, W.; Berset, C. Kinetics and Mechanisms of Antioxidant Activity using the DPPH.Free Radical Method. LWT Food Sci. Technol. 1997, 30, 609–615. [Google Scholar] [CrossRef]
  36. Zanello, P. Inorganic Electrochemistry: Theory, Practice and Application; The Royal Society of Chemistry, Thomas Graham House: Cambridge, UK, 2003. [Google Scholar]
  37. Hernanz-Vila, D.; Jara-Palacios, M.J.; Escudero-Gilete, M.L.; Heredia, F.J. Applications of Voltammetric Analysis to Wine Products. In Applications of the Voltammetry; Stoitcheva, M., Zlatev, R., Eds.; IntechOpen: Rijieka, Croatia, 2017. [Google Scholar]
  38. Sloley, B.D.; Urichuk, L.J.; Tywin, C.; Coutts, R.T.; Pang, P.K.; Shan, J.J. Comparison of Chemical Components and Antioxidants Capacity of Different Echinacea Species. J. Pharm. Pharmacol. 2001, 53, 849–857. [Google Scholar] [CrossRef]
  39. Oniszczuk, T.; Oniszczuk, A.; Gondek, E.; Guz, L.; Puk, K.; Kocira, A.; Kusz, A.; Kasprzak, K.; Wójtowicz, A. Active Polyphenolic Compounds, Nutrient Contents and Antioxidant Capacity of Extruded Fish Feed Containing Purple Coneflower (Echinacea purpurea (L.) Moench.). Saudi J. Biol. Sci. 2019, 26, 24–30. [Google Scholar] [CrossRef]
  40. Cosio, M.S.; Buratti, S.; Mannino, S.; Benedetti, S. Use of an electrochemical method to evaluate the antioxidant activity of herb extracts from the Labiatae family. Food Chem. 2006, 97, 725–731. [Google Scholar] [CrossRef]
  41. Dar, R.A.; Brahman, P.K.; Khurana, N.; Wagay, J.A.; Lone, Z.A.; Ganaie, M.A.; Pitre, K.S. Evaluation of antioxidant activity of crocin, podophyllotoxin and kaempferol by chemical, biochemical and electrochemical assays. Arab. J. Chem. 2017, 10, S1119–S1128. [Google Scholar] [CrossRef] [Green Version]
  42. Badea, M.; Chiperea, S.; Balan, M.; Floroian, L.; Restani, P.; Marty, J.L.; Iovan, C.; Tit, D.M.; Bungau, S.; Taus, N. New approaches for electrochemical detection of ascorbic acid. Farmacia 2018, 66, 83–87. [Google Scholar]
  43. Fritea, L.; Tertiş, M.; Cristea, C.; Cosnier, S.; Săndulescu, R. Simultaneous Determination of Ascorbic and Uric Acids in Urine Using an Innovative Electrochemical Sensor Based on β-Cyclodextrin. Anal. Lett. 2015, 48, 89–99. [Google Scholar] [CrossRef]
  44. Badea, M.; di Modugno, F.; Floroian, L.; Tit, D.M.; Restani, P.; Bungau, S.; Iovan, C.; Badea, G.E.; Aleya, L. Electrochemical Strategies for Gallic Acid Detection: Potential for Application in Clinical, Food or Environmental Analyses. Sci. Total Environ. 2019, 672, 129–140. [Google Scholar] [CrossRef]
  45. Abdel-Hamid, R.; Bakr, A.; Newair, E.F.; Garcia, F. Simultaneous Voltammetric Determination of Gallic and Protocatechuic Acids in Mango Juice Using a Reduced Graphene Oxide-Based Electrochemical Sensor. Beverages 2019, 5, 17. [Google Scholar] [CrossRef] [Green Version]
  46. Glevitzky, I.; Dumitrel, G.A.; Glevitzky, M.; Pasca, B.; Otrisal, P.; Bungau, S.; Cioca, G.; Pantis, C.; Popa, M. Statistical Analysis of the Relationship Between Antioxidant Activity and the Structure of Flavonoid Compounds. Rev. de Chim. 2019, 70, 3103–3107. [Google Scholar] [CrossRef]
  47. Hottaa, H.; Uedaa, M.; Naganoa, S.; Tsujinob, Y.; Koyamac, J.; Osakaia, T. Mechanistic Study of the Oxidation of Caffeic Acid by Digital Simulation of Cyclic Voltammograms. Anal. Biochem. 2002, 303, 66–72. [Google Scholar] [CrossRef] [PubMed]
  48. Newair, E.F.; Abdel-Hamid, R.; Kilmartin, P.A. Mechanism of Chicoric Acid Electrochemical Oxidation and Identification of Oxidation Products by Liquid Chromatography and Mass Spectrometry. Electroanalysis 2016, 28, 1–12. [Google Scholar] [CrossRef]
  49. Zayova, E.; Stancheva, I.; Geneva, M.; Petrova, M.; Vasilevska-Ivanova, R. Morphological evaluation and antioxidant activity of in vitro- and in vivo-derived Echinacea purpurea plants. Open Life Sci. 2012, 7, 698–707. [Google Scholar] [CrossRef]
Figure 1. Structural formula: (A) Chicoric acid, (B) Caftaric acid.
Processes 08 00833 g001
Figure 2. Cyclic voltammograms of electrodes in K3[Fe(CN)6]/K4[Fe(CN)6] 10 mM solution in Britton-Robinson (B-R) buffer (pH 3), 0.100 V/s scan rate.
Processes 08 00833 g002
Figure 3. (A) Cyclic voltammograms for a 10 mM chicoric acid solution with scan speeds of 0.010, 0.025, 0.050, 0.075, 0.100, 0.150, 0.200 and 0.300 V/s, in B-R buffer (pH = 3) with modified electrode containing 20 mg CNTs/mL 0.5% CS solution in 2% acetic acid solution (20 mg/mL CNTs/CS 0.5%/GCE) denoted CNTs/CS/GCE. (B) The linearity between the peak current (Ip) and the square root of the scan rate v1/2.
Processes 08 00833 g003
Figure 4. (A) Differential pulse voltammograms for a 10 mM chicoric acid solution in Britton-Robinson buffer at different pH values. (B) Plot of anodic peak potential and peak current vs. pH.
Processes 08 00833 g004
Figure 5. Differential pulse voltammograms for (A) caftaric acid: 0.85, 1.68, 2.50, 3.30 and 4.08 mM, (B) chicoric acid: 2.69, 3.20, 3.69, 4.18 and 4.66 mM in Britton-Robinson buffer (pH = 3), (C) calibration curve for A, (D) calibration curve for B.
Processes 08 00833 g005
Figure 6. Differential pulse voltammograms for a 10 mM chicoric acid solution measured on days 1, 7 and 14 using the CNTs/CS/GCE electrode in Britton-Robinson buffer (pH = 3).
Processes 08 00833 g006
Figure 7. Differential pulse voltammograms for caftaric acid solution (6.40 mM) and chicoric acid (5.55 mM), for Echinacea purpurea extracts (capsules, tablets, tincture) 3 mg/mL in Britton-Robinson buffer (pH 3).
Processes 08 00833 g007
Figure 8. Differential pulse voltammograms for (A) ascorbic acid solutions 0.25, 0.70, 1.30, 2.00, 2.86, 3.75 and 4.59 mM, and (B) gallic acid 0.24, 0.70, 1.30, 2.00, 2.86, 3.75, 4.59, 5.35, 6.00 and 6.55 mM, in Britton-Robinson buffer (pH = 3). (C) Calibration curve for A, (D) calibration curve for B.
Processes 08 00833 g008
Figure 9. Calibration lines for (A) ascorbic acid and (B) gallic acid.
Processes 08 00833 g009
Table 1. Reagents used.
ReagentPurityCASSupplierPurpose of Usage
1,1-diphenyl-2-picrylylhydrazyl≥98% (HPLC)1898-66-4Sigma-Aldrich, USADPPH method
Acetonep.a. ≥ 99%67-64-1Chempur, PolandSolvent
Boric acidp.a. ≥ 99%10043-35-3Micromchim, RomaniaBuffer B-R preparation
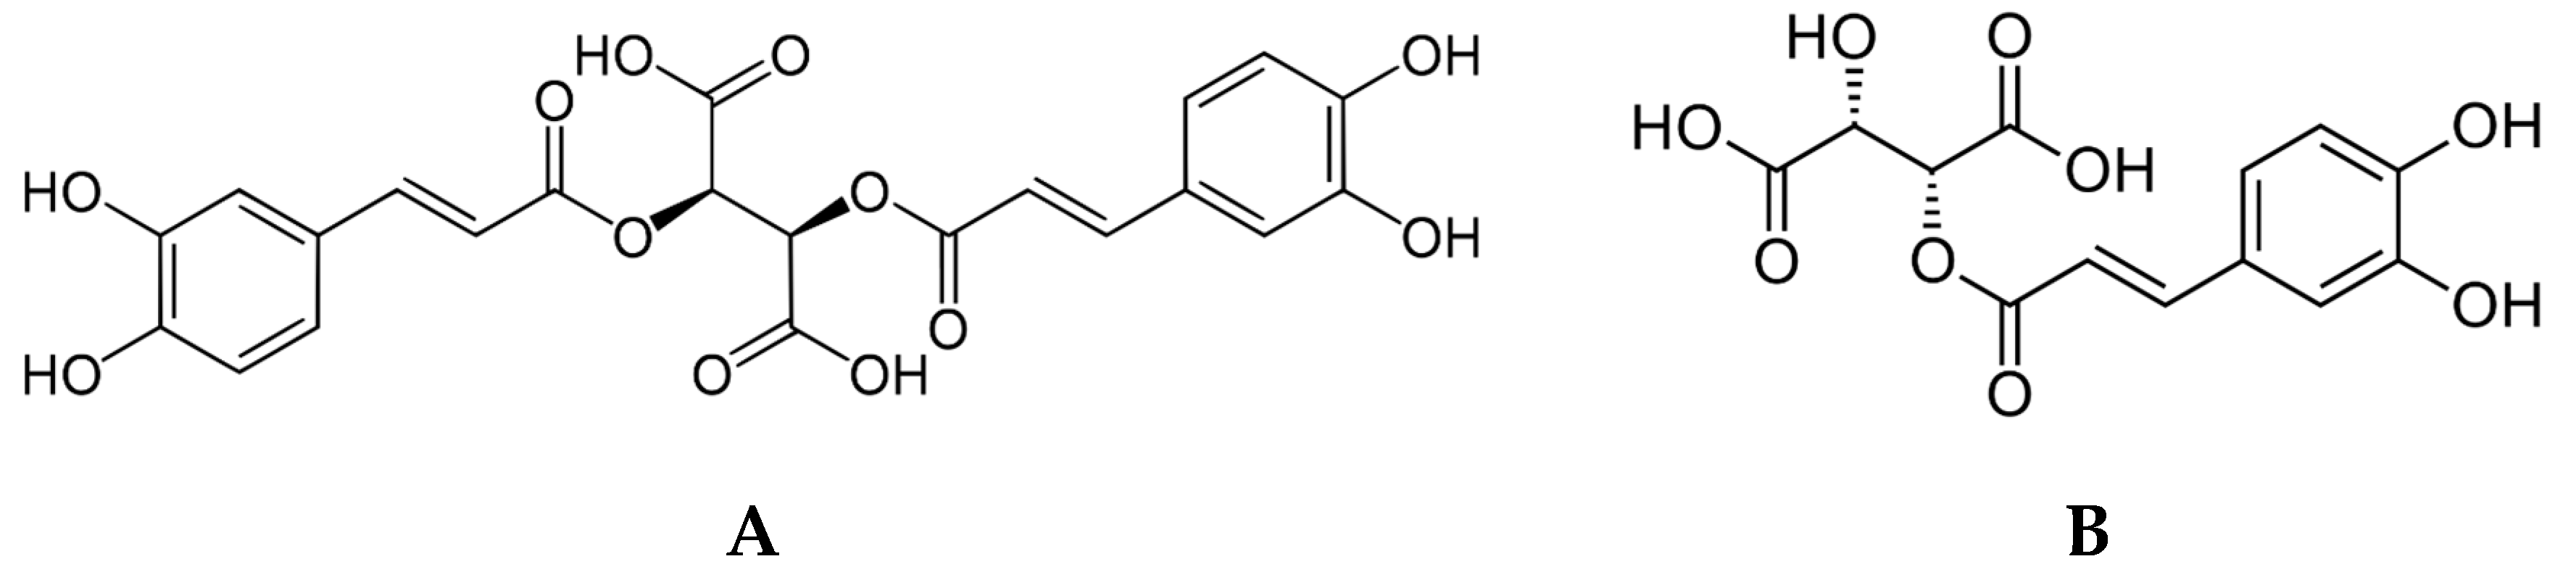
Caftaric acid
(2-Caffeoyl-L-tartaric acid)
≥97.0%67879-58-7Sigma-Aldrich, USADosage
Cichoric/Chicoric acid
(2,3-Dicaffeoyl-L-tartaric acid)
≥95%, (HPLC)6537-80-0Sigma-Aldrich, USADosage
Copper (II) sulphate pentahydrate≥98%7758-99-8Sigma-Aldrich, USAInterferent
D-(+)-glucose monohydrate7.0–9.5% water14431-43-7Sigma-Aldrich, USAInterferent
Ethanol95%64-17-5Chempur, PolandSolvent
Folin-Ciocalteu reagent-12111-13-6Sigma-Aldrich, USATotal content of polyphenolic compounds determination
Gallic acid≥98% (HPLC)5995-86-8Sigma-Aldrich, USADPPH antioxidant activity determination
Glacial acetic acidp.a. ≥ 99%64-19-7Chempur, PolandBuffer B-R preparation
ChitosanLow molecular weight9012-76-4Merck, GermanyModified electrode preparation
L-ascorbic acid≥99%50-81-7Sigma-Aldrich, USADPPH antioxidant activity determination
Magnesium chlorideAnhydrous, ≥98%7786-30-3Sigma-Aldrich, USAInterferent
Methanol≥99%67-56-1Chempur, PolandSolvent
MWCNT≤100%308068-56-6Sigma-Aldrich, USAModified electrode preparation
Nickel (II) sulphate hexahydrate≥98%10101-97-0Chempur, PolandInterferent
Phenol99–100.5%108-95-2Sigma-Aldrich, USAInterferent
Phosphoric acidACS reagent, ≥85 wt.% in H2O7664-38-2Merck, GermanyBuffer B-R preparation
Potassium ferricyanide, Red prussiate≥99%13746-66-2Merck, GermanyRedox couple
Potassium ferrocyanide, Yellow prussiate≥98.5%14459-95-1Merck, GermanyRedox couple
Potassium nitrate≥99%7757-79-1Merck, GermanyInterferent
Resorcinol≥99%108-46-3Chempur, PolandInterferent
Sodium carbonateBioXtra, ≥99.0%497-1908Chempur, PolandTotal content of polyphenolic compounds determination
Sodium hydroxideBioXtra, ≥98.0% (acidimetric), pellets (anhydrous)1310-73-2Chempur, PolandInterferent
Sodium chloride≥99%7647-14-5Sigma-Aldrich, USAInterferent
Tartaric acid≥99.5%87-69-4Sigma-Aldrich, USAInterferent
Uric acid≥99%69-93-2Chempur, PolandInterferent
HPLC–High-Performance Liquid Chromatography; DPPH–2,2-diphenyl-1-picrylhydrazyl; MWCNT–Multiwall carbon nanotube; B-R–Britton-Robinson; ACS–American Chemical Society; H2O–water.
Table 2. Pharmaceutical forms with Echinacea.
ManufacturerContentCategory
Capsules 500 mgCosmopharm, Bucharest, Romania Concentrated Echinacea extract, 20 mg polyphenolsNatural immunostimulant
Tablets 500 mgAlevia, Fălticeni, Romania Echinacea Purpurea standardized extract, 4% polyphenolsFood supplement
Tincture 50 mLDacia Plant, Bod, Romania Extract 1: 3.75 in hydroalcoholic solution (ethyl alcohol/water—35/65 by mass) from aerial parts of Echinacea purpureaFood supplement
Table 3. Detection and quantification limits for caftaric and chicoric acids.
AcidLinearity RangeLimit of Detection (mM)Limit of Quantification
Caftaric0.850–4.0840.2830.850
Chicoric2.691–4.6610.8972.691
Table 4. The amounts of acids present in the analyzed pharmaceutical forms with Echinacea.
VoltammetrySpectrophotometry
Pharm. Form Total Phenolic Derivatives TheoreticallyCaffeic Acid Caftaric + Cichoric AcidsCatechins Total Content of Polyphenols FoundTotal Content of Polyphenols Found
mg GAE/500 mg Powder
mg/500 mg Powder
Capsules202.006 ± 0.214 *16.129 ± 0.1591.366 ± 0.58319.501 ± 0.4832.638 ± 0.258
Tablets 201.958 ± 0.34816.222 ± 0.2911.622 ± 0.79419.802 ± 0.6782.682 ± 0.592
Tincture302.161 ± 0.28722.701 ± 01273.866 ± 0.92728.728 ± 0.8263.890 ± 0.156
* SD: standard deviation for 3 determinations; GAE: gallic acid equivalents.
Table 5. Antioxidant capacity equivalent to ascorbic/gallic acid (AA/GA).
Pharmaceutical FormAntioxidant Activity, mg acid/g Extract
VoltammetrySpectrophotometry
AAGAAAGA
Capsules6.125 ± 0.428 a0.952 ± 0.8198.917 ± 0.4823.009 ± 0.294
Tablets6.354 ± 0.1811.133 ± 0.4839.457 ± 0.8243.191 ± 0.326
Tincture6.722 ± 0.5371.245 ± 0.7249.826 ± 0.6243.457 ± 0.753
a SD: standard deviation for 3 determinations.

