Seasonal Changes in Free Amino Acid and Fatty Acid Compositions of Sardines, Sardina pilchardus (Walbaum, 1792): Implications for Nutrition


Abstract
:1. Introduction
2. Materials and Methods
2.1. Proximate Composition of Fish
2.2. The AA Profile
2.3. The FA Composition
3. Results and Discussion
3.1. Proximate Composition of Sardine
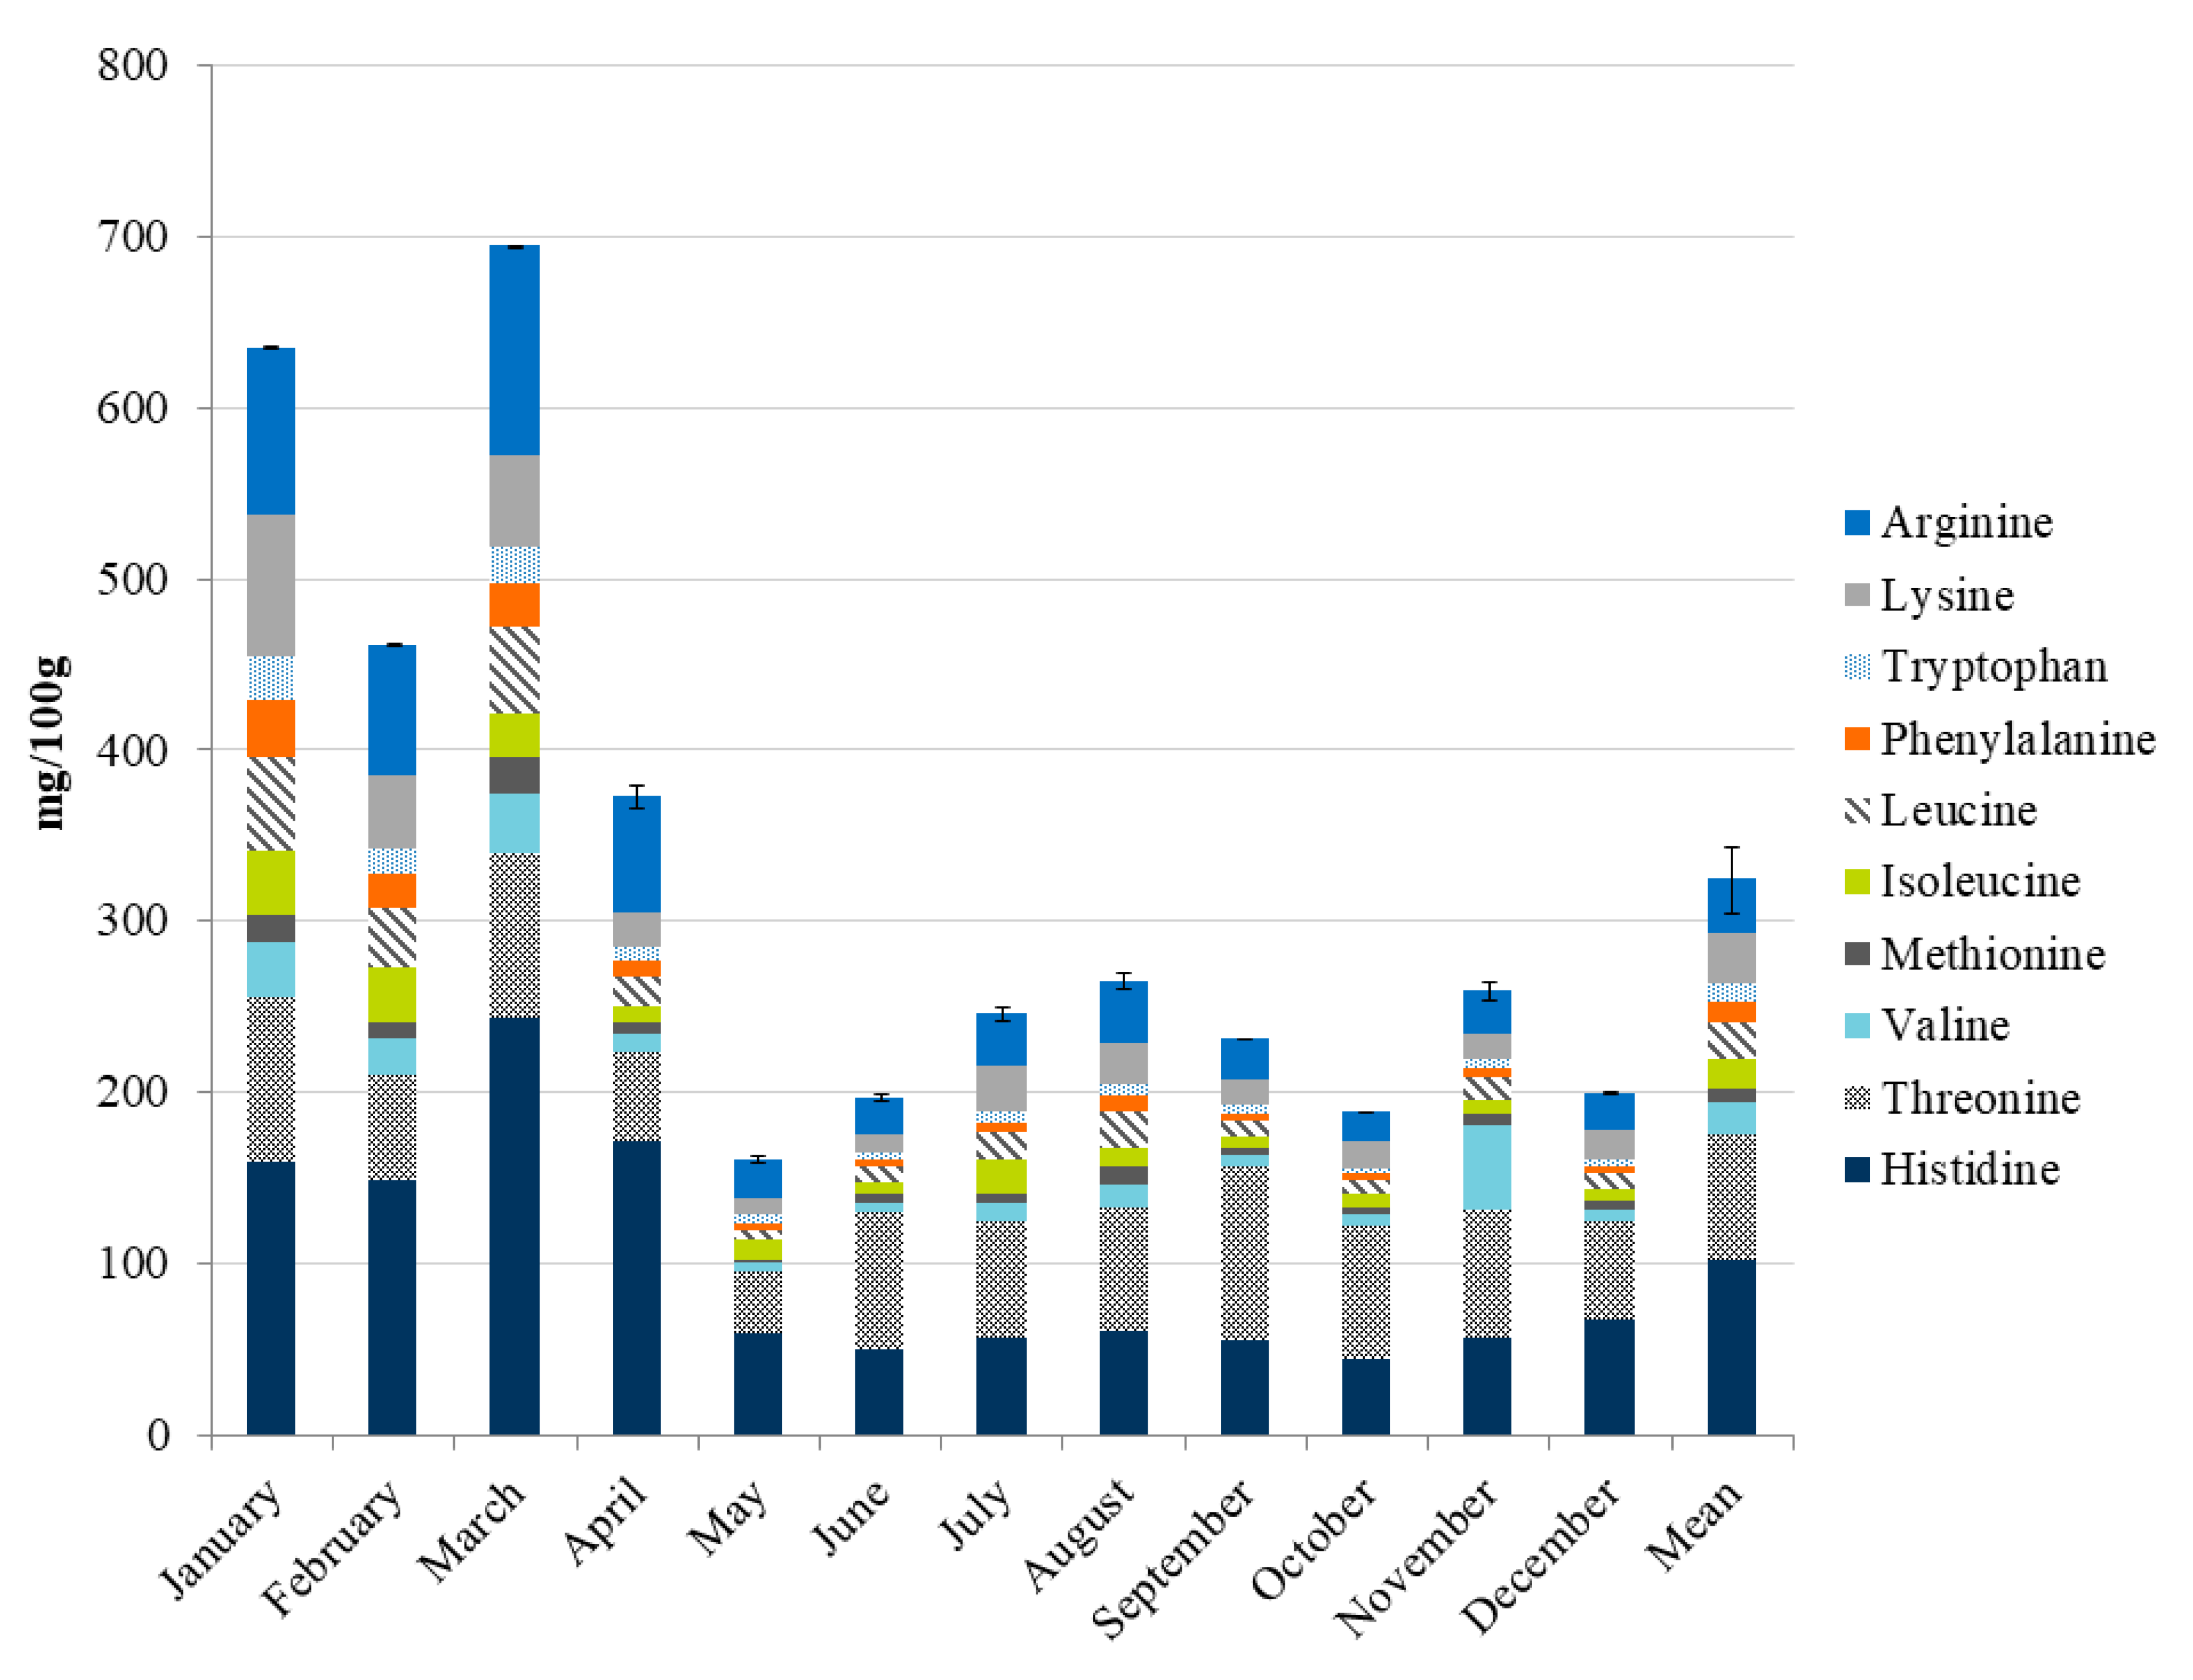
3.2. Free AA Composition of Sardines
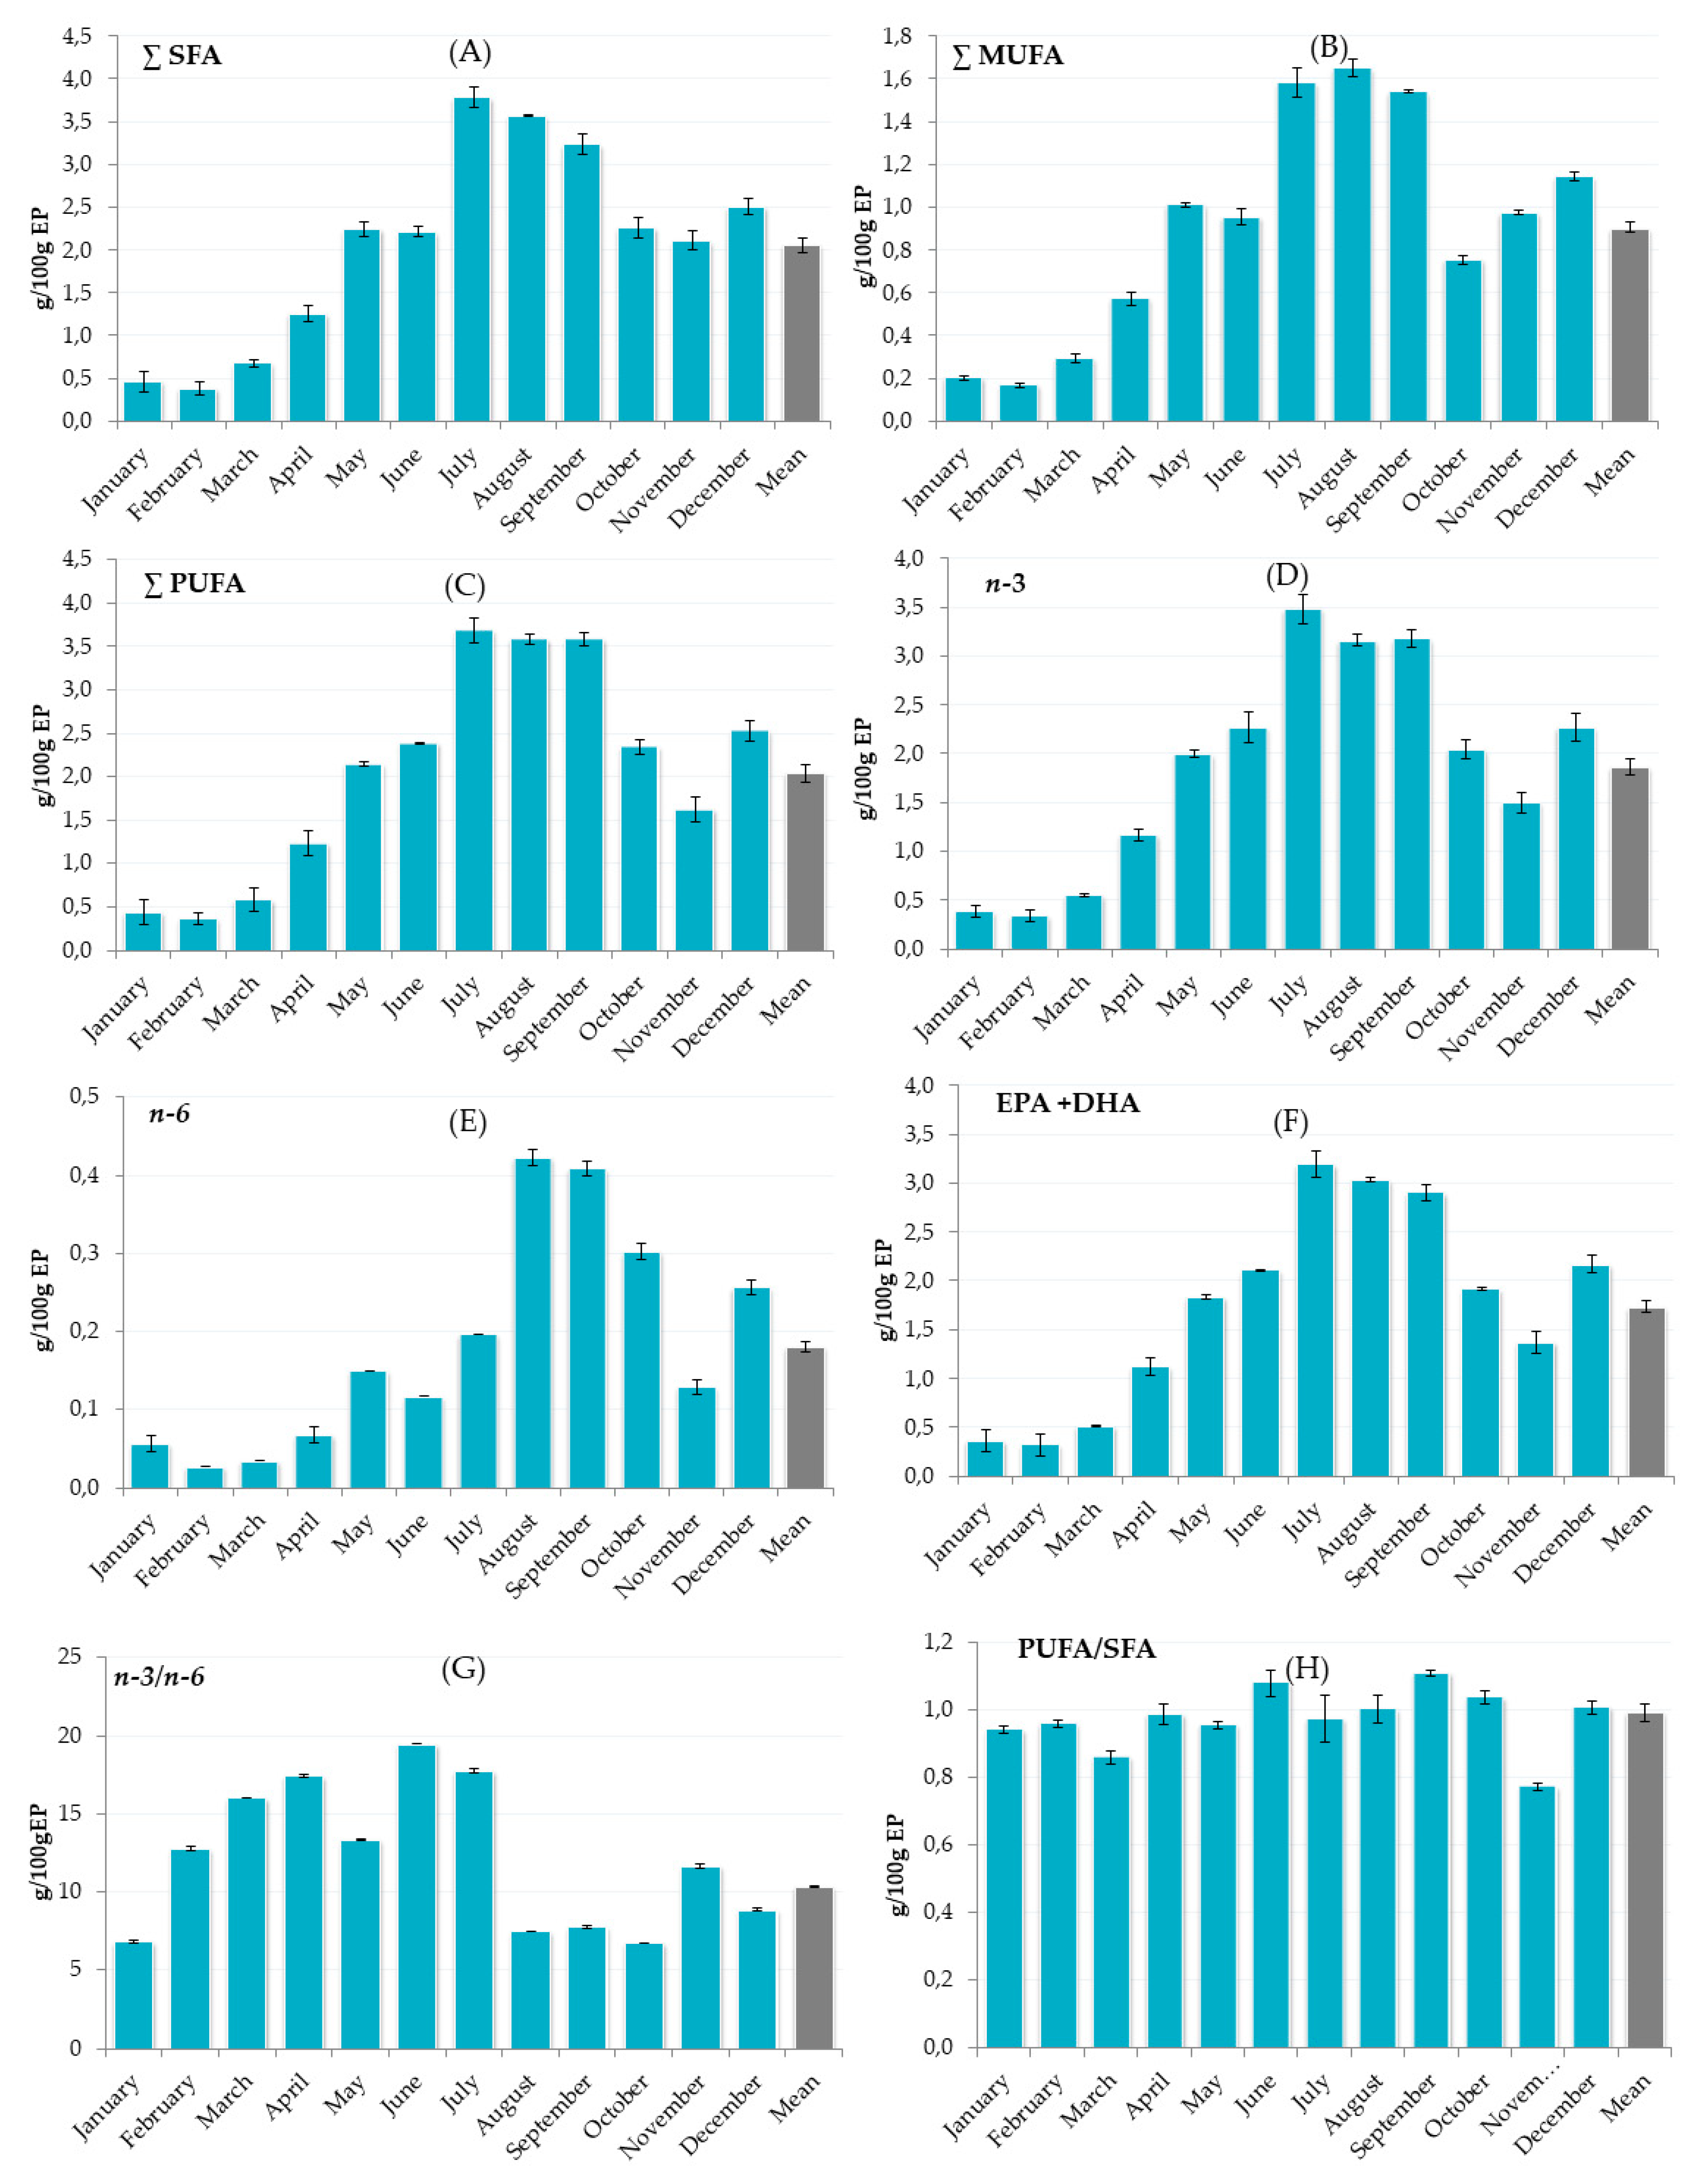
3.3. Fatty Acids Composition of Sardines
4. Conclusions
Author Contributions
Funding
Acknowledgments
Conflicts of Interest
References
- Soldo, B.; Šimat, V.; Vlahović, J.; Skroza, D.; Ljubenkov, I.; Generalić Mekinić, I. High quality oil extracted form sardine by-products as an alternative to whole sardines: Production and refining. Eur. J. Lipid Sci. Technol. 2019, 121, 1800513. [Google Scholar] [CrossRef]
- Delgado, A.M.; Almeida, M.D.V.; Parisi, S. Fish, meat and other animal protein sources. In Chemistry of the Mediterranean Diet; Springer International Publishing: Cham, Switzerland, 2017; pp. 177–207. [Google Scholar] [CrossRef]
- Zorica, B.; Kec, V.C.; Vidjak, O.; Kraljević, V.; Brzulja, G. Seasonal pattern of population dynamics, spawning activities, and diet composition of sardine (Sardina pilchardus Walbaum) in the eastern Adriatic Sea. Turk. J. Zool. 2017, 41, 892–900. [Google Scholar] [CrossRef]
- Šimat, V.; Vlahović, J.; Soldo, B.; Skroza, D.; Ljubenkov, I.; Generalić Mekinić, I. Production and refinement of omega-3 rich oils from processing by-products of farmed fish species. Foods 2019, 8, 125. [Google Scholar] [CrossRef] [Green Version]
- Šimat, V.; Vlahović, J.; Soldo, B.; Generalić Mekinić, I.; Čagalj, M.; Hamed, I.; Skroza, D. Production and characterization of crude oils from seafood processing byproducts. Food Biosci. 2020, 33, 100484. [Google Scholar] [CrossRef]
- Beveridge, M.C.; Thilsted, S.H.; Phillips, M.J.; Metian, M.; Troell, M.; Hall, S.J. Meeting the food and nutrition needs of the poor: The role of fish and the opportunities and challenges emerging from the rise of aquaculture. J. Fish Biol. 2013, 83, 1067–1084. [Google Scholar] [CrossRef] [Green Version]
- Béné, C.; Barange, M.; Subasinghe, R.; Pinstrup-Andersen, P.; Merino, G.; Hemre, G.I.; Williams, M. Feeding 9 billion by 2050–Putting fish back on the menu. Food Secur. 2015, 7, 261–274. [Google Scholar] [CrossRef] [Green Version]
- Sarojnalini, C.; Hei, A. Fish as an Important Functional Food for Quality Life. Available online: https://www.intechopen.com/books/functional-foods (accessed on 2 May 2020).
- Dale, H.F.; Madsen, L.; Lied, G.A. Fish–derived proteins and their potential to improve human health. Nutr. Rev. 2019, 77, 572–583. [Google Scholar] [CrossRef] [PubMed] [Green Version]
- Grover, Z.; Ee, L.C. Protein energy malnutrition. Pediatr. Clin. 2009, 56, 1055–1068. [Google Scholar] [CrossRef]
- Tørris, C.; Molin, M.; Småstuen, M.C. Fish consumption and its possible preventive role on the development and prevalence of metabolic syndrome-a systematic review. Diabeto.l Metab. Syndr. 2014, 6, 112. [Google Scholar] [CrossRef] [Green Version]
- Aidos, I.; van der Padt, A.; Luten, J.B.; Boom, R.M. Seasonal changes in crude and lipid composition of herring fillets, byproducts, and respective produced oils. J. Agric. Food Chem. 2002, 50, 4589–4599. [Google Scholar] [CrossRef]
- Hamre, K.; Lie, Ø.; Sandnes, K. Seasonal development of nutrient composition, lipid oxidation and colour of fillets from Norwegian spring-spawning herring (Clupea harengus L.). Food Chem. 2003, 82, 441–446. [Google Scholar] [CrossRef]
- Kacem, M.; Sellami, M.; Kammoun, W.; Frikha, F.; Miled, N.; Ben Rebah, F. Seasonal variations in proximate and fatty acid composition of viscera of Sardinella aurita, Sarpa salpa, and Sepia officinalis from Tunisia. J. Aquat. Food Prod. Technol. 2001, 20, 233–246. [Google Scholar] [CrossRef]
- Šimat, V.; Bogdanović, T. Seasonal changes in proximate composition of anchovy (Engraulis encrasicolus, L.) from the central Adriatic. Acta Adriat. 2012, 53, 125–132. [Google Scholar]
- Kudale, R.G.; Rathod, J.L. Nutritional value of fringe scale sardine, Sardinella fimbriata (Cuv. and Val.) from Karwar waters. Int. J. Fish Aquat. Stud. 2015, 3, 6–9. [Google Scholar]
- Bagthasingh, C.; Aran, S.S.; Vetri, V.; Innocen, A.; Kannaiyan, S.K. Seasonal variation in the proximate composition of sardine (Sardinella gibbosa) from Thoothukudi coast. Indian J. Geo-Mar. Sci. 2016, 45, 800–806. [Google Scholar]
- Rebah, F.B.; Abdelmouleh, A.; Kammoun, W.; Yezza, A. Seasonal variation of lipid content and fatty acid composition of Sardinella aurita from the Tunisian coast. J. Mar. Biol. Assoc. UK 2010, 90, 569–573. [Google Scholar] [CrossRef]
- Som, C.R.; Radhakrishnan, C.K. Seasonal variation in the fatty acid composition of Sardinella longiceps and Sardinella fimbriata: Implications for nutrition and pharmaceutical industry. Indian J. Geo-Mar. Sci. 2013, 42, 206–210. [Google Scholar]
- Šimat, V.; Bogdanović, T.; Poljak, V.; Petričević, S. Changes in fatty acid composition, atherogenic and thrombogenic health lipid indices and lipid stability of bogue (Boops boops Linnaeus, 1758) during storage on ice: Effect of fish farming activities. J. Food Compos. Anal. 2015, 40, 120–125. [Google Scholar] [CrossRef]
- Özyurt, G.; Polat, A. Amino acid and fatty acid composition of wild sea bass (Dicentrarchus labrax): A seasonal differentiation. Eur. Food Res. Tech. 2006, 222, 316–320. [Google Scholar] [CrossRef]
- Shirai, N.; Terayama, M.; Takeda, H. Effect of season on the fatty acid composition and free amino acid content of the sardine Sardinops melanostictus. Comp. Biochem. Physiol. B Biochem. Mol. Biol. 2002, 131, 387–393. [Google Scholar] [CrossRef]
- Zlatanos, S.; Laskaridis, K. Seasonal variation in the fatty acid composition of three Mediterranean fish–sardine (Sardina pilchardus), anchovy (Engraulis encrasicolus) and picarel (Spicara smaris). Food Chem. 2007, 103, 725–728. [Google Scholar] [CrossRef]
- Bouderoua, K.; Mourot, J.; Benmehdi-Tabet-Aoull, F.; Selselet-Attou, G. The effects of season and site of catch on morphometric characteristics, mineral content, and fatty acids of sardines (Sardina pilchardus) caught on the Algerian coast. J. Aquat. Food Prod. Technol. 2011, 20, 412–420. [Google Scholar] [CrossRef]
- Zotos, A.; Vouzanidou, M. Seasonal changes in composition, fatty acid, cholesterol and mineral content of six highly commercial fish species of Greece. Food Sci. Technol. Int. 2012, 18, 139–149. [Google Scholar] [CrossRef]
- Zaghbib, I.; Arafa, S.; El Adab, S.; Hassouna, M. Effects of season and region on the biochemical and fatty acid compositions of the Sardina pilchardus. Int. J. Adv. Eng. Manag. Res. 2019, 4, 162–173. [Google Scholar]
- AOAC. The Official Method of Analysis of the Association of Chemistry, 17th ed.; Association of Official Analytical Chemists: Gaithersburg, MD, USA, 2002. [Google Scholar]
- Bligh, E.G.; Dyer, W.J. A rapid method of total lipid extraction and purification. Can. J. Biochem. Physiol. 1959, 37, 911–917. [Google Scholar] [CrossRef] [Green Version]
- Marušić, N.; Aristoy, M.-C.; Toldra, F. Nutritional pork meat compounds as affected by ham dry-curing. Meat Sci. 2013, 93, 53–60. [Google Scholar] [CrossRef]
- Bidlingmeyer, B.A.; Cohen, S.A.; Tarvin, T.L.; Frost, B.A. New rapid high sensitivity analysis of amino acids in food type samples. J. Assoc. Anal. Chem. 1987, 70, 241–247. [Google Scholar] [CrossRef]
- Flores, M.; Aristoy, M.C.; Spanier, A.M.; Toldrá, F. Non-volatile components effects on quality of “serrano” dry-cured ham as related to processing time. J. Food Sci. 1997, 62, 1235–1239. [Google Scholar] [CrossRef]
- FAO/INFOODS. Guidelines for Converting Units, Denominators and Expressions; Food and Agriculture Organization of the United Nations: Rome, Italy, 2012; p. 53. [Google Scholar]
- Betulla Morello, E.; Arneri, E. Anchovy and Sardine in the Adriatic Sea—An ecological review. In Oceanography and Marine Biology an Annual Review, 1st ed.; Gibson, R.N., Atkinson, R.J.A., Gordon, J.D.M., Eds.; CRC Press: Boca Raton, FL, USA, 2009; Volume 47, pp. 209–256. [Google Scholar]
- Pethybridge, H.; Bodin, N.; Arsenault-Pernet, E.J.; Bourdeix, J.H.; Brisset, B.; Bigot, J.L.; Ross, D.; Peter, M. Temporal and inter-specific variations in forage fish feeding conditions in the NW Mediterranean: Lipid content and fatty acid compositional changes. Mar. Ecol. Prog. Ser. 2014, 512, 39–54. [Google Scholar] [CrossRef] [Green Version]
- Zorica, B.; Anđelić, I.; Keč, V.Č. Sardine (Sardina pilchardus) spawning in the light of fat content analysis. Sci. Mar. 2019, 83, 207–213. [Google Scholar] [CrossRef]
- Bandarra, N.M.; Marçalo, A.; Cordeiro, A.R.; Pousão-Ferreira, P. Sardine (Sardina pilchardus) lipid composition: Does it change after one year in captivity? Food Chem. 2018, 244, 408–413. [Google Scholar] [CrossRef] [PubMed]
- Rosa, R.; Gonzalez, L.; Broitman, B.R.; Garrido, S.; Santos, A.M.P.; Nunes, M.L. Bioenergetics of small pelagic fishes in upwelling systems: Relationship between fish condition, coastal ecosystem dynamics and fisheries. Mar. Ecol. Prog. Ser. 2010, 410, 205–218. [Google Scholar] [CrossRef]
- Bandarra, N.M.; Batista, I.; Nunes, M.L.; Empis, J.M.; Christie, W.W. Seasonal changes in lipid composition of sardine (Sardina pilchardus). J. Food Sci. 1997, 62, 40–42. [Google Scholar] [CrossRef]
- Wu, G. Amino acids: Metabolism, functions, and nutrition. Amino Acid. 2009, 37, 1–17. [Google Scholar] [CrossRef]
- Mohanty, B.; Mahanty, A.; Ganguly, S.; Sankar, T.V.; Chakraborty, K.; Rangasamy, A.; Paul, B.; Sarma, D.; Mathew, S.; Asha, K.K.; et al. Amino acid compositions of 27 food fishes and their importance in clinical nutrition. J. Amino Acid. 2014, 2014, 269797. [Google Scholar] [CrossRef]
- Tortorella, V.; Masciari, P.; Pezzi, M.; Mola, A.; Tiburzi, S.P.; Zinzi, M.C.; Scozzafava, A.; Verre, M. Histamine poisoning from ingestion of fish or scombroid syndrome. Case Rep. Emerg. Med. 2014, 2014, 482531. [Google Scholar] [CrossRef]
- Peterson, J.W.; Boldogh, I.; Popov, V.L.; Saini, S.S.; Chopra, A.K. Anti-inflammatory and antisecretory potential of histidine in Salmonella-challenged mouse small intestine. Lab. Invest. 1998, 78, 523–534. [Google Scholar]
- Vera-Aviles, M.; Vantana, E.; Kardinasari, E.; Koh, N.L.; Latunde-Dada, G.O. Protective role of histidine supplementation against oxidative stress damage in the management of anemia of chronic kidney disease. Pharmaceuticals 2018, 11, 111. [Google Scholar] [CrossRef] [Green Version]
- FAO. Dietary Protein Quality Evaluation in Human Nutrition; FAO Food and Nutrition Paper 92; Food and Agriculture Organization of the United Nations: Rome, Italy, 2013; p. 79. [Google Scholar]
- EFSA Panel on Dietetic Products, Nutrition, and Allergies (NDA). Scientific Opinion on Dietary Reference Values for fats, including saturated fatty acids, polyunsaturated fatty acids, monounsaturated fatty acids, trans fatty acids, and cholesterol. EFSA J. 2010, 8, 1461. [Google Scholar] [CrossRef] [Green Version]
- Kinsella, J.E.; Broughton, K.S.; Whelan, J.W. Dietary unsaturated fatty acids: Interactions and possible needs in relation to eicosanoid synthesis. J. Nutr. Biochem. 1990, 1, 123–141. [Google Scholar] [CrossRef]


| Proximate Composition | January | February | March | April | May | June | July | August | September | October | November | December | Mean |
|---|---|---|---|---|---|---|---|---|---|---|---|---|---|
| Moisture | 78.6 ± 0.24 | 78.8 ± 0.21 | 78.1 ± 0.14 | 76.4 ± 0.21 | 73.8 ± 0.22 | 73.6 ± 0.09 | 69.67 ± 0.15 | 69.4 ± 0.24 | 69.8 ± 0.20 | 73.8 ± 0.22 | 74.5 ± 0.16 | 72.9 ± 0.09 | 73.0 ± 0.14 |
| Lipid | 1.40 ± 0.14 | 1.18 ± 0.22 | 1.91 ± 0.14 | 3.64 ± 0.84 | 6.23 ± 0.62 | 6.40 ± 0.14 | 10.3 ± 0.35 | 10.6 ± 1.14 | 10.1 ± 0.74 | 6.18 ± 0.29 | 5.45 ± 0.87 | 7.10 ± 0.80 | 5.87 ± 1.04 |
| Protein | 19.5 ± 0.26 | 20.0 ± 0.14 | 19.8 ± 0.24 | 19.0 ± 0.24 | 19.1 ± 0.24 | 19.2 ± 0.24 | 20.2 ± 0.24 | 20.1 ± 0.24 | 20.1 ± 0.24 | 19.1 ± 0.24 | 19.2 ± 0.24 | 19.5 ± 0.24 | 19.6 ± 0.24 |
| Ash | 1.88 ± 0.01 | 2.10 ± 0.01 | 2.30 ± 0.07 | 2.11 ± 0.04 | 1.68 ± 0.03 | 1.50 ± 0.03 | 1.45 ± 0.06 | 1.63 ± 0.04 | 1.68 ± 0.04 | 1.87 ± 0.07 | 1.91 ± 0.06 | 1.83 ± 0.04 | 1.83 ± 0.04 |
| Amino Acid | January | February | March | April | May | June | July | August | September | October | November | December | Mean |
|---|---|---|---|---|---|---|---|---|---|---|---|---|---|
| Aspartic acid | 33.1 ± 4.4 | 26.0 ± 2.7 | 40.6 ± 5.7 | 11.2 ± 2.9 | 5.67 ± 1.6 | 6.63 ± 2.3 | 5.82 ± 1.44 | 15.0 ± 4.1 | 6.19 ± 2.20 | 5.32 ± 2.15 | 6.34 ± 1.66 | 7.60 ± 0.10 | 14.1 |
| Glutamic acid | 30.3 ± 0.3 | 24.6 ± 0.7 | 38.9 ± 0.2 | 11.5 ± 0.9 | 5.30 ± 0.01 | 6.96 ± 0.15 | 7.76 ± 1.31 | 12.8 ± 0.2 | 6.07 ± 0.15 | 7.08 ± 0.10 | 7.84 ± 0.11 | 7.11 ± 0.11 | 13.9 |
| Hydroxyproline | 19.5 ± 0.3 | 27.8 ± 0.02 | 28.9 ± 0.6 | 13.9 ± 1.2 | 11.2 ± 0.1 | 13.1 ± 0.3 | 14.5 ± 0.1 | 15.3 ± 0.3 | 9.92 ± 0.22 | 8.12 ± 0.04 | 11.3 ± 0.2 | 9.28 ± 0.30 | 15.2 |
| Serine | n.d. | n.d. | n.d. | n.d. | n.d. | n.d. | n.d. | n.d. | n.d. | n.d. | n.d. | n.d. | n.d. |
| Asparagine | 25.0 ± 0.5 | 18.3 ± 0.5 | 32.2 ± 0.4 | 9.04 ± 0.92 | 3.92 ± 0.1 | 6.24 ± 0.1 | 7.33 ± 0.18 | 11.4 ± 0.4 | 5.17 ± 0.12 | 5.22 ± 0.05 | 7.37 ± 0.13 | 5.75 ± 0.10 | 11.4 |
| Glycine | 18.2 ± 3.1 | 13.9 ± 1.6 | 25.6 ± 2.9 | 8.98 ± 0.12 | 4.92 ± 0.2 | 12.0 ± 0.5 | 12.8 ± 0.9 | 16.7 ± 1.5 | 10.3 ± 0.6 | 11.1 ± 0.67 | 11.5 ± 1.1 | 12.0 ± 0.2 | 13.2 |
| Glutamine | 14.9 ± 2.8 | 10.9 ± 0.4 | 18.7 ± 1.8 | 4.40 ± 0.3 | 1.25 ± 0.1 | 1.22 ± 0.01 | 1.84 ± 0.07 | 2.84 ± 0.11 | 3.68 ± 0.12 | 1.33 ± 0.10 | 2.67 ± 0.02 | 1.84 ± 0.04 | 5.46 |
| Histidine * | 159 ± 2.4 | 149 ± 2.9 | 244 ± 1.9 | 124 ± 9.8 | 58.7 ± 0.6 | 49.5 ± 0.4 | 56.4 ± 0.6 | 60.6 ± 0.9 | 54.1 ± 0.2 | 44.2 ± 0.11 | 56.5 ± 0.6 | 66.2 ± 0.6 | 93.4 |
| Threonine * | 96.1 ± 0.1 | 60.9 ± 0.8 | 95.1 ± 1.0 | 52.5 ± 6.4 | 36.5 ± 1.5 | 79.7 ± 1.3 | 67.9 ± 3.2 | 71.0 ± 4.4 | 102 ± 0.2 | 77.9 ± 0.27 | 73.9 ± 0.5 | 58.6 ± 1.1 | 72.7 |
| Alanine | 13.8 ± 0.1 | 9.95 ± 0.3 | 17.6 ± 0.5 | 4.82 ± 0.5 | 2.19 ± 0.1 | 7.34 ± 3.01 | 6.25 ± 0.44 | 9.12 ± 0.04 | 6.84 ± 2.50 | 7.14 ± 2.98 | 5.35 ± 0.16 | 4.42 ± 0.17 | 7.91 |
| Arginine | 97.6 ± 0.6 | 76.7 ± 1.6 | 123 ± 0.5 | 47.8 ± 3.5 | 23.0 ± 0.4 | 21.8 ± 0.1 | 30.4 ± 0.6 | 36.5 ± 0.2 | 23.9 ± 0.1 | 17.9 ± 0.1 | 24.9 ± 0.10 | 21.8 ± 0.3 | 45.4 |
| Proline | 21.3 ± 0.02 | 14.5 ± 0.1 | 25.4 ± 0.2 | 8.31 ± 0.9 | 3.28 ± 0.4 | 4.49 ± 0.12 | 8.03 ± 0.31 | 10.1 ± 0.4 | 4.16 ± 0.02 | 3.87 ± 0.10 | 5.57 ± 0.31 | 3.43 ± 0.05 | 9.36 |
| Tyrosine | 32.7 ± 0.4 | 15.5 ± 0.7 | 32.2 ± 0.4 | 6.82 ± 0.4 | 3.09 ± 0.2 | 3.04 ± 0.4 | 4.15 ± 0.80 | 8.98 ± 0.19 | 3.09 ± 0.13 | 2.87 ± 0.38 | 5.26 ± 0.03 | 2.95 ± 0.01 | 10.0 |
| Valine * | 31.7 ± 0.7 | 21.1 ± 0.8 | 34.9 ± 0.4 | 10.3 ± 0.8 | 4.35 ± 0.5 | 6.26 ± 0.24 | 10.1 ± 0.22 | 14.4 ± 0.02 | 6.30 ± 0.18 | 6.11 ± 0.10 | 49.7 ± 0.8 | 6.15 ± 0.05 | 16.8 |
| Methionine * | 16.5 ± 1.3 | 10.1 ± 0.9 | 21.5 ± 0.2 | 6.38 ± 0.3 | 1.91 ± 0.01 | 4.56 ± 1.31 | 5.74 ± 0.04 | 10.6 ± 0.2 | 4.76 ± 0.55 | 4.58 ± 0.72 | 7.38 ± 0.23 | 4.90 ± 0.85 | 8.23 |
| Isoleucine * | 38.1 ± 0.1 | 31.3 ± 0.6 | 25.9 ± 1.1 | 9.79 ± 2.5 | 11.4 ± 0.03 | 6.50 ± 0.16 | 20.1 ± 0.01 | 10.8 ± 0.3 | 6.56 ± 0.33 | 7.11 ± 0.12 | 7.13 ± 0.15 | 7.48 ± 0.21 | 15.2 |
| Leucine * | 53.8 ± 0.2 | 34.8 ± 0.03 | 50.9 ± 0.01 | 16.8 ± 1.9 | 6.20 ± 0.02 | 9.12 ± 0.25 | 15.6 ± 0.02 | 20.8 ± 0.5 | 9.04 ± 0.06 | 8.55 ± 0.24 | 14.1 ± 0.3 | 9.35 ± 0.02 | 20.8 |
| Phenylalanine * | 33.7 ± 0.2 | 19.9 ± 0.2 | 25.4 ± 0.2 | 9.63 ± 1.3 | 3.50 ± 0.1 | 4.02 ± 0.11 | 6.16 ± 0.16 | 9.55 ± 0.17 | 4.44 ± 0.15 | 3.44 ± 0.11 | 5.64 ± 0.09 | 3.73 ± 0.04 | 10.8 |
| Tryptophan * | 25.9 ± 0.1 | 14.7 ± 0.2 | 20.7 ± 0.2 | 8.64 ± 0.3 | 5.05 ± 0.1 | 4.30 ± 0.12 | 6.48 ± 0.03 | 7.07 ± 0.19 | 4.16 ± 0.04 | 3.60 ± 0.03 | 4.41 ± 0.13 | 3.48 ± 0.05 | 9.04 |
| Lysine * | 82.9 ± 1.4 | 43.1 ± 1.6 | 53.0 ± 0.9 | 19.6 ± 1.4 | 9.83 ± 0.1 | 11.1 ± 0.1 | 26.7 ± 0.72 | 23.6 ± 0.3 | 15.5 ± 0.16 | 14.9 ± 0.17 | 15.6 ± 0.6 | 17.7 ± 0.1 | 27.8 |
| Total | 843.6 | 622.9 | 953.9 | 384.4 | 201.3 | 257.8 | 314.1 | 367.1 | 286.5 | 240.4 | 322.3 | 253.7 | 420.6 |
| Fatty Acid (FA) | January | February | March | April | May | June | July | August | September | October | November | December | Mean |
|---|---|---|---|---|---|---|---|---|---|---|---|---|---|
| C14:0 | 0.10 ± 0.01 | 0.06 ± 0.01 | 0.11 ± 0.04 | 0.18 ± 0.02 | 0.33 ± 0.04 | 0.38 ± 0.04 | 0.54 ± 0.02 | 0.61 ± 0.06 | 0.61 ± 0.02 | 0.44 ± 0.03 | 0.29 ± 0.02 | 0.53 ± 0.01 | 0.35 |
| C14:1 | n.d. | n.d. | n.d. | n.d. | n.d. | n.d. | n.d. | n.d. | n.d. | n.d. | n.d. | n.d. | n.d. |
| C15:0 | 0.01 ± 0.01 | 0.01 ± 0.00 | 0.03 ± 0.00 | 0.05 ± 0.01 | 0.05 ± 0.01 | 0.09 ± 0.04 | 0.20 ± 0.02 | 0.22 ± 0.04 | 0.17 ± 0.03 | 0.10 ± 0.02 | 0.05 ± 0.01 | 0.04 ± 0.00 | 0.08 |
| C15:1 | n.d. | n.d. | n.d. | n.d. | n.d. | n.d. | n.d. | n.d. | n.d. | n.d. | n.d. | n.d. | n.d. |
| C16:0 | 0.21 ± 0.03 | 0.20 ± 0.04 | 0.33 ± 0.08 | 0.64 ± 0.12 | 1.12 ± 0.21 | 1.18 ± 0.16 | 2.19 ± 0.22 | 1.66 ± 0.19 | 1.61 ± 0.14 | 0.99 ± 0.11 | 1.12 ± 0.09 | 1.27 ± 0.14 | 1.04 |
| C16:1 | 0.08 ± 0.02 | 0.06 ± 0.01 | 0.11 ± 0.01 | 0.14 ± 0.02 | 0.28 ± 0.01 | 0.24 ± 0.08 | 0.33 ± 0.04 | 0.39 ± 0.06 | 0.34 ± 0.09 | 0.24 ± 0.06 | 0.30 ± 0.02 | 0.38 ± 0.04 | 0.24 |
| C17:0 | 0.02 ± 0.00 | 0.01 ± 0.00 | 0.01 ± 0.00 | 0.02 ± 0.00 | 0.03 ± 0.00 | 0.07 ± 0.01 | 0.12 ± 0.01 | 0.43 ± 0.11 | 0.37 ± 0.06 | 0.22 ± 0.04 | 0.10 ± 0.02 | 0.08 ± 0.01 | 0.12 |
| C17:1 | 0.02 ± 0.00 | n.d. | n.d. | 0.01 ± 0.00 | 0.01 ± 0.00 | 0.01 ± 0.00 | 0.01 ± 0.00 | 0.09 ± 0.01 | 0.21 ± 0.08 | 0.10 ± 0.01 | 0.12 ± 0.04 | 0.02 ± 0.00 | 0.05 |
| C18:0 | 0.11 ± 0.03 | 0.07 ± 0.02 | 0.16 ± 0.01 | 0.25 ± 0.03 | 0.53 ± 0.09 | 0.36 ± 0.02 | 0.57 ± 0.09 | 0.48 ± 0.03 | 0.30 ± 0.02 | 0.29 ± 0.09 | 0.34 ± 0.08 | 0.32 ± 0.07 | 0.31 |
| C18:1n-9t | n.d. | n.d. | n.d. | n.d. | 0.01 ± 0.00 | 0.01 ± 0.00 | 0.02 ± 0.00 | 0.01 ± 0.00 | 0.01 ± 0.00 | n.d. | n.d. | 0.01 ± 0.00 | 0.01 |
| C18:1n-9c | 0.08 ± 0.01 | 0.09 ± 0.01 | 0.15 ± 0.03 | 0.31 ± 0.02 | 0.58 ± 0.08 | 0.58 ± 0.06 | 0.91 ± 0.04 | 1.02 ± 0.08 | 0.81 ± 0.02 | 0.33 ± 0.01 | 0.44 ± 0.04 | 0.63 ± 0.03 | 0.49 |
| C18:2n-6t | n.d. | n.d. | n.d. | n.d. | 0.01 ± 0.00 | n.d. | 0.02 ± 0.00 | 0.01 ± 0.00 | 0.01 ± 0.00 | 0.05 ± 0.01 | 0.01 ± 0.00 | 0.02 ± 0.00 | 0.01 |
| C18:2n-6c | 0.05 ± 0.00 | 0.02 ± 0.00 | 0.03 ± 0.01 | 0.05 ± 0.01 | 0.11 ± 0.01 | 0.08 ± 0.01 | 0.14 ± 0.02 | 0.34 ± 0.02 | 0.22 ± 0.07 | 0.20 ± 0.03 | 0.09 ± 0.01 | 0.16 ± 0.04 | 0.12 |
| C18:3n-6 | n.d. | n.d. | n.d. | n.d. | 0.01 ± 0.00 | 0.01 ± 0.00 | 0.01 ± 0.00 | 0.01 ± 0.00 | n.d. | 0.03 ± 0.00 | n.d. | 0.01 ± 0.00 | 0.01 |
| C18:3n-3 | n.d. | n.d. | n.d. | 0.02 ± 0.00 | 0.05 ± 0.01 | 0.08 ± 0.01 | 0.10 ± 0.02 | 0.01 ± 0.00 | 0.08 ± 0.01 | 0.05 ± 0.01 | n.d. | 0.01 ± 0.00 | 0.03 |
| C20:0 | n.d. | n.d. | 0.01 ± 0.00 | 0.02 ± 0.00 | 0.01 ± 0.00 | 0.02 ± 0.00 | 0.03 ± 0.01 | 0.03 ± 0.00 | 0.05 ± 0.01 | 0.04 ± 0.00 | 0.01 ± 0.00 | 0.04 ± 0.01 | 0.02 |
| C20:1n-9 | 0.01 ± 0.00 | 0.01 ± 0.00 | 0.02 ± 0.00 | 0.07 ± 0.01 | 0.08 ± 0.01 | 0.07 ± 0.01 | 0.11 ± 0.03 | 0.12 ± 0.03 | 0.06 ± 0.01 | 0.05 ± 0.01 | 0.07 ± 0.01 | 0.07 ± 0.02 | 0.06 |
| C20:2n-6 | n.d. | n.d. | n.d. | 0.01 ± 0.00 | 0.02 ± 0.00 | 0.02 ± 0.00 | 0.03 ± 0.00 | 0.03 ± 0.00 | n.d. | 0.03 ± 0.01 | 0.02 ± 0.00 | 0.07 ± 0.01 | 0.02 |
| C21:0 | 0.01 ± 0.00 | 0.01 ± 0.00 | 0.01 ± 0.00 | 0.03 ± 0.01 | 0.04 ± 0.01 | 0.04 ± 0.01 | 0.04 ± 0.00 | 0.01 ± 0.00 | 0.05 ± 0.01 | 0.05 ± 0.01 | 0.03 ± 0.01 | 0.09 ± 0.01 | 0.03 |
| C20:3n-6 | n.d. | n.d. | n.d. | n.d. | n.d. | n.d. | n.d. | n.d. | 0.11 ± 0.03 | n.d. | n.d. | n.d. | 0.01 |
| C20:4n-6 | n.d. | n.d. | n.d. | n.d. | n.d. | n.d. | n.d. | 0.04 ± 0.00 | 0.07 ± 0.01 | n.d. | n.d. | n.d. | 0.01 |
| C20:3n-3 | n.d. | n.d. | 0.01 ± 0.00 | 0.01 ± 0.00 | 0.05 ± 0.01 | 0.01 ± 0.00 | 0.01 ± 0.00 | 0.02 ± 0.00 | 0.02 ± 0.00 | 0.02 ± 0.00 | 0.03 ± 0.00 | 0.02 ± 0.00 | 0.02 |
| C22:0 | 0.01 ± 0.00 | 0.01 ± 0.00 | 0.02 ± 0.00 | 0.04 ± 0.00 | 0.08 ± 0.03 | 0.08 ± 0.01 | 0.03 ± 0.00 | 0.12 ± 0.04 | 0.04 ± 0.01 | 0.08 ± 0.01 | 0.05 ± 0.01 | 0.05 ± 0.01 | 0.05 |
| C20:5n-3 (EPA) | 0.14 ± 0.03 | 0.13 ± 0.04 | 0.20 ± 0.04 | 0.50 ± 0.06 | 0.68 ± 0.06 | 0.91 ± 0.04 | 1.49 ± 0.16 | 1.16 ± 0.11 | 1.13 ± 0.11 | 0.62 ± 0.09 | 0.54 ± 0.11 | 0.85 ± 0.08 | 0.70 |
| C22:1n-9 | n.d. | n.d. | n.d. | n.d. | n.d. | n.d. | n.d. | n.d. | 0.02 | n.d. | n.d. | n.d. | n.d. |
| C22:2n-6 | n.d. | n.d. | n.d. | n.d. | n.d. | n.d. | n.d. | n.d. | n.d. | n.d. | n.d. | n.d. | n.d. |
| C23:0 | n.d. | n.d. | n.d. | n.d. | n.d. | n.d. | n.d. | n.d. | n.d. | 0.02 ± 0.00 | 0.03 ± 0.01 | 0.02 ± 0.00 | 0.01 |
| C22:5n-3 (DPA) | 0.02 ± 0.00 | 0.02 ± 0.00 | 0.03 ± 0.00 | 0.03 ± 0.00 | 0.06 ± 0.01 | 0.07 ± 0.01 | 0.18 ± 0.03 | 0.10 ± 0.01 | 0.17 ± 0.03 | 0.05 ± 0.01 | 0.09 ± 0.02 | 0.08 ± 0.02 | 0.07 |
| C24:0 | 0.01 ± 0.00 | 0.01 ± 0.00 | n.d. | 0.03 ± 0.00 | 0.04 ± 0.00 | 0.01 ± 0.00 | 0.07 ± 0.02 | 0.01 ± 0.00 | 0.04 ± 0.01 | 0.04 ± 0.01 | 0.08 ± 0.02 | 0.05 ± 0.01 | 0.03 |
| C24:1n-9 | 0.01 ± 0.00 | 0.01 ± 0.00 | 0.01 ± 0.00 | 0.04 ± 0.01 | 0.05 ± 0.01 | 0.05 ± 0.00 | 0.20 ± 0.05 | 0.03 ± 0.01 | 0.08 ± 0.01 | 0.03 ± 0.01 | 0.05 ± 0.01 | 0.03 ± 0.01 | 0.05 |
| C22:6n-3 (DHA) | 0.22 ± 0.03 | 0.19 ± 0.04 | 0.31 ± 0.08 | 0.62 ± 0.06 | 1.15 ± 0.11 | 1.20 ± 0.09 | 1.70 ± 0.12 | 1.87 ± 0.14 | 1.77 ± 0.11 | 1.30 ± 0.09 | 0.83 ± 0.06 | 1.31 ± 0.12 | 1.04 |
| Sum of FA | 1.11 | 0.92 | 1.55 | 3.06 | 5.40 | 5.55 | 9.05 | 8.80 | 8.36 | 5.36 | 4.71 | 6.18 | 5.00 |
© 2020 by the authors. Licensee MDPI, Basel, Switzerland. This article is an open access article distributed under the terms and conditions of the Creative Commons Attribution (CC BY) license (http://creativecommons.org/licenses/by/4.0/).
Share and Cite
Šimat, V.; Hamed, I.; Petričević, S.; Bogdanović, T. Seasonal Changes in Free Amino Acid and Fatty Acid Compositions of Sardines, Sardina pilchardus (Walbaum, 1792): Implications for Nutrition. Foods 2020, 9, 867. https://doi.org/10.3390/foods9070867
Šimat V, Hamed I, Petričević S, Bogdanović T. Seasonal Changes in Free Amino Acid and Fatty Acid Compositions of Sardines, Sardina pilchardus (Walbaum, 1792): Implications for Nutrition. Foods. 2020; 9(7):867. https://doi.org/10.3390/foods9070867
Chicago/Turabian StyleŠimat, Vida, Imen Hamed, Sandra Petričević, and Tanja Bogdanović. 2020. "Seasonal Changes in Free Amino Acid and Fatty Acid Compositions of Sardines, Sardina pilchardus (Walbaum, 1792): Implications for Nutrition" Foods 9, no. 7: 867. https://doi.org/10.3390/foods9070867
APA StyleŠimat, V., Hamed, I., Petričević, S., & Bogdanović, T. (2020). Seasonal Changes in Free Amino Acid and Fatty Acid Compositions of Sardines, Sardina pilchardus (Walbaum, 1792): Implications for Nutrition. Foods, 9(7), 867. https://doi.org/10.3390/foods9070867