1. Introduction
In lower limb amputees, especially those with transfemoral amputations, the prosthetic system typically consists of a prosthetic foot, knee, and socket [
1]. Among these components, the prosthetic socket plays a critical role as the interface between the human body and the artificial limb, enabling the transmission of body weight and forces during ambulation [
2,
3,
4]. A well-designed socket aims to optimally distribute load to avoid stress peaks while ensuring safe and comfortable use. Improper socket fit can lead to excessive stress, piston movement (vertical displacement within the socket), skin irritation, ulceration, and in severe cases, re-amputation [
5,
6]. Therefore, socket design and fabrication are considered the most crucial aspects of the prosthetic manufacturing process [
7].
Modern transfemoral sockets are designed to provide adequate pressure distribution and support during use. However, the fabrication process remains largely manual and qualitative, relying heavily on the experience and skill of certified prosthetists [
8,
9,
10,
11,
12]. The acquisition and transfer of the expertise required to produce a well-fitting socket are time-consuming, posing challenges for training and standardization. To address this, there is growing interest in developing quantitative support systems that can assist less experienced prosthetists by integrating anatomical data and biomechanical modeling into the design process [
13].
The most important parameter for evaluating socket comfort is the contact pressure at the interface between the socket and the residual limb [
14]. Several studies have attempted to measure internal socket pressures using various sensor technologies, including strain gauges, sheet-type sensors, and triaxial force sensors [
15,
16,
17,
18,
19,
20,
21,
22]. While many of these investigations have focused on transtibial (below-knee) amputees, research targeting transfemoral (above-knee) sockets remains limited. This is partly due to the increased complexity of transfemoral biomechanics, which involve the loss of the knee joint and greater variability in residual limb geometry and soft tissue composition [
23].
Historically, transfemoral sockets have been categorized into two main types: the quadri-lateral (QL) socket and the ischial-ramal containment (IRC) socket [
24]. The QL socket, developed in the 1950s, features a wide mediolateral (M-L) dimension and narrow anteroposterior (A-P) diameter, aiming to stabilize the femur through anterior and posterior walls [
25]. However, its lack of ischial support often leads to abduction of the prosthesis during mid-stance, causing discomfort and lateral instability [
26]. To overcome these limitations, the IRC socket was introduced, incorporating the concept of normal shape–normal alignment (NSNA) to replicate the adduction of the femur seen in the intact limb [
27]. The IRC socket provides enhanced lateral stability by narrowing the M-L dimension and encapsulating the ischium, thereby improving load transfer and reducing unwanted motion.
Finite element method (FEM) has emerged as a powerful tool for analyzing socket–limb interactions and has been widely applied across various studies to simulate complex geometries, material properties, and loading conditions [
28,
29,
30,
31,
32]. Numerous FEM studies have modeled the residual limb, yet most have focused on generic soft tissue representations and static loading scenarios, often excluding critical anatomical structures such as the pelvis and ischium [
33]. This omission undermines the accuracy of pressure predictions, particularly in IRC sockets where ischial support is fundamental. Only a few studies have explicitly modeled the pelvis, and among them, only one has successfully predicted peak pressure beneath the ischium in agreement with experimental observations [
34].
Recent advances in soft tissue modeling have improved our understanding of mechanical loads transmitted during socket use and their implications for tissue viability and integrity [
35]. However, experimental validation of transfemoral FEM models remains scarce, with only two studies attempting such verification, both yielding limited predictive accuracy. The challenges of modeling transfemoral limbs include complex tissue composition, difficulty in defining socket design criteria due to variable fat distribution, and instability in simulations involving hyperelastic soft tissue materials. These limitations highlight the need for exploratory approaches that focus on establishing feasible modeling workflows rather than attempting full predictive accuracy at this stage.
To begin addressing these challenges, we developed a preliminary workflow that integrates machine-learning-based MRI segmentation with FEM to construct anatomical models of the residual limb and simulate socket–limb interaction. Rather than providing quantitative evaluation or predictive assessment, this study aims to demonstrate the feasibility of an initial MRI-to-FEM pipeline for exploratory analysis of interface pressure. The proposed framework therefore represents an early methodological step toward more comprehensive computational investigations of transfemoral socket–limb mechanics. While substantial refinement and validation are still required before the workflow can support quantitative or clinically meaningful interpretation, its development provides a foundation for future methodological progress.
2. Materials and Methods
2.1. Experimental Measurements
2.1.1. Participants
Four adult unilateral transfemoral amputees (one female and three males) participated in this study (
Table 1). All participants were able to ambulate independently without assistive devices while wearing their own prostheses, which were fitted to custom sockets. Prosthetic alignment and socket fitting were verified by a certified and experienced prosthetist prior to data collection. Written informed consent was obtained from all participants.
2.1.2. Imaging
To acquire internal tissue information for constructing residual limb models, MRI scans were obtained from all four unilateral transfemoral amputee participants. During imaging, participants were positioned in the supine posture. To minimize deformation of the residual limb due to gravity and contact with the scanner bed, a soft blanket was placed beneath the limb. All scans were performed using a Magnetom Symphony Maestro Class 1.5 T MRI system (Siemens Healthineers, Erlangen, Germany).
MRI data were acquired in the transverse plane with the following parameters: 512 × 512 pixel matrix, pixel size of 0.78 mm, and inter-slice spacing of 1 mm. All participants were scanned without wearing their prosthetic sockets. Additionally, for participants S1 and S2, supplementary scans were conducted while wearing IRC sockets, which had been aligned and fitted by a certified prosthetist prior to imaging. In total, 1812 MRI slices were collected and used to construct a dataset for machine learning. Prior to model training, image preprocessing was performed, including noise reduction and contrast enhancement to improve tissue boundary clarity.
2.1.3. Pressure Measurement
To validate the pressure values estimated through simulation, direct measurements of socket-induced pressure on the residual limb were conducted by embedding triaxial force sensors (PD3-32-05-015, NITTA Corporation, Osaka, Japan) at eight locations on the inner wall of the prosthetic socket. These sensors are capable of resolving force in three directions, including two shear components parallel to the skin surface and one normal stress component perpendicular to it.
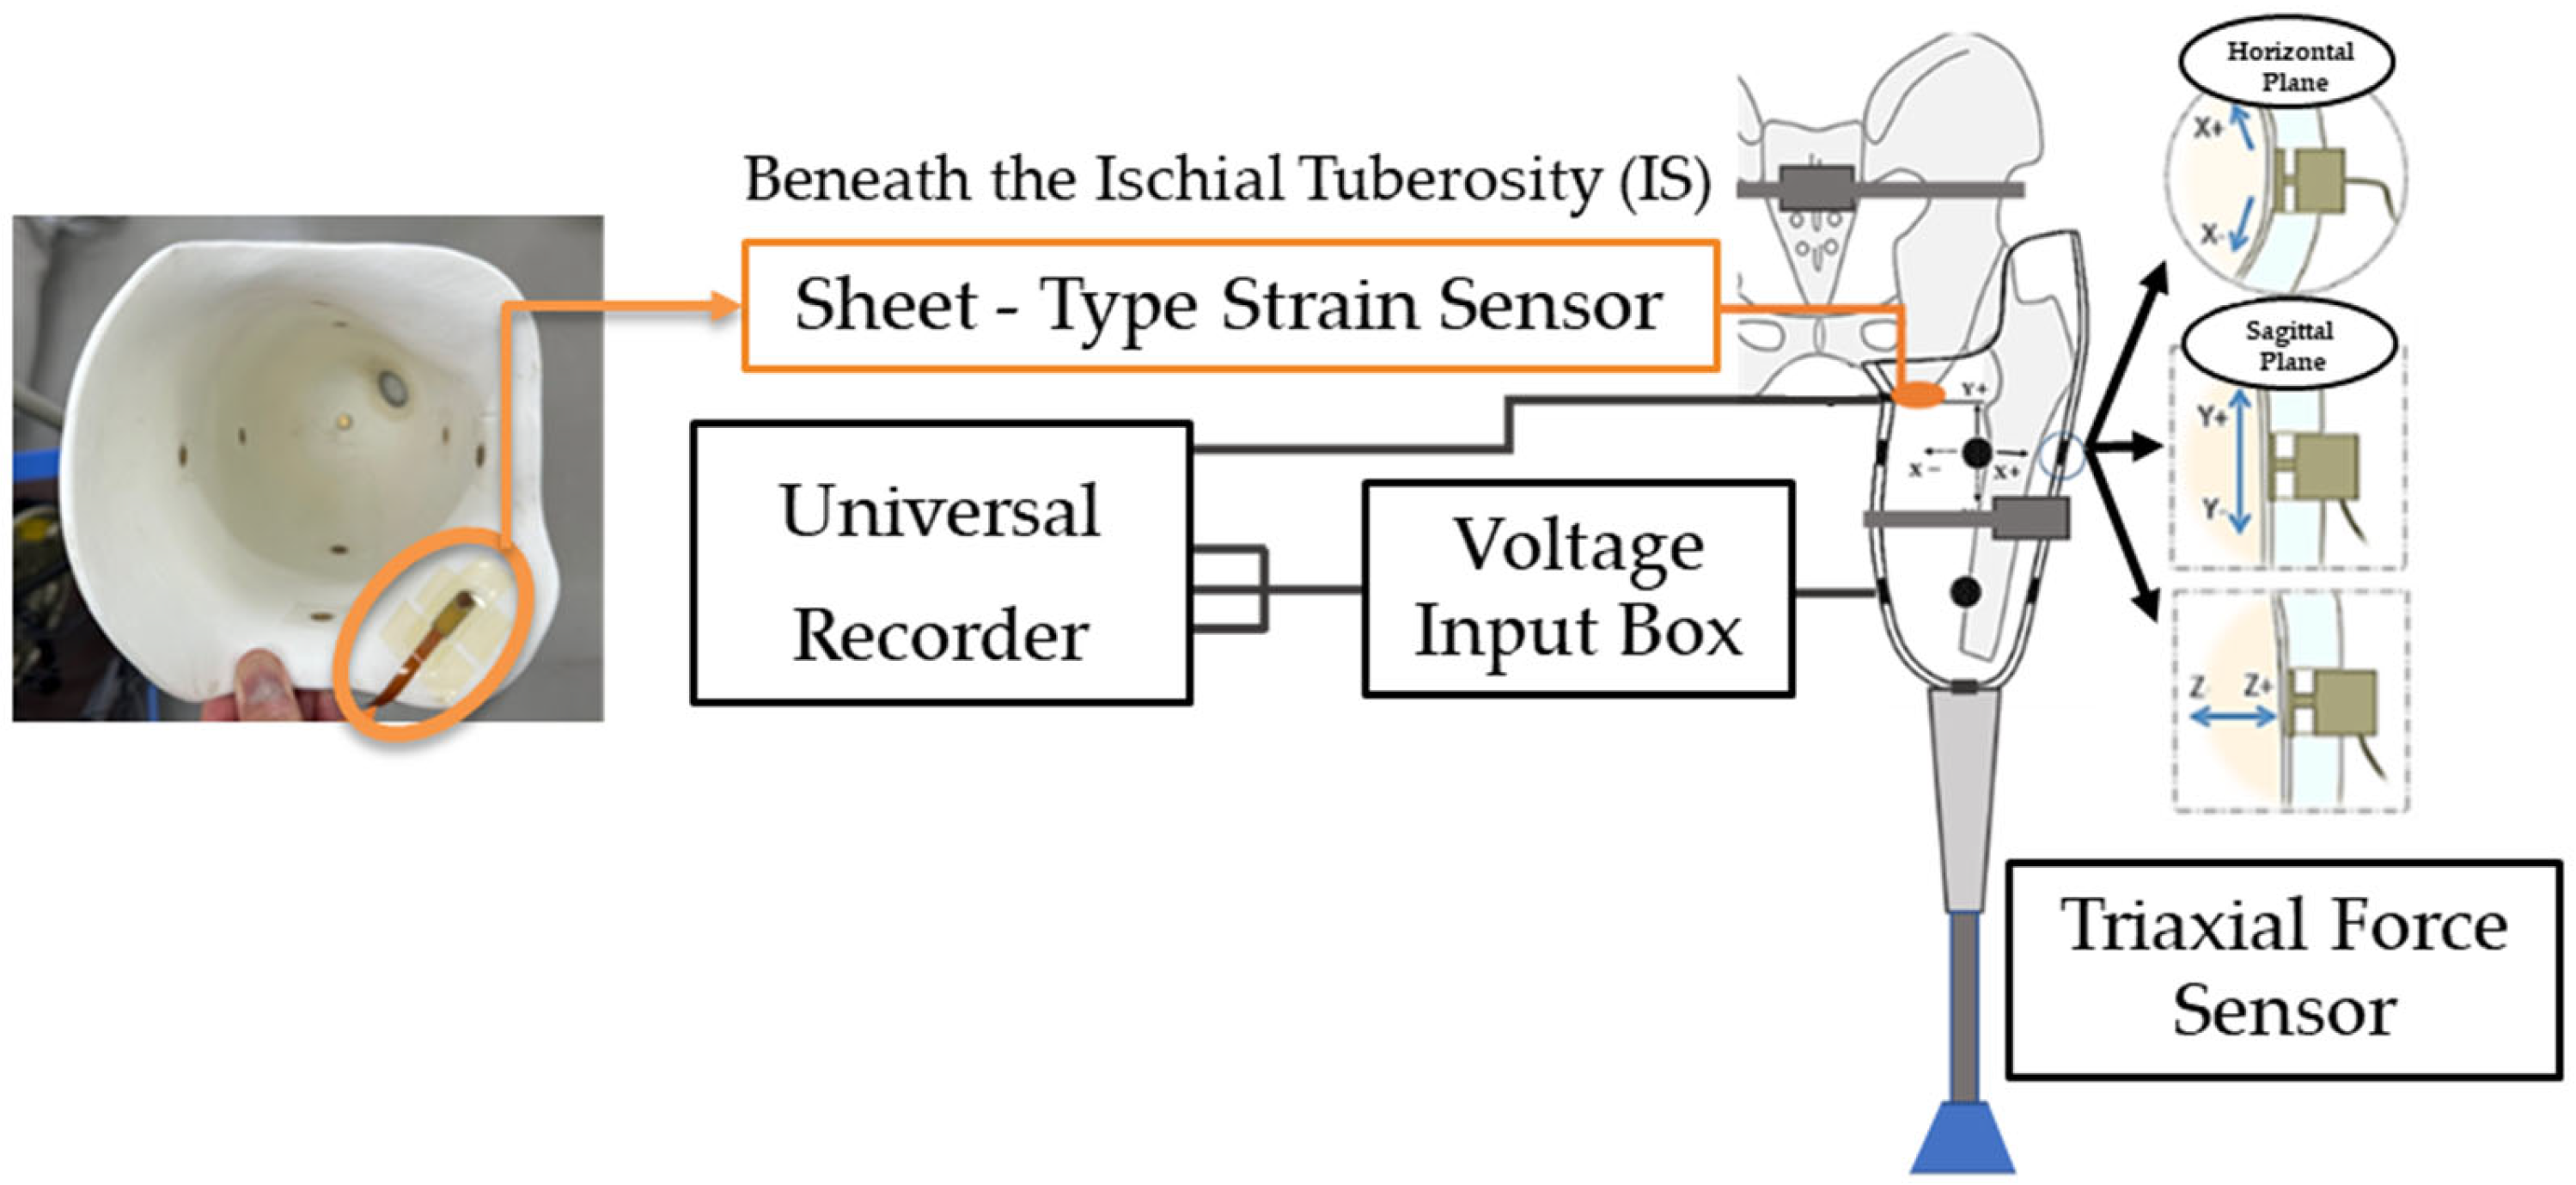
In addition, because embedding a triaxial force sensor directly beneath the ischial tuberosity (IS region) was impractical due to durability and positional constraints, a sheet-type strain sensor (PS-C sensor, Kyowa Electronic Instruments Co., Ltd., Tokyo, Japan) was installed at this location to measure pressure. The system configuration for socket wall pressure measurement is shown in
Figure 1, which also includes the use of a universal recorder (EDX-200A, Nihon Linix Co., Ltd., Tokyo, Japan) and a voltage input box (VI-8A, Kyowa Electronic Instruments Co., Ltd., Tokyo, Japan) for data acquisition.
Although four unilateral transfemoral amputees participated in the imaging phase of this study, pressure measurements were performed on only one participant. This decision was based on practical constraints, including the cost of instrumentation and the physical burden placed on participants during sensor installation and extended data collection. As a result, the validation in this study is limited to a single-subject dataset, which should be interpreted as an initial feasibility-oriented assessment rather than a generalizable evaluation.
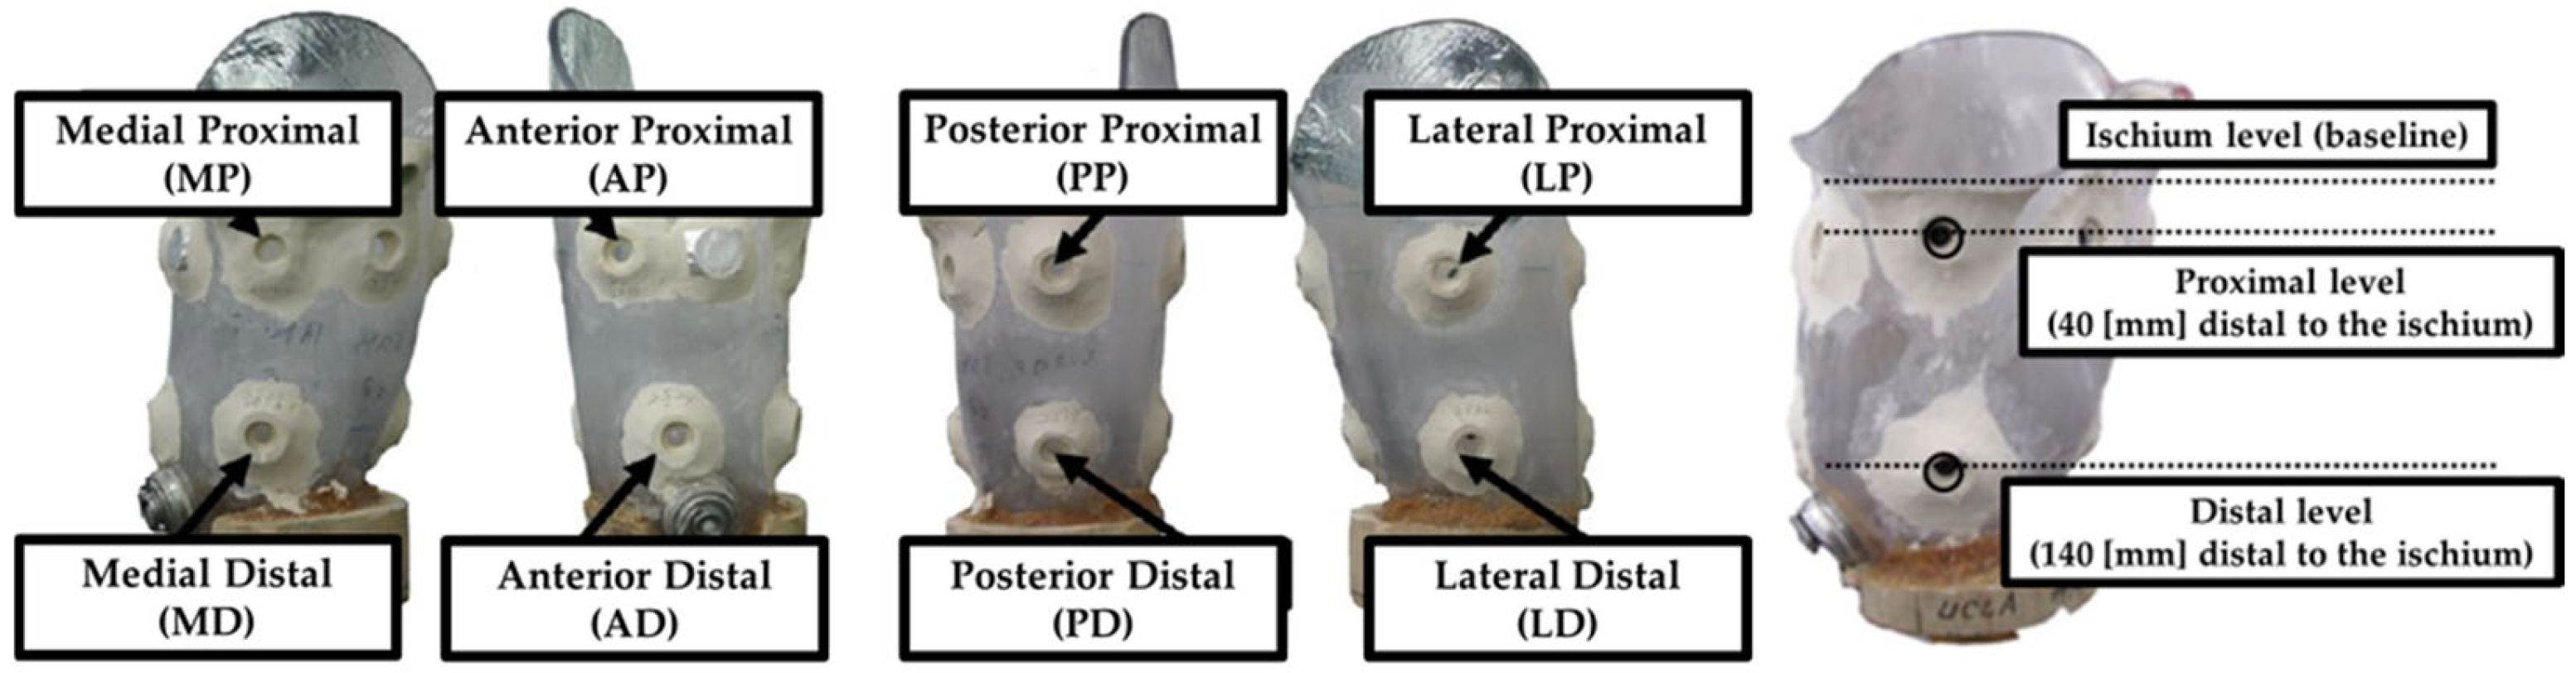
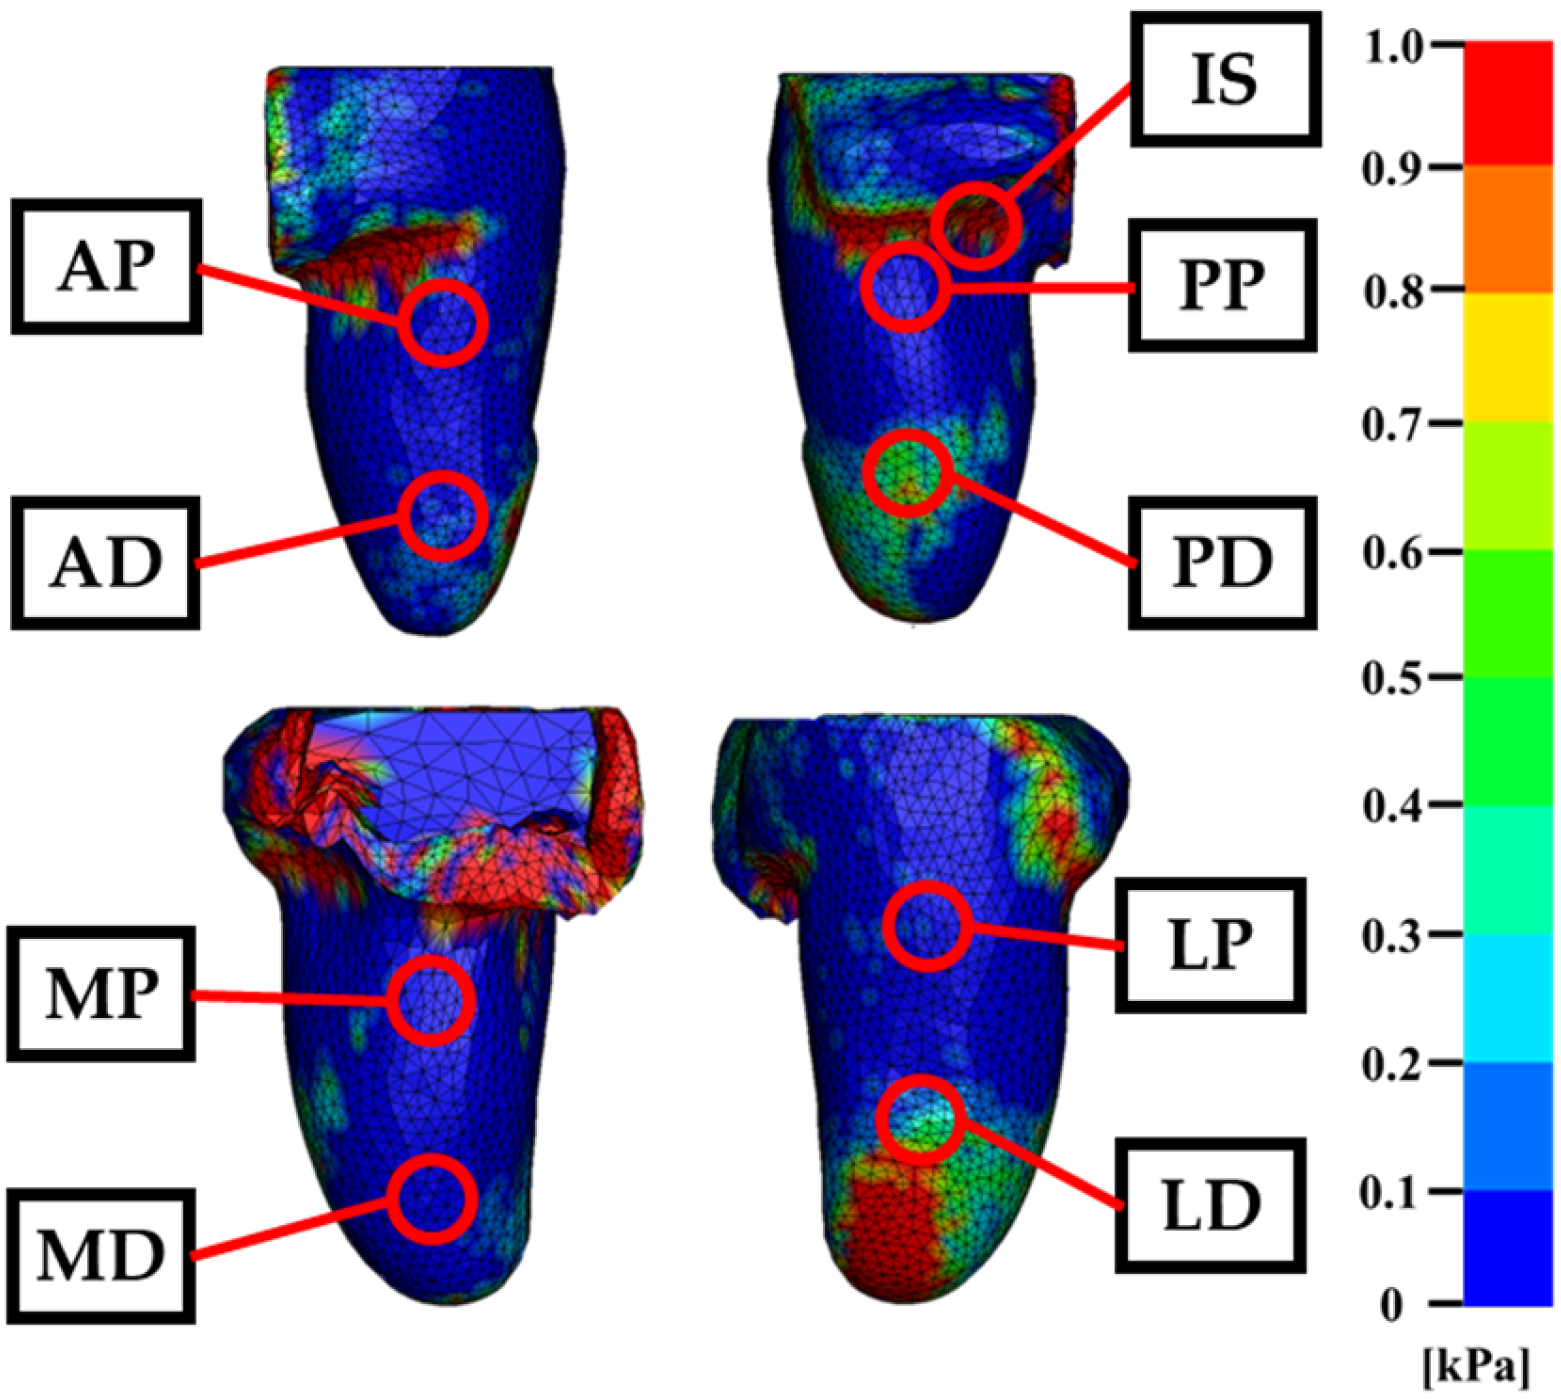
Eight sensors were embedded into the socket: four at the proximal level and four at the distal level, positioned on the anterior, posterior, medial, and lateral surfaces (
Figure 2). The vertical placement of the sensors was referenced to the level of the ischial tuberosity, with the proximal sensors located 40 mm distal to this landmark and the distal sensors placed 140 mm below it.
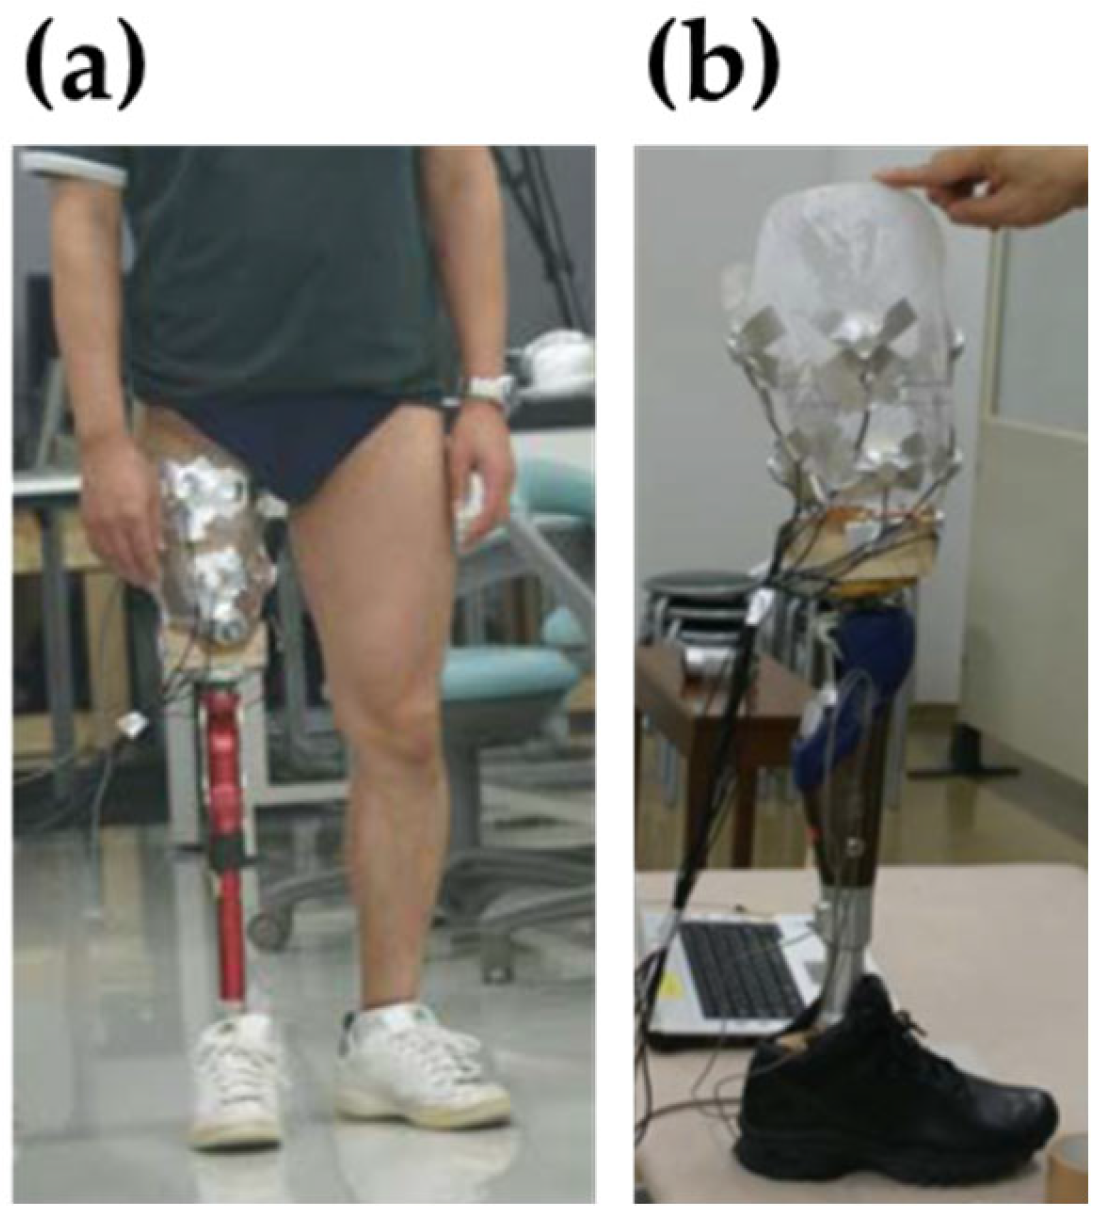
Each sensor was powered by a 5 V supply and provided triaxial force output. However, since the finite element simulation focused on estimating normal stress (i.e., pressure) acting perpendicular to the tissue surface, only the Z-axis component of the measured data was extracted and analyzed for validation purposes. Pressure measurements were conducted in a quiet standing, representing a static loading condition. This condition was recorded for 15 s, and the average pressure over this duration was used as the experimental reference for comparison with simulation-derived values.
Figure 3 illustrates the pressure measurement setup during quiet standing, along with the prosthetic socket embedded with sensors.
2.2. Image Segmentation
To construct a 3D model of the residual limb from the acquired MRI images, a machine learning–based image segmentation algorithm was developed. The segmentation model was built upon the U-Net architecture, which is widely used for biomedical image segmentation due to its ability to achieve high accuracy even with limited datasets. This characteristic makes it particularly suitable for this study, where the number of available MRI slices was relatively small.
To further enhance segmentation performance, the model was augmented with attention mechanisms and dilated convolutions. The attention mechanism enables the network to selectively focus on spatially relevant features while suppressing less informative regions. This is especially beneficial when dealing with imbalanced datasets such as MRI scans, where certain anatomical structures—like the ischium—appear less frequently compared to adipose tissue or the femur. Without such mechanisms, low-frequency regions are prone to under-segmentation. The inclusion of attention helps mitigate this issue by dynamically weighting feature importance during training.
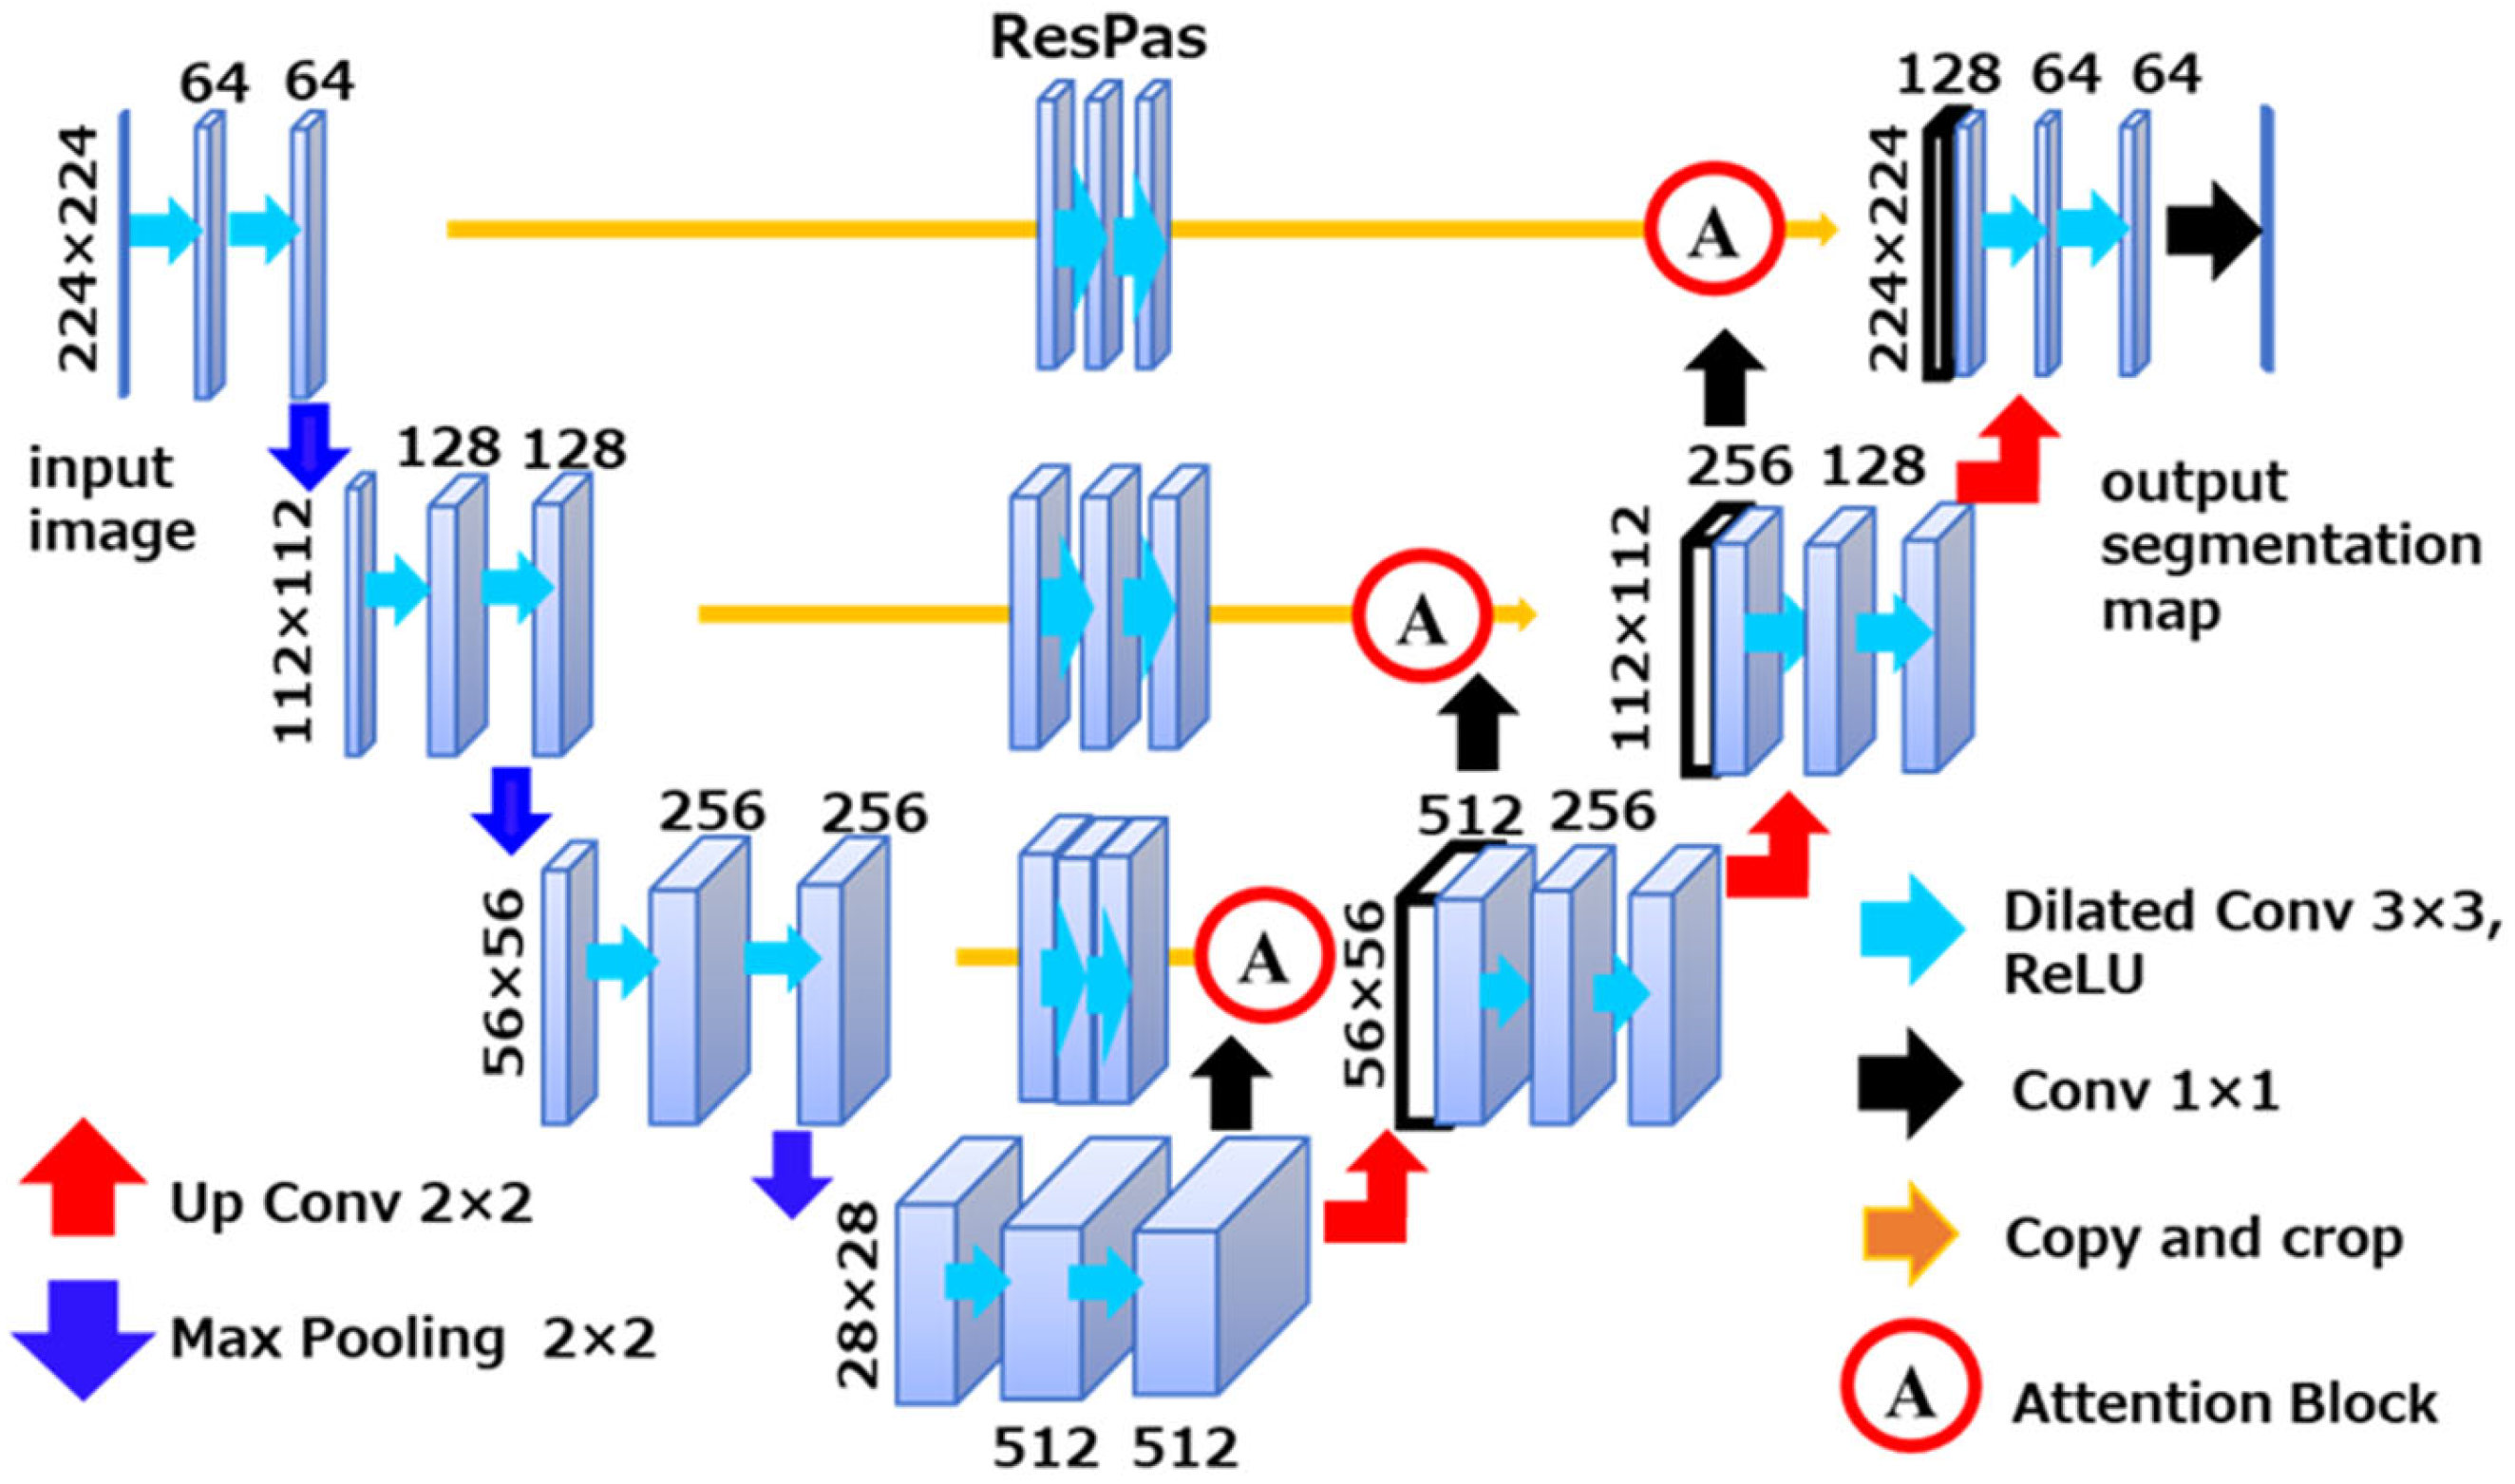
Additionally, dilated convolutions were incorporated to expand the receptive field of the network, allowing it to capture broader contextual information without increasing the number of parameters. The combined use of attention and dilation within the U-Net framework contributed to robust segmentation performance across all tissue types. An overview of the model architecture used for training is shown in
Figure 4.
To improve methodological clarity and clarify the segmentation pipeline, additional details of the model architecture and training procedure are provided. The segmentation network was based on a four-stage U-Net architecture, with encoder and decoder paths consisting of convolutional blocks with kernel size 3 and feature channels of 64, 128, 256, and 512, respectively. Dilated convolutions with a dilation rate of 2 were used to expand the receptive field without increasing the number of parameters. Attention modules were inserted at each skip connection to enhance feature fusion by selectively emphasizing spatially relevant features, as illustrated in
Figure 4.
The model was trained for 50 epochs using the Adam optimizer with an initial learning rate of 1−3, determined via a learning rate range test. A compound loss function combining Dice loss and cross-entropy was employed to balance overlap accuracy and class-wise discrimination. Data augmentation strategies included random rotation, scaling, flipping, and zooming to improve generalization and mitigate overfitting.
Model training was conducted on a workstation running Ubuntu 20.04 LTS, equipped with an NVIDIA GeForce RTX 2080 SUPER GPU (8 GB VRAM). The segmentation model was implemented using PyTorch 1.9.0 with CUDA 10.2 and Python 3.8.11.
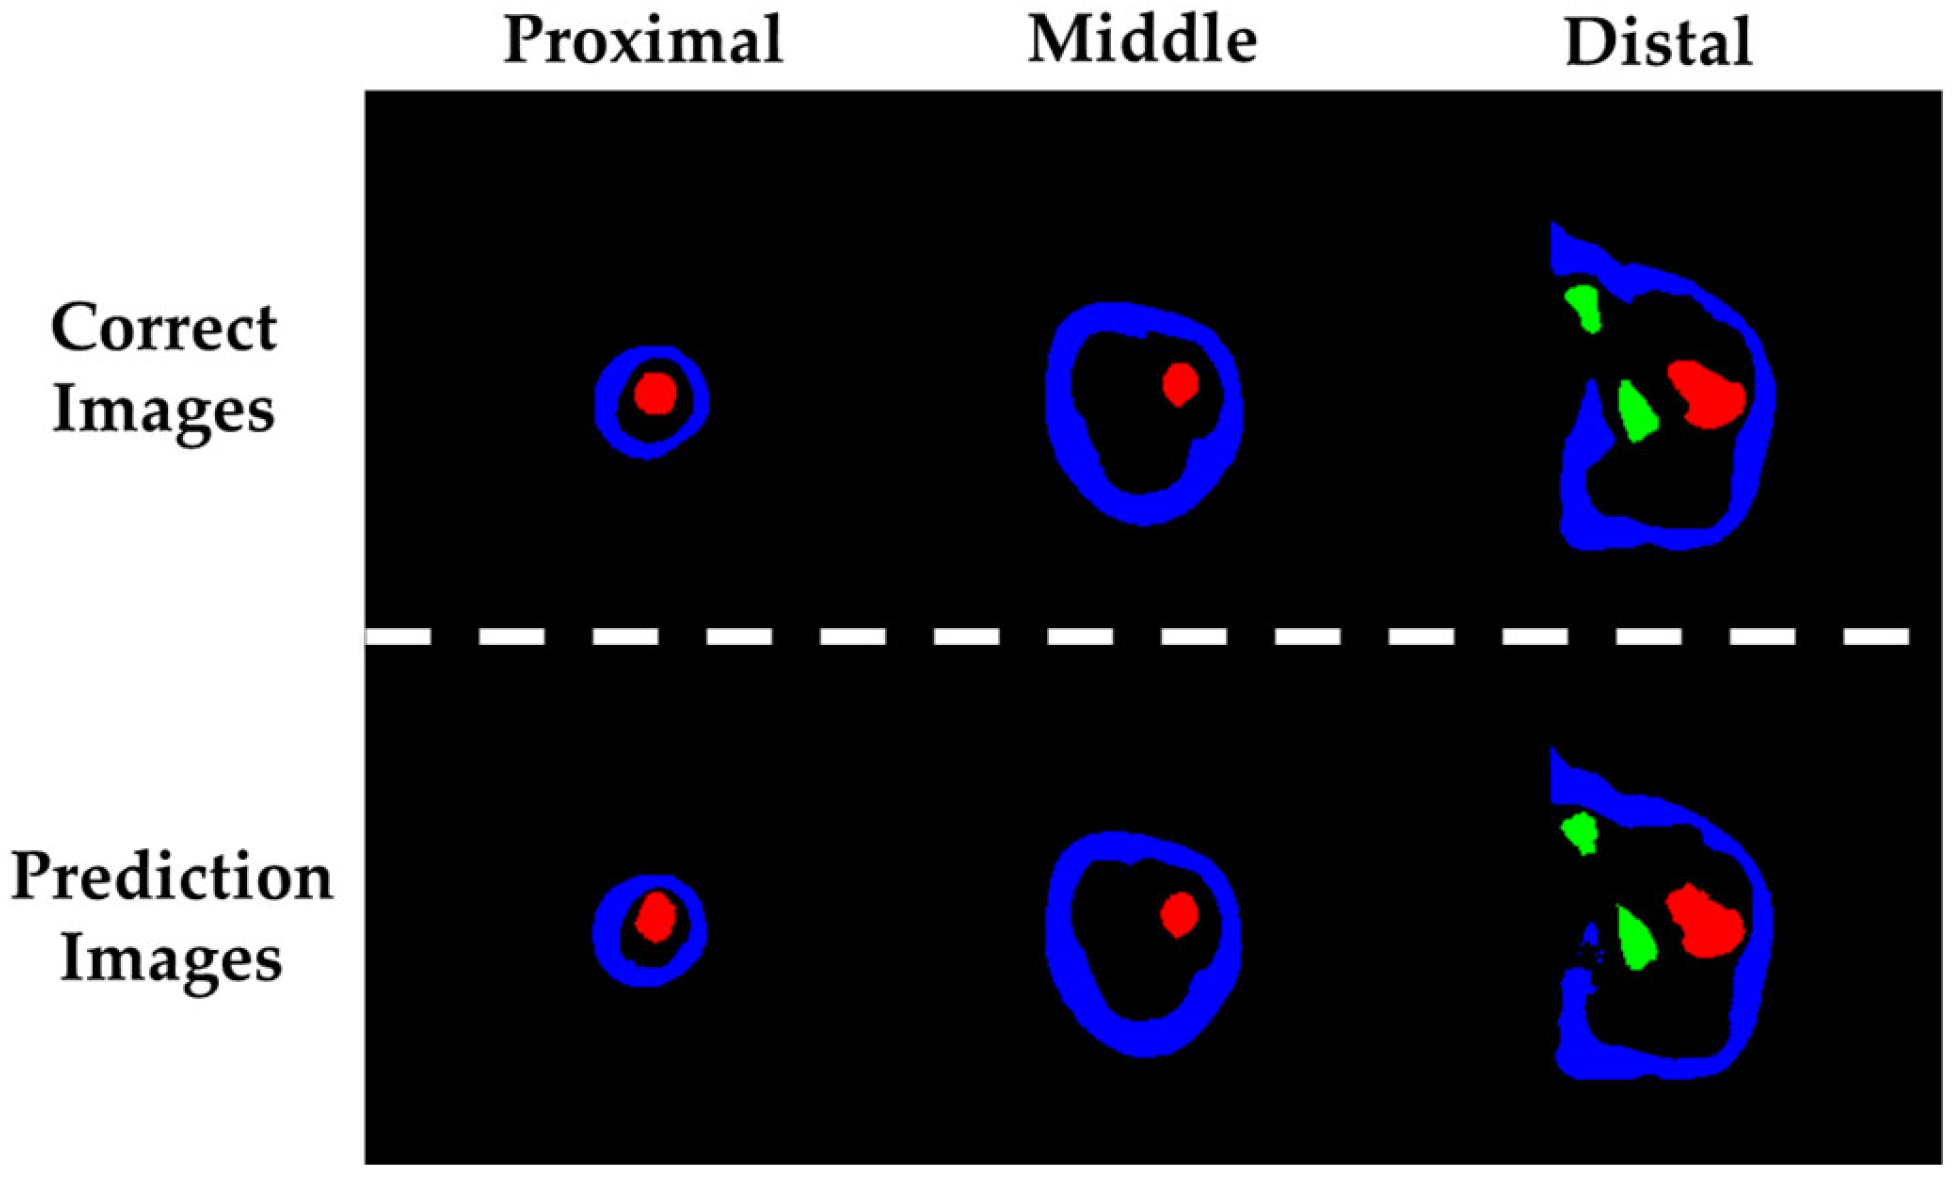
To generate training labels for supervised learning, we employed Efficient Interactive Segmentation (EISeg), a user-guided annotation tool that enables iterative refinement of model predictions. EISeg allows users to correct segmentation outputs and provide feedback, thereby improving model performance through minimal manual intervention. This hybrid approach—combining automated segmentation with targeted user input—facilitated the creation of high-quality annotations across all MRI slices. On average, 5–10 refinement iterations were performed per slice, and the validity of the corrected annotations was evaluated by an experienced orthopedic surgeon. Only annotations judged clinically appropriate were included in the dataset, ensuring reliability of the training labels.
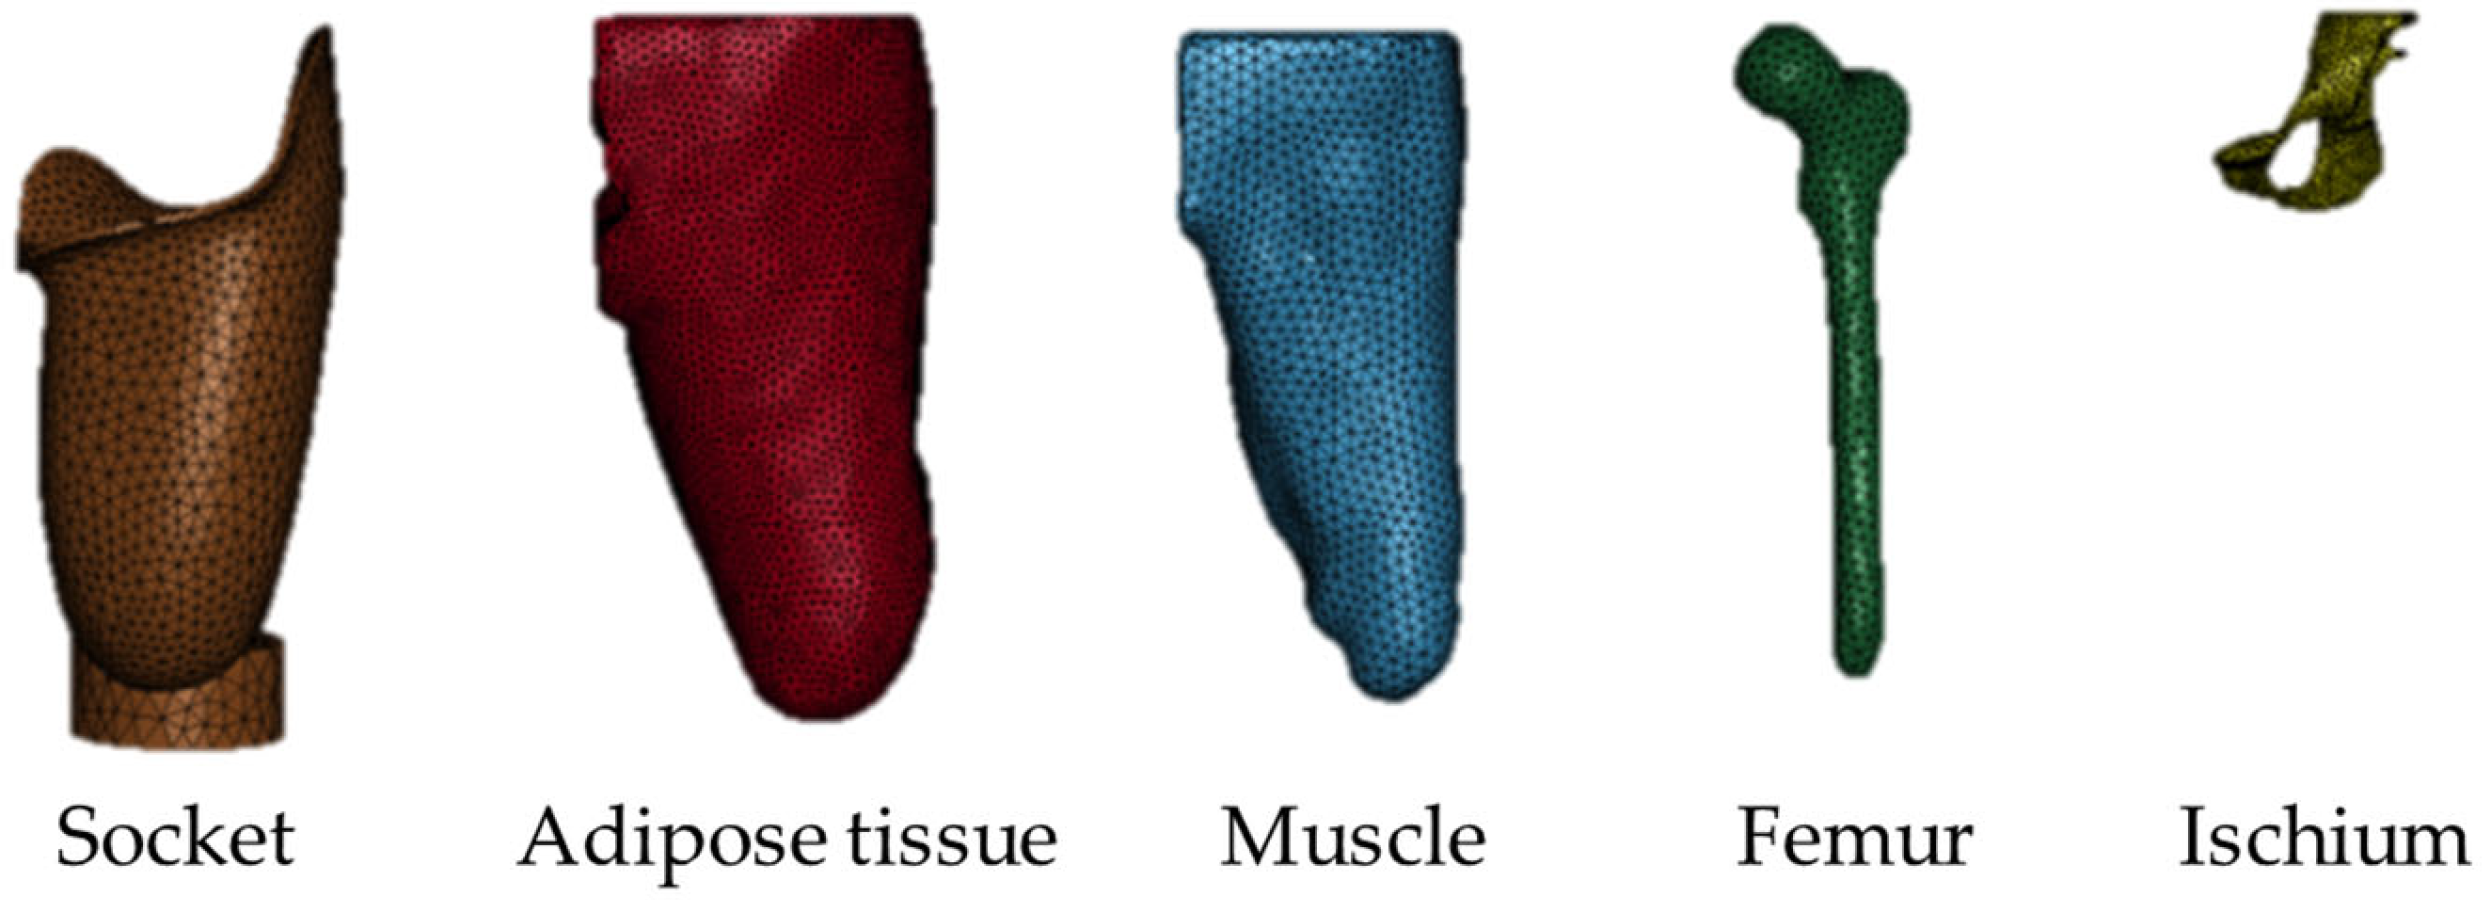
Using this method, three anatomical structures—adipose tissue, ischium, and femur—were labeled in each MRI image. Muscle tissue was defined as the region enclosed by adipose tissue but excluding the femur and ischium. This definition was adopted to minimize computational cost and avoid interference between overlapping tissue boundaries during segmentation.
2.3. Finite Element Modeling of the Residual Limb
A finite element (FE) model of the residual limb was constructed based on internal tissue information obtained through machine learning. To extract spatial information from the segmented tissues in the residual limb, MATLAB R2023a (MathWorks Inc., Natick, MA, USA) was used. This process generated point cloud data containing spatial coordinates for each segmented tissue within the MRI slices, which served as the basis for subsequent modeling.
However, the segmented MRI images of the residual limb were acquired as horizontal slices, providing only two-dimensional information (X and Y axes). To reconstruct the full three-dimensional geometry, the known slice thickness of 1 mm was utilized to incrementally assign Z-axis coordinates to each slice, starting from the distal end of the residual limb. By stacking the slices in this manner, a complete 3D spatial representation of the residual limb was obtained.
Using the reconstructed 3D data, the FE model of the residual limb was generated in Rhinoceros 8 (Robert McNeel & Associates, Seattle, WA, USA). Prior to modeling, data cleaning was performed to remove outliers and impute missing values resulting from the machine learning-based segmentation process. A mesh was then created from the cleaned point cloud, and smoothing techniques were applied to ensure a continuous and anatomically realistic surface geometry. In addition, the FE model of the transfemoral prosthetic socket was created by scanning a physical socket using a 3D scanner (Eva, Artec 3D, Luxembourg City, Luxembourg).
To evaluate mesh convergence, three mesh densities were generated: Coarse (36,592 elements), Medium (64,885 elements), and Fine (103,820 elements). The ischial tuberosity (IS) region was selected as the representative location for convergence assessment due to its clinical importance and high stress concentration. The simulated pressure values at the IS region were 17.231 kPa (Coarse), 21.814 kPa (Medium), and 22.819 kPa (Fine). The percentage change between the Medium and Fine meshes was 4.40%, which is below the commonly accepted 5% threshold for mesh convergence in biomechanical finite element analysis. Based on this criterion, the medium mesh was considered adequate for the exploratory nature of this preliminary simulation study. The details of this mesh convergence analysis are summarized in
Table 2, which presents the number of elements for each mesh density, the corresponding simulated pressure values, and the percentage change in pressure between successive refinements.
2.4. Socket Fitting Simulation Using FEM
To evaluate the pressure exerted on the residual limb during transfemoral prosthetic socket application, finite element simulations were conducted using LS-DYNA (Ansys Inc., Canonsburg, PA, USA). The material properties assigned to each tissue in the residual limb model are summarized in
Table 3. These values were not derived from subject-specific mechanical testing but were adopted from prior literature reporting soft tissue properties under comparable anatomical contexts, though not under identical loading conditions. This approach ensured physiologically plausible modeling while acknowledging the limitation that subject-specific properties were not available. This reliance on generic material parameters remains a constraint of the current framework, particularly given that the present study is intended as an exploratory, proof-of-concept evaluation rather than a predictive model. More accurate and clinically meaningful predictions would ultimately require subject-specific characterization of soft-tissue properties, and future work will explore approaches for incorporating individualized material calibration into the modeling pipeline.
The simulation was divided into two phases: (1) socket application and (2) quiet standing. Each phase was simulated over a duration of 0.1 s to balance computational cost and resolution. The socket was modeled using shell elements, while the adipose tissue, muscle, femur, and ischium were modeled using solid elements. Gravity was applied as a constant acceleration of 9.8 m/s2.
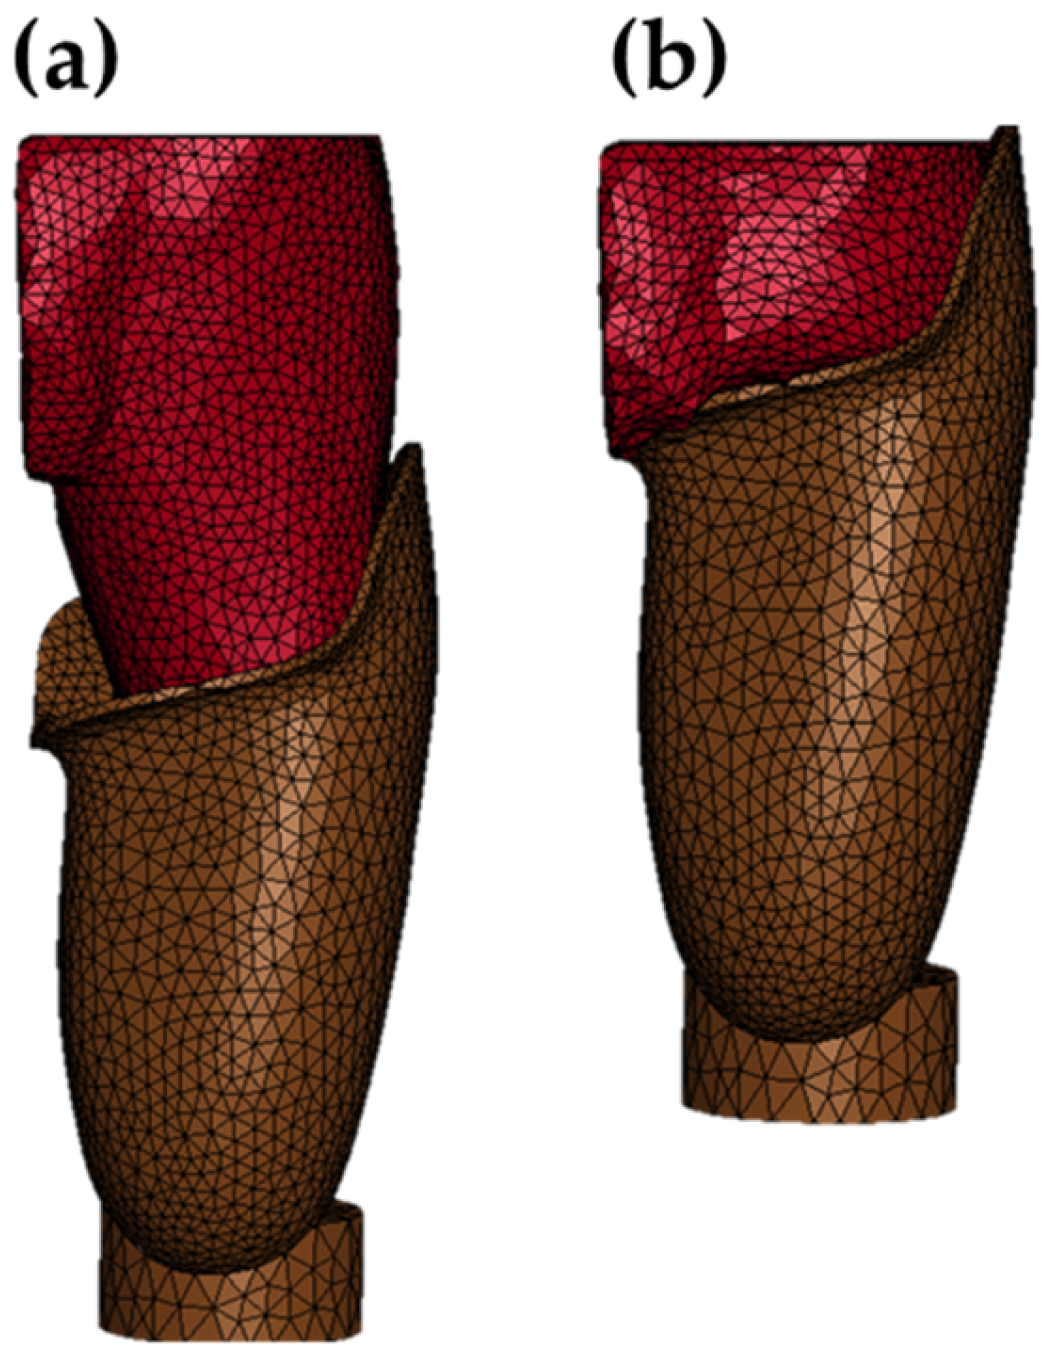
During the socket application phase, the socket was displaced proximally by 120 mm through enforced displacement. Frictional contact between the socket and adipose tissue was defined, with a static coefficient of friction of 0.05 and a dynamic coefficient of 0.07.
For the quiet standing phase, a proximal load of 308.7 N—representing half of the subject’s body weight—was applied to the bottom surface of the socket to reproduce the ground reaction force transmitted through the prosthesis. To ensure mechanical equilibrium, the proximal end of the residual limb model was constrained in the Z-direction, preventing vertical displacement while allowing physiological deformation in the transverse plane. The frictional interaction between the socket and adipose tissue during this phase was defined with a static coefficient of 0.20 and a dynamic coefficient of 0.10, values adopted from prior literature [
36,
38].
In typical clinical scenarios, when a transfemoral amputee wears a prosthetic socket, the displaced adipose tissue is naturally confined by the contralateral thigh and perineal structures. However, because the present FE model was constructed from MRI data of a single limb, these anatomical boundaries were absent. As a result, during socket application, the adipose tissue tended to escape medially into the open space, causing unrealistic deformation and void formation.
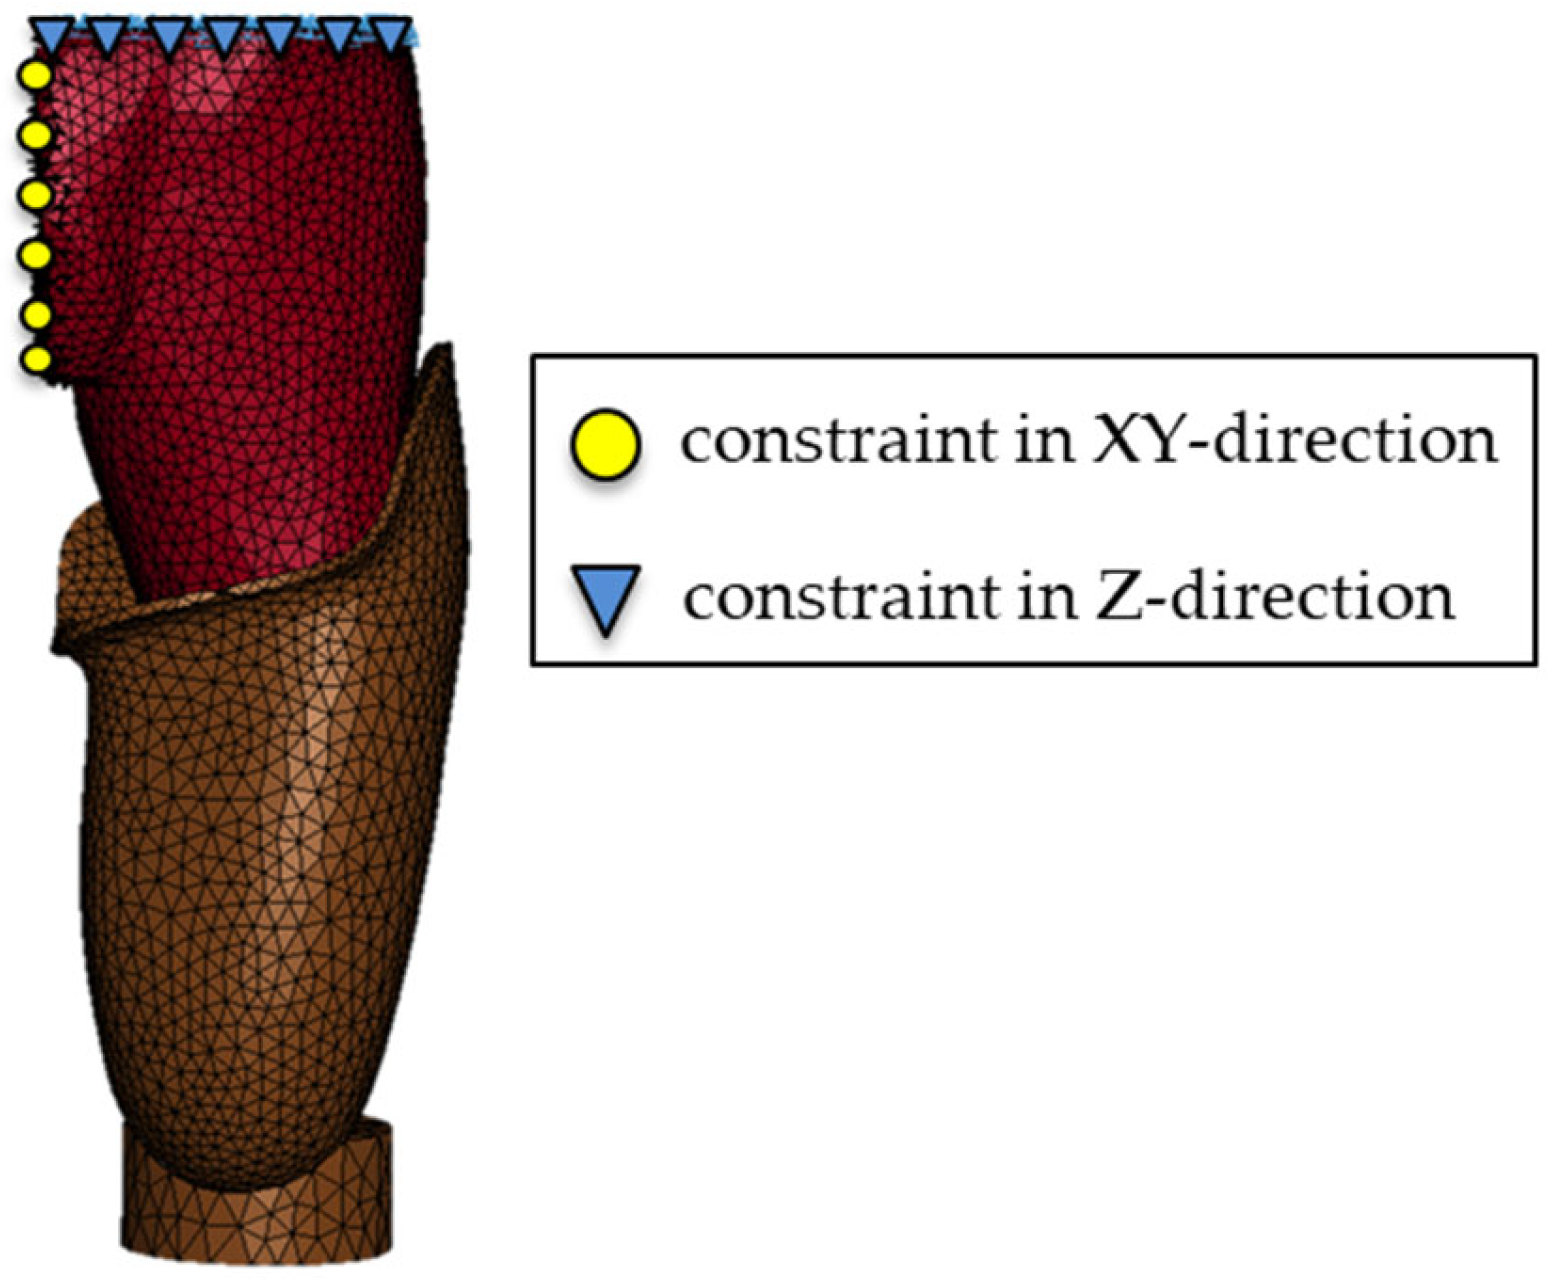
To address this limitation, an additional constraint was applied to the medial soft-tissue region near the hip joint. This boundary condition restricted tissue displacement in the XY plane, effectively replicating the anatomical confinement that would occur in vivo. Without this constraint, the soft tissues exhibited excessive mediolateral flow toward the contralateral side, because the model lacked the opposing support normally provided by the contralateral thigh and pelvic structures. This excessive displacement prevented the soft tissues from being pushed back into the socket and resulted in an unrealistically low pressure at the ischial tuberosity (IS) region (8.71 kPa). By contrast, the constrained model limited medial escape of adipose tissue and produced a load transfer pattern that was more consistent with expected qualitative behavior, yielding an IS pressure of 21.814 kPa. The boundary conditions applied in the FE model—including the proximal Z-axis constraint and the medial soft-tissue confinement—are illustrated in
Figure 5.
However, this medial constraint does not represent a physiological boundary condition and was introduced solely to prevent non-physical tissue displacement arising from the absence of contralateral anatomical support. As such, it has a substantial influence on the resulting pressure distribution, particularly at the IS region, and should be regarded as a practical modeling workaround within this preliminary workflow.
Pressure values were extracted at eight sensor locations embedded in the residual limb model, corresponding to the actual measurement points used in the physical experiments. These simulated pressure values were then compared with the experimentally measured data to provide a preliminary qualitative assessment of model behavior rather than a quantitative validation.
4. Discussion
The primary objective of this study was to develop and demonstrate an initial MRI-to-FEM workflow that integrates machine-learning-based segmentation with finite element modelling for exploratory analysis of transfemoral socket–limb interaction, rather than to provide quantitative evaluation or predictive assessment of interface pressure. To provide an initial assessment of the FEM-based simulation, pressure measurements were obtained using eight embedded triaxial force sensors positioned along the inner wall of the prosthetic socket, as well as one sheet-type strain sensor placed directly beneath the ischial tuberosity. These experimental values were then compared with the simulated pressure outputs to characterize the qualitative behavior of the preliminary modelling setup.
In the initial phase, pressure data were successfully acquired from all nine sensor locations. The highest pressure was recorded at the ischial tuberosity (IS) region, reaching 54.873 kPa, while the lowest was observed at the lateral distal (LP) region (−0.967 kPa). All eight measurement points other than the IS region showed values below 1 kPa. This indicates that the majority of load support during quiet standing in the IRC socket is concentrated around the ischial seat.
Furthermore, negative pressure values were observed at three locations—LP, anterior proximal (AP), and medial distal (MD)—suggesting the formation of localized vacuum zones within the socket. This phenomenon is likely attributable to soft tissue deformation during socket application, which may have created voids between the residual limb and the socket wall.
Previous studies have reported similar findings in transtibial prostheses. Schoepp et al. [
42] demonstrated that sockets equipped with mechanical elevated vacuum pumps generated negative internal air pressure during ambulation, confirming that vacuum-assisted suspension can actively produce sub-atmospheric pressure conditions. Beil et al. [
43] further observed that minimum interface pressures fell below zero when comparing suction and vacuum-assisted sockets during walking, highlighting that negative pressure is not only a transient phenomenon but can be consistently measured under dynamic loading. Likewise, Chino et al. [
44] reported negative pressure during the swing phase in below-knee prostheses with sleeve suspension, reinforcing the notion that localized vacuum zones are a reproducible outcome across different suspension strategies. Collectively, these studies support the interpretation that negative pressure can contribute to enhanced adherence between the socket and residual limb, thereby improving suspension and load transfer efficiency.
Nevertheless, it should be noted that all of these prior investigations were conducted in transtibial prostheses, where socket geometry and limb biomechanics differ substantially from transfemoral designs. The IRC transfemoral socket used in the present study has distinct contouring and load-bearing characteristics compared to below-knee sockets, and thus it cannot be conclusively stated that the same mechanisms of negative pressure formation apply. While the observation of localized negative pressure in our measurements aligns with clinical expectations for suction-based suspension systems, the present findings should be interpreted as preliminary observations within the context of this exploratory workflow, and further validation is required to determine whether these findings can be generalized across different socket types and amputation levels.
In the subsequent phase of this study, a machine learning–based image processing algorithm was developed to automatically segment internal tissues of the residual limb from MRI scans of a transfemoral amputee. This approach enabled efficient and reasonably accurate segmentation of key anatomical structures, specifically the adipose tissue, femur, and ischium. The segmentation performance was quantitatively evaluated using the F-measure, with the femur achieving the highest score of 0.934. This result is likely due to the relatively consistent morphology of the femur across MRI slices, which reduces the complexity of pattern recognition during training. The adipose tissue yielded the second-highest F-measure of 0.925. Although its shape varied more significantly in the proximal region compared to the femur, the large spatial coverage of adipose tissue in the MRI images may have mitigated the impact of local segmentation errors, resulting in stable overall performance.
The lowest segmentation accuracy was observed for the ischium, which can be attributed to class imbalance in the training data. In a typical MRI dataset consisting of approximately 300 axial slices at 1 mm intervals, the ischium appears in only about 80 proximal slices. This limited representation, combined with the complex geometry of the ischial region—particularly the hemispherical acetabular cavity—likely contributed to reduced prediction accuracy. Despite these limitations, minor geometric discrepancies in the segmented ischium were corrected during the modeling process and were unlikely to have a major influence on the overall FEM behavior, although localized effects—particularly near the IS region—cannot be fully ruled out. Specifically, local irregularities were smoothed to ensure continuity across slices, small gaps were filled using spline-based interpolation, and surface contours were refined to preserve anatomical plausibility. These corrective steps helped improve the integrity of the reconstructed geometry and enhanced mesh quality.
However, even after these corrections, the reconstructed ischium exhibited a measurable mediolateral reduction relative to the reference anatomy. Given that the ischial tuberosity is the primary load-bearing structure in an IRC socket, such geometric underestimation directly affects the available contact area and can systematically reduce simulated pressure at the IS region. This sensitivity to ischial geometry, combined with the non-physiological medial constraint required for numerical stability, likely contributed to the substantial discrepancy observed between measured and simulated IS pressures.
Therefore, the machine learning–based segmentation framework provided a workable basis for anatomical reconstruction and preliminary biomechanical analysis, but its current performance—particularly for the ischium—highlights the need for improved segmentation fidelity when modeling clinically critical load-bearing structures. Further refinement and validation would be required for broader clinical application.
In the third phase of the workflow, the segmented tissue data obtained from machine learning were used to construct three-dimensional models for finite element analysis. This process involved extracting two-dimensional spatial coordinates along the X and Y axes from each MRI slice and stacking them to reconstruct the volumetric geometry of the residual limb. During this reconstruction, outlier predictions and irregular contours—often resulting from segmentation noise—were systematically removed. Surface smoothing was applied to eliminate jagged boundaries that could otherwise lead to element stretching, mesh entanglement, or numerical instability during simulation. As a result, anatomically plausible and simulation-ready models of the residual limb tissues were generated for the purposes of this study. However, due to the lower segmentation accuracy of the ischium (F-measure = 0.860, corresponding to ~14% pixel misclassification), the reconstructed ischial tuberosity appeared slightly smaller than its actual anatomical counterpart. This discrepancy may have contributed to the underestimation of pressure values in the ischial region, particularly given the sensitivity of this load-bearing area to geometric variation.
To clarify the extent of geometric discrepancy, a quantitative comparison was performed between the final ischial model and the reference anatomy. As summarized in
Table 8, the total volume and mass of the reconstructed ischial segment were reduced by approximately 10.2% and 13.0%, respectively. While the vertical and anteroposterior dimensions differed by less than 5%, the mediolateral extent was shortened by 11.2%, indicating a disproportionate reduction in the load-bearing direction. These geometric differences may have contributed to the underestimation of peak pressure at the ischial region observed in the simulation results.
Given that mediolateral width is the principal dimension governing load transfer at the ischial seat, the 11% reduction observed in the reconstructed ischium represents a substantial geometric deviation rather than a minor artifact. Such narrowing reduces the effective contact area and is consistent with the systematic underestimation of ischial pressure in the simulation. Although this deviation is unlikely to be the sole cause—given the absence of contralateral anatomy and the use of a non-physiological medial constraint—it likely contributed meaningfully to the diminished IS pressure and should be interpreted as a major source of uncertainty at this critical anatomical site. In particular, the combined effects of geometric underestimation and the imposed medial constraint create a mechanically underdetermined configuration at the IS region, making accurate pressure reproduction unlikely within the current preliminary workflow.
We acknowledge that segmentation errors in critical load-bearing structures can propagate through the modeling pipeline and affect stress concentration predictions. The present findings therefore highlight the importance of improving segmentation fidelity for anatomically and biomechanically dominant structures such as the ischium, as even modest geometric deviations can substantially alter local load transfer. Future work will include spatial error mapping and quantitative geometric analysis to better capture the impact of segmentation accuracy on biomechanical outcomes, particularly within the exploratory, proof-of-concept scope of the present framework.
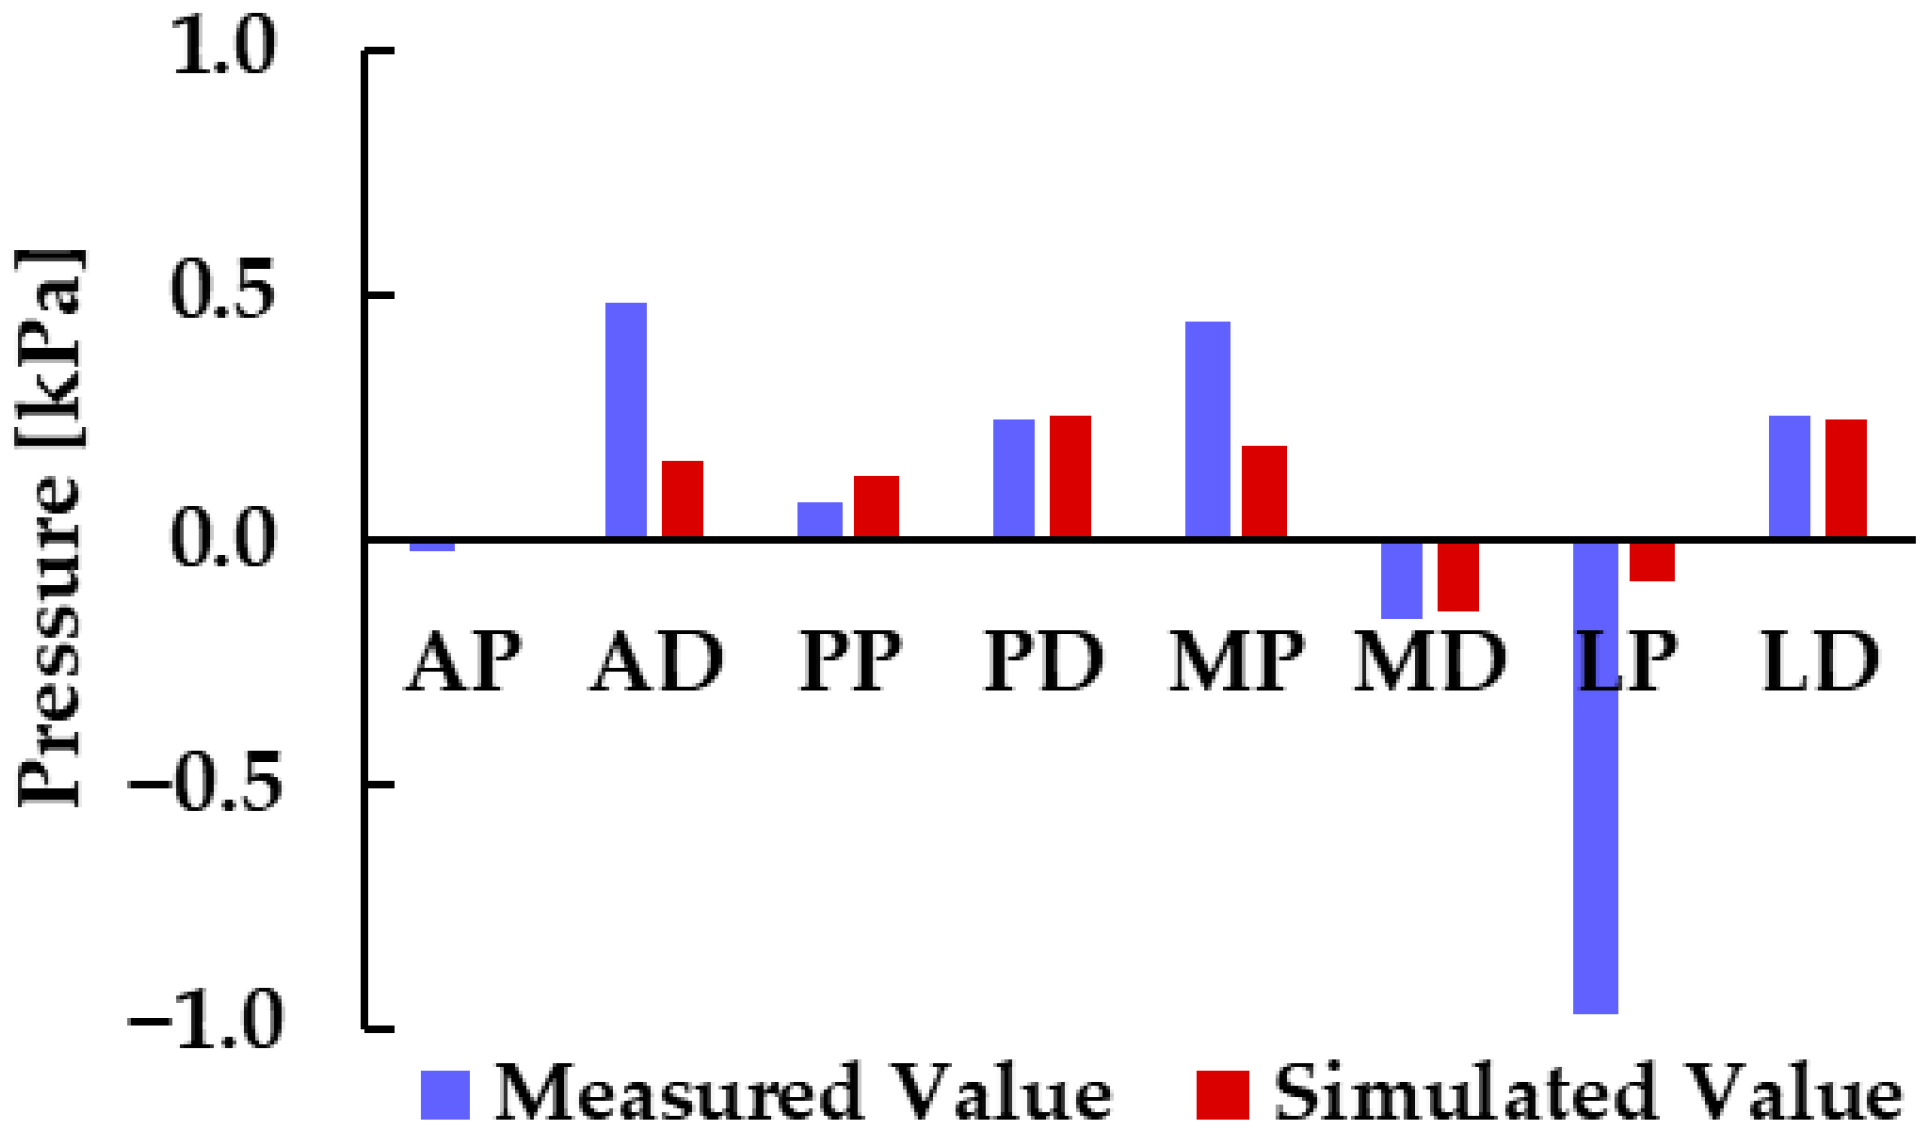
In the final phase of this study, pressure values on the residual limb were quantitatively evaluated using FEM simulations based on 3D anatomical models derived from machine learning segmentation. Simulated pressure data were extracted at nine locations corresponding to the sensor positions used in physical measurements. All simulated values at the eight points other than the ischial tuberosity (IS) region were below 1 kPa, consistent with the trend observed in the experimental data. The highest pressure was recorded at the IS region (21.814 kPa), while the lowest was observed at the medial distal (MD) region (−0.123 kPa). To provide an initial comparison between the FEM-based predictions and the experimental measurements, a direct comparison was conducted between the simulated pressure values and the experimental measurements obtained from triaxial force sensors embedded in the socket. Because the IS region exhibited markedly higher values compared to the other eight points, pressure comparison between simulation and measurement was performed excluding the IS region, as shown in
Figure 10. Across all eight evaluation points, the sign (positive or negative) of pressure values matched, indicating a general consistency in the direction of loading between simulation and measurement. This correspondence reflects broad qualitative tendencies rather than quantitative agreement, and the comparison between simulated and measured pressures indicates that the FEM-based approach can capture general loading patterns within the limitations of this preliminary workflow. Notably, regions with positive pressure values showed closer numerical correspondence between simulation and measurement, particularly near the pelvis and surrounding soft tissues. However, this agreement was observed primarily in low-pressure regions, where clinical relevance is limited. In contrast, the ischial tuberosity (IS) region—the primary load-bearing site in an IRC socket—exhibited a substantial discrepancy between measured and simulated values. This deviation confirms that the current model does not reproduce load transfer at the most clinically critical location and should not be interpreted as demonstrating predictive capability. Accordingly, while the reconstructed soft-tissue geometry may have contributed to load transfer in the simulation, this interpretation must be made with caution, and the quantitative predictive capability of the present framework remains limited within its proof-of-concept scope.
However, it should be noted that the negative pressure values observed in the FE simulation reflect the sign convention of LS-DYNA, in which compressive stresses are positive and tensile stresses are negative. Conventional FE analysis does not account for fluid–structure interaction; therefore, these values do not directly represent sub-atmospheric air pressure within the socket. Instead, the negative values indicate localized tissue deformation and potential separation at the socket–limb interface. Nevertheless, the significant correlation between simulated and measured pressures suggests that, despite the differing physical interpretations of “negative pressure” in simulation and sensor measurements, the computational framework is capable of capturing qualitative interface loading tendencies, rather than providing precise quantitative predictions.
In addition, a notable discrepancy was observed between the pressure values obtained at the ischial tuberosity (IS) region: the sheet-type strain sensor recorded 54.873 kPa, whereas the FEM simulation yielded 21.814 kPa. This difference may be attributable to the boundary conditions applied to the medial soft tissue near the hip joint, which were introduced to prevent the adipose tissue from escaping toward the contralateral side and to maintain socket adherence. As a result, the constrained medial soft tissue was pressed against the restricted area, leading to concentrated pressure values of approximately 102.623 kPa in the medial region rather than directly beneath the ischium. While such constraints were introduced to prevent unrealistic tissue displacement in the absence of contralateral anatomy, they also impose non-physiological loading pathways that strongly influence the resulting pressure field and must therefore be interpreted as a modeling workaround rather than a representation of in vivo mechanics.
To further investigate the influence of this medial constraint, an additional simulation was performed in which the constraint was completely removed. Under this unconstrained condition, the soft tissues exhibited excessive mediolateral flow toward the contralateral side due to the absence of anatomical support from the contralateral thigh and pelvis. Consequently, the IS pressure decreased markedly to 8.71 kPa, despite the IS region remaining the location of highest pressure within the model. This value is substantially lower than both the constrained condition (21.814 kPa) and the measured pressure (54.873 kPa), suggesting that relaxing the medial constraint does not necessarily improve agreement with experimental data. Instead, it reduces load transfer to the IS region by allowing adipose tissue to escape medially rather than being supported by anatomical boundaries.
Taken together, these findings suggest that the medial boundary condition alone is unlikely to fully explain the underestimation of IS pressure. Although some degree of medial support is necessary to prevent unrealistic soft-tissue escape—given the absence of contralateral proximal anatomy in the current model—the use of a fully fixed constraint is not physiologically appropriate. Complete fixation substantially reduces natural mediolateral compliance and produces an artificial pressure concentration at the constraint site, while simultaneously limiting load transfer toward the IS region.
The discrepancy at the IS region therefore likely arises from multiple interacting factors, including the lack of contralateral anatomical support, the overly rigid medial constraint required to compensate for this absence, geometric uncertainty around the ischial tuberosity, and the simplified isotropic soft-tissue material model. These interacting limitations collectively contribute to an under-constrained mechanical environment in which neither the constrained nor the unconstrained configuration provides a physiologically defensible representation of IS loading within this proof-of-concept framework.
These observations suggest that future models should incorporate a compliant medial constraint—one that allows small, physiologically realistic deformation while still providing mediolateral resistance—to better reproduce the mechanical support normally supplied by the contralateral limb and pelvis.
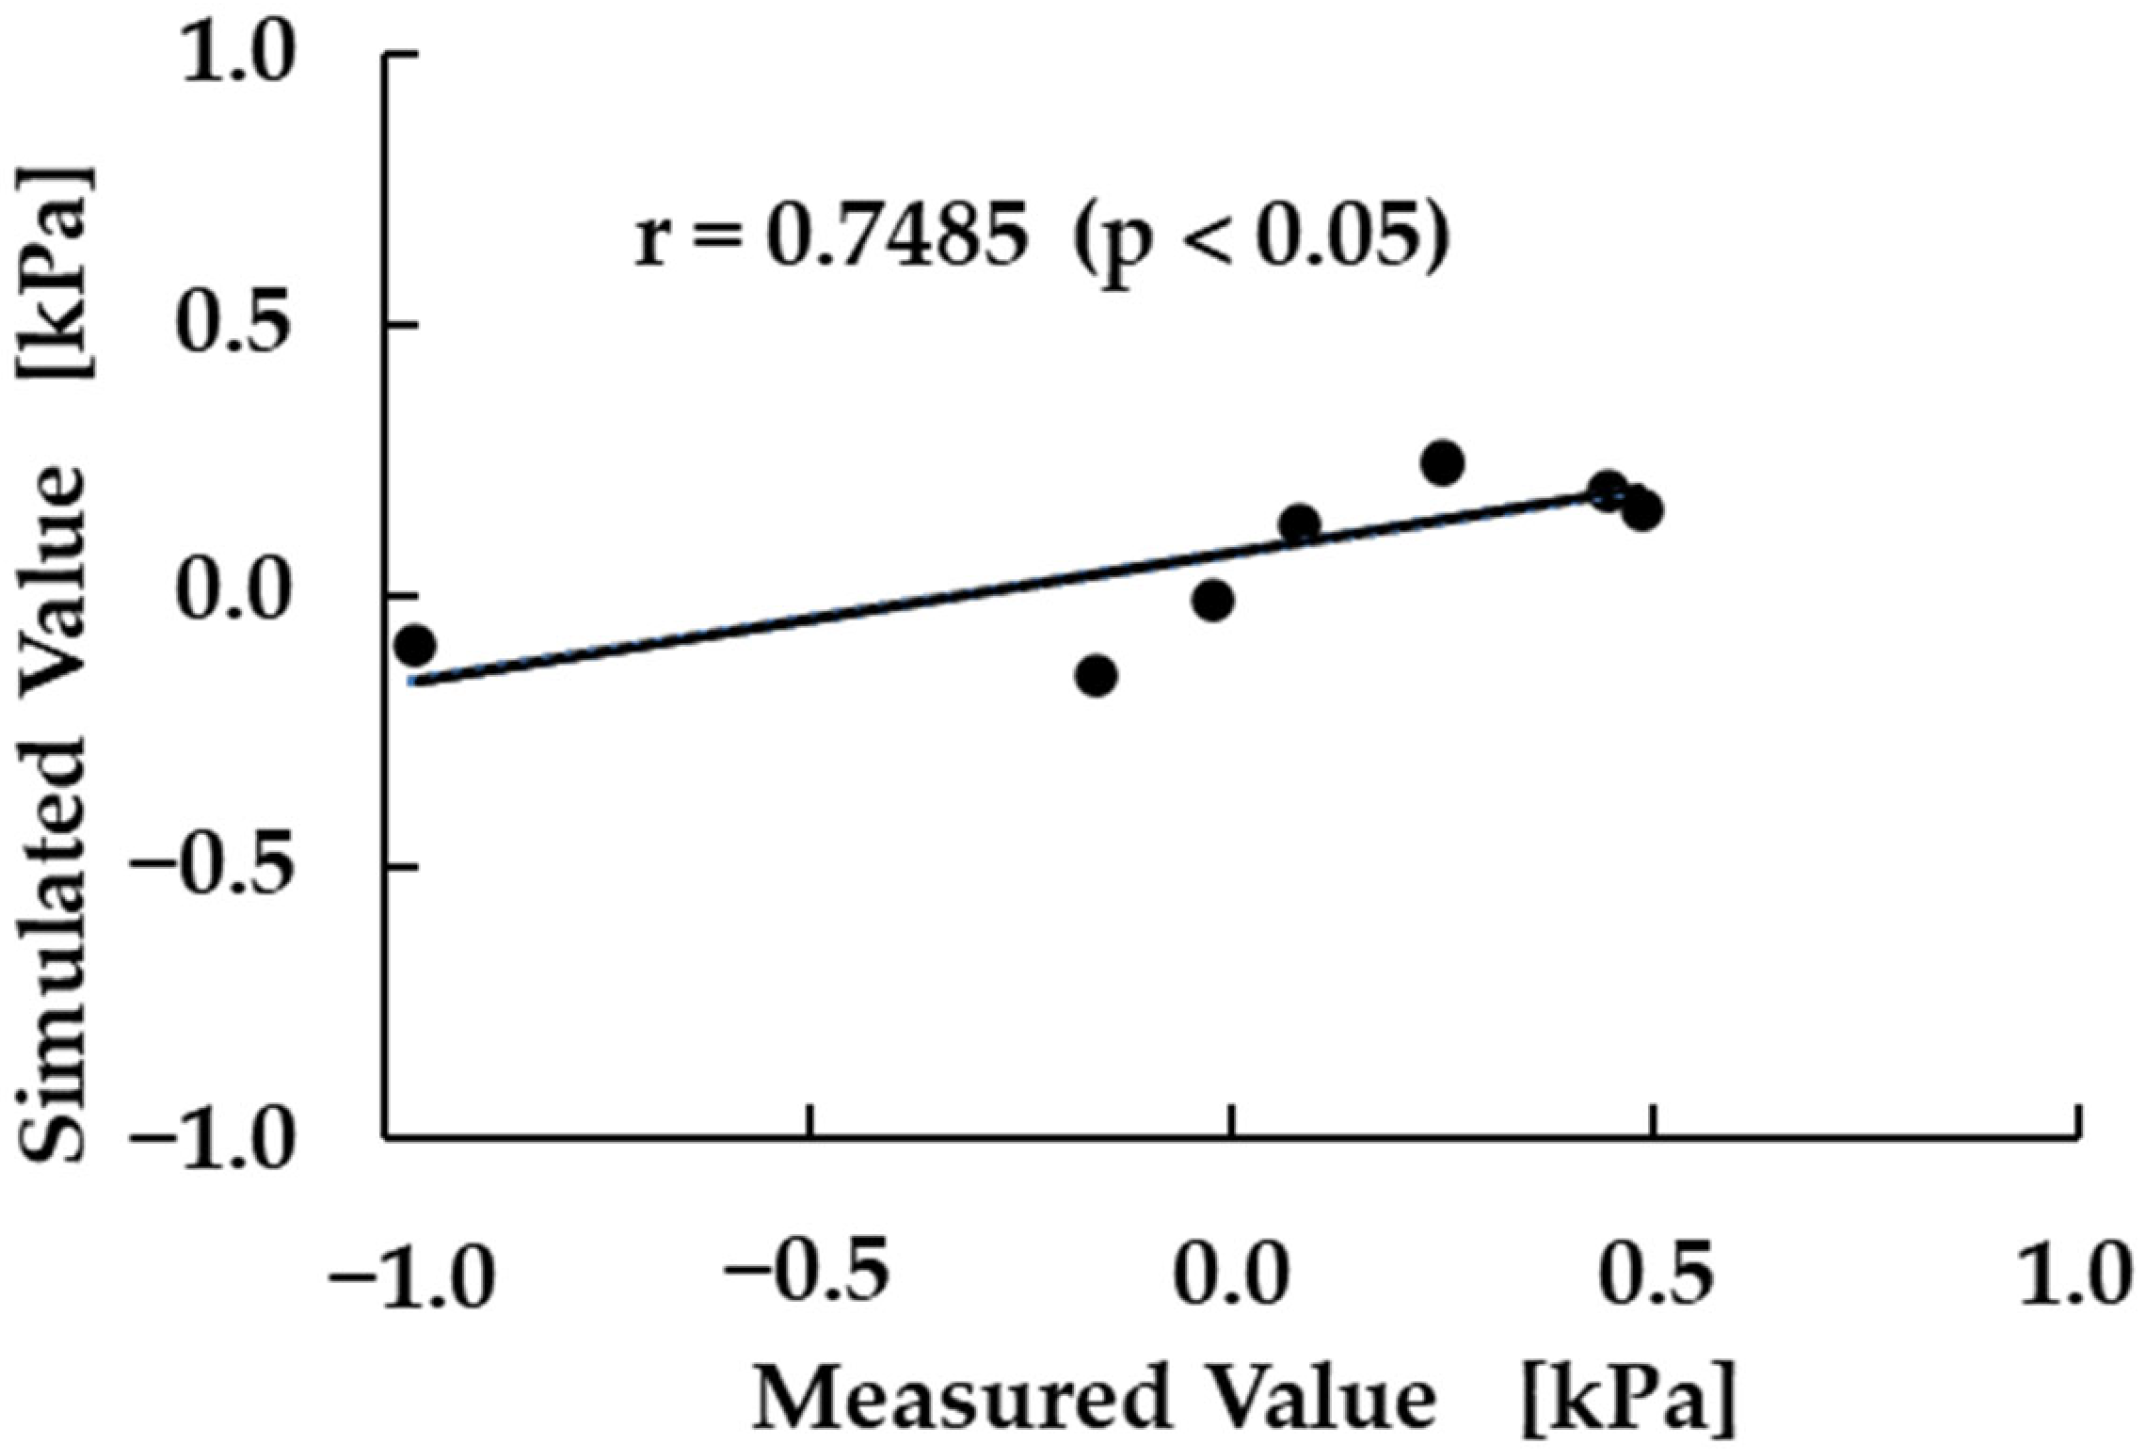
To further evaluate the consistency between experimental measurements and FEM-based predictions, a correlation analysis was conducted. As shown in
Figure 11, similar to
Figure 10, the relationship between measured and simulated pressure values was assessed across eight sensor locations excluding the IS region. This analysis was performed not as a validation test but as an exploratory assessment of whether the simulation framework qualitatively reflects trends in the measured data. The resulting correlation coefficient was r = 0.7485, with a
p-value < 0.05, indicating a statistically significant, though limited, positive correlation given the small number of data points and the exploratory nature of this proof-of-concept framework.
This finding suggests that, despite localized discrepancies such as those observed at the lateral proximal (LP) region, the simulation model captures the broad pattern of pressure distribution. However, because this correspondence arises exclusively from low-pressure regions with limited biomechanical and clinical relevance, it should not be interpreted as evidence of quantitative or predictive validity. The alignment in both magnitude and polarity across multiple anatomical sites supports the feasibility of the machine-learning–driven FEM approach as a preliminary modeling tool, while offering no indication of clinical applicability or predictive accuracy. Moreover, the observed correlation suggests that simulation outputs may have potential as supplementary indicators alongside physical measurements, but only within the narrow scope of qualitative trend assessment.
In addition to the correlation analysis, several complementary error metrics were calculated to further assess the agreement between simulated and measured pressures. As summarized in
Table 9, evaluation across all nine sensor locations—including the IS region—resulted in an RMSE of 11.024 kPa, an MAE of 3.846 kPa, and a maximum error of 33.059 kPa. These values reflect the large discrepancy at the IS site, where both the pressure magnitude and tissue geometry differ substantially from the simplified assumptions used in the current model.
When the IS region was excluded, RMSE and MAE decreased markedly to 0.344 kPa and 0.194 kPa, respectively, indicating closer numerical agreement at the remaining eight locations. Although the correlation coefficient becomes 0.999 when the IS region is included, this value does not indicate improved predictive accuracy. Instead, it is driven almost entirely by the dominant influence of the IS point as the highest-pressure location, functioning effectively as a single outlier that inflates the correlation. For this reason, the correlation coefficient for the “All Regions” condition is reported as “–“ in
Table 9 to avoid misinterpretation. In contrast, the correlation observed when excluding the IS region (r = 0.748) reflects a statistically significant relationship across the eight remaining points; however, its interpretive value remains limited because it reflects only low-pressure regions, which play a comparatively minor role in overall load bearing. Overall, these results indicate that the FEM-based predictions align more closely with measurements in low-pressure areas, while offering only limited insight into load transfer at the IS region, where modeling accuracy is most critical.
These observations clarify the current strengths and limitations of the proposed framework: while the model performs well in regions with relatively simple geometry and low pressure, discrepancies remain in areas where anatomical complexity and load concentration are high. Addressing these challenges will require further refinement of the modeling assumptions and loading conditions, particularly around anatomical boundaries where pressure transfer is most sensitive.
Nevertheless, one known drawback of socket–limb modeling is pressure mismatch near anatomical boundaries. As demonstrated by Henao et al. [
1], validated FEM under gait loading can achieve accurate stress prediction in transfemoral prosthetics. Building on this insight, future work will extend our framework to dynamic loading scenarios, which are expected to improve the model’s mechanical realism and provide insights beyond static standing simulations.
While the current study provides only an initial experimental validation under quiet standing conditions with a single subject, these results highlight the feasibility of the workflow and identify directions for refinement. Expanding to dynamic activities and broader participant cohorts will be essential to assess generalizability and explore potential practical utility.



 ,
,