
Article

Virtual Reality Training for Assembly Operators in the Automotive Industry: A Pilot Usability Study

by
Charlotte De Vestel
* and
Vasilios Zogopoulos
Flanders Make Vzw, Oude Diestersebaan 133, 3920 Lommel, Belgium
*
Author to whom correspondence should be addressed.
Virtual Worlds 2026, 5(3), 31; https://doi.org/10.3390/virtualworlds5030031
Submission received: 20 March 2026 / Revised: 29 June 2026 / Accepted: 30 June 2026 / Published: 1 July 2026

Abstract

Driven by competition, innovation, and shifting market demands, the automotive industry has evolved from mass production to high-mix, low-volume manufacturing, increasing operator flexibility and cognitive load. Virtual Reality (VR) can support training if aligned with user needs. This study presents a VR assembly training prototype with varying support levels and evaluates its effects on performance, physiological responses, and user experience in eleven operators, categorized by VR experience (novices vs. experts). User experience was positive, though improvements are needed in perceived bodily ownership. Novices completed tasks slower than experts (Welch’s t-test, t(16.84) = −2.50, p = 0.023, d = −1.14), while no differences in hint usage were observed (χ2(1) = 1.02, p = 0.313). Mixed repeated-measures ANCOVAs revealed significant effects of support level and VR experience (p = 0.032; p = 0.046) on heart rate, but not on breathing rate or galvanic skin response (GSR). Mixed repeated-measures ANOVAs showed significant effects of task buzzer and support level on heart rate and breathing rate (p = 0.018; p = 0.005), with no effects for GSR. Although results warrant caution due to the small sample size, findings highlight the importance of support design and provide insights for future research on VR-based assembly training.

1. Introduction

The automotive industry continues to play a major role in the economies and labor markets of Belgium and Luxembourg [1], driven by sustained demand for new vehicles and rapid innovation to meet customer expectations, particularly in areas such as safety, sustainability, and electrification [2,3]. These shifting expectations have also increased the demand for a larger product variety and customization, moving the market away from standardized mass production toward smaller, more diverse production volumes.
To remain competitive in this changing landscape, the sector faces constant pressure to optimize production processes, reduce costs, and enhance product quality. As a result, production environments have become more flexible, with human operators playing a central role. It is therefore essential to provide operators with adequate support, including effective operator training.
However, operator training remains challenging. Today, it is typically conducted using pre-series (prototype) vehicles [4], an approach that has several key limitations: the availability of such materials is often limited, making it difficult to train operators across all variants and configurations and restricting the number of operators that can be trained simultaneously. Moreover, resetting the training setup for each session is time-consuming.
To overcome these challenges, Virtual Reality (VR) is increasingly recognized as an effective alternative to traditional training methods, particularly for learning procedural skills [5]. Assembly tasks inherently involve the execution of sequences of actions in a specific order, making them well-suited to this type of training. The key strength of VR lies in “learning by doing,” allowing users to repeatedly practice complex tasks in a safe, realistic, and controlled environment before applying them in real-life situations [6,7]. VR offers full engagement in a three-dimensional environment (‘immersion’), the sensation of truly being there through real-time updates (‘sense of presence’), and the ability to actively engage with and manipulate the environment using controllers or haptic gloves (‘interaction’) [8].
Research shows that VR is generally at least as effective as traditional training methods in improving learning outcomes such as knowledge, skills, and self-confidence [9]. This has been demonstrated across multiple sectors, including education [10], healthcare [11], industrial training [12], and the training of complex or high-risk tasks that are difficult to practice in real-world settings (e.g., piloting aircraft, operating trains, and firefighting) [13,14]. Despite these promising outcomes, several factors can both enhance and hinder the learning experience. On the one hand, the immersive and interactive nature of VR fosters enjoyment, curiosity, and engagement, which in turn enhance user motivation and contribute to more effective and sustained learning [15]. However, these positive effects are more commonly observed among younger users (e.g., students). For other users, VR may instead lead to cognitive overload or techno-stress [16]. This is particularly likely when users have limited familiarity with technology or when applications are poorly designed (e.g., non-intuitive user interfaces, jerky movements).
Thus, despite the strong potential of Virtual Reality (VR), its effectiveness ultimately depends on how well the technology is designed, implemented (e.g., through clear instructions and onboarding), and aligned with the needs of its intended users. In this context, the literature consistently shows that training approaches that adapt to the learner’s proficiency level are more effective [17]. To enable such adaptivity in training, three key components are required: (1) measures of trainee performance (e.g., physiological indicators, task performance), (2) adaptive variables (e.g., scenario difficulty), and (3) adaptive logic (e.g., optimization methods) [18,19]. However, the ways in which these components interact and jointly influence training effectiveness and user experience remain insufficiently understood.
To address this gap, a prototype VR training for car assembly with varying levels of support was developed. This training was designed to prepare operators for a new car assembly line, for which production is scheduled to start soon once all materials have been delivered. By measuring both operator performance (task completion and number of hints requested), physiological responses (heart rate (HR), breathing rate (BR), galvanic skin response (GSR)), as well as user experiences, this study seeks to evaluate:
  • Whether physiological responses vary across different levels of support and prior VR expertise (novice vs. expert);
  • Whether a buzzer event triggers changes in physiological responses, and whether this effect depends on the level of support and VR expertise;
  • Users’ perceptions of usability, sense of presence, workload, comfort, learning effect, and overall experience in the VR training.
We hypothesize that different levels of support allow users to learn at their own pace, which is reflected in their stress levels, with higher support expected to reduce stress. Users with prior VR experience are anticipated to experience lower stress than those without. The presence of a buzzer is expected to increase stress regardless of support level, with a stronger effect on users with little or no VR experience. Finally, by incorporating the user feedback, this study aims to provide recommendations for improving VR training applications for car assembly.

2. Materials and Methods

2.1. Virtual Reality Car Assembly Training

The prototype VR training was developed by the technology provider B·U·T (https://but.digital (accessed on 29 June 2026)) using the Unity game engine (Unity Technologies, San Francisco, CA, USA) as the development platform. To facilitate the creation and modeling of the 3D materials used in the VR training, the automotive company provided Computer-Aided Design (CAD) files of the environment and the resources used (e.g., cranes). By converting CAD files into a VR environment, the materials and surroundings could be created more efficiently and with greater realism [20,21].
The VR training comprises five different stations of a new assembly line, each requiring approximately similar time and levels of expertise. The task content for each assembly station is described in Table 1. Each station includes three possible levels of support, which are presented in Table 2. Level 3 provides an analytical performance dashboard for the person responsible for training, displaying the task performance (i.e., completion time and number of hints requested).
A predefined completion time was assigned to each workstation. This corresponds to the “takt time,” i.e., the time frame specified by the manufacturer within which the operator is expected to complete the task once production begins on the physical assembly line. When this time elapsed, a brief buzzer sounded at each of the three support levels. Despite the buzzer, operators were allowed to continue working to complete the task. The purpose of this mechanism was to familiarize operators with the target takt time, as it is normal for them to exceed this limit during their initial attempts. For Level 3, where a performance score is generated, any time exceeding the takt time was recorded as penalty time. Ultimately, the goal is for operators to reach the target time by the end of the training.
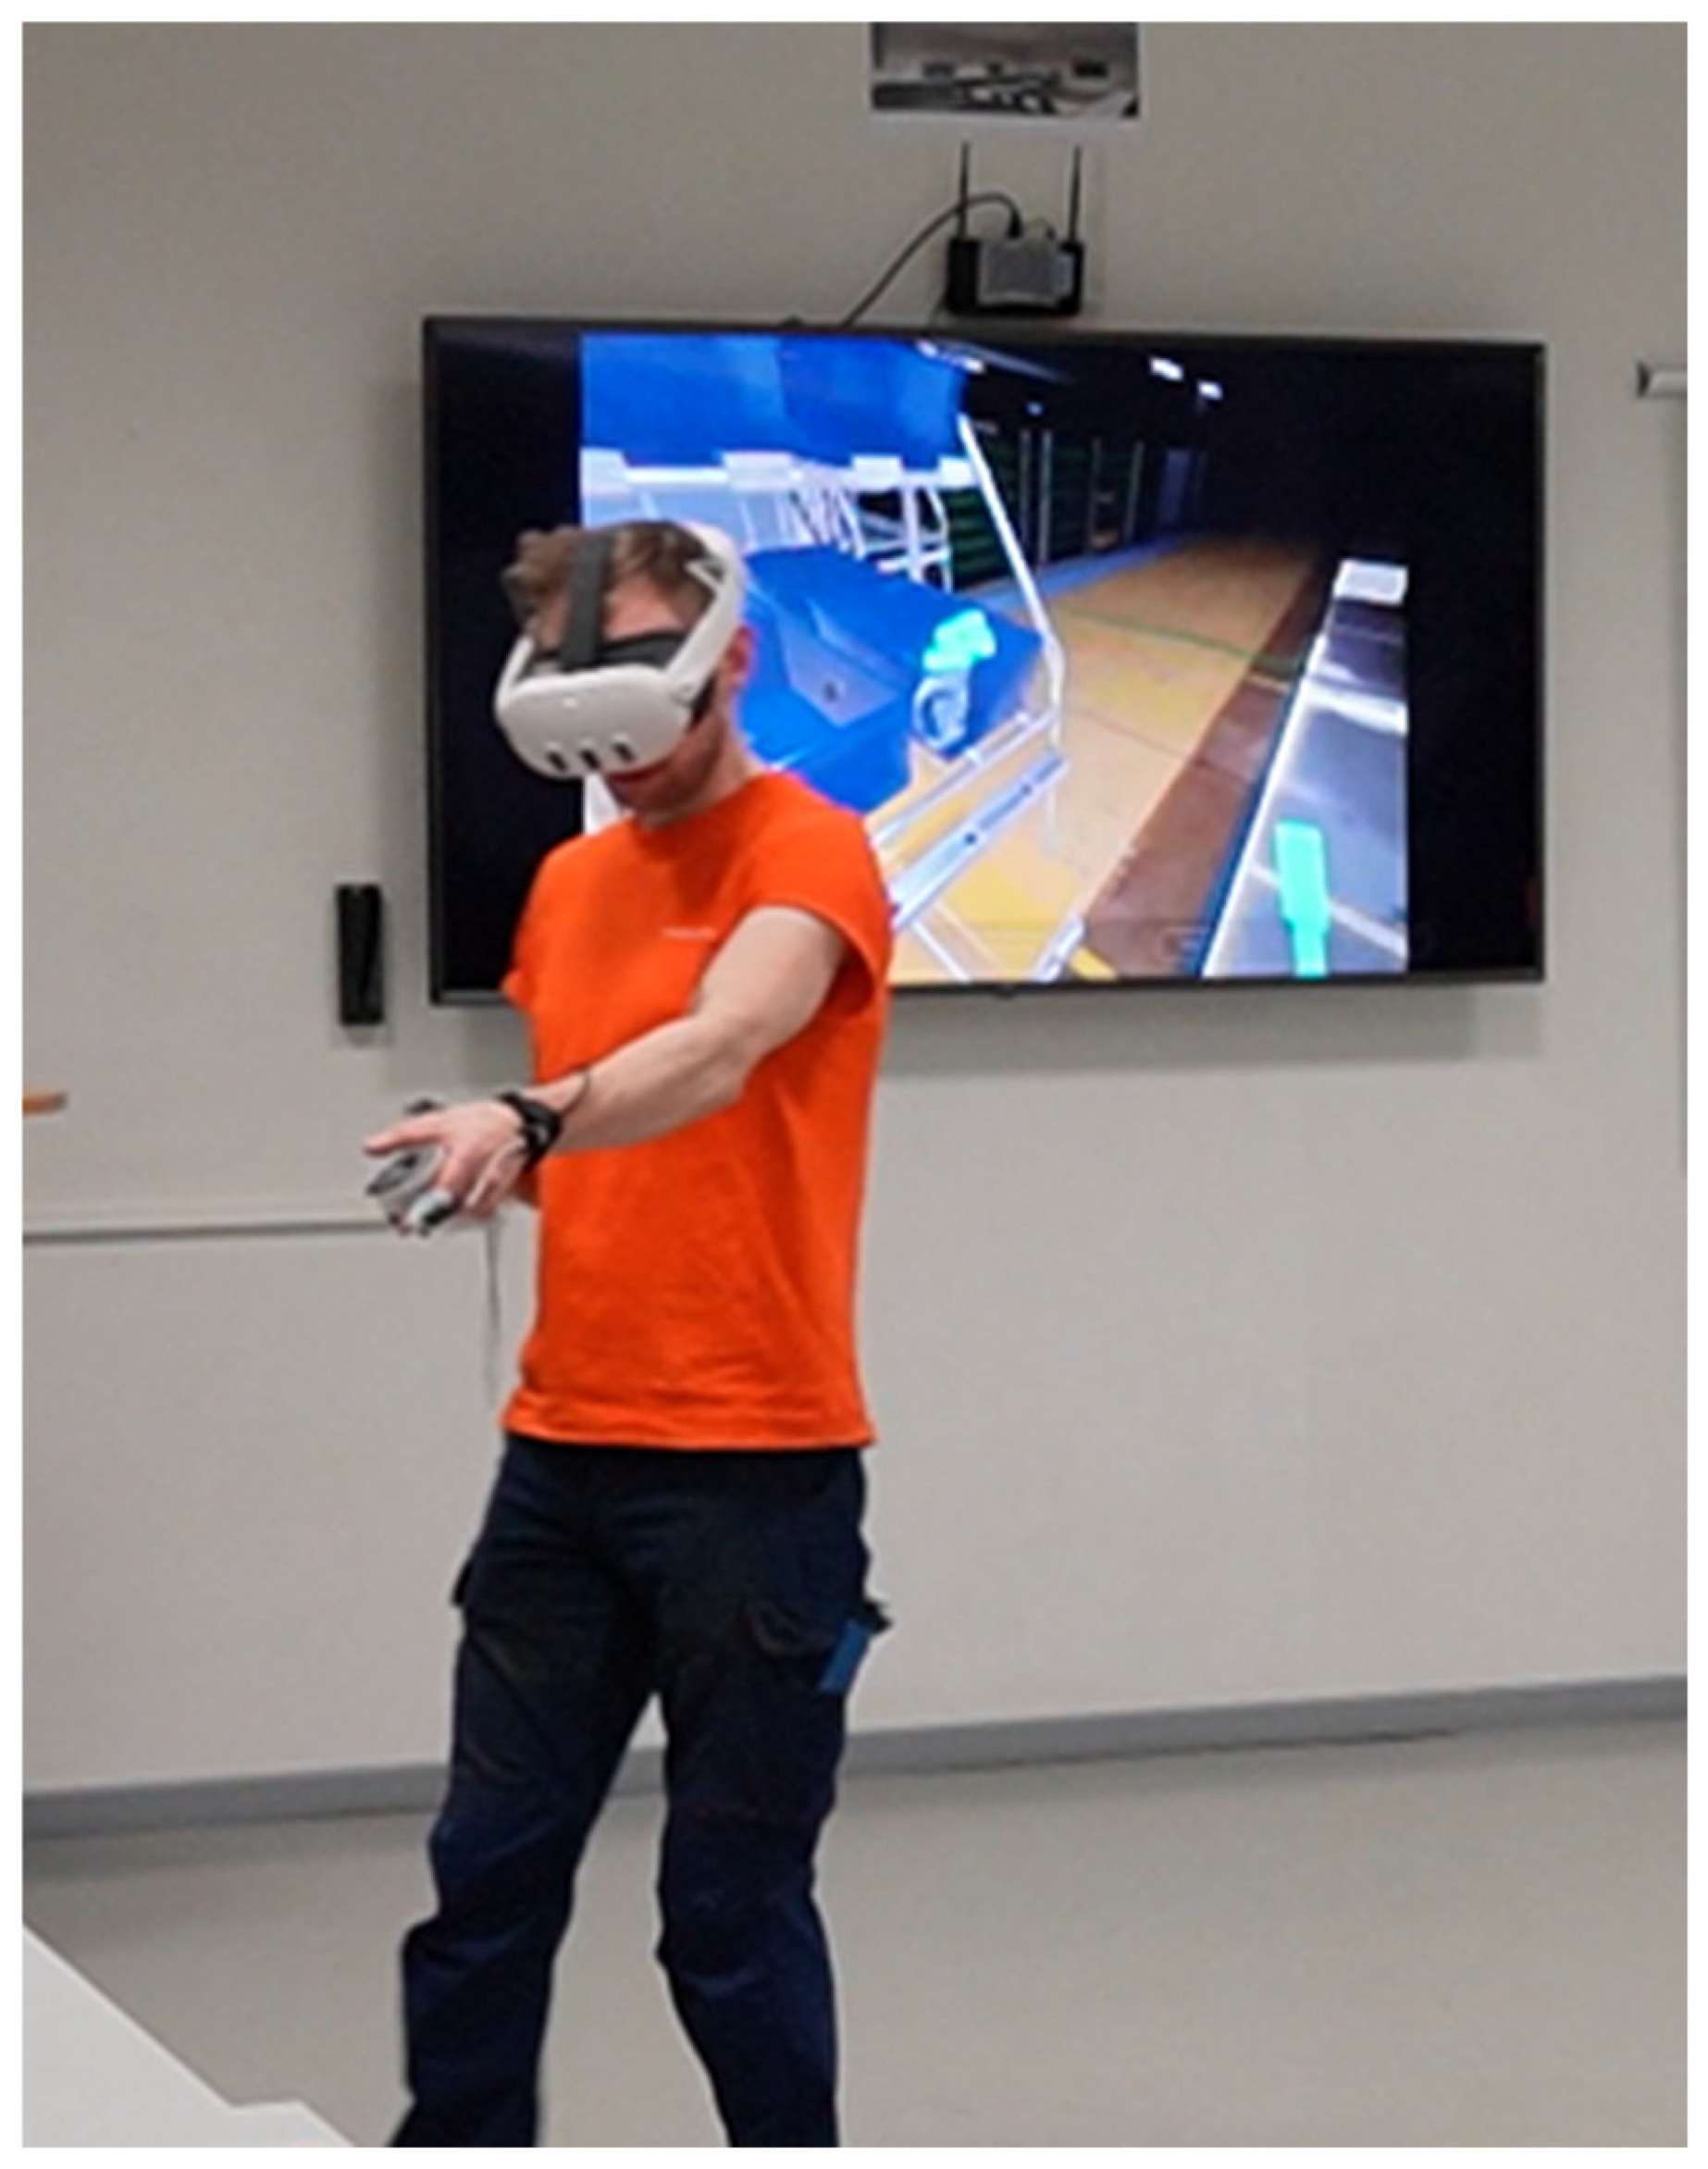
The Meta Quest 3 headset (Meta Platforms, Inc., Menlo Park, CA, USA) was selected for conducting the training due to its untethered functionality, comfortable design, and high resolution and refresh rate. Operators navigated the VR application using handheld controllers, whose triggers were used to resemble the actual control of some tools (screwdrivers). Sufficient open space was provided to allow operators to move around safely while performing the VR training. Figure 1 illustrates an operator performing the VR training.

2.2. Study Design, Setting and Participants

For this pilot usability study, a cross-sectional, single-session design was employed at the training center of an automotive company. The VR training was introduced to prepare operators for a new car assembly line that will commence once all materials have been delivered. Each participating operator was allowed to leave their workstation for a maximum of one hour to complete the session. Within this time frame, the preparation, the actual VR training, and the collection of operator feedback had to be completed.
Target participants were operators working at the company who had sufficient knowledge and experience in car assembly, enabling them to adequately assess the added value of VR training. Individuals with a history of or risk factors for adverse effects related to VR use were excluded. A detailed overview of the eligibility criteria is provided in Table 3. A sample size of 5–7 participants was deemed sufficient to achieve saturation, as previous research suggests that this number can be adequate for early-stage qualitative usability testing within a homogeneous user group [22].
The study flow and results in this paper are reported in accordance with the Template for Intervention Description and Replication (TIDieR) guidelines [23].

2.3. Testing Session

Operators were assigned to workstations by the operators’ supervisor and the two researchers in a semi-random manner, taking into account the need to ensure that all workstations were represented in the study.
The duration of the VR session was limited to approximately 30 min to stay within the available time. Prior to the session, operators were informed about the study, the workstation content, the available support levels within the VR training, and the use of the VR controllers.
Each operator first performed a task at support level 1, which provided the highest level of guidance, to become familiar with the system. Subsequently, they could choose to proceed with level 2 or level 3, depending on their perceived comfort with the task.
Operators were instructed to fully complete each initiated workstation training to avoid interrupting the assembly process midway. Additional support levels and workstations were initiated if time permitted.
Data collection was conducted by two researchers. A staff member from B·U·T, the company that developed the VR application, was present to assist with any technical issues that might arise. The VR session was streamed to a large screen, allowing the researchers to monitor the operator’s actions and enabling the operator’s supervisor to follow the session as well.

2.4. Outcome Variables

2.4.1. Descriptive Variables

Participant characteristics included age range, gender, years of experience in car assembly, and prior VR experience. Participants were classified as ‘novice’ if they had no or limited experience with VR, and as ‘expert’ if they had prior VR experience.

2.4.2. Task Performance Metrics

To evaluate task performance, task completion time and the number of requested hints were recorded.
Task completion time is defined as the time required to complete all tasks at a workstation with support level 3. It is expressed as a percentage of the takt time (100%).
Number of hints requested is defined as the number of times the operator requested a hint at a workstation with support level 3.

2.4.3. Physiological Measures

Physiological signals, i.e., heart rate (HR, bpm), breathing rate (BR, rpm) and galvanic skin response (GSR, µS), were used to obtain objective indicators of participants’ physiological stress levels during task performance.
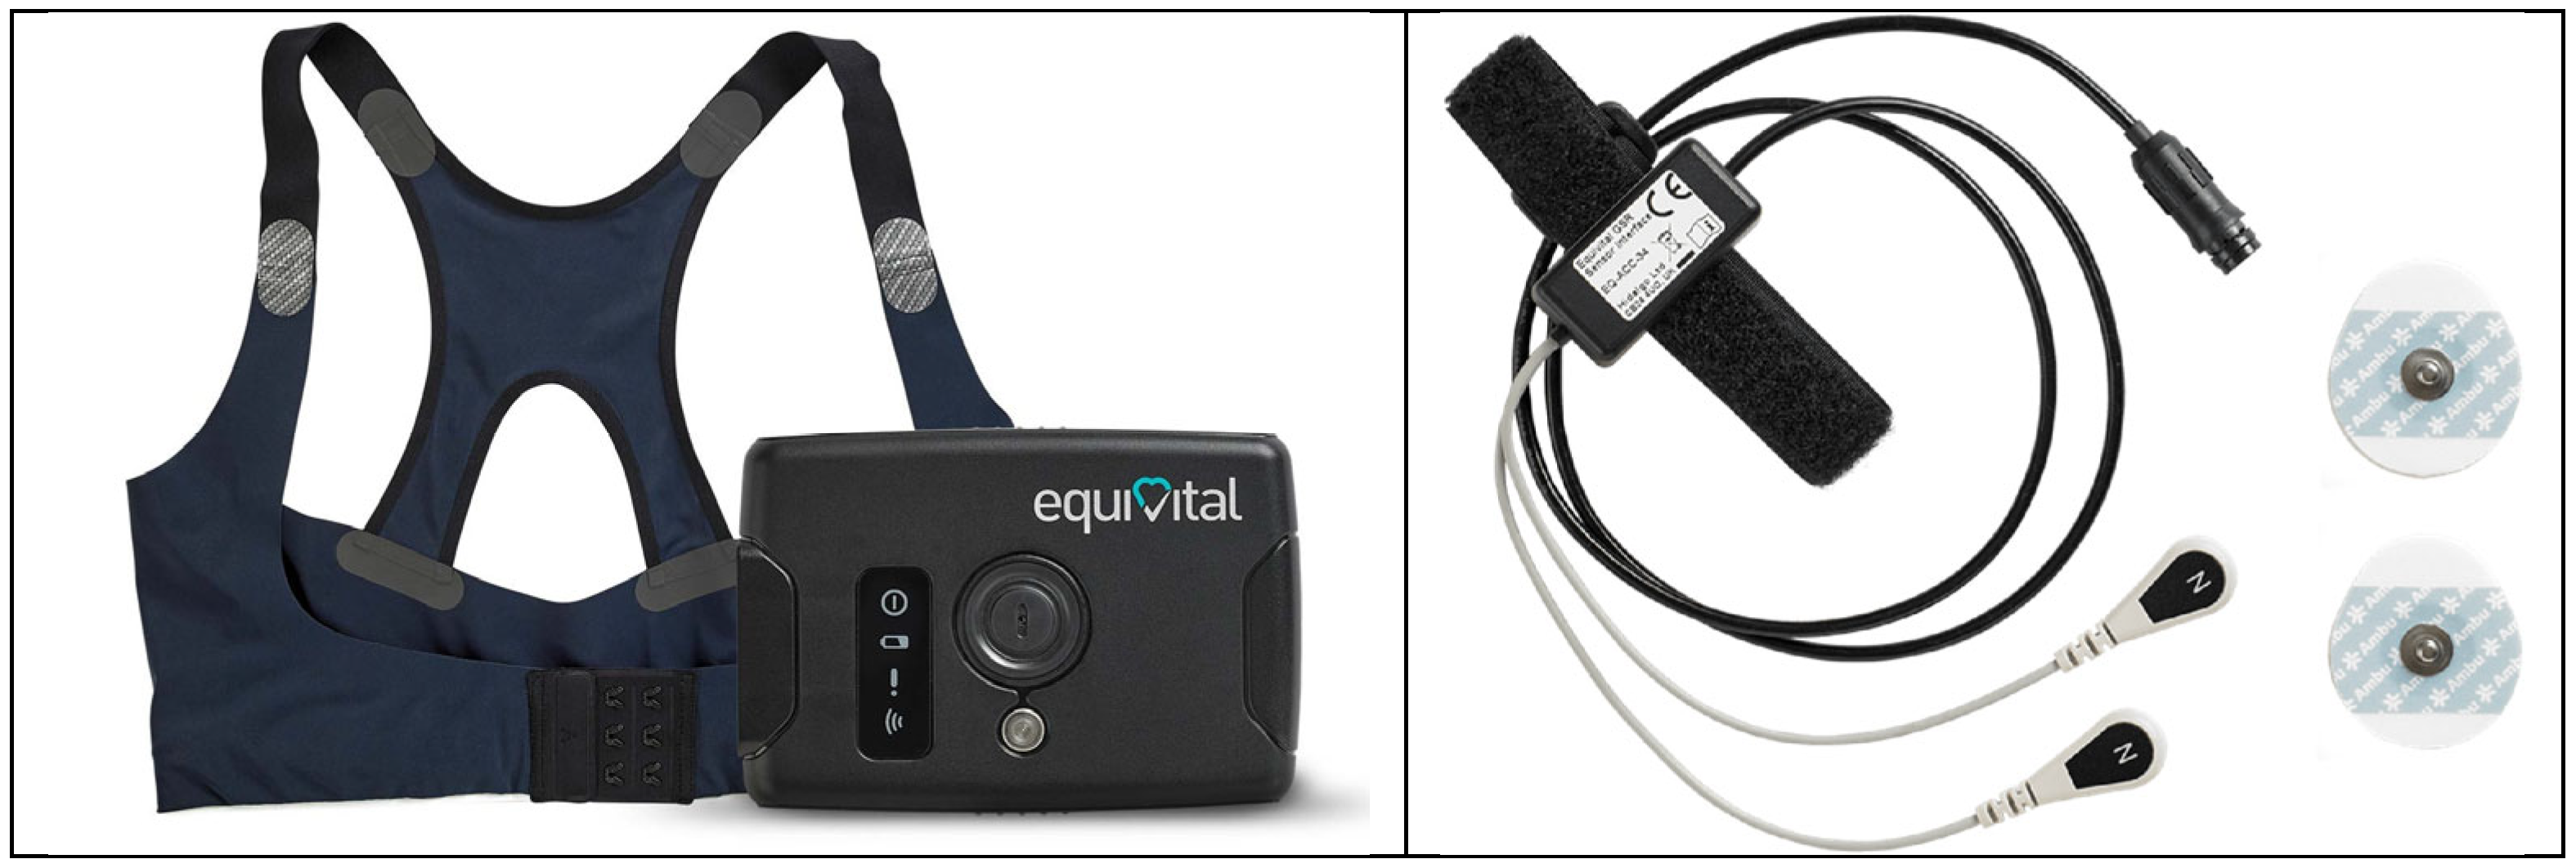
Operators wore the Equivital system (Equivital, Cambridge, UK) [24] (Figure 2). This system consists of a torso belt worn on bare skin containing a sensor to measure HR and BR, as well as two sensors attached to the tip of the index finger to record GSR.
The data were processed such that, for each assembly station, mean values of the physiological parameters were calculated for each support level, as well as, within each level, averages for the periods before and after the buzzer.

2.4.4. User Experience Variables

Following the VR session, the operators were asked to complete questionnaires on a tablet. The questionnaires were provided in Dutch via Microsoft 365 Forms. To ensure a consistent scoring method and reduce response effort, all items were adapted to a uniform 1–7 Likert scale. Given the exploratory nature of this pilot usability study, this standardization was considered appropriate to facilitate ease of use and obtain initial user experience insights. All questionnaire items are provided in Appendix A.
The adapted raw NASA Task Load Index (NASA-TLX)) [25] evaluates perceived workload and consists of six items. In this study, all items were rated on a Likert scale (1–7). To ensure that higher scores reflect lower perceived workload, the scoring of the mental demand, physical demand, temporal demand, effort, and frustration items was directionally inverted, while the performance item remained unchanged. For each participant, a composite score was calculated by averaging the 6 item scores. The overall NASA-TLX score was then obtained by averaging these composite scores across participants.
The adapted Virtual Reality System Usability Questionnaire (VRSUQ) [26] assesses user experience in Virtual Reality environments. The questionnaire captures multiple aspects of usability, including ease of use, interaction quality, and system performance. All nine items were rated on a Likert scale (1–7). To achieve a consistent interpretation, items that were negatively formulated were directionally inverted so that higher scores reflect higher perceived usability. For each participant, a composite score was calculated by averaging the nine item scores. The overall VRSUQ score was obtained by averaging these composite scores across participants.
The adapted Multimodal Presence Scale (MPS) [27] evaluates perceived presence. It assesses different dimensions of presence, including physical presence and self-presence. The social presence subscale was omitted in this study, as the VR training did not involve interactions with other individuals or virtual characters. All items were rated on a 1–7 Likert scale. No directional inversion was required, as all included items were positively formulated and higher scores directly reflect a stronger sense of presence. For each participant, a composite score was calculated by averaging the 10 item scores. The overall TLX score was then obtained by averaging these composite scores across participants.
Perceived learning effect was evaluated with 3 custom questions to assess participants’ confidence in task performance after the VR training and their perceived effectiveness of VR for learning new assembly procedures compared to traditional methods. All items were rated on a 1–7 Likert scale, with higher scores reflecting a higher learning effect. For each participant, a composite score was calculated by averaging the 3 item scores. The overall TLX score was then obtained by averaging these composite scores across all participants.
Overall user experience was evaluated using 4 custom items focusing on physical comfort and engagement. All items were rated on a 1–7 Likert scale, with higher scores reflecting a better overall experience. For each participant, a composite score was calculated by averaging the 4 item scores. The overall TLX score was then obtained by averaging these composite scores across participants.
Additionally, two open-ended questions were included to enable operators to provide more detailed feedback on any technical issues encountered, as well as on aspects of the traditional training method they perceived to be lacking in the VR environment.

2.5. Statistical Analysis

All continuous variables were analyzed with means and standard deviations (SD), and categorical variables with frequencies and percentages.
The effect of VR experience on completion time was examined using an independent samples t-test with Welch’s correction. A Shapiro–Wilk test indicated that the data were normally distributed (W = 0.962, p = 0.622). Although Levene’s test was not significant (F(1, 17) = 0.664, p = 0.426), Welch’s t-test was used because it is more robust, particularly in small samples where violations of assumptions may be harder to detect. In addition to hypothesis testing, effect sizes were calculated using Cohen’s d to quantify the magnitude of group differences. A boxplot was used to visually inspect and illustrate the distribution of completion times across groups.
The effect of VR experience on hint usage was assessed using categorical data analysis. The number of hints requested showed a highly skewed distribution, with a large proportion of observations equal to zero. Therefore, the variable was dichotomized into a binary outcome indicating whether a hint was requested for a given task (0 = no hints, 1 = at least one hint). Because multiple tasks were performed by the same operators, observations were not fully independent. As a result, the analysis was conducted at the task level rather than the participant level. The sample consisted of 19 task-level observations derived from a smaller number of operators, and results should be interpreted with caution due to the potential violation of the independence assumption. Group differences between expert and novice operators were analyzed using a chi-square test of independence. Given the relatively small sample size, Fisher’s exact test was additionally performed as a robustness check. The association between expertise and hint usage was further examined using the log odds ratio with corresponding 95% confidence intervals.
Differences in physiological responses were examined across both support levels and VR expertise groups using mixed repeated-measures analyses of covariance (ANCOVAs). Support level (three levels) was included as a within-subject factor, and VR experience (novices vs. experts) as a between-subject factor. Baseline values were entered as covariates to control for inter-individual differences. Post hoc pairwise comparisons with Bonferroni correction were conducted to further explore differences between support levels. Additionally, boxplots of the estimated marginal means were generated to visualize patterns of physiological responses across support levels for both expert and novice operators.
To address whether physiological responses differ before versus after the buzzer during VR training, and whether this effect varies as a function of VR experience and support level, a mixed-design repeated-measures ANOVA was conducted on HR, GSR, and BR. For each participant and condition, mean values were computed over the full duration preceding and following the buzzer event. Time (pre- vs. post-buzzer) and support level (three levels) were included as within-subject factors, and VR experience (expert vs. novice) as a between-subject factor. To support interpretation, boxplots of estimated marginal means were generated.
As the analyses addressed distinct research questions, they were not considered part of a single family of hypotheses. Therefore, no global correction for multiple testing was applied, and Bonferroni correction was used for post hoc comparisons where appropriate.
Statistical analyses were conducted using JASP (Version 0.97.1). All tests were two-tailed, and the significance level was set at α = 0.05.

2.6. Ethical Considerations

All data were collected pseudonymously and stored on a secure local server, allowing the data to be analyzed further without exposing any personal information. Each participant signed an informed consent agreement stating this clearly, reassuring them that the study results would not be used by their employer or any other party to evaluate their task performance, but to evaluate the potential added workload of the VR training.

3. Results

3.1. Participant Characteristics

Eleven operators participated in the study. All participants have at least five years of experience in car assembly. Among them, seven operators have little to no experience with Virtual Reality (VR), most of whom are aged 45 years or older. In contrast, all operators with VR experience are younger than 45 years. An overview of the participants’ characteristics is presented in Table 4.
Each operator performed 1 to 3 assembly stations, with all but 3 persons (i.e., person 6, 9, and 11) going through the 3 levels of support on at least 1 of the assigned assembly stations. Table 5 shows which assembly stations the operators did and with what support levels.

3.2. Results on User Experience

Table 6 presents operators’ mean scores for each VR experience variable. In addition, an overview of the key findings for each variable is provided. More detailed information, including the full list of questions and each operator’s responses, can be found in Appendix A.
Perceived workload. Overall, the workload was considered manageable. The lowest scoring aspect was the perceived time pressure during the task. This is likely due to the strict time limit that was imposed. Most operators were unable to meet this target on their first attempts. When the time ran out, a short alarm sounded, but participants were still allowed to complete the task at their own pace afterward. Furthermore, there was some uncertainty about whether reaching the required performance level was easy. This was particularly reported by VR novice operators, which may be attributed to their limited familiarity with Virtual Reality, as they were not yet fully comfortable or proficient in navigating and interacting with the virtual environment. The highest levels of agreement were observed for statements indicating that the VR training involved relatively low physical demands, that task completion was generally successful, and that levels of stress, irritation, and boredom remained low.
Perceived usability. Overall, operators perceived the VR system as usable. There was a strong consensus that the virtual environment was clearly structured and engaging to use. However, lower scores were observed for aspects related to error handling, with some participants indicating that they occasionally repeated mistakes and struggled to correct them. These difficulties can be partly attributed to a minor technical issue that made it challenging to attach a hook to a device, as well as to certain steps in the procedure that were inherently more complex, such as connecting a cable. Despite being a commonly reported issue in VR applications, symptoms such as motion sickness or headaches were almost entirely absent among participants.
Perceived presence. Overall, operators reported a clear sense of presence within the virtual environment. A particularly well-rated aspect was the feeling that the avatar (i.e., the virtual hands visible in the environment) functioned as an extension of their real body. Lower scores were given for bodily ownership, as reflected in the statement that events affecting the avatar did not translate into corresponding sensations in the real body. This may be explained by the fact that, in real-world conditions, operators would typically exert greater physical force, such as when lifting materials, which is not replicated in the virtual environment. Finally, a few participants indicated that they sometimes experienced the sensation of controlling the environment from an external perspective, rather than being fully immersed within it. This may be attributed to the limited representation of the avatar, which consisted only of hands rather than a full body.
Perceived learning effect. Overall, operators felt that VR training could serve as an effective method for teaching assembly procedures, which is reflected in the positive responses across all related questions. Scores were slightly lower regarding their confidence that the VR tool would allow them to train thoroughly on an assembly task. This may be partly due to the fact that they were exposed to only one to three workstations during the study, which may have limited their sense of the complete workflow. Nevertheless, the perceived learning effect was rated highly overall.
Overall VR experience. Operators (with the exception of two) reported feeling equally or more engaged during the VR training compared to traditional training methods. In addition, operators were positive about the comfort of the headset. However, two participants reported experiencing eye strain while using the VR headset, indicating that minor discomfort may occur for some users.
Open-ended questions. Operators also responded to two open-ended questions. The first question addressed any technical issues that may have occurred during the VR experience. One participant reported experiencing an unsmooth image for a brief period. Another participant encountered difficulties using the controllers, likely due to limited prior experience with VR. A third participant reported issues with the calibration of the Equivital device, which required reattaching the sensor to obtain accurate measurements. The second question explored whether operators felt that anything was missing in the VR training compared to traditional training methods. One commonly mentioned aspect was the absence of haptic feedback, particularly the lack of perceived weight and tactile sensation of materials. Additionally, one participant indicated that they missed receiving more introductory guidance, such as additional tips about the assembly station at the start of the task.

3.3. Results on Task Performance

3.3.1. Task Completion Time and the Number of Hints Requested

An overview of the time needed to complete the task and the number of hints requested for each operator is provided in Table 7.
Task completion time: On average, operators needed between 1.5 times (i.e., assembly station 1) and up to almost 4 times (i.e., assembly stations 2 and 3) the takt time to complete the task. At the individual level, only 1 operator had completed an assembly task within takt time (i.e., at station 4). For every other task, operators needed a minimum of 148% (station 1) to a maximum of 375% (station 2) of the takt time. It is important to note that this was rather expected, as it was their first time going through the tasks at hand. Feedback from the automotive company indicated that operators need to be trained in the tasks for some weeks before reaching the targeted task time.
Hints: No hints were requested at assembly stations 1, 4, and 5. At station 3, a maximum of 1 hint per operator was requested. At station 2, one operator asked for 2 hints.

3.3.2. The Effect of VR Expertise on Completion Time

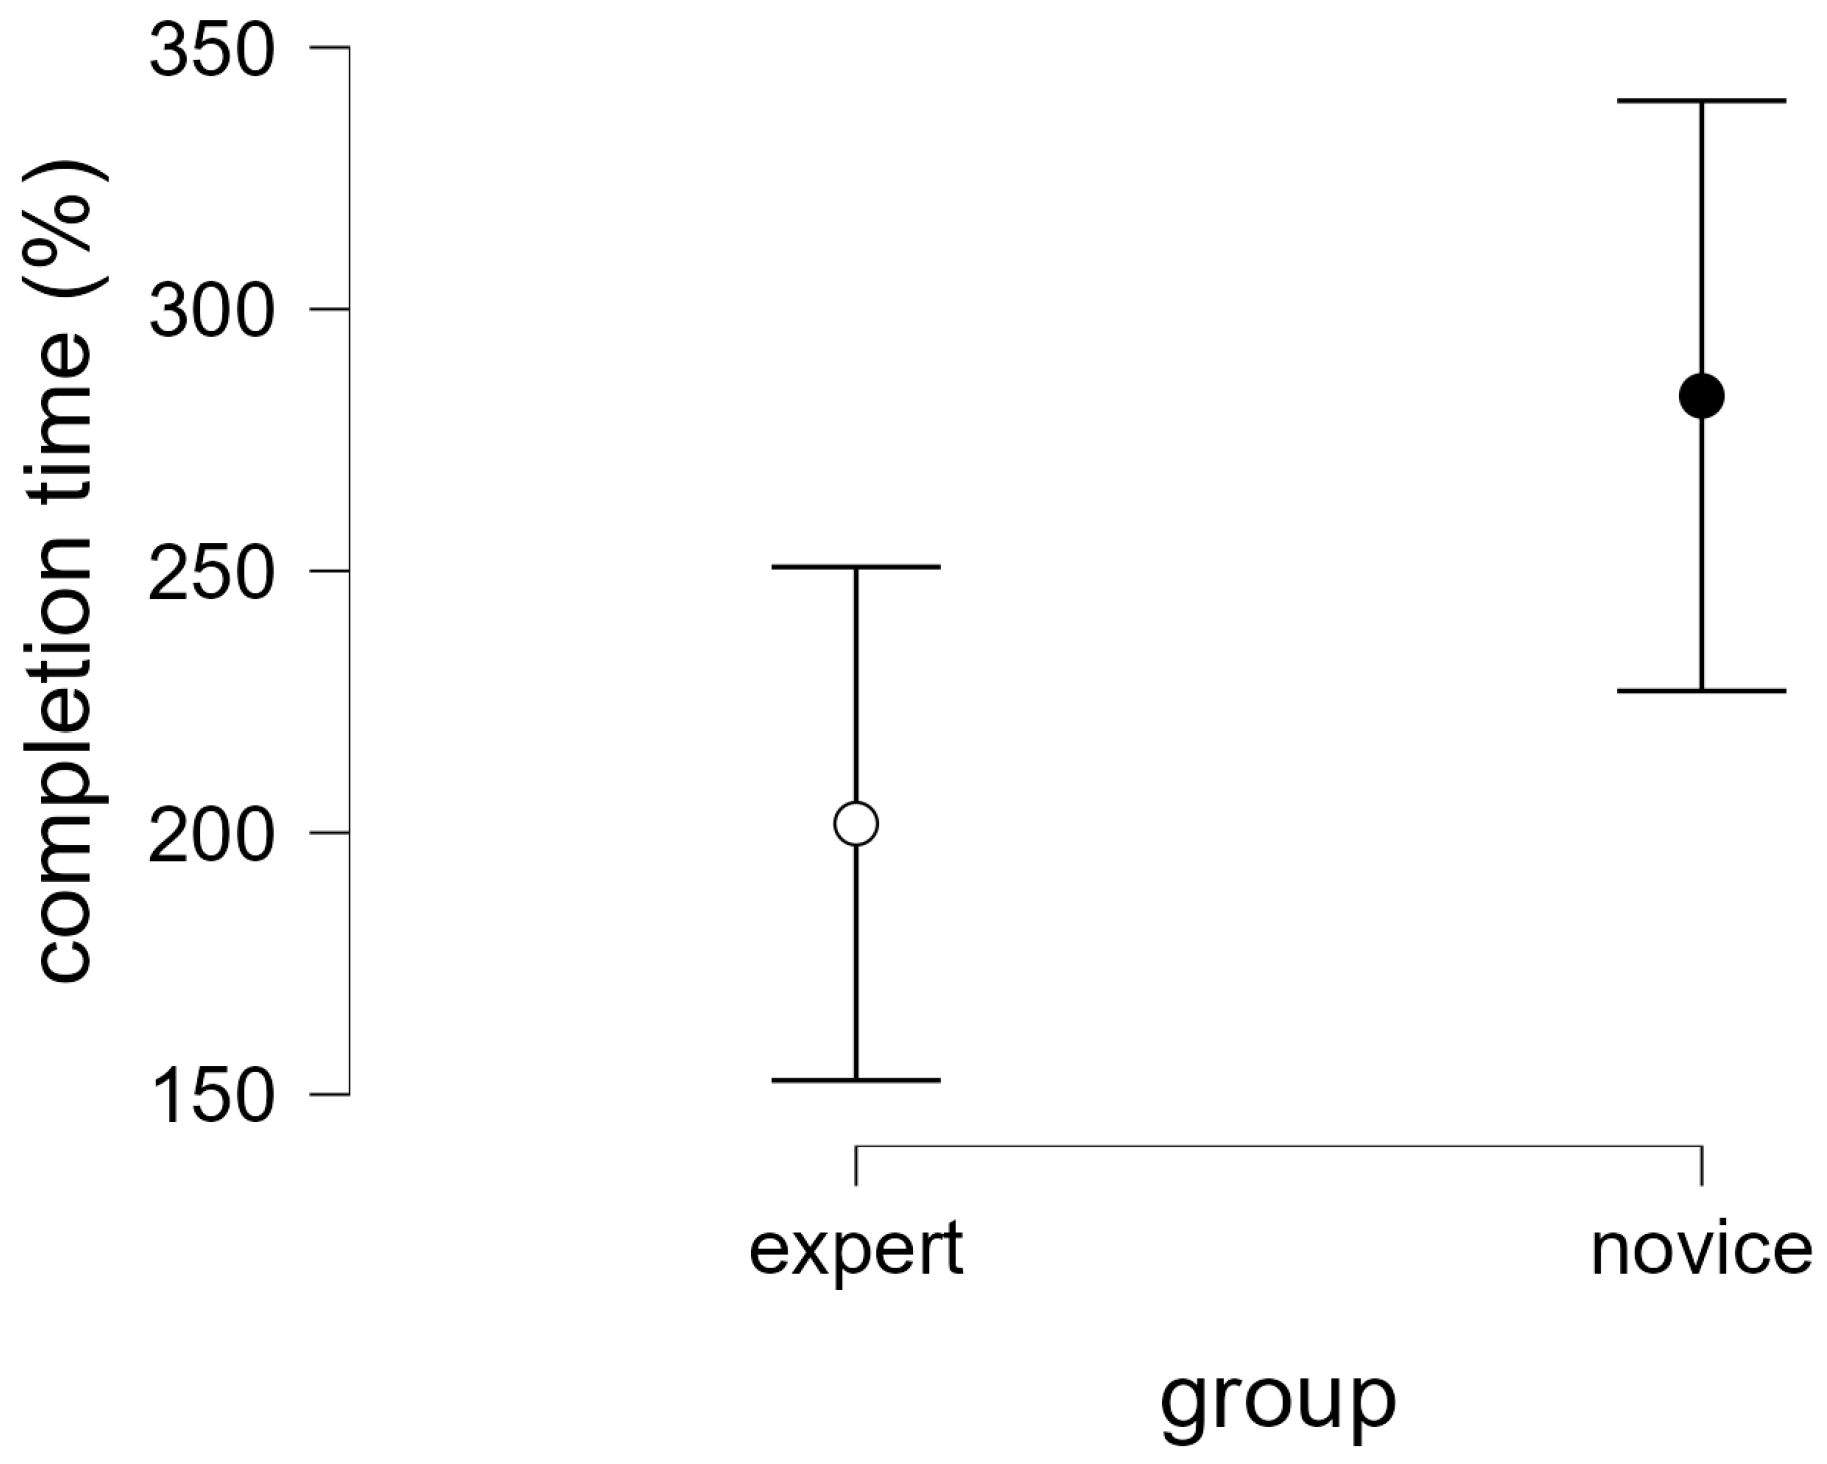
To evaluate whether operator expertise influences task performance, a Welch’s t-test was conducted on completion time. Novices (M = 283.4%, SD = 78.79%) showed higher completion times than experts (M = 201.7%, SD = 63.79%). This difference was statistically significant, t(16.84) = −2.50, p = 0.023, indicating that novices required more time to complete the tasks than experts. The effect size was large (Cohen’s d = −1.14), suggesting a substantial difference between the two groups. Figure 3 illustrates the distribution of completion times for both groups using a boxplot.

3.3.3. The Effect of VR Experience on the Number of Hints Requested

To examine whether VR experience influences the use of hints, a chi-square test of independence was conducted at the task level. Among expert operators, 1 out of 9 tasks (11.1%) involved a hint request, whereas 3 out of 10 tasks (30.0%) performed by novice operators involved a hint request (presented in Table 8). The chi-square test indicated that this difference was not statistically significant, χ2(1, N = 19 task observations) = 1.02, p = 0.313. Fisher’s exact test confirmed the absence of a significant association (p = 0.582). The estimated log odds ratio was 1.23, with a wide 95% confidence interval [−1.25, 3.71], indicating substantial uncertainty in the effect size. Thus, although tasks performed by novice operators appeared more likely to involve hint requests compared to those performed by expert operators, this pattern was not supported by the statistical tests. As multiple observations originated from the same operators, the assumption of independence may be violated, and the results should therefore be interpreted with caution.

3.4. Results on Physiological Measures

Physiological data were collected from 10 operators. No physiological data were available from subjects 4 and 11 because after the VR session, it was found that the live data from the sensor were not stored in the software.

3.4.1. Differences in Physiological Responses Across Support Levels and VR Experience

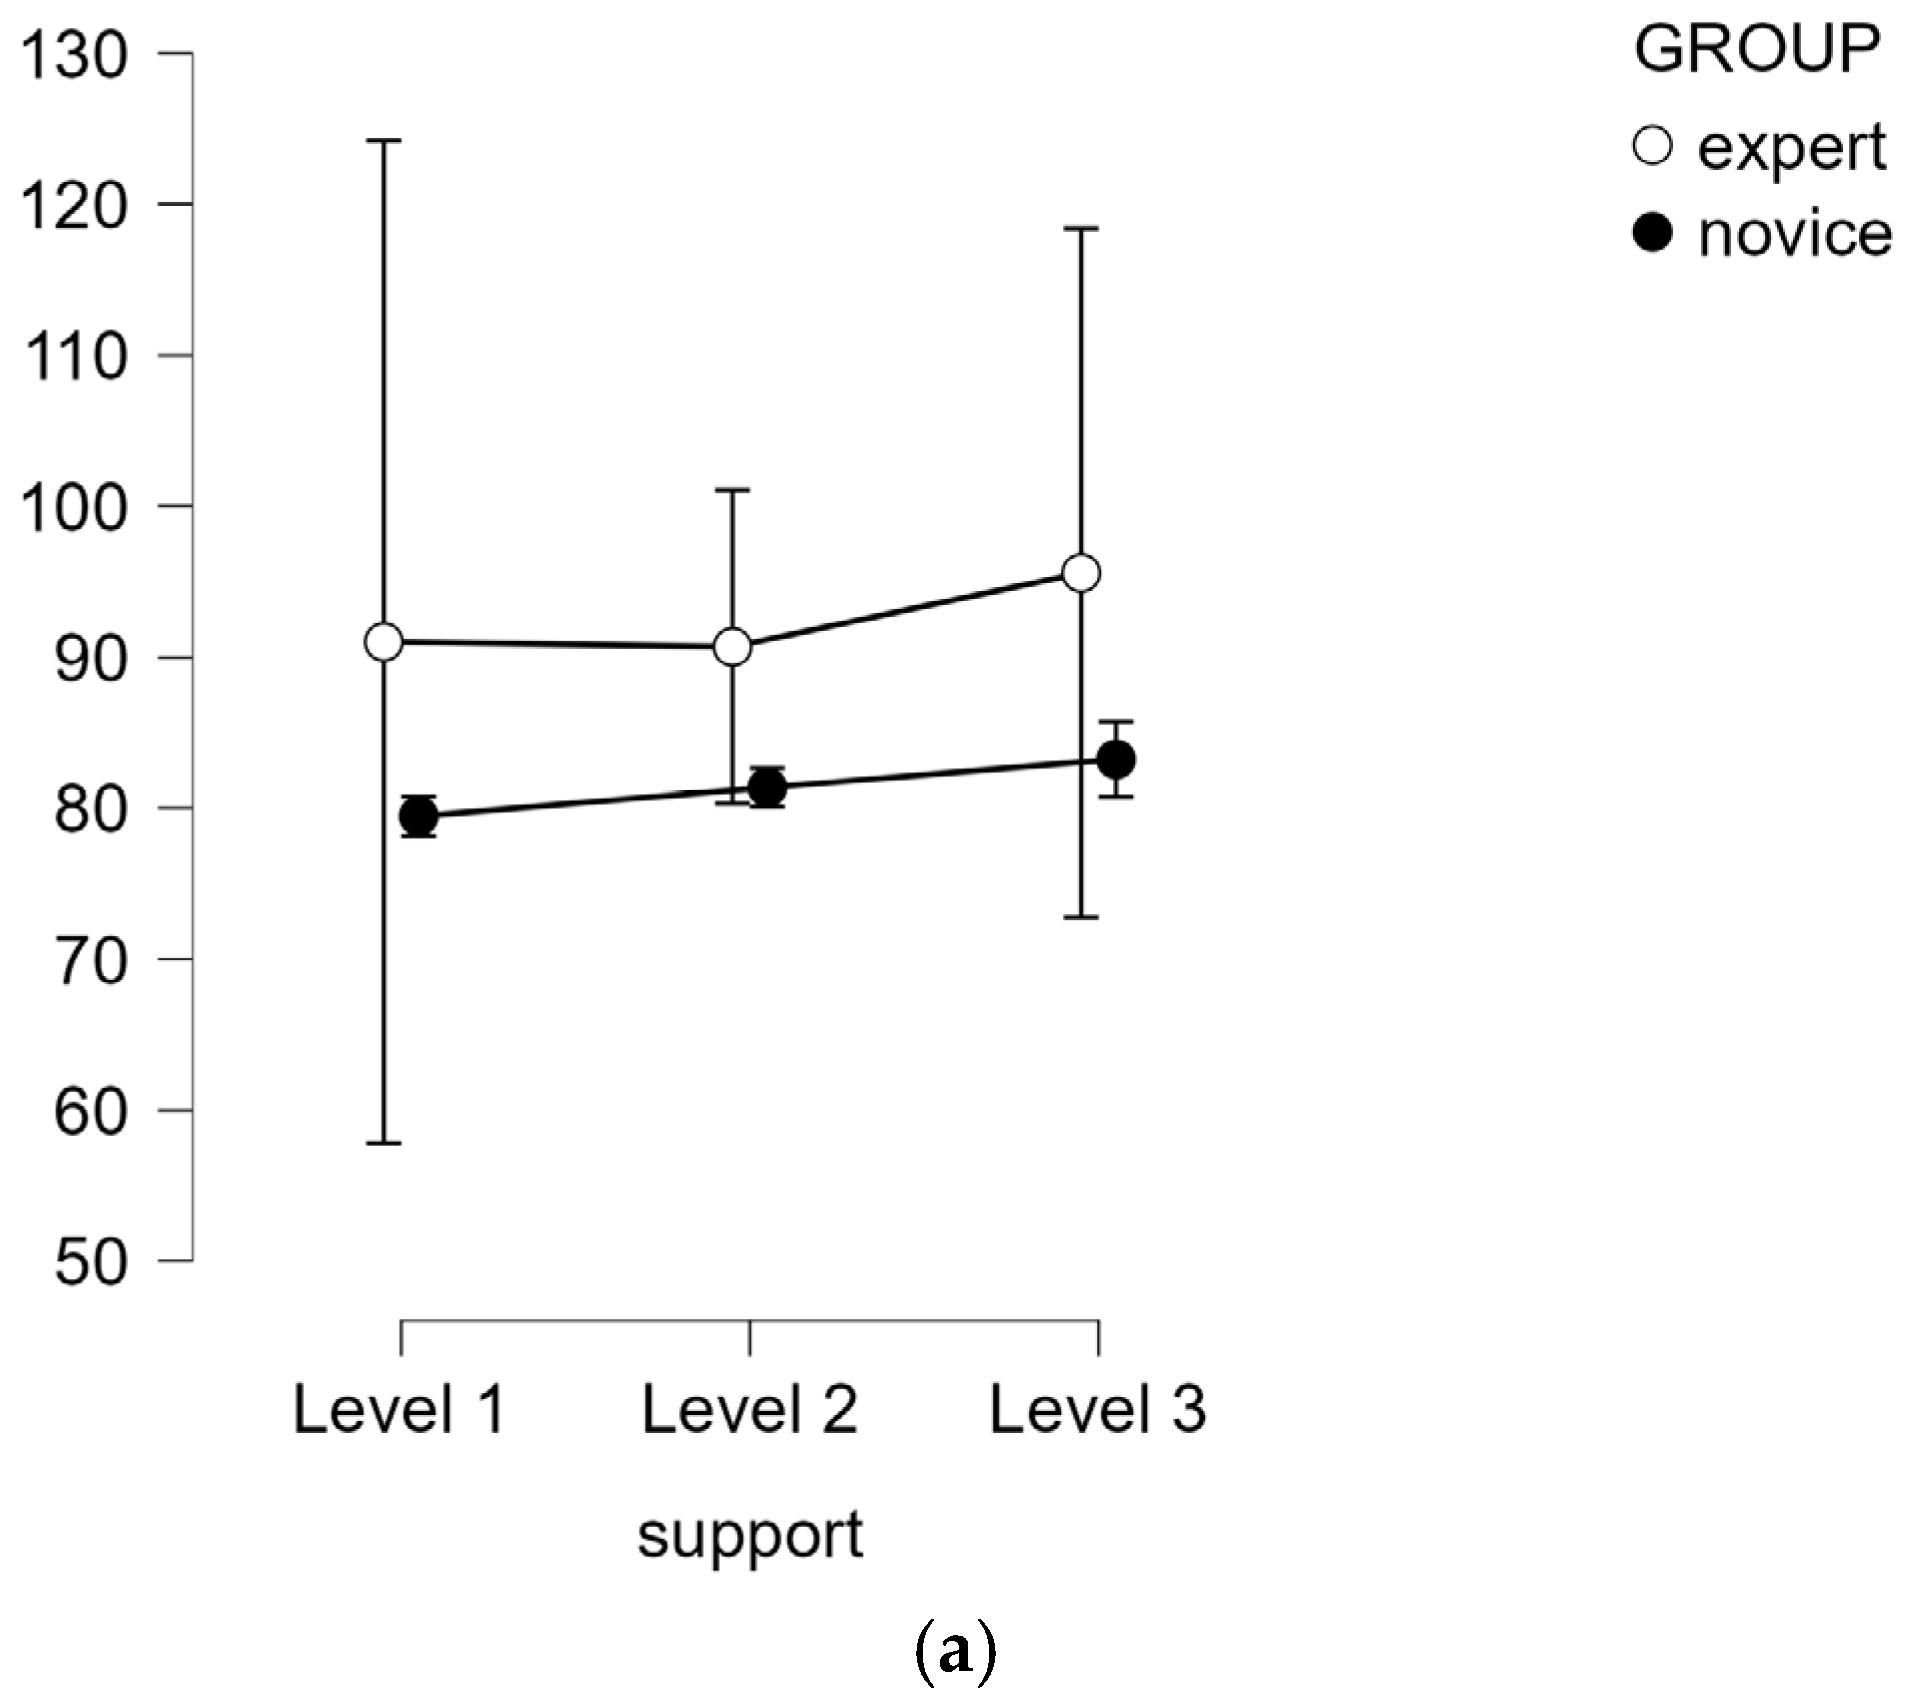
For HR, a significant main effect of support level was observed after controlling for baseline HR, F(2, 8) = 5.44, p = 0.032, indicating that adjusted HR differed across the three support levels. No significant interactions were found between support level and expertise group, F(2, 8) = 3.39, p = 0.086, nor between support level and baseline HR, F(2, 8) = 3.92, p = 0.065. A significant between-subjects effect of VR experience group was observed, F(1, 4) = 8.16, p = 0.046, suggesting that HR differed between novices and experts after accounting for baseline differences. Baseline HR was also a significant predictor, F(1, 4) = 113.90, p < 0.001, indicating that individual baseline levels strongly influenced HR responses.
For BR, no significant main effect of support level was found, F(2, 8) = 2.92, p = 0.111. Similarly, there were no significant interactions with VR experience group, F(2, 8) = 1.22, p = 0.346, or baseline BR, F(2, 8) = 2.46, p = 0.147. The between-subjects effect of the VR experience group was also not significant, F(1, 4) = 0.38, p = 0.572. Although baseline BR showed a marginal trend, F(1, 4) = 7.18, p = 0.055, these results suggest that BR did not vary significantly as a function of support level or expertise when controlling for baseline differences.
Similarly, for GSR, no significant main effect of support level was observed, F(2, 6) = 1.44, p = 0.309. Neither the interaction with VR experience group, F(2, 6) = 0.22, p = 0.806, nor with baseline GSR, F(2, 6) = 1.04, p = 0.409, reached significance. There was also no significant between-subjects effect of expertise group, F(1, 3) = 0.00, p = 0.954. However, baseline GSR was a significant predictor, F(1, 3) = 44.42, p = 0.007, indicating that variability in GSR was largely explained by baseline levels rather than support level or expertise.
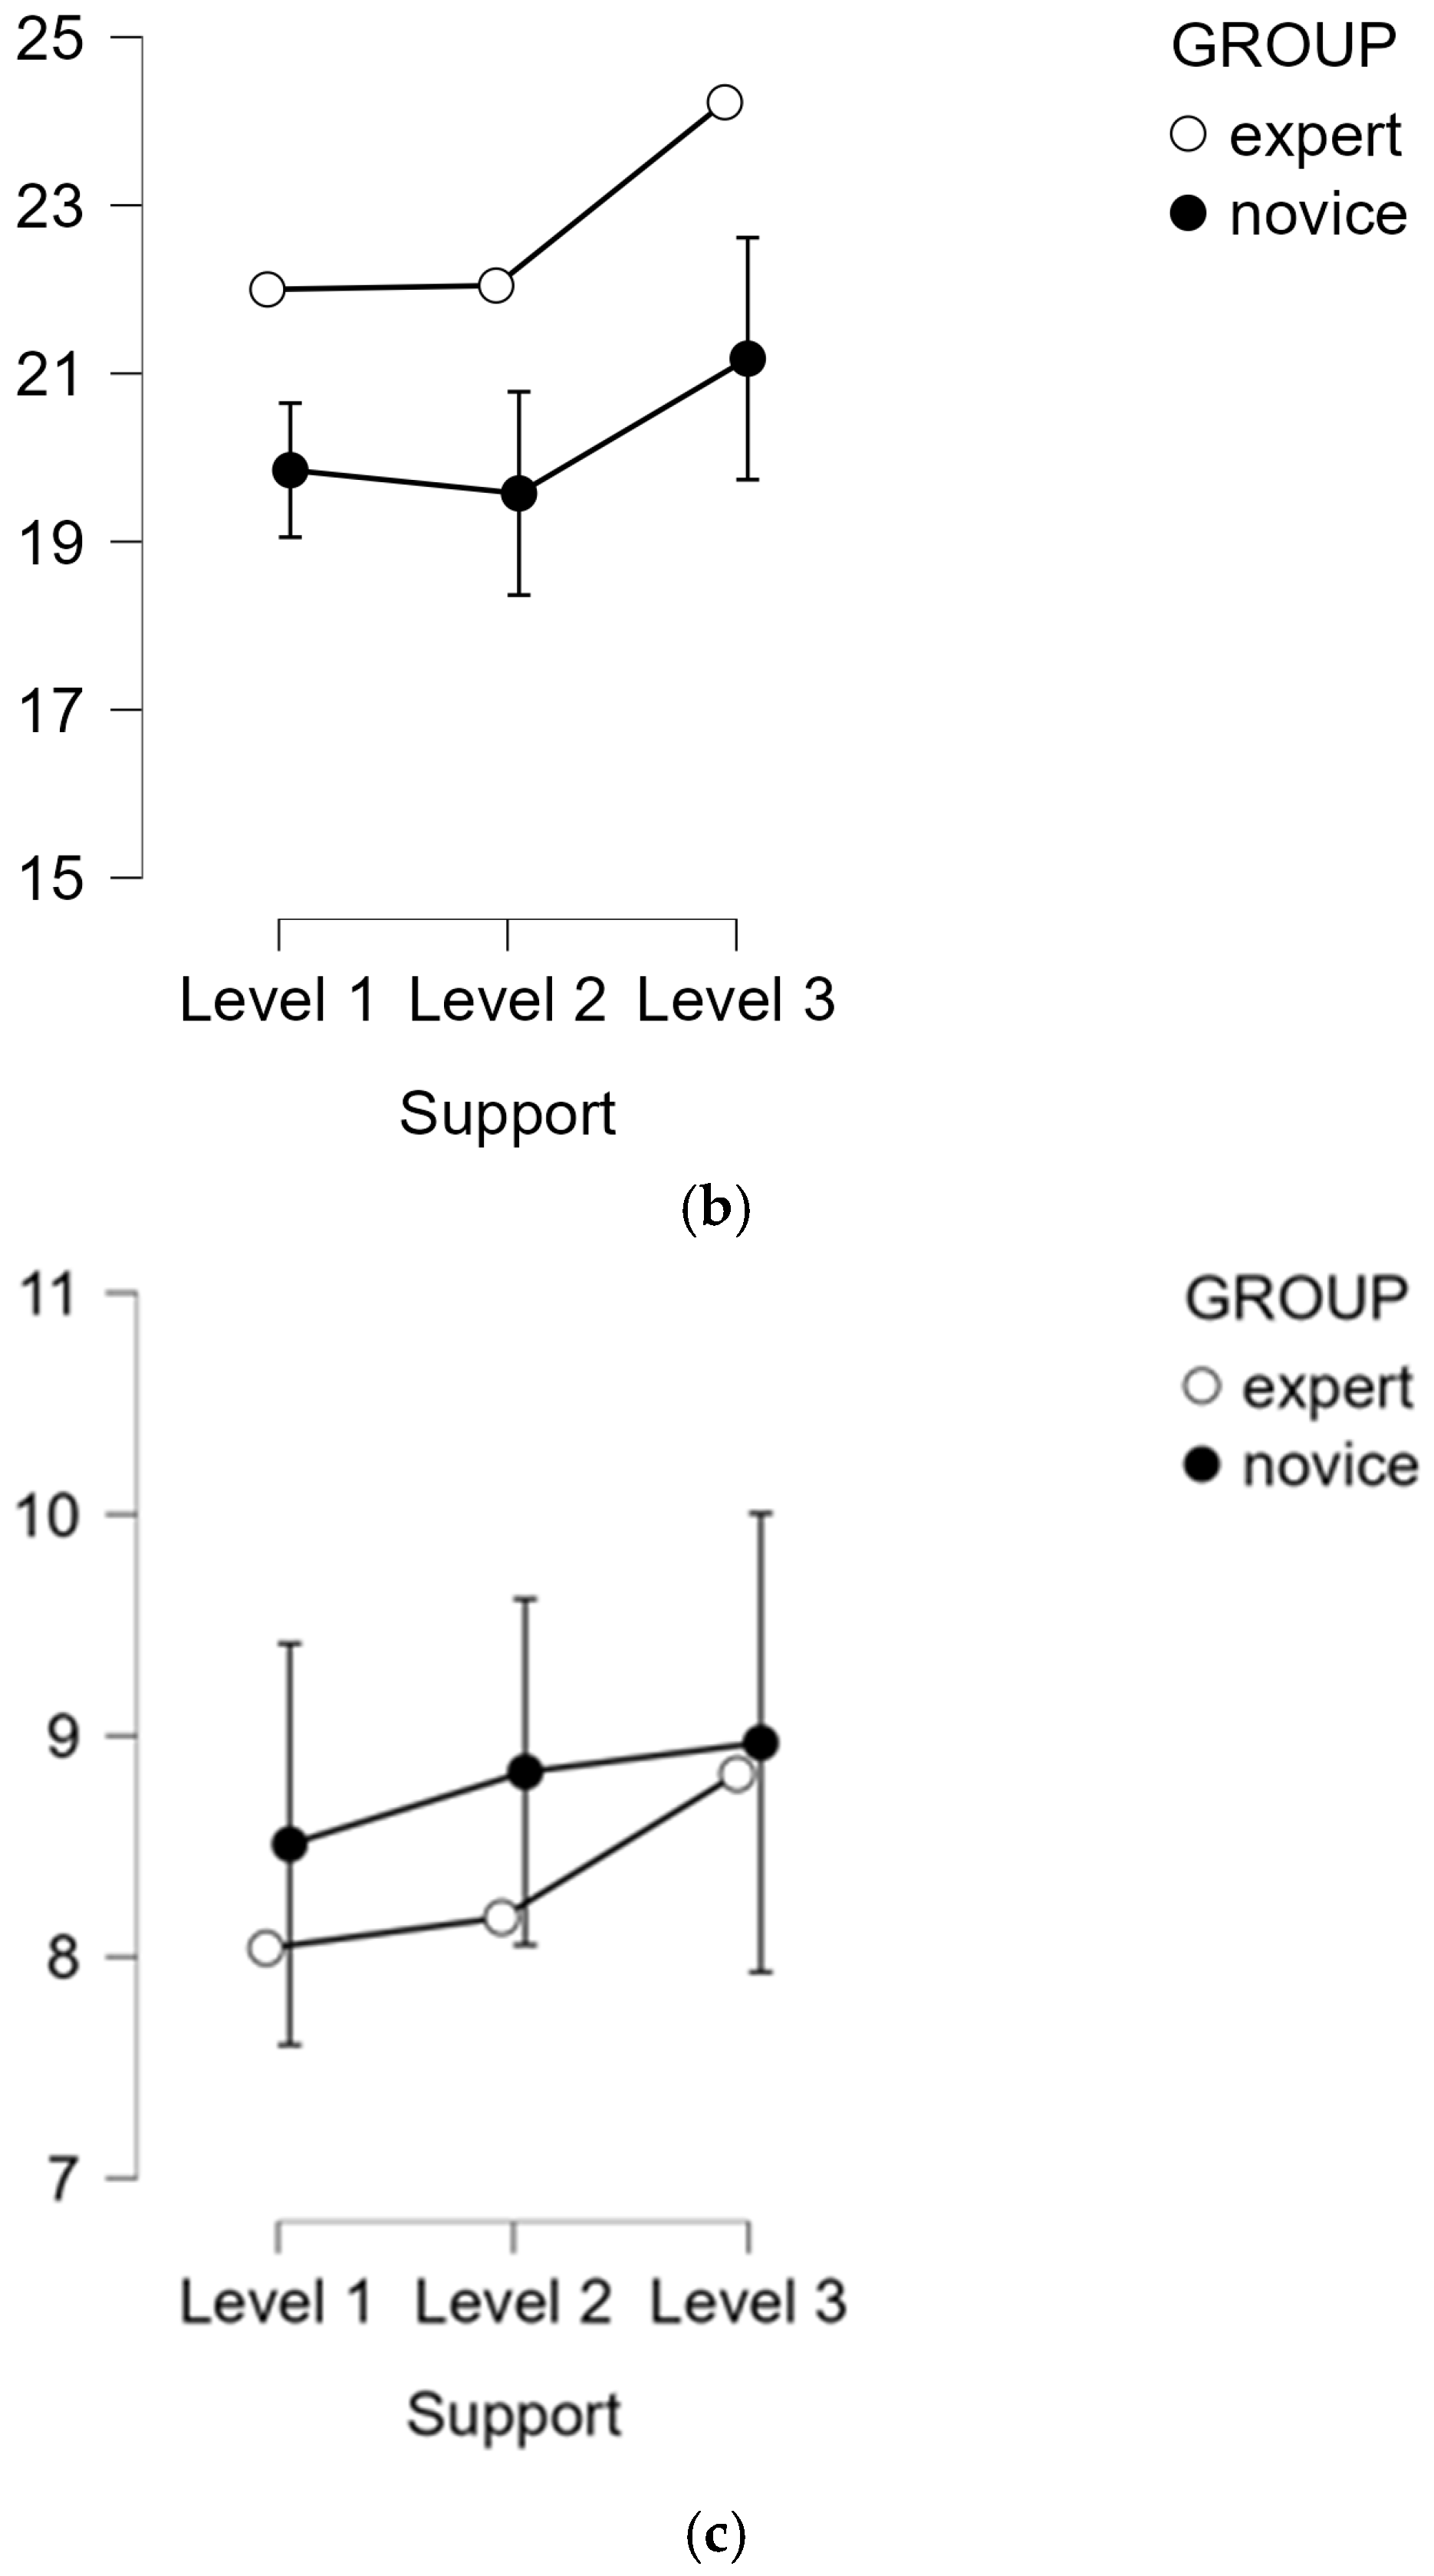
Figure 4 shows boxplots of the estimated marginal means to visualize the patterns of physiological responses across support levels for both novice and expert operators.

3.4.2. Differences in Physiological Responses Before Versus After the Buzzer

A series of mixed-design repeated-measures ANOVAs was conducted to examine the effects of Time (pre- vs. post-buzzer), Support Level (S1–S3), and VR experience (novice vs. expert) on HR, BR, and GSR.
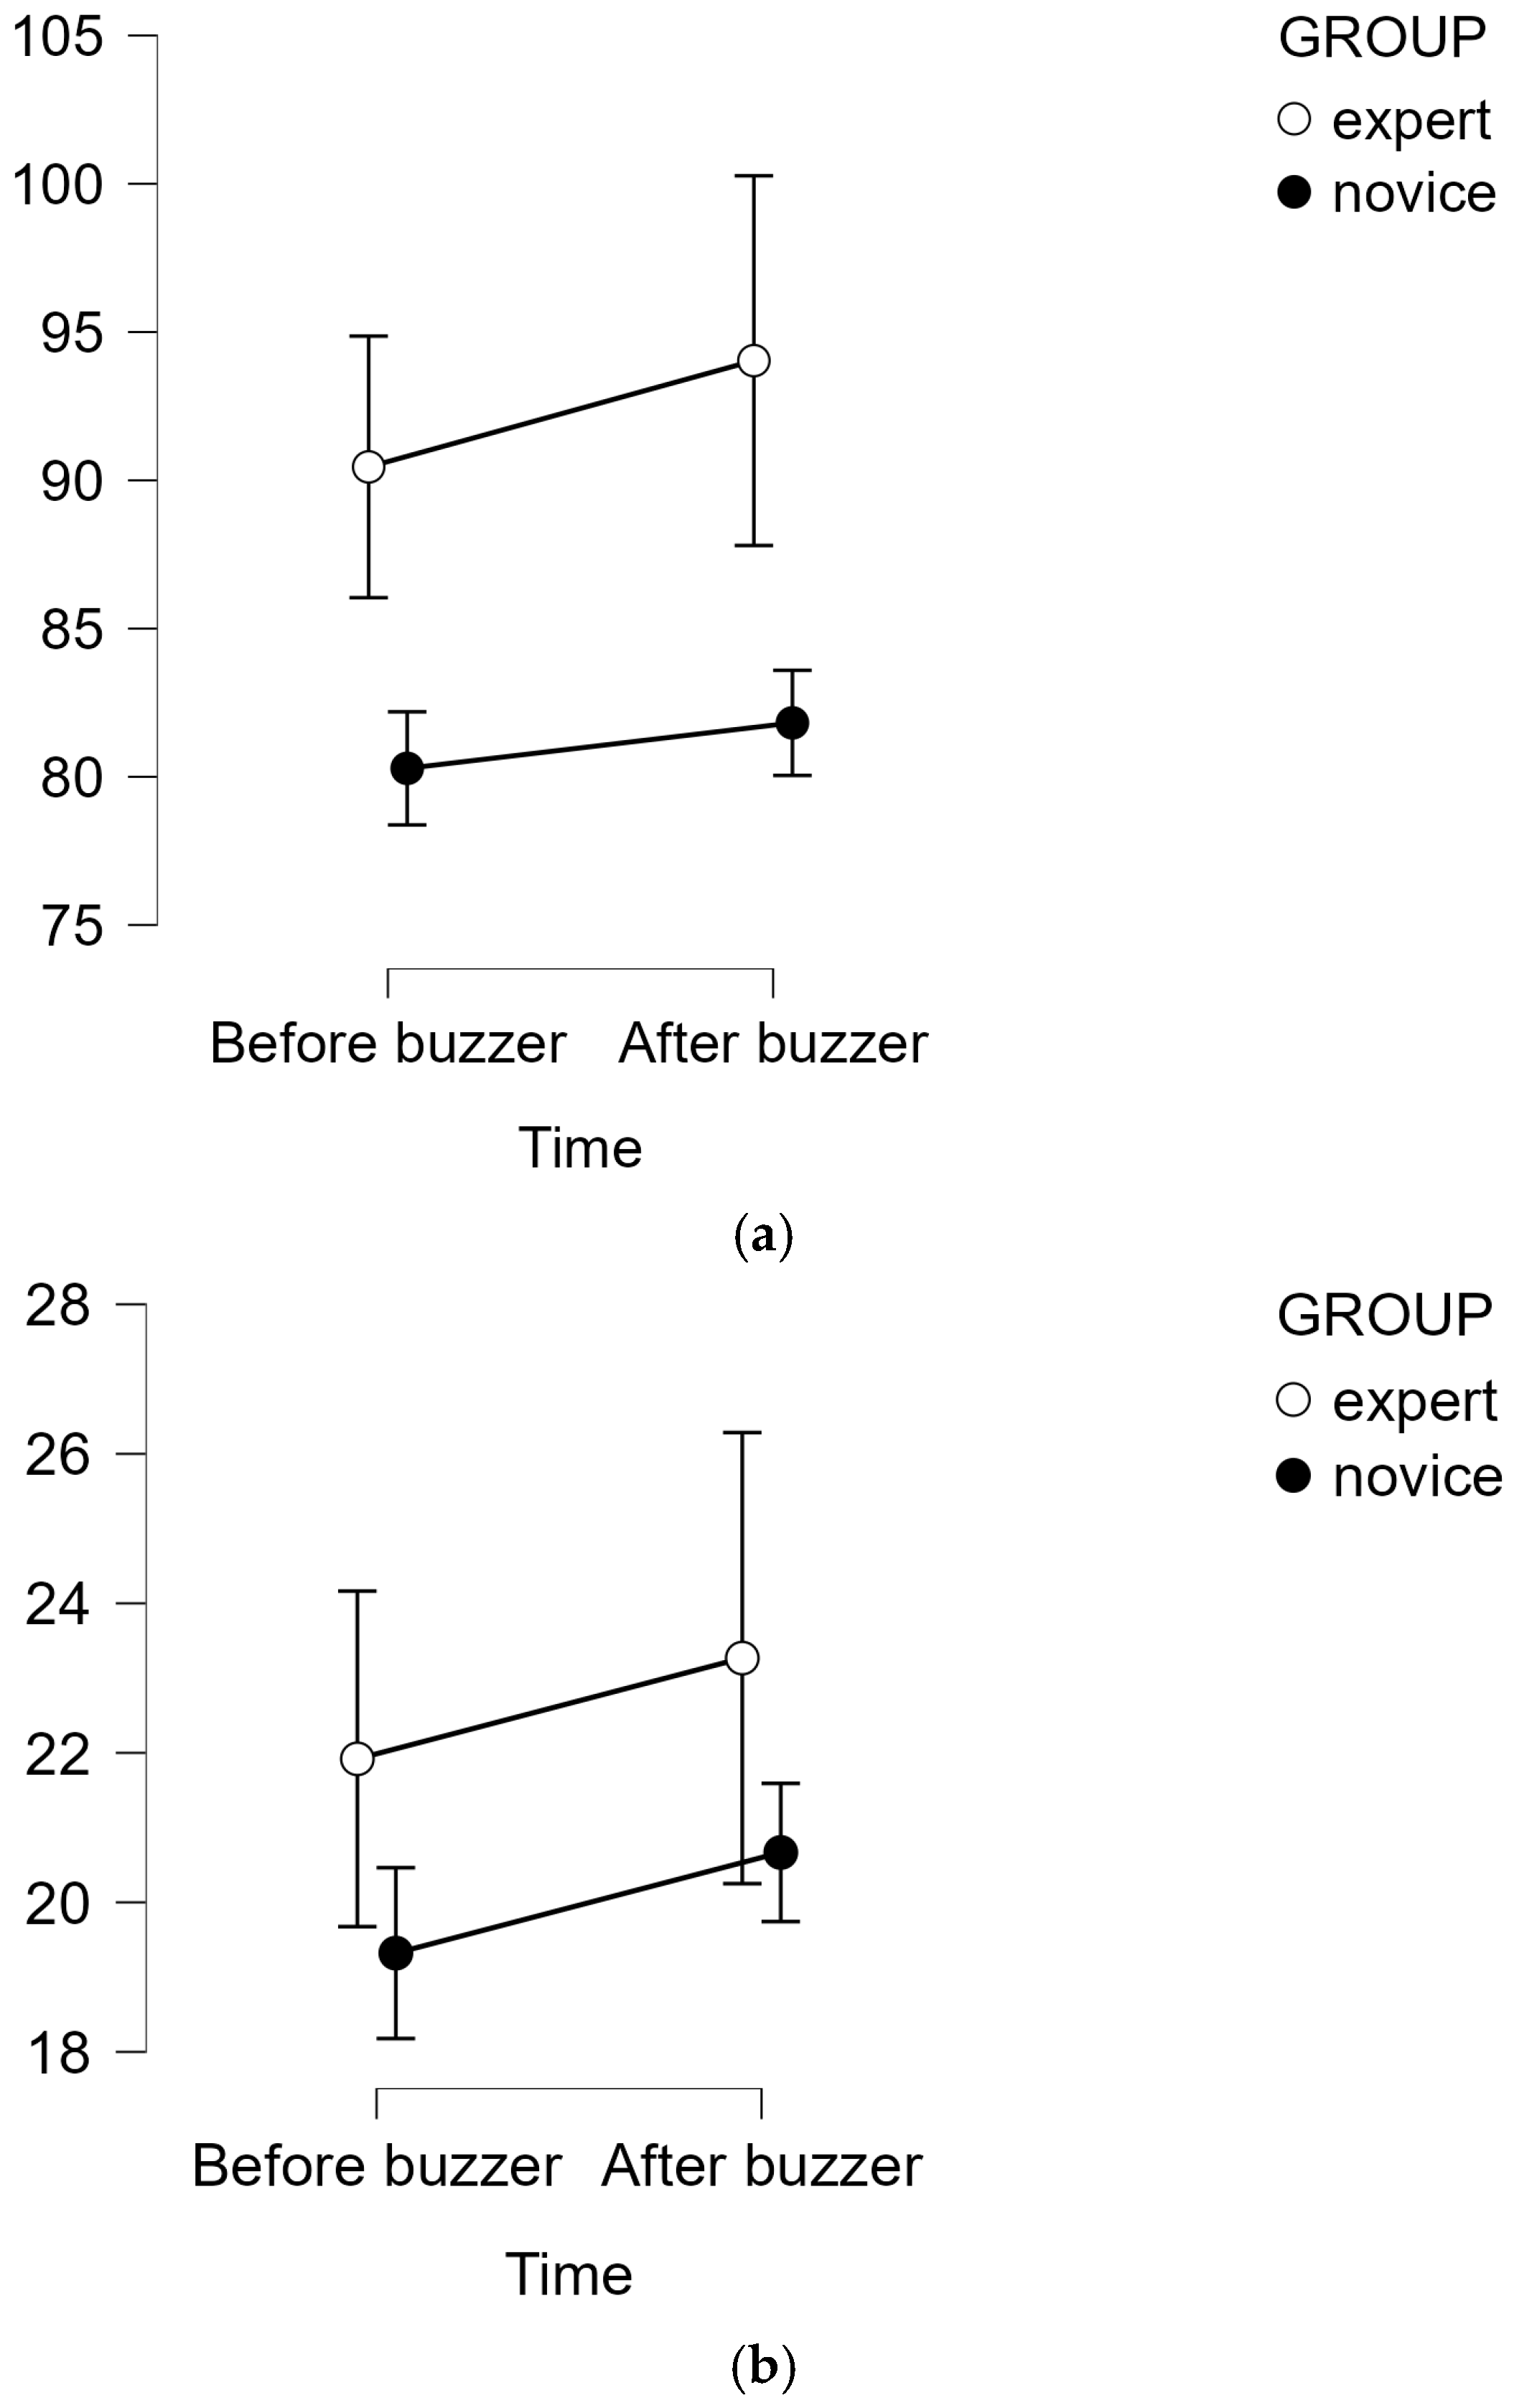
For HR, a significant main effect of Time was observed, F(1, 5) = 12.00, p = 0.018, ω2 = 0.028, indicating a small but significant increase or change in heart rate following the buzzer. Additionally, a significant main effect of support level was found, F(2, 10) = 9.61, p = 0.005, ω2 = 0.063, reflecting a medium effect, suggesting that heart rate differed across support conditions. The main effect of VR experience was not significant, F(1, 5) = 3.60, p = 0.116, although the effect size was large (ω2 = 0.178). No significant interaction effects were found, although the three-way interaction between Time, Support Level, and VR experience approached significance, F(2, 10) = 3.06, p = 0.092, ω2 = 0.004.
A similar pattern was observed for BR. There was a significant main effect of Time, F(1, 5) = 12.00, p = 0.018, ω2 = 0.028, indicating a small but significant change in breathing rate following the buzzer. A significant main effect of support level was also found, F(2, 10) = 9.61, p = 0.005, ω2 = 0.063, suggesting a moderate influence of support condition. The main effect of VR experience was again not significant, F(1, 5) = 3.60, p = 0.116, although a large effect size was observed (ω2 = 0.178). No significant two-way interactions were found, and the three-way interaction showed a non-significant trend, F(2, 10) = 3.06, p = 0.092, ω2 = 0.004.
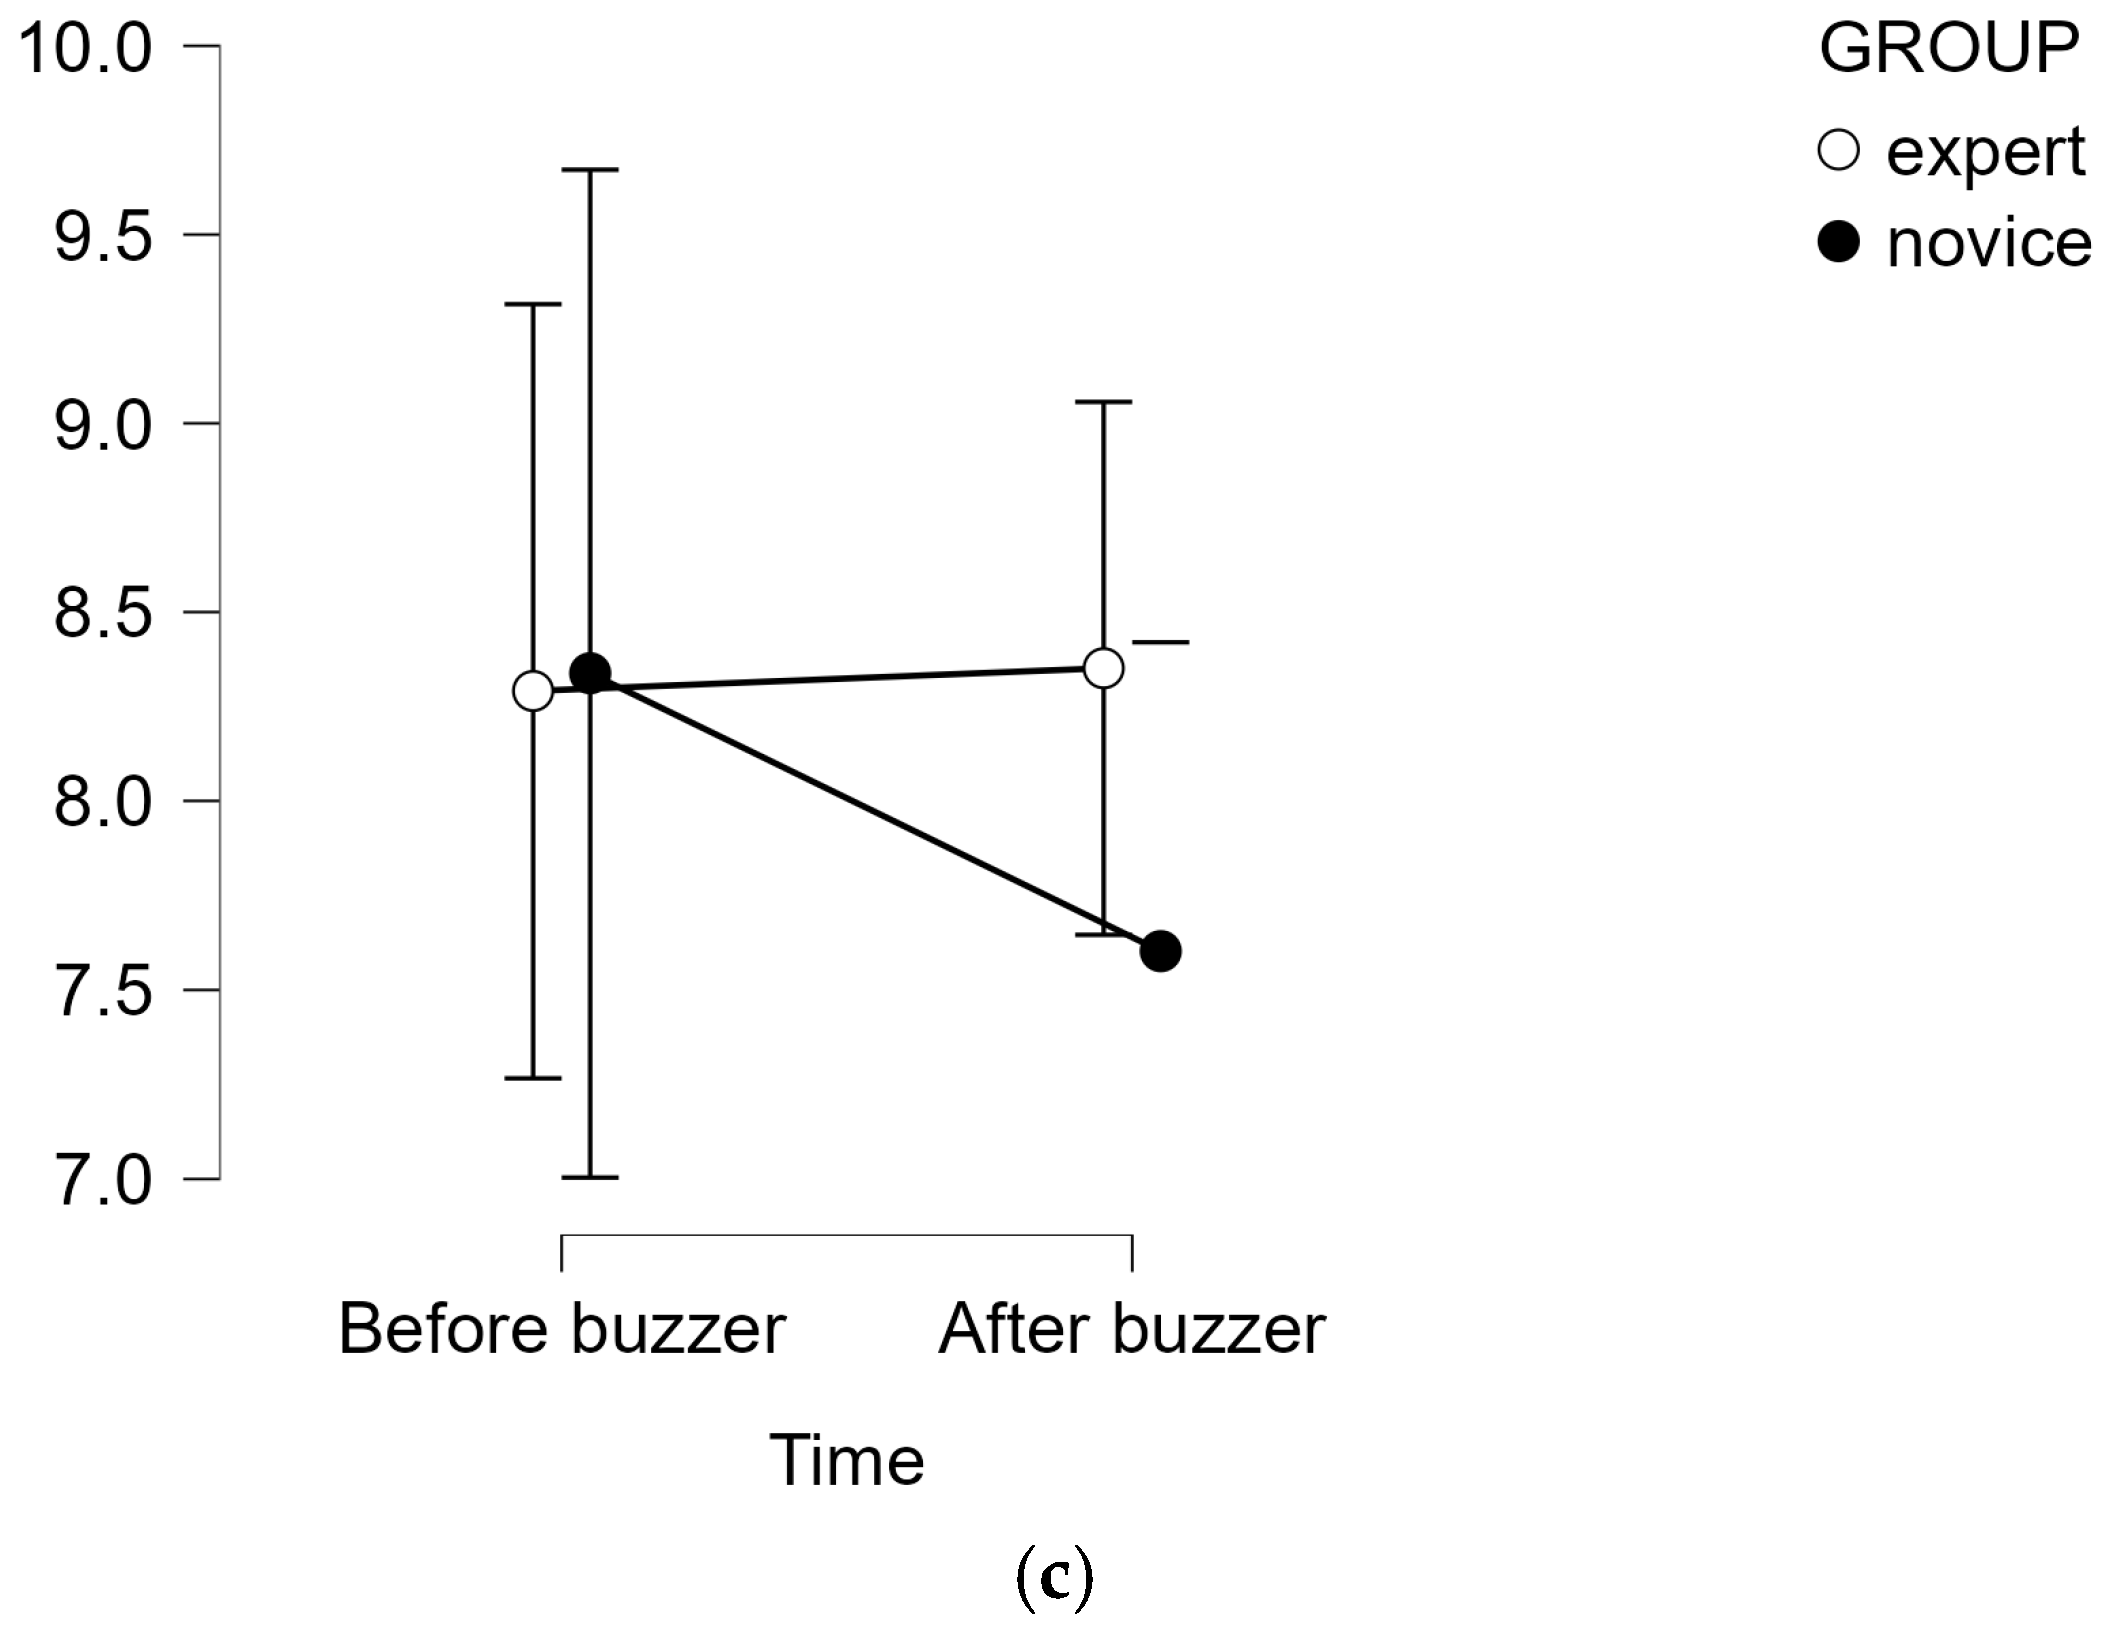
In contrast, no significant effects were found for GSR. There was no main effect of Time, F(1, 5) = 0.96, p = 0.373, ω2 ≈ 0, nor of support level, F(2, 10) = 0.03, p = 0.974, ω2 ≈ 0, and the effect of Expertise was also not significant, F(1, 5) = 0.01, p = 0.915, ω2 ≈ 0. None of the interaction effects reached significance, including the three-way interaction, F(2, 10) = 2.23, p = 0.158, ω2 = 0.002. Although Mauchly’s test indicated a violation of sphericity for some effects, this did not alter the overall pattern of non-significant findings.
Overall, these results indicate that the buzzer and support level influenced HR and BR, but not GSR. No consistent evidence was found that these effects differed as a function of expertise. Figure 5 shows a visualization of the estimated marginal means.

4. Discussion

A Virtual Reality application designed to introduce a new automotive assembly line was developed and received generally positive evaluations. Virtual training systems have been introduced in assembly contexts as efficient alternatives to physical training [28]. However, relatively little research has examined the impact of varying levels of instructional support. This study therefore investigated how different support levels influence operator performance, physiological responses, and overall user experience. The findings provide insights for future research on VR-based assembly training.
The novelty of this study lies in the introduction of a multi-level support approach within VR training. Unlike many existing VR applications, which often rely on non-adaptive, one-size-fits-all strategies mainly due to their simplicity of use and lower cost, research highlights the importance of personalized training [17].
The results of this study showed that perceived bodily ownership was relatively low. This finding is supported by the literature, which suggests that using controllers instead of hand tracking can reduce the sense of embodiment [29]. In addition, only the users’ hands were visible during the VR training, while the rest of the body was not represented. Including the feet and head, or even implementing a full-body avatar, could strengthen the sense of embodiment [30]. Furthermore, the training offered very limited kinesthetic feedback. Apart from a brief vibration and sound when interacting with objects, no meaningful haptic sensations were provided while handling parts that are normally heavy. Although advanced haptic devices exist, they are currently expensive and not yet sufficiently mature for widespread VR integration. A more feasible alternative is the use of “pseudo-haptics,” which simulate tactile or resistive sensations through visual illusions. For example, rendering heavier objects to move more slowly than lighter ones can create the illusion of weight [31].
The perceived learning effect was rated lower with regard to the statement that participants had confidence that the VR tool would allow them to fully master the assembly task. This may partly be explained by the limited VR exposure during the study, both in terms of duration and number of workstations covered, as participants interacted with only one to three workstations, thereby restricting their understanding of the complete workflow. In addition, the absence of realistic weight feedback may have reduced the physical fidelity of the simulation. Providing training across multiple sessions, especially when spread over consecutive days, could improve performance, accelerate skill acquisition, and ensure sufficient practice across all workstations.
Inferential statistics showed that novice operators required more time to complete tasks than experts. Similarly, novices reported greater uncertainty about achieving the required performance level, as reflected in NASA-TLX scores. This effect was especially evident among participants with little VR experience, likely due to their unfamiliarity with virtual environments and weaker navigation skills, which can also induce “techno-stress” and contribute to cognitive overload. Grecu et al. (2025) confirm that immersive VR may impose additional cognitive demands on novice learners, potentially hindering immediate knowledge acquisition [32].
ANCOVA results revealed significant effects of support level and prior VR experience on heart rate, but not on breathing rate or galvanic skin response (GSR). Mixed repeated-measures ANOVA further showed that task buzzer and support level significantly affected both heart rate and breathing rate, again with no significant effects on GSR. These results suggest that heart rate may be a reliable physiological marker of VR-related stress. This aligns with existing literature, which identifies heart rate, as well as heart rate variability, as commonly used indicators of stress [33]. GSR showed less consistent patterns, likely because it is more sensitive to short-term emotional fluctuations such as momentary stress or excitement.
Participants reported minimal physical discomfort, except for the presence of eye strain. The low number of complaints is somewhat surprising, given that VR is often associated with motion sickness symptoms such as disorientation, eye strain, nausea, and headaches. The limited incidence of discomfort in this study may be explained by the low level of visual motion in the environment and the relatively short exposure time of approximately 30 min. To reduce eye strain and simulation sickness, frame rate, response delay, and session duration should be carefully managed. Souchet et al. (2023) recommend limiting immersion sessions to 20–30 min [34].

5. Limitations

Several limitations of this study should be acknowledged. First, the relatively small sample size, which was further reduced due to missing physiological data. This limited the statistical power of the analyses and may have reduced the sensitivity to detect small or more complex effects, particularly interaction effects. This issue is especially relevant for GSR measures, which are characterized by high inter-individual variability and a strong dependence on baseline levels. As a result, responses can differ substantially between participants, making it more difficult to observe consistent effects. Reduced statistical power increases the likelihood of Type II errors (i.e., false negatives), potentially obscuring meaningful effects. Consequently, the findings should be interpreted with caution. Second, the VR application used in this study was an early-stage prototype. In a typical development process, multiple iterative evaluation rounds involving both managers and operators would be necessary to ensure that the application fully aligns with user needs and expectations and that any technical issues are adequately addressed. Third, the study did not include a control group for comparison of task performance and physiological measures. As a result, it is difficult to determine the extent to which the observed effects can be attributed to the VR training, limiting the strength of the conclusions. A further limitation relates to the semi-random allocation of operators, which resulted in participants being exposed to different combinations of workstations and support levels. Although the workstations were largely comparable in terms of task difficulty and time requirements, suggesting that this variation likely had only a limited impact on the overall results, not all participants experienced every support level within each workstation. This may have introduced additional variability, making it more difficult to compare the effects of support levels and to interpret differences in perceived user experience.

6. Future Research

Further research is needed to validate these findings using larger sample sizes, thereby ensuring more reliable and generalizable conclusions. Longitudinal studies incorporating control groups would also be valuable for assessing whether VR-based training leads to superior performance outcomes compared to traditional training methods.
In addition, future work should investigate additional factors that support effective training personalization, including user characteristics and individual learning pace. Beyond predefined support levels, the development of real-time adaptive support should also be explored, enabling training conditions to dynamically adjust based on operator performance [35].

Author Contributions

V.Z.: Conceptualization, validation, writing—review and editing, project administration; C.D.V.: methodology, data curation, formal analysis, writing—original draft preparation. All authors have read and agreed to the published version of the manuscript.

Funding

This research is supported by Flanders Make, the strategic center for the manufacturing industry in Flanders.

Institutional Review Board Statement

The study was conducted in accordance with the Declaration of Helsinki and approved by the Institutional Ethics Committee of Flanders Make (protocol code v31.01.2025 and date of approval 15 February 2025).

Informed Consent Statement

Informed consent was obtained from all subjects involved in the study.

Data Availability Statement

Given the limited number of participants, the anonymized results for each operator are presented in the results section and in the appendices.

Acknowledgments

We thank the automotive company for its commitment to adopting innovative technologies that support its workforce. We also thank the operators who tested the VR application and provided feedback. Finally, we acknowledge the technology provider for developing the application. During the preparation of this manuscript/study, the authors used the VR application and Equivital device for the purpose of evaluating operators’ user experience and performance. The authors have reviewed and edited the output and take full responsibility for the content of this publication.

Conflicts of Interest

The authors declare no conflicts of interest. The funders had no role in the design of the study; in the collection, analyses, or interpretation of data; in the writing of the manuscript; or in the decision to publish the results.

Abbreviations

The following abbreviations are used in this manuscript:
ASAssembly station
BRBreathing Rate
GSRGalvanic Skin Response
HRHeart Rate
opoperator
VRVirtual Reality

Appendix A

Below you can see the score each operator gave for each item in the survey. A green score means that the operator is positive about this item; a red score, on the other hand, means that they consider this to be an area of improvement for the VR training. For more information on how to interpret the scores, see Table A1.
Table A1. Color-coded legend for interpretation of scores for each survey item.
Score strongly indicates that the operator is positive about the VR training in terms of workload/usefulness/sense of presence/learning effect (score = 7)
Score indicates that the operator is positive about the VR training in terms of workload/usefulness/sense of presence/learning effect (score = 5 or 6)
Score indicates that the operator is neither positive nor negative about the VR training in terms of workload/usefulness/sense of presence/learning effect (score = 4)
Score indicates that the operator is rather negative about the VR training in terms of workload/usefulness/sense of presence/learning effect (score = 2 or 3)
Score strongly indicates that the operator is negative about the VR training in terms of workload/usefulness/sense of presence/learning effect (score = 1)
Table A2. Perceived workload.
1. How mentally demanding was the task?
op1op2op8op11op5op7op4op10op3op6op9
2. How physically demanding was the task?
op5op7op2op4op1op3op6op8op9op10op11
3. How rushed was the pace of the task?
op2op9op3op10op8op11op4op5op7op1op6
4. How successful were you in completing the requested task?
op3op7op8op5op9op1op2op4op6op10op11
5. How hard did you have to work to reach your performance level?
op9op2op3op7op8op11op5op10op1op4op6
6. How uncertain, discouraged, irritated, stressed and annoyed were you while performing the task?
op1op6op5op10op2op4op7op11op3op8op9
Abbreviation: op = operator.
Table A3. Usability.
1. The VR system responded well, i.e., as expected and without delays, to my manipulations.
op1op3op4op5op6op8op9op10op11op2op7
2. I think the VR system gave clear feedback on my manipulations.
op3op1op8op2op4op5op6op7op9op10op11
3. I kept making mistakes while using the VR system.
op5op6op7op11op3op1op2op4op8op9op10
4. I could clearly understand the information in the virtual environment.
op6op2op3op4op5op7op1op8op9op10op11
5. I think this system is user-friendly, easy to learn and designed in such a way that most people can easily get started with the VR system.
op5op3op2op4op6op7op10op1op8op9op11
6. I found that it was easy to correct mistakes I made during the VR experience.
op 9op5op6op10op1op2op3op4op7op8op11
7. I enjoyed the VR experience.
op1op5op6op7op2op3op4op8op9op10op11
8. I felt dizzy, had motion sickness or headaches during the VR experience.
op5op1op2op3op4op6op7op8op9op10op11
9. During the VR experience, I felt mental strain such as tension, frustration and time pressure.
op5op11op8op1op2op4op9op3op6op7op10
Abbreviation: op = operator.
Table A4. Presence.
Table A4. Presence.
1. The VR environment seemed real to me.
op7op10op4op5op6op8op9op1op2op3op11
2. I felt like I was working in the VR environment, rather than controlling something from outside.
op6op7op4op9op3op5op10op1op2op8op11
3. My experiences in the VR environment seemed to match my experiences in the real world.
op7op6op4op5op8op1op2op3op9op10op11
4. While i was in the VR environment, I felt like ‘being there’.
op6op7op3op4op5op8op9op10op1op2op11
5. I was completely immersed in the VR environment.
op3op6op7op4op5op9op1op2op8op10op11
6. I felt like my avatar was an extension of my real body in the VR environment.
op3op6op7op8op2op4op5op9op10op1op11
7. If something happened to my avatar, it felt like it happened to my real body.
op4op6op8op3op7op9op2op5op10op11op1
8. It felt like my real arm was projected into the VR environment through my avatar.
op8op2op3op4op7op10op5op6op9op1op11
9. It felt like my real hand was in the VR environment.
op8op2op3op4op5op6op7op9op10op1op11
10. During the simulation, I felt that my avatar and my real body became one and the same.
op2op3op4op8op5op6op7op9op10op1op11
Abbreviation: op = operator.
Table A5. Learning effect.
1. How confident are you that you can perform a similar task effectively after doing this VR training (in a smooth manner from start to finish with as few mistakes as possible)?
op9op8op5op1op2op3op4op6op7op10op11
2. Do you think you can learn a new assembly procedure faster via the VR environment compared to the traditional learning method?
op8op3op4op5op1op2op6op9op8op10op11
3. Do you think you can learn a new assembly procedure more thoroughly via the VR environment compared to the traditional learning method?
op2op5op10op3op4op6op7op11op1op8op10
Abbreviation: op = operator.
Table A6. Overall VR experience.
1. Did you find it comfortable to use the VR headset? More specifically, did you have eyestrain?
op4op9op7op1op2op3op5op6op8op10op11
2. Did you find it comfortable to use the VR headset? More specifically, was the VR device straining too hard on your head?
op4op7op1op2op3op5op6op8op9op10op11
3. Did you find it comfortable to use the VR headset? More specifically, did the VR environment give you a headache?
op8op1op2op3op4op5op6op8op9op10op11
4. Did you feel more engaged with the task in the VR environment compared to the traditional learning method?
op4op5op7op3op6op2op8op10op1op9op11
Abbreviation: op = operator.
Table A7. Answers to the open questions.
1. Did you experience any technical problems during the VR training? Which ones?
Op1 = ‘No.’
Op2 = ‘At the last station, the image did not always move smoothly.’
Op3 = ‘It took some time to get used to the buttons, but otherwise the experience was positive.’
Op4 = ‘Sometimes I had some difficulty putting a tool back’
Op5 = ‘Some calibration problems occurred with the Equivital sensor at the beginning of the measurement.’
2. Are there things from the traditional training that you missed in this VR training?
Op1 = ‘The weight of the components is not represented in the virtual environment.’
Op2 = ‘The weight of a machine or component, as well as limitations related to machine accessibility.’
Op3 = ‘Weight and tactile feedback’
Op4 = ‘Provide additional small tips at the beginning of the assembly station—insights that are typically only known to experienced trainers.’
Op5 = ‘No.’
Abbreviation: op = operator.

References

  1. De Auto-Industrie, Een Waardevolle Industrie met Toekomst voor België en Luxemburg. Available online: https://www.febiac.be/nl/article/de-auto-industrie-een-waardevolle-industrie-met-toekomst-voor-belgie-en-luxemburg (accessed on 15 May 2026).
  2. Dakić, P.; Stupavský, I.; Todorović, V. The Effects of Global Market Changes on Automotive Manufacturing and Embedded Software. Sustainability 2024, 16, 4926. [Google Scholar] [CrossRef] [Scilit]
  3. Shon, M.; Kim, J.; Kim, H. Transforming the automotive industry: Defining, clustering, and efficiency analysis of the next-generation automotive ecosystem. PLoS ONE 2026, 21, e0343135. [Google Scholar] [CrossRef] [Scilit] [PubMed]
  4. Krammer, P.; Neef, D.; Plapper, P. Advanced Manufacturing Technologies for General Assembly; SAE Technical Paper No. 2011-01-1253; SAE International: Warrendale, PA, USA, 2011. [Google Scholar]
  5. Jongbloed, J.; Chaker, R.; Lavoué, E. Immersive procedural training in virtual reality: A systematic literature review. Comput. Educ. 2024, 221, 105124. [Google Scholar] [CrossRef] [Scilit]
  6. Kolb, D. Experiential Learning: Experience as the Source of Learning and Development; Prentice Hall: Englewood Cliffs, NJ, USA, 1984; ISBN 0132952610. [Google Scholar]
  7. Ericsson, K.A.; Krampe, R.T.; Tesch-Römer, C. The role of deliberate practice in the acquisition of expert performance. Psychol. Rev. 1993, 100, 363–406. [Google Scholar] [CrossRef]
  8. de França, A.; Pereira, J.; Soares, M. Methods and Procedures to Usability Testing in Virtual Reality Systems. Presented at the International Conference on Applied Human Factors and Ergonomics 2017, Orlando, FL, USA, 17–21 21–25 July 2017. [Google Scholar] [CrossRef] [Scilit]
  9. Steen, C.; Söderström, K.; Stensrud, B.; Nylund, I.; Siqveland, J. The effectiveness of virtual reality training on knowledge, skills and attitudes of health care professionals and students in assessing and treating mental health disorders: A systematic review. BMC Med. Educ. 2024, 24, 480. [Google Scholar] [CrossRef] [Scilit] [PubMed]
  10. Han, X.; Luo, H.; Wang, Z.; Zhang, D. Using virtual reality for teacher education: A systematic review and meta-analysis of literature from 2014 to 2024. Front. Virtual Real. 2025, 6, 1620905. [Google Scholar] [CrossRef] [Scilit]
  11. Sung, H.; Kim, M.; Park, J.; Shin, N.; Han, Y. Effectiveness of Virtual Reality in Healthcare Education: Systematic Review and Meta-Analysis. Sustainability 2024, 16, 8520. [Google Scholar] [CrossRef] [Scilit]
  12. Hermawati, S.; Lawson, G.; D’Cruz, M.; Arlt, F.; Apold, J.; Andersson, L.; Lövgren, M.G.; Malmsköld, L. Understanding the complex needs of automotive training at final assembly lines. Appl. Ergon. 2015, 46, 144–157. [Google Scholar] [CrossRef] [Scilit] [PubMed]
  13. Oliveira, J.; Aires Dias, J.; Correia, R.; Pinheiro, R.; Reis, V.; Sousa, D.; Agostinho, D.; Simões, M.; Castelo-Branco, M. Exploring Immersive Multimodal Virtual Reality Training, Affective States, and Ecological Validity in Healthy Firefighters: Quasi-Experimental Study. JMIR Serious Games 2024, 12, e53683. [Google Scholar] [CrossRef] [Scilit] [PubMed]
  14. Somerville, A.; Joiner, K.; Lynar, T.; Wild, G. Applications of extended reality in pilot flight simulator training: A systematic review with meta-analysis. Vis. Comput. Ind. Biomed. Art 2025, 8, 25. [Google Scholar] [CrossRef] [Scilit] [PubMed]
  15. Zhang, M.; Li, B. The impact of virtual reality on curiosity, joy, and engagement. Front. Psychol. 2026, 17, 1809238. [Google Scholar] [CrossRef] [Scilit] [PubMed]
  16. Sohlin, A.; Kjærgaard, J.; Hoffman, I.; Chang, T.; Poulsen, A.; Lee, J.; Gjærde, L.K.; Lund, S.; Paulsen, L.; Sørensen, J.L.; et al. Immersive virtual reality training: Addressing challenges and unlocking potentials. Med. Educ. 2025, 59, 1222–1234. [Google Scholar] [CrossRef] [Scilit] [PubMed]
  17. Fraulini, N.; Marraffino, M.; Garibaldi, A.; Johnson, C.; Whitmer, D.E. Adaptive training instructional interventions: A meta-analysis. Mil. Psychol. 2025, 37, 479–493. [Google Scholar] [CrossRef] [Scilit] [PubMed]
  18. Radhakrishnan, U.; Chinello, F.; Koumaditis, K. Investigating the effectiveness of immersive VR skill training and its link to physiological arousal. Virtual Real. 2023, 27, 1091–1115. [Google Scholar] [CrossRef] [Scilit] [PubMed]
  19. Zahabi, M.; Abdul Razak, A. Adaptive virtual reality-based training: A systematic literature review and framework. Virtual Real. 2020, 24, 725–752. [Google Scholar] [CrossRef] [Scilit]
  20. Shiratuddin, M.; Zulkifli, A.N. Making Virtual Reality a Reality: Bringing CAD and Game Engine Together. Presented at the International Conference on Information Technology and Multimedia, Selangor, Malaysia, 13–15 August 2001. [Google Scholar]
  21. de Lellis Barreto, C.; Cardoso, A.; Júnior, E.; Silva, P.; Silva, A. Designing Virtual Reality Environments through an Authoring System Based on CAD Floor Plans: A Methodology and Case Study Applied to Electric Power Substations for Supervision. Energies 2021, 14, 7435. [Google Scholar] [CrossRef] [Scilit]
  22. Hennink, M.; Kaiser, B. Sample sizes for saturation in qualitative research: A systematic review of empirical tests. Soc. Sci. Med. 2022, 292, 114523. [Google Scholar] [CrossRef] [Scilit] [PubMed]
  23. Hoffmann, T.; Glasziou, P.; Boutron, I.; Perera, R.; Altman, D.G.; Barbour, V.; Johnston, M.; Lamb, S.E.; Dixon-Woods, M.; Wyatt, J.C. Die TIDieR Checkliste und Anleitung—Ein Instrument für eine verbesserte Interventionsbeschreibung und Replikation. Gesundheitswesen 2016, 78, 175–188. [Google Scholar] [CrossRef] [PubMed]
  24. Equivital. Available online: https://equivital.com/products/eq02-lifemonitor (accessed on 25 April 2026).
  25. Said, S.; Gozdzik, M.; Roche, T.; Braun, J.; Rössler, J.; Kaserer, A.; Spahn, D.R.; Nöthiger, C.B.; Tscholl, D.W. Validation of the Raw National Aeronautics and Space Administration Task Load Index (NASA-TLX) Questionnaire to Assess Perceived Workload in Patient Monitoring Tasks: Pooled Analysis Study Using Mixed Models. J. Med. Internet Res. 2020, 22, e19472. [Google Scholar] [CrossRef] [Scilit] [PubMed]
  26. Kim, Y.; Rhiu, I. Development of a virtual reality system usability questionnaire (VRSUQ). Appl. Ergon. 2024, 119, 104319. [Google Scholar] [CrossRef] [Scilit] [PubMed]
  27. Makransky, G.; Lilleholt, L.; Aaby, A. Development and validation of the Multimodal Presence Scale for virtual reality environments: A confirmatory factor analysis and item response theory approach. Comput. Hum. Behav. 2017, 72, 276–285. [Google Scholar] [CrossRef] [Scilit]
  28. Pasquale, V.; Cutolo, P.; Esposito, C.; Franco, B.; Iannone, R.; Miranda, S. Virtual Reality for Training in Assembly and Disassembly Tasks: A Systematic Literature Review. Machines 2024, 12, 528. [Google Scholar] [CrossRef] [Scilit]
  29. Palombo, R.; Weber, S.; Wyszynski, M.; Niehaves, B. Glove versus controller: The effect of VR gloves and controllers on presence, embodiment, and cognitive absorption. Front. Virtual Real. 2024, 5, 1337959. [Google Scholar] [CrossRef] [Scilit]
  30. Gonçalves, G.; Melo, M.; Barbosa, L.; Vasconcelos-Raposo, J.; Bessa, M. Evaluation of the impact of different levels of self-representation and body tracking on the sense of presence and embodiment in immersive VR. Virtual Real. 2022, 26, 1–14. [Google Scholar] [CrossRef] [Scilit]
  31. Lécuyer, A. Simulating Haptic Feedback Using Vision: A Survey of Research and Applications of Pseudo-Haptic Feedback. Teleoperators Virtual Environ. 2009, 18, 39–53. [Google Scholar] [CrossRef] [Scilit]
  32. Grecu, V.; Petruse, R.; Chiliban, M.; Tâlvan, E. The Cognitive Cost of Immersion: Experimental Evidence from VR-Based Technical Training. Appl. Sci. 2025, 15, 12534. [Google Scholar] [CrossRef] [Scilit]
  33. Kim, H.; Kim, D.; Kim, S.; Chung, W.; Park, K.; Kim, J.; Kim, D.; Kim, M.J.; Kim, K.; Jeon, H.J. Effect of Virtual Reality on Stress Reduction and Change of Physiological Parameters Including Heart Rate Variability in People with High Stress: An Open Randomized Crossover Trial. Front. Psychiatry 2021, 12, 614539. [Google Scholar] [CrossRef] [Scilit] [PubMed]
  34. Souchet, A.; Lourdeaux, D.; Burkhardt, J.; Hancock, P. Design guidelines for limiting and eliminating virtual reality-induced symptoms and effects at work: A comprehensive, factor-oriented review. Front. Psychol. 2023, 14, 1161932. [Google Scholar] [CrossRef] [Scilit] [PubMed]
  35. Lawson, G.; Salanitri, D.; Waterfield, B. Future directions for the development of virtual reality within an automotive manufacturer. Appl. Ergon. 2016, 53, 323–330. [Google Scholar] [CrossRef] [Scilit] [PubMed]
Figure 1. Operator performing the VR training with live screen-sharing to stakeholders.
Virtualworlds 05 00031 g001
Figure 2. Equivital device (Equivital, Cambridge, UK) (Left: Torso belt with sensor for HR and BR; Right: GSR sensors).
Virtualworlds 05 00031 g002
Figure 3. Boxplot of completion times by VR expertise.
Virtualworlds 05 00031 g003
Figure 4. Boxplot of each physiological metric response by VR experience. (a) Heart Rate, (b) Breathing Rate, (c) Galvanic Skin Response.
Virtualworlds 05 00031 g004aVirtualworlds 05 00031 g004b
Figure 5. Boxplot of each physiological metric response before and after the buzzer by VR expertise. (a) Heart Rate, (b) Breathing Rate, (c) Galvanic Skin Response.
Virtualworlds 05 00031 g005aVirtualworlds 05 00031 g005b
Table 1. Overview of the five assembly stations.
Assembly StationTask Description
1Electric motor is installed.
2Motor components and air compressor bracket are mounted.
3Pipes, connectors, and bolts are assembled onto the front subframe.
4Cables, connectors, and an axle are installed and secured.
5Powertrain bracket and EXV unit are mounted, including cable and connector connections.
Table 2. Levels of support for the assembly stations.
LevelsDescription
Level 1Fully guided—For each step in the assembly process, the operator is shown step by step which tool/part to take, where to place it or what to do with it.
Example: The operator holds a scanner and is required to scan a barcode. Blue arrows provide guidance by indicating the location of the barcode to be scanned; see Figure a.
Figure a: Illustration of level 1 support.
Virtualworlds 05 00031 i001
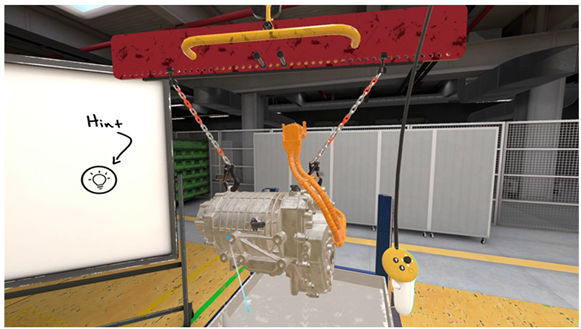
Level 2Practice on your own—The operator performs the assembly independently without help. If stuck, the operator can ask for help with the specific task at hand at that moment.
Example: The operator no longer sees the blue arrows. If they are unsure what to do, they can click on a hint, after which the blue arrows reappear to guide them toward the task to be performed; see Figure b.
Figure b: Illustration of level 2 support.
Virtualworlds 05 00031 i002
Level 3Do the test—Same as Level 2, except that a score report is given afterwards regarding task performance (i.e., task completion time and number of hints requested).
Example: The dashboard shows that the operator required a total of 25:58 min to complete the workstation across the levels they performed. For level 3, it displays the operators’ task completion time and indicates whether this time is within the takt time. It also shows the number of hints requested and specifies the exact steps at which these hints were requested; see Figure c.
Figure c: Illustration of level 3 support.
Virtualworlds 05 00031 i003
Table 3. Eligibility criteria.
Inclusion
  • Employed at the car manufacturing company;
  • Experienced in car assembly (>1 year);
  • Sufficient proficiency in Dutch.
Exclusion
  • Neurological conditions (e.g., epilepsy, migraine);
  • Visual impairments (e.g., strabismus, severe myopia or hyperopia);
  • Motor impairments that may affect the VR experience (e.g., balance disorders, upper limb limitations affecting controller use, or lower limb conditions preventing prolonged standing);
  • History of discomfort or adverse effects related to VR.
Table 4. Descriptive characteristics of operators (n = 11) by VR experience.
Variables* VR Expert (n = 4)* VR Novice (n = 7)
GenderMen4 (100%)5 (71%)
Women0 (0%)2 (29%)
Age range25–34 years2 (50%)1 (14%)
35–44 years2 (50%)2 (29%)
45–54 years0 (0%)3 (43%)
>55 years 0 (0%)1 (14%)
Experience in car assembly ≥5 years4 (100%)7 (100%)
* Data presented as number (%).
Table 5. Overview of assembly stations and support levels performed by the operators.
ASop1op2op3op4op5op6op7op8op9op10op11
1
2
3
4
5
Legend: support levels: Green = operator performs support levels 1, 2, and 3; Orange = operator performs only support levels 1 and 2; Blue = operator performs only support levels 1 and 3; Gray = operator performs only support level 1; Abbreviations: AS = assembly station; op = operator.
Table 6. Results on VR experience (n = 11).
Variables (Measurement Tool, Unit)* Mean ± SD
Perceived workload
(adapted NASA-TLX; 6 items, 1–7 Likert scale)
5.2 ± 0.48
Perceived usability
(adapted VRSUQ; 9 items, 1–7 Likert scale)
5.9 ± 0.47
Perceived presence
(adapted MPS; 10 items, 1–7 Likert scale)
5.8 ± 0.70
Perceived learning effect
(3 items, 1–7 Likert scale)
5.7 ± 0.79
Overall VR experience
(4 items, 1–7 Likert scale)
6.3 ± 0.69
* Higher scores indicate lower workload, higher usability, stronger sense of presence, higher learning effect, and better overall experience.
Table 7. Completion time and number of hints requested for each operator at the assembly stations.
ASop1op2op3op4op5op6op7op8op9op10op11
1149% 148%
2249% 179% 374%344%189%375% 224%
3 233%260.7%190% 254%256%285% 313%359%
4 98%
5 171%
Legend: completion time (% of takt time); hints requested: white = no hints; blue = 1 hint; red = 2 hints. Abbreviations: AS = assembly station; op = operator.
Table 8. Contingency table showing observed counts of hint requests by expertise group.
VR Experience
Hints Requested (Yes/No)ExpertNoviceTotal
08715
1134
Total91019
Disclaimer/Publisher’s Note: The statements, opinions and data contained in all publications are solely those of the individual author(s) and contributor(s) and not of MDPI and/or the editor(s). MDPI and/or the editor(s) disclaim responsibility for any injury to people or property resulting from any ideas, methods, instructions or products referred to in the content.