Article

Sustainable Valorization of Sinami Fruit (Oenocarpus mapora H. Karst), with Focus on Its Nutrients and Bioactive Components as a Function of Harvest Time

by
Winy Cuchuyrumi-Nina
1,
Eliana Molina Mamani
1,
María Isabel Cajo-Pinche
1,
Javier Diaz-Viteri
1,
Ana María Muñoz
2,3 and
Fernando Ramos-Escudero
3,4,*
1
Carrera Profesional de Ingeniería Agroindustrial, Universidad Nacional Amazónica de Madre de Dios, Jr. Jorge Chávez 1160, Puerto Maldonado 17001, Peru
2
Instituto de Ciencias de los Alimentos y Nutrición, Universidad San Ignacio de Loyola (ICAN-USIL), Campus Pachacamac, Sección B, Parcela 1, Fundo La Carolina, Pachacámac, Lima 15023, Peru
3
Unidad de Investigación en Nutrición, Salud, Alimentos Funcionales y Nutraceúticos, Universidad San Ignacio de Loyola (UNUSAN-USIL), Av. La Fontana 550, Lima 15024, Peru
4
Carrera de Nutrición y Dietética, Facultad de Ciencias de la Salud, Universidad San Ignacio de Loyola, Av. La Fontana 550, Lima 15024, Peru
*
Author to whom correspondence should be addressed.
Appl. Biosci. 2026, 5(3), 65; https://doi.org/10.3390/applbiosci5030065
Submission received: 13 May 2026 / Revised: 14 July 2026 / Accepted: 28 July 2026 / Published: 3 August 2026
(This article belongs to the Special Issue Plant Natural Compounds: From Discovery to Application (2nd Edition))

Abstract

Sinami (Oenocarpus mapora H. Karst) is a palm tree that grows in the South American Amazon, whose fruits are highly valued for their sensory characteristics, attractive dark purple color, and as a source of edible oil. However, little to no information is available on the changes in the physicochemical properties, nutrients, chemical compounds, and antioxidant capacity of O. mapora fruits throughout their four-week ripening period. The results obtained showed that fruit weight, seed weight, and peel + flesh weight increased slightly. The variables that showed a significant increase (p < 0.001) during ripening were pH, TSS (°Brix), TSS/TA ratio, and the a* coordinate. The lipid content increased substantially from 0.46 to 31.47 g/100 g. Among the variations, the chlorophyll and carotenoid content increased from harvest 1 to harvest 2, while the total anthocyanin content decreased from harvest 3 (1.65 mg c-3-g/g) to harvest 4 (1.00 mg c-3-g/g). Furthermore, 4-hydroxyphenylacetic acid and ferulic acid levels decreased, while gallic acid and rutin levels increased. These results confirm that the fruits of O. mapora vary during the ripening process. Harvests 3 and 4 contributed significantly with a higher content of bioactive compounds and oil, which is important for the utilization and production of vegetable oil and for promoting the use of byproducts such as seeds and the press cake after oil extraction.

1. Introduction

Several palm trees of the Arecaceae family are of economic and ecological importance for the South American Amazon [1]. The fruits of these palms are used for oil production, such as those of Oenocarpus bataua (Mart.), Elaeis oleifera (H.B.K.) Cortés, Acrocomia aculeata (Jacq.) Lodd. ex Mart., and Oenocarpus mapora (H. Karst.). Edible fruits include Astrocaryum chambira Burret, Bactris gasipaes (H.B.K.), and Mauritia flexuosa L.f., while Euterpe precatoria (Mart.) is used for the production of palm hearts [2,3,4]. Sinami palm tree has been used for different purposes including fresh consumption (fruits, ice cream, edible oil, palm hearts, beverages, and edible weevil larvae Rhynchophorus palmarum “known as suri”); rustic architectural material (straw roofs, mats, house posts, floor and walls); household objects and hunting tools (fans, baskets, weaving tools, bows and spears); and medicinal uses and ornamental [5,6]. Recently, the residue from juice extraction (Oenocarpus bacaba), seeds, and bagasse from O. mapora fruit oil extraction have been used for various purposes, including the production of gelatin, a bio-based functional ingredient for cosmetic products, and as a partial substitute for reformulated flatbreads [7,8,9]. O. mapora (sinami) fruits share many similarities with other palm trees such as O. bacaba (bacaba), O. bataua (ungurahui), Oenocarpus distichus (bacaba-de-leque), Oenocarpus minor (bacabinha), Euterpe oleracea (açaí), and Euterpe precatoria (huasaí) [10,11,12,13]. These fruits of the Arecaceae palm contain several classes of bioactive substances that have demonstrated antioxidant and anticancer activity, as well as cholinesterase inhibition [14,15]. Regarding its chemical composition, the fresh pulp of sinami fruits provides a rich source of carbohydrates, lipids, fiber, protein, minerals (K, Ca, Mg, and Na), and polyphenols [12]. The oil obtained from the pulp of sinami fruits is rich in natural pigments and fatty acids such as oleic, palmitic, and linoleic acids [12,16,17].
However, nutrient levels, morpho-colorimetric aspects, physicochemical characteristics, and antioxidant profiles depend on several factors such as climatic conditions, growing region, fruit growth and development conditions, maturity degree, and post-harvest conditions [18,19]. Of the main Oenocarpus species studied (O. bataua, O. bacaba, O. mapora, O. distichus, and O. minor) for their edible fruits, vegetable oils, and phytochemical compounds, the biochemical changes associated with the degree of ripeness of these fruits have not yet been studied. Optimal harvesting conditions are essential for obtaining primary products with good nutritional and sensory quality. In the case of oil extraction, the physiological maturity point is important for achieving better yields and higher oil quality. In recent years, there has been increased interest in studying sinami fruits from the Peruvian Amazon to promote their consumption as fresh fruit and in various processed products, extracting the oil, and adding value to the byproducts obtained from different industrial processes [8,16,17,18,20].
The objective of the present research was to investigate the changes in the content of nutrients, physicochemical properties, natural pigments, and phenolic compounds, as well as the antioxidant capacity evaluation of sinami fruit (Oenocarpus mapora H. Karst) at four different stages of maturity. The findings obtained from this study would be useful for better management during the harvest and post-harvest of this fruit.

2. Materials and Methods

2.1. Fruit Harvesting and Processing

The sinami fruits were harvested from a private farm, Pedro Casanova Romero, on the Rompeolas road, Km. 3.2 (Puerto Maldonado, Madre de Dios, Peru). The harvest was carried out over 45 days (harvest 1: 15 November 2020; harvest 2: 30 November 2020; harvest 3: 15 December 2020; and harvest 4: 31 December 2020). Five sinami palm trees were selected using non-probability convenience sampling due to their proximity and accessibility [21]. The UTM coordinates (Z; E; N) of each palm tree were as follows: palm tree 1 (19L; 478,015; 8,611,733); palm tree 2 (19L; 478,011; 8,611,726); palm tree 3 (19L; 478,008; 8,611,745); palm tree 4 (19L; 477,996; 8,611,745); and palm tree 5 (19L; 477,979; 8,611,722).
The fruit was harvested manually using an aluminum extendable ladder. Approximately 200 g of sinami fruit (between 40 and 60 units) was harvested from each palm on the specified date. The fruit was placed in a resealable zip-lock bag with holes and then in a 4 L portable cooler for air transport from Puerto Maldonado to Lima, a flight of 1 h and 35 min. The sinami fruits were cleaned, washed with soft water, and dried at room temperature. Preliminary tests consisted of weighing the fruit, peel, flesh, and seeds. The peel + flesh was then vacuum-dried at 60 °C for 3 h and 150 mbar. The dehydrated product was pulverized using a knife mill at 5000 rpm for 20 s (Grindomix GM 200, Retsch, Düsseldorf, Germany). Finally, the powdered sample was vacuum-packed and stored at −20 °C before the tests described below.

2.2. Physicochemical Characterization

Approximately 5 g of the sample was diluted with 30 mL of distilled water and then stirred with an immersion blender for 5 min. The sample was placed in a 50 mL tube and centrifuged at 4033× g and 20 °C for 15 min (5810R, Eppendorf, Hamburg, Germany). The supernatant was recovered and used to measure pH, °Brix, and titratable acidity. pH analysis was performed using a digital potentiometer (pH 7110, InoLab, Wellheim, Germany). Soluble solids (TSSs) were measured directly by placing a few drops onto the prism of a refractometer (NAR-1T LIQUID, Atago Co., Tokyo, Japan). Titratable acidity (TA) was measured using 10 mL of supernatant and titrated with 0.1 N sodium hydroxide until the pH reached 8.2. Acidity results were expressed as a percentage of citric acid [22]. The chromatic properties of the dried powdered sample (dry weight) were measured using a Nix QC color sensor (NIX Sensor Ltd., Hamilton, ON, Canada). The samples were placed in transparent plastic bags, and color measurements were taken at different points on the surface of the sample [9]. The L* (L*, 0 = pure black; 100 = pure white), a* (+a* = red; –a* = green), and b* (+b* = yellow; –b* = blue) color coordinates were transmitted via Bluetooth to a mobile application (Apple App Store), while the chroma (C*ab) and hue angle (Hab, 0° to 360°) values were obtained from mathematical equations. C*ab = (a*2 + b*2)0.5 and Hab = arctan b*/a* [9].

2.3. Analyses of Proximate Composition and Crude Fiber

Nutritional composition was determined according to the standard methods of the Association of Official Agricultural Chemists [23]. Moisture content was determined using 2 g of the fruit, which was placed in a forced-air oven at 102 °C for 2 h, according to AOAC Official Method 925.10. The ash content was determined by carbonizing the sample on a heating plate (Type 2200, Thermo Scientific, Waltham, MA, USA) until ash formation, then continuous incineration in a muffle furnace at 580 °C for 6 h (Lindberg/Blue M, Thermo Scientific, Waltham, MA, USA), according to the AOAC Official Method 940.26. Crude protein content was analyzed using the standard method of Johan Kjeldahl (AOAC 920.152). One gram of sample was previously digested in KJELDATHERM (KT-L 8s, Gerhardt, Königswinter, Germany), distilled, and titrated using a VAPODEST 500 (Gerhardt, Königswinter, Germany). Total nitrogen content was converted to protein using a conversion factor of 6.25 for meat products. Lipid content was determined using AOAC Official Method 983.23. Approximately 2 g of sample was extracted with hexane using an automated solid–liquid Soxhlet extractor (extraction unit E-816, Buchi). Total carbohydrate content was determined by difference: 100 − (g/100 g moisture + g/100 g ash + g/100 g protein + g/100 g lipid) [24]. Crude fiber content was analyzed by acid and alkaline digestion following the procedure described by Tsombou et al. [25].

2.4. Determination of the Total Phenolic Content

The polyphenol extraction was carried out following the procedure described by Cutire et al. [20]. Approximately 2.5 g of sample was placed in a 15 mL centrifuge tube, and then 10 mL of an 80% methanolic solution was added. Extraction was performed by vortexing for 1 h (LP Vortex Mixer, Thermo Scientific, Waltham, MA, USA), followed by ultrasonic bath extraction at 40 kHz, 30 °C, and 30 min (CPX5800H-E, Bransonic, Danbury, CT, USA). The extract was centrifuged at 5228× g for 30 min (5810R, Eppendorf, Hamburg, Germany), and the supernatant was recovered and used for subsequent assays. A 100 μL aliquot, previously diluted, was reacted with Folin–Ciocalteu’s phenol reagent (750 μL, 0.2 N) in Eppendorf tubes. The sample was vortexed for 5 min, and then 750 μL of a 7.5% sodium carbonate solution was added. Subsequently, the 2 mL Eppendorf tubes containing the sample were shaken at 1000 rpm for 2 h (LP Vortex Mixer, Thermo Scientific, Waltham, MA, USA). Absorbance values were recorded at 765 nm (Jasco spectrophotometer, V-770, Jasco, Tokyo, Japan). Total polyphenol content (TPC) was quantified using a calibration curve with gallic acid concentrations ranging from 5 to 100 µg/mL. Results were expressed in terms of mg of gallic acid equivalent per gram of sample (mg GAE/g dry weight).

2.5. Determination of the Total Flavonoid Content

Total flavonoid content (TFC) was determined using the aluminum chloride colorimetric method. A 100 μL aliquot was placed in an Eppendorf tube, and sodium nitrite (75 μL, 5%) was added. Five minutes later, an aqueous solution of aluminum chloride hexahydrate (150 μL, 10%) was added, and the sample was stirred for 5 min. Finally, 500 μL of 1 M sodium hydroxide was added and the mixture was allowed to 15 min in darkness. Absorbance values were recorded at a wavelength of 510 nm (Jasco spectrophotometer, V-770, Jasco, Tokyo, Japan). The TFC was expressed as mg of catechin equivalent per gram of sample (mg EC/g dry weight).

2.6. DPPH Assay Procedure

The DPPH assay was performed according to the procedure described by Brand-Williams et al. [26]. DPPH reagent was prepared on the same day of use at a concentration of 100 μmol/L in 80% methanol. A 50 μL aliquot of the extract was placed in an Eppendorf tube, and 950 μL of DPPH solution was added. The sample was vortexed for 20 min in darkness. Results were obtained using a calibration curve with Trolox concentrations ranging from 25 to 800 µmol/L and the antioxidant capacity was expressed as mmol Trolox equivalent per gram of sample (mmol TE/g dry weight).

2.7. ABTS Assay Procedure

The ABTS assay was performed following the methodology proposed by Re et al. [27] with some modifications. The ABTS radical solution was generated by the reaction between ABTS solution (7 mmol/L) and aqueous potassium persulfate solution (2.5 mmol/L) in equal proportions (1:1 v/v). This reaction was carried out for 16 h in darkness. The ABTS free radical was adjusted with distilled water to produce an absorbance of 0.90 ± 0.02 at a wavelength of 734 nm. The measurement was carried out with 10 μL of the extract and 990 μL of the free radical. Results were obtained using a calibration curve with Trolox concentration ranging from 25 to 400 μmol/L and antioxidant potential was expressed as mmol Trolox equivalent per gram of sample (mmol TE/g dry weight).

2.8. Determination of the Total Anthocyanin Content

Anthocyanin content (TAC) analysis was performed according to the method described by Lee et al. [28]. Anthocyanin extraction was performed using 250 mg of sample and 3 mL of extractant solution (acetone/water/acetic acid 70:29.5:0.5 v/v/v) [29]. The extraction was carried out at 3000 rpm for 1 h (LP Vortex Mixer, Thermo Scientific, Waltham, MA, USA). Subsequently, the extract was centrifuged at 2465× g for 30 min (5810R, Eppendorf, Hamburg, Germany), and the supernatant was recovered and used for the determination of TAC. Two Eppendorf tubes were used, each containing 100 μL of the supernatant. Subsequently, 800 μL of buffer solutions were added, one at pH 1 (0.025 M KCl adjusted with HCl) and the other at pH 4.5 (0.4 M CH3CO2Na adjusted with HCl). Afterward, the samples were centrifuged at 9391× g for 5 min (Centrifuge 5425R, Eppendorf, Hamburg, Germany). Absorbance values were recorded at 520 and 700 nm. Cyanidin-3-O-glucoside was used as a reference standard (molecular weight = 449.2 g/mol; molar extinction coefficient = 26,900 L/mol-cm). The total anthocyanin concentration (TAC) was expressed in milligrams of cyanidin-3-O-glucoside per gram of sample (mg c-3-g/g dry weight).

2.9. Determination of Chlorophyll and Carotenoid Contents

Total chlorophyll (TChC) and carotenoid (TCC) content were determined according to the procedure described by Lichtenthaler and Buschmann [30]. Approximately 500 mg of sample was placed in a 15 mL centrifuge tube, and then 3 mL of 95% ethanol was added. The tubes were protected from light with aluminum foil and then shaken at 1000 rpm for 24 h. Finally, the samples were centrifuged at 2465× g for 30 min (5810R, Eppendorf, Hamburg, Germany). The supernatant was collected and monitored between 400 and 700 nm using a Jasco UV–Visible/NIR spectrophotometer (Tokyo, Japan). Absorbance readings at 470 nm correspond to carotenoids, while chlorophyll a and b were collected at 664 and 649 nm, respectively. The results were determined as μg of the corresponding pigment per gram of sample (μg/g dry weight).

2.10. HPLC Analysis of Phenolic Compounds

The content of individual polyphenols was analyzed according to the methodology described by Barriga-Sánchez et al. [17]. Approximately 250 mg of sample was used for extraction with 5 mL of 80% methanol. The extraction process continued as described in Section 2.4. The supernatant was filtered and placed in vials for analysis by HPLC-DAD (Hitachi High-Technologies Corporation, Tokyo, Japan). Analyte separation was carried out using a LiChrospher® 100 RP-18 endcapped (5 µm) LiChroCART® 250 mm × 4 mm column (Millipore, Darmstadt, Germany) at 30 °C, a constant flow rate of 1 mL/min, an injection volume of 20 µL, and a run time of 60 min. The eluents were: (A) H2O/H3PO4 (99.5:0.5 v/v); (B) CH3OH/CH3CN (50:50 v/v). The gradient system used was: (0 min) B 5% → (5 min) B 30 → (25 min) B 38% → (40 min) B 45% → (45 min) B 52.5% → (50 min) B 100%, and (55–60 min) B 5% to return to initial conditions. The identification of phenolic compounds was carried out using the retention times of the respective standards. Quantification was carried out using chromatograms recorded at 280 and 335 nm. The concentration of each phenolic compound was expressed as mg of the corresponding standard per kilogram of sample (mg/kg dry weight).

2.11. Statistical Analysis

Data were presented as the mean ± standard deviation (all analyses were performed in triplicate except for the phenol profile, which was performed in duplicate). For comparison between collection dates, analysis of variance (ANOVA) was used, followed by Duncan’s Multiple Range test at a 0.05 level of significance. Statistical analyses were done using a STATISTICA software package version 8.0 (StatSoft, Inc., Tulsa, OK, USA). Pearson correlation and k-means clustering were conducted using MetaboAnalyst 6.0 (https://www.metaboanalyst.ca; accessed on 1 September 2025) [31].

3. Results and Discussion

3.1. Physical Characteristics

Table 1 shows the fruit, seed and peel + flesh weights of sinami fruit at different harvest times. The results did not differ significantly (p > 0.05) for the variable weight, weight per unit, seed, and peel + flesh. On the other hand, small variations were observed between harvest 1 and harvest 2, with increases in weight of 1.81%, weight per unit of 1.81%, seed of 3.01%, and peel + flesh of 4.95%. The changes between harvest 2 and harvest 3 varied approximately 3% with respect to weight per unit, while the increase in seed was 6.88%, and the difference in peel + flesh was 5.86%. In the last two stages, the difference between harvest 3 and harvest 4 showed a greater increase in weight per unit of approximately 12%, while seed weight remained constant and peel + flesh weight varied by approximately 18.19%. At this stage, the O. mapora fruits had a weight per unit of 5.35 ± 1.24 g, a seed of 3.04 ± 0.74 g, and a peel + flesh of 1.84 ± 0.5 g. According to Best et al. [18], some biometric characteristics of mature O. mapora fruits were reported, with an average weight of 3.9 ± 0.5 g, while de Oliveira et al. [32] reported that the weight was 4.5 ± 0.86 g.
Another Arecaceae species, Oenocarpus distichus, known in Brazil as bacaba-de-leque, had a fruit mass of 2.54 g, a pulp mass of 0.86 g, and a seed mass of 1.68 g [33]. The seeds of the ripe fruits of O. mapora represent approximately 56.76%, while the peel and flesh comprise approximately 34.06%. Best et al. [18] reported that the highest occurrence of ripe fruit is during the rainy season, between November and April. Due to the high humidity and temperature (around 88% and 30 °C, respectively) of the plant’s growing environment [18] and its nutrient content, the ripe fruit is perishable and prone to microbial contamination.

3.2. Physicochemical Characteristics

Table 2 shows the results of the physicochemical characteristics of O. mapora fruits in relation to harvest time. These results show that the pH increased from harvest 1 to harvest 4, with values ranging from 3.90 to 4.65. The pH increase was also observed in fruits of tropical palm trees such as butiá (Butia capitata), which showed pH values between ~3 and ~4 [34]. Consequently, the pH increases due to the metabolism of organic acids such as citrate, malate, and others during the fruit ripening process, which contributes to a decrease in acidity [35] and affects the sensory characteristics of texture, taste, and overall appearance. Regarding titratable acidity (TA), an approximate decrease of ~60% was observed, while total soluble solids (TSSs) (°Brix) and the TSS/TA ratio increased by about ~51% and ~275%, respectively. A similar ripening pattern is observed in several types of fruit. For example, in the maturation and ripening of butiá and açaí, TSS, TSS/TA, and pH values increase, while TA decreases [36]. These changes during harvest time are mainly due to several factors, including characteristics of climacteric and non-climacteric fruits (respiratory rate and ethylene), starch degradation, changes in organic acid composition due to the decarboxylation of malic acid, oxaloacetic acid, and citric acid, changes in fatty acid composition, and changes in the formation of volatile compounds through the degradation of short-chain fatty acids [37,38]. In the case of sinami fruits (O. mapora) it is not yet known whether they exhibit climacteric or non-climacteric maturation; however, many Amazonian palm drupes show a non-climacteric respiration pattern during maturation.
Regarding the chromatic parameters, the a* value increases from 1.4 (harvest 1) to 6.60 (harvest 3), while in harvest 4, it decreases slightly to 5.46 units. These a* values are very similar to those found in some fruits whose ripening process begins in the green stage (green color) and progresses to the mature stage (purple–black color). For example, in Solanum species in the fresh, green state (30% maturity), negative a* values ranged from −5.90 to −1.45, while maturity stage II (fruit color 40–60% purplish–violet) and stage III (fruit color 100% black–blue) showed positive a* values between 1.27 and 8.93 units [39]. The changes in the a* coordinate of sinami fruits are due to the decomposition of green chlorophyll in the early stages of harvesting; the change in color to purple–black was due to the synthesis and accumulation of anthocyanins (a subclass of water-soluble flavonoids) that appear in the last two harvests. The values of L*, b*, C*ab, and Hab decrease during the ripening of sinami (O. mapora) fruits. The L* (lightness) values in harvest 1 averaged 57.94 (green fruit), while the average in harvest 4 was 28.94 (purple–black). On the other hand, the color parameters b* and C*ab varied from 19.62 to 7.92 units and from 19.67 to 9.63 units, respectively. Several fruits undergo similar changes during the ripening process from the green stage (more green) to the ripe stage (black, blue, or purple skin). The parameters b* and C*ab (colorfulness or saturation) decreased as the ripening of the sinami fruit progressed. These b* and C*ab values decreased when the fruits ripened to red, purple, or black, indicating the presence of anthocyanins. Generally, the b* and C*ab parameters are associated with the presence of yellow and orange–red pigments, an indicator of the presence of xanthophylls and carotenes. On the other hand, the hue angle (color groups) in sinami (O. mapora) fruits from different harvest times varied from 85.91° (harvest 1) to 51.69° (harvest 3), with a slight increase in harvest 4 (55.52°). The change in hue angle from greater to lesser could be due to anthocyanin biosynthesis, since an orientation towards 0° produces color changes from purple to magenta.

3.3. Nutritional Composition of Sinami Fruit at Harvest

Table 3 shows the results of the nutritional composition of the sinami fruit at harvest. The moisture content during the ripening process increased slightly from harvest 1 to harvest 2 (15 days after the first harvest) and then decreased until harvest 4 (45 days after the first harvest). Some fruits, such as jabuticaba (Myrciaria sp.), experienced similar variations in fruits harvested 10 days after anthesis, with an increase on day 18 and a reduction in moisture at 34 days. According to Garcia et al. [40], this increase in moisture content is due to cell wall thickening, while the decrease may be associated with transpiration during fruit ripening. The degree of moisture loss is related to soil and climate conditions and the permeability of the fruit peel [41].
Regarding protein content, an increase was observed from harvest 1 (5.62 g/100 g) to harvest 2 (6.67 g/100 g). No significant differences were observed between harvest 2, harvest 3, and harvest 4. For example, the fruit of Schisandra sphenathera at three stages of maturity (unripened, semi-ripened, and fully ripened) showed a slight but significant decrease in weight between unripened (1.34 g/100 g FW) and fully ripened (1.18 g/100 FW) [42]. Proteins during the ripening process are associated with physiological, biochemical, and organoleptic changes, such as the biosynthesis and regulation of primary and secondary metabolites, texture, color, odor, and aroma, leading to improved fruit quality and resistance to environmental challenges [43]. Some palm fruits from the Arecaceae family, such as O. mapora, O. bataua, Euterpe oleracea, and Euterpe precatoria, showed protein contents between 6.96 and 12.73 g/100 g [12].
The ash content was not significant and showed similar levels across the four harvests, ranging from 2.09 to 2.20 g/100 g. Vargas-Arana et al. [12] reported ash content in fruits of native palm trees from the Peruvian Amazon ranging from 0.83 to 1.54 g/100 g.
On the other hand, the total carbohydrate content showed a decrease from harvest 1 (84.83 g/100 g) to harvest 4 (54.45 g/100 g), while the crude fiber content increased slightly between harvest 1 (27.97 g/100 g) and harvest 2 (28.29 g/100 g), with a very marked decrease in harvests 3 and 4. A similar response is observed in various types of fruit during ripening, where the complex carbohydrates are hydrolyzed into simple sugars, while the components of dietary fiber are broken down by the presence of enzymes. Furthermore, the firmness decreases, resulting in softer and more easily digestible fruit [44].
The ripening process contributes to an increase in total lipid content. During the ripening of the sinami fruit (O. mapora), a substantial increase in lipid content is observed from harvest 1 (0.46 g/100 g) to harvest 4 (31.47 g/100 g). The 3- to 5-fold increase in lipids in harvests 3 and 4 compared to harvest 2 promotes the development of aroma-active flavor compounds. Sinami oil is rich in oleic acid (~57 to ~61%), palmitic acid (~16 to ~21%), linoleic acid (~16%), and stearic acid (~2%) [17]. These fatty acids are precursors of various volatile compounds [45] that characterize the flavor of sinami fruits.

3.4. Polyphenols, Natural Pigments, and Antioxidant Capacity of Sinami Fruit at Harvest

Table 3 summarizes the bioactive components and in vitro antioxidant capacity of O. mapora fruits in relation to harvest time. The total polyphenol content (TPC) decreases from harvest 1 (30.80 mg GAE/g) to harvest 4 (20.63 mg GAE/g). The loss of TPC over the four harvests was 33.02%. The decrease in TPC during the ripening process is consistent with several types of fruits that, upon ripening, are orange, red, purple, blue, or black, as is the case with red raspberry var. Himbo-Top and peach “Jinlinghuanglu” (Prunus persica L.) [46,47]. On the other hand, the total flavonoid content (TFC) increases in harvest 2 and then decreases in harvest 3 and harvest 4. For example, in peach fruits (P. persica L.) at different stages of ripening, there is a significant decrease in flavonoids and phenolic acids, and they show a positive correlation with TPC [47].
In the case of natural pigments, total carotenoids (TCCs) and total chlorophylls (TChCs) are present in harvest 1 (19.95 and 69.08 μg/g, respectively) and harvest 2 (23.70 and 80.88 μg/g, respectively). Finally, these pigments disappear in the last two harvests. Several types of fruit undergo similar changes during ripening, especially those that change from green (chlorophyll and carotenoids) to red, purple–blue (accumulation of anthocyanins), such as plums, berries, red pears, red apples, prunes, eggplants, and grapes [48,49]. On the other hand, the anthocyanin content (TAC) was detected in harvest 2 (0.29 mg c-3 g/g), increased in harvest 3 (1.65 mg c-3-g/g), and decreased in harvest 4 (1.00 mg c-3-g/g). These results are comparable with Oenocarpus distichus from three locations in the Amazonian region of Brazil, which showed values between ~0.031 and ~0.68 mg cyanidin 3-rutinoside/g. Some anthocyanins, identified as cyanidin and cyanidin 3-O-rutinoside derivatives, were found in concentrations of 1.80 to 17.35 mg/kg and 48.47 to 196.51 mg/kg, respectively [50]. A similar effect is observed in Liriope spicata berries during ripening, where TAC increases rapidly from ripening stage 3 (dark green fruit) to ripening stage 5 (dark fruit). The TAC in these fruits was ~68 μg/g, and the biosynthesis of the main anthocyanins involved cyanidin and delphinidin derivatives [51]. The biochemical changes during the ripening of sinami fruits, related to natural pigments such as chlorophyll, carotenoid, and anthocyanin content, may be primarily due to climacteric respiration, the formation of secondary metabolites from primary metabolites, and their role in biological processes [47].
Regarding the antioxidant capacity evaluated by DPPH and ABTS, a slight increase was observed during the ripening of O. mapora fruits from harvest 1 to harvest 2. Subsequently, a slight but significant decrease was observed towards harvest 4 for the DPPH radical (15%), while for the ABTS radical, it was more pronounced (~53%). De Sousa et al. [50] reported a high antioxidant capacity of O. distichus genotypes in the ripe state, and this bioactivity is associated with various phenolic compounds such as flavonoids, phenolic acids, and anthocyanins. A similar effect was observed during the ripening of Andean blackberries (Rubus glaucus Benth.), where the antioxidant capacity measured by FRAP and ABTS decreased significantly from the first stage of ripening (less than 50% pigmented) to the third stage of ripening (fully ripe) [52].

3.5. Phenolic Compounds Profile of Sinami Fruit at Harvest

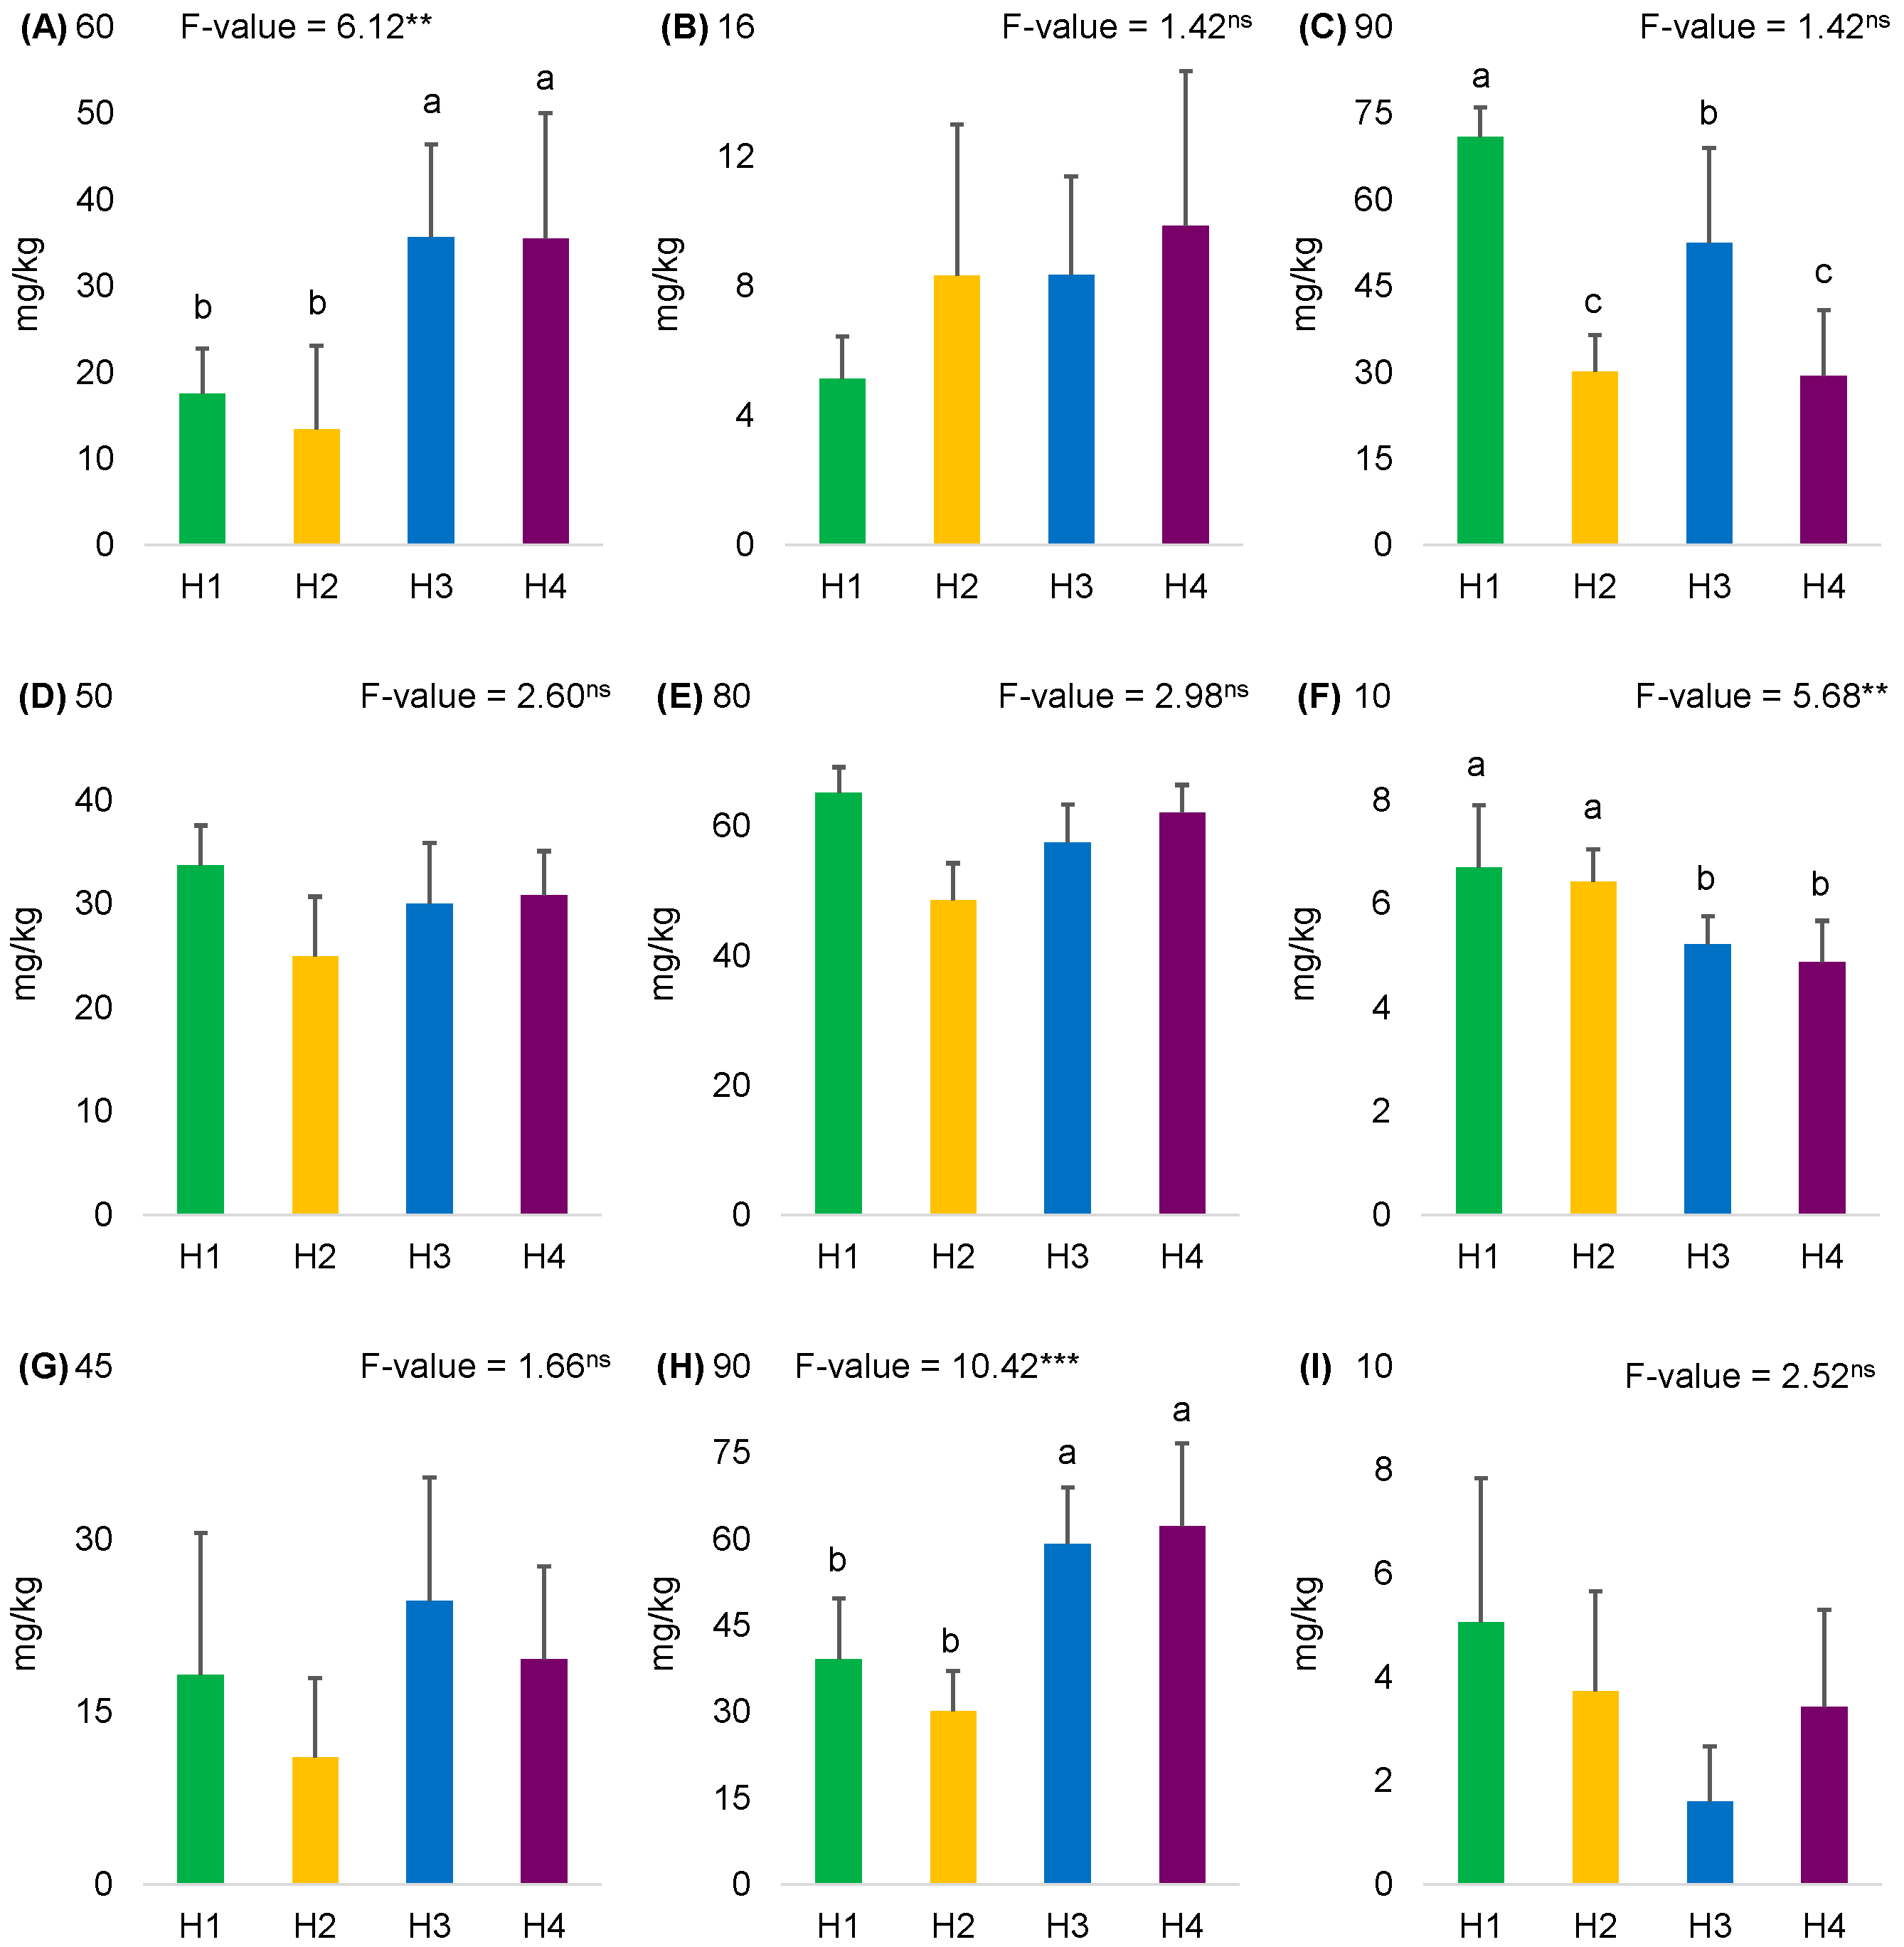
Figure 1 summarizes the phenolic compound profile during the ripening of O. mapora fruits. Some of these compounds were identified and quantified in Oenocarpus distichus Mart., including 3,4-dihydroxybenzoic acid, chlorogenic acid, ferulic acid, cyanidin derivatives, syringic acid, rutin, and flavonol derivatives [50]. During ripening, some phenolic compounds, such as 3,4-dihydroxybenzoic acid, chlorogenic acid, vanillic acid, sinapic acid, and 2-hydroxycinnamic acid, showed no significant difference (p < 0.05). On the other hand, the phenolic compounds that showed significant differences depending on the ripening of the O. mapora fruits were gallic acid, rutin, 4-hydroxyphenylacetic acid, and ferulic acid. The first two polyphenols (gallic acid and rutin) show increases during ripening of 50.58% and 37.21%, respectively. Furthermore, they remain constant in the last two harvests. Similar effects were observed in some berries, such as blueberries (Vaccinium spp.) from four different cultivars “Powderblue,” “Gardenblue,” “Baldwin,” and “Bright Well,” which showed increases in gallic acid, rutin, quercetin, and catechin derivatives [53]. On the other hand, the last two phenolic acids (4-hydroxyphenylacetic acid and ferulic acid) show a decrease during ripening, with reductions of 58.55% and 27.20%, respectively. In some olive varieties, such as Gemlik and Sarıulak, a decrease in these compounds was observed during ripening, with 4-hydroxyphenylacetic acid showing the greatest changes [54,55]. Several of these bioactive compounds identified in the fruits of Oenocarpus species have demonstrated potential biological effects, including antioxidant properties, antimalarial activity against Plasmodium falciparum, anti-obesity activity, and antiproliferative activity against human tumor and non-tumor cell lines [56,57,58].

3.6. Correlations and K-Means Clustering

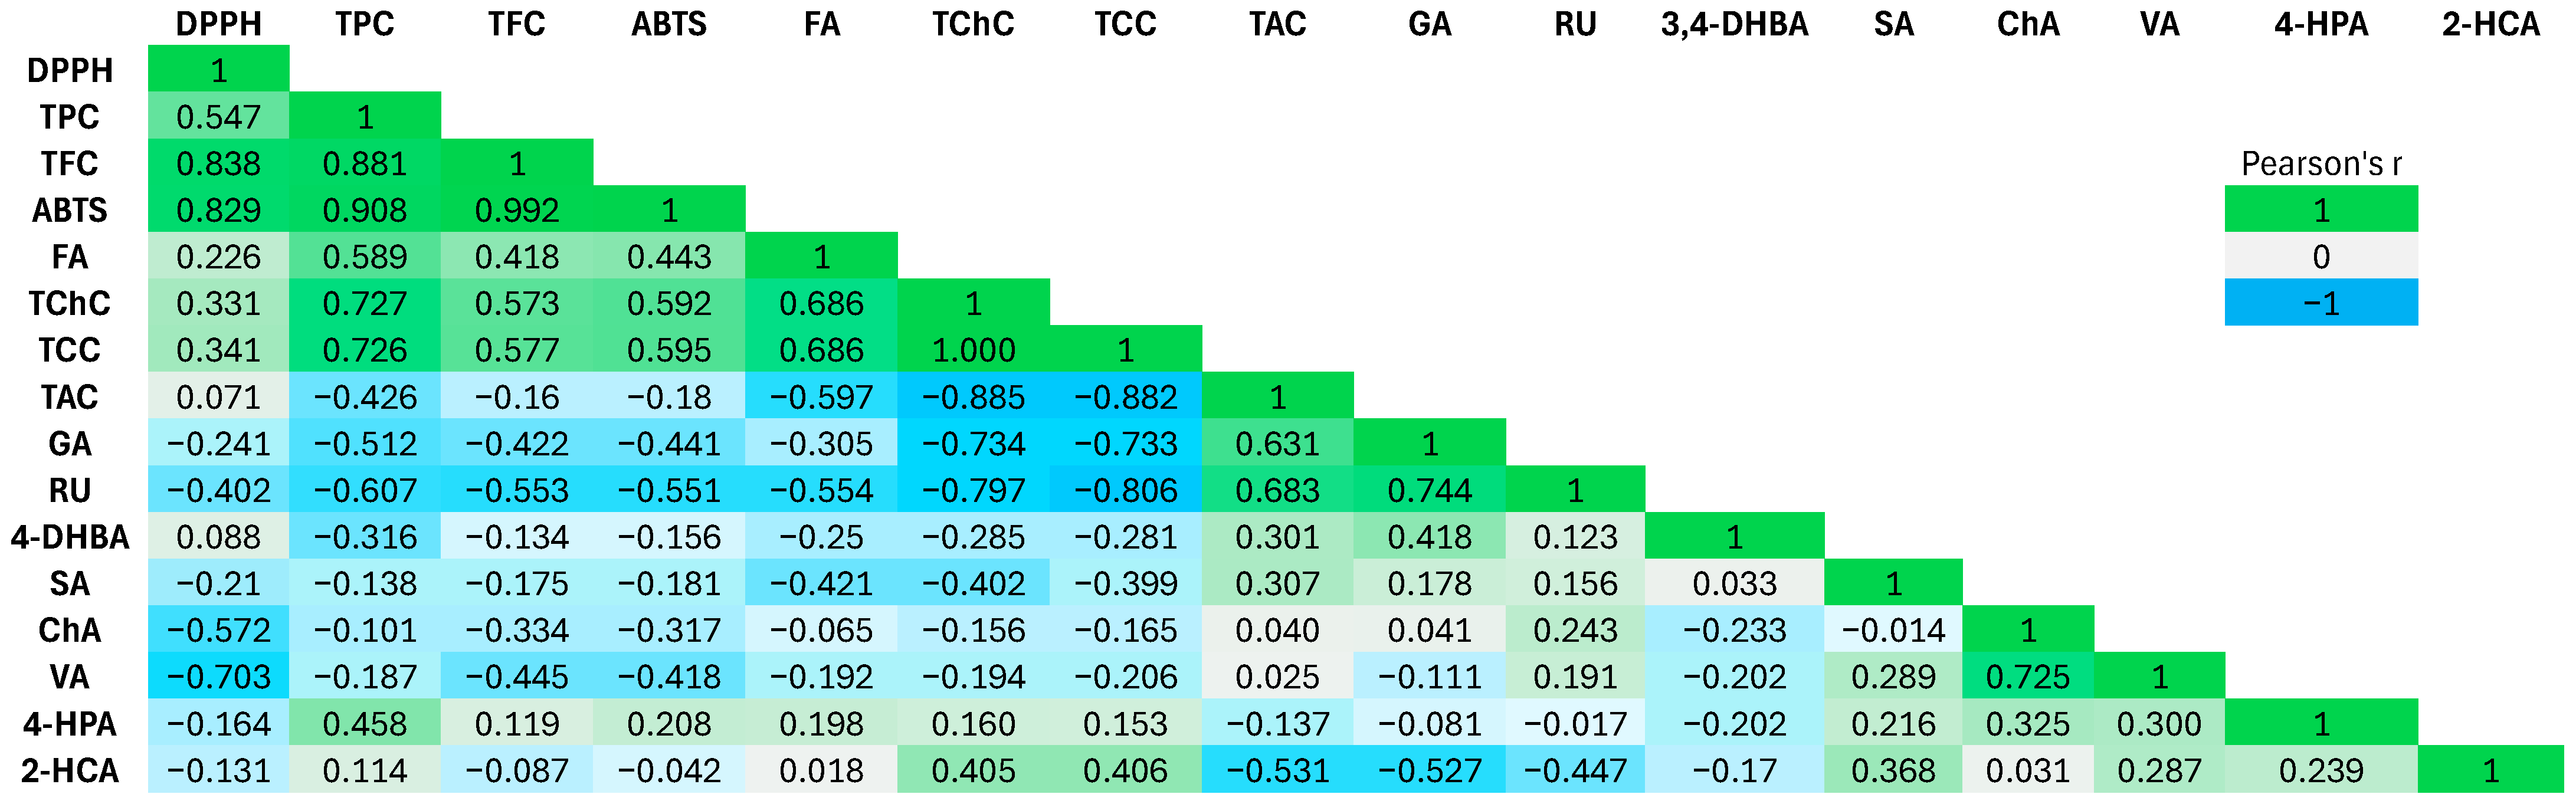
Figure 2 shows the correlation matrix between the different bioactive compounds and the antioxidant capacity of sinami (O. mapora) fruits harvested at different times. The correlations between the different variables are consistent with the empirical scale proposed by Asuero et al. [59].
The associations that showed a very high correlation (r ≥ 0.9) were the antioxidant capacity measured by ABTS with total flavonoid content (TFC) (r = 0.992; p-value < 0.001), and ABTS vs. TPC (r = 0.908; p-value < 0.001). A similar correlation was observed between total carotenoid content (TCC) and total chlorophyll content (TChC) (r = 0.999; p-value < 0.001). On the other hand, correlations between 0.7 ≥ r ≤ 0.89 correspond to a high correlation. In this range the variables were: TPC vs. TFC (r = 0.881; p-value < 0.001), DPPH vs. TFC (r = 0.837; p-value < 0.001), ABTS vs. DPPH (r = 0.829; p-value < 0.001), gallic acid vs. rutin (r = 0.743; p-value < 0.001), and vanillic acid vs. chlorogenic acid (r = 0.724; p-value < 0.001). Furthermore, a moderate correlation between 0.5 ≥ r ≤ 0.69 was observed between the variables, TAC vs. rutin (r = 0.683; p-value < 0.001), TAC vs. gallic acid (r = 0.631; p-value = 0.003), TPC vs. ferulic acid (r = 0.589; p-value = 0.006) and DPPH vs. TPC (r = 0.547; p-value = 0.012). Generally, several scientific reports have indicated a strong correlation between TFC, TPC, and antioxidant capacity (r = 0.731 to 0.993) during ripening [60]. On the other hand, individual phenols such as ferulic acid, gallic acid, and rutin are responsible for the antioxidant capacity during ripening in O. mapora fruits. For example, Li et al. [47] found a high correlation between the antioxidant capacity measured by FRAP and ABTS with procyanidin B2, procyanidin C1, caffeic acid, quinic acid, and epicatechin in peach fruits at different stages of ripening. In the case of natural pigments in the fruits of O. mapora, a very high and significant correlation is observed between TCC and TChC during ripening. These results are consistent with Motilva and Romero [61], who reported similar correlations in olive fruits of the Farga and Arbequina varieties at different ripening stages.
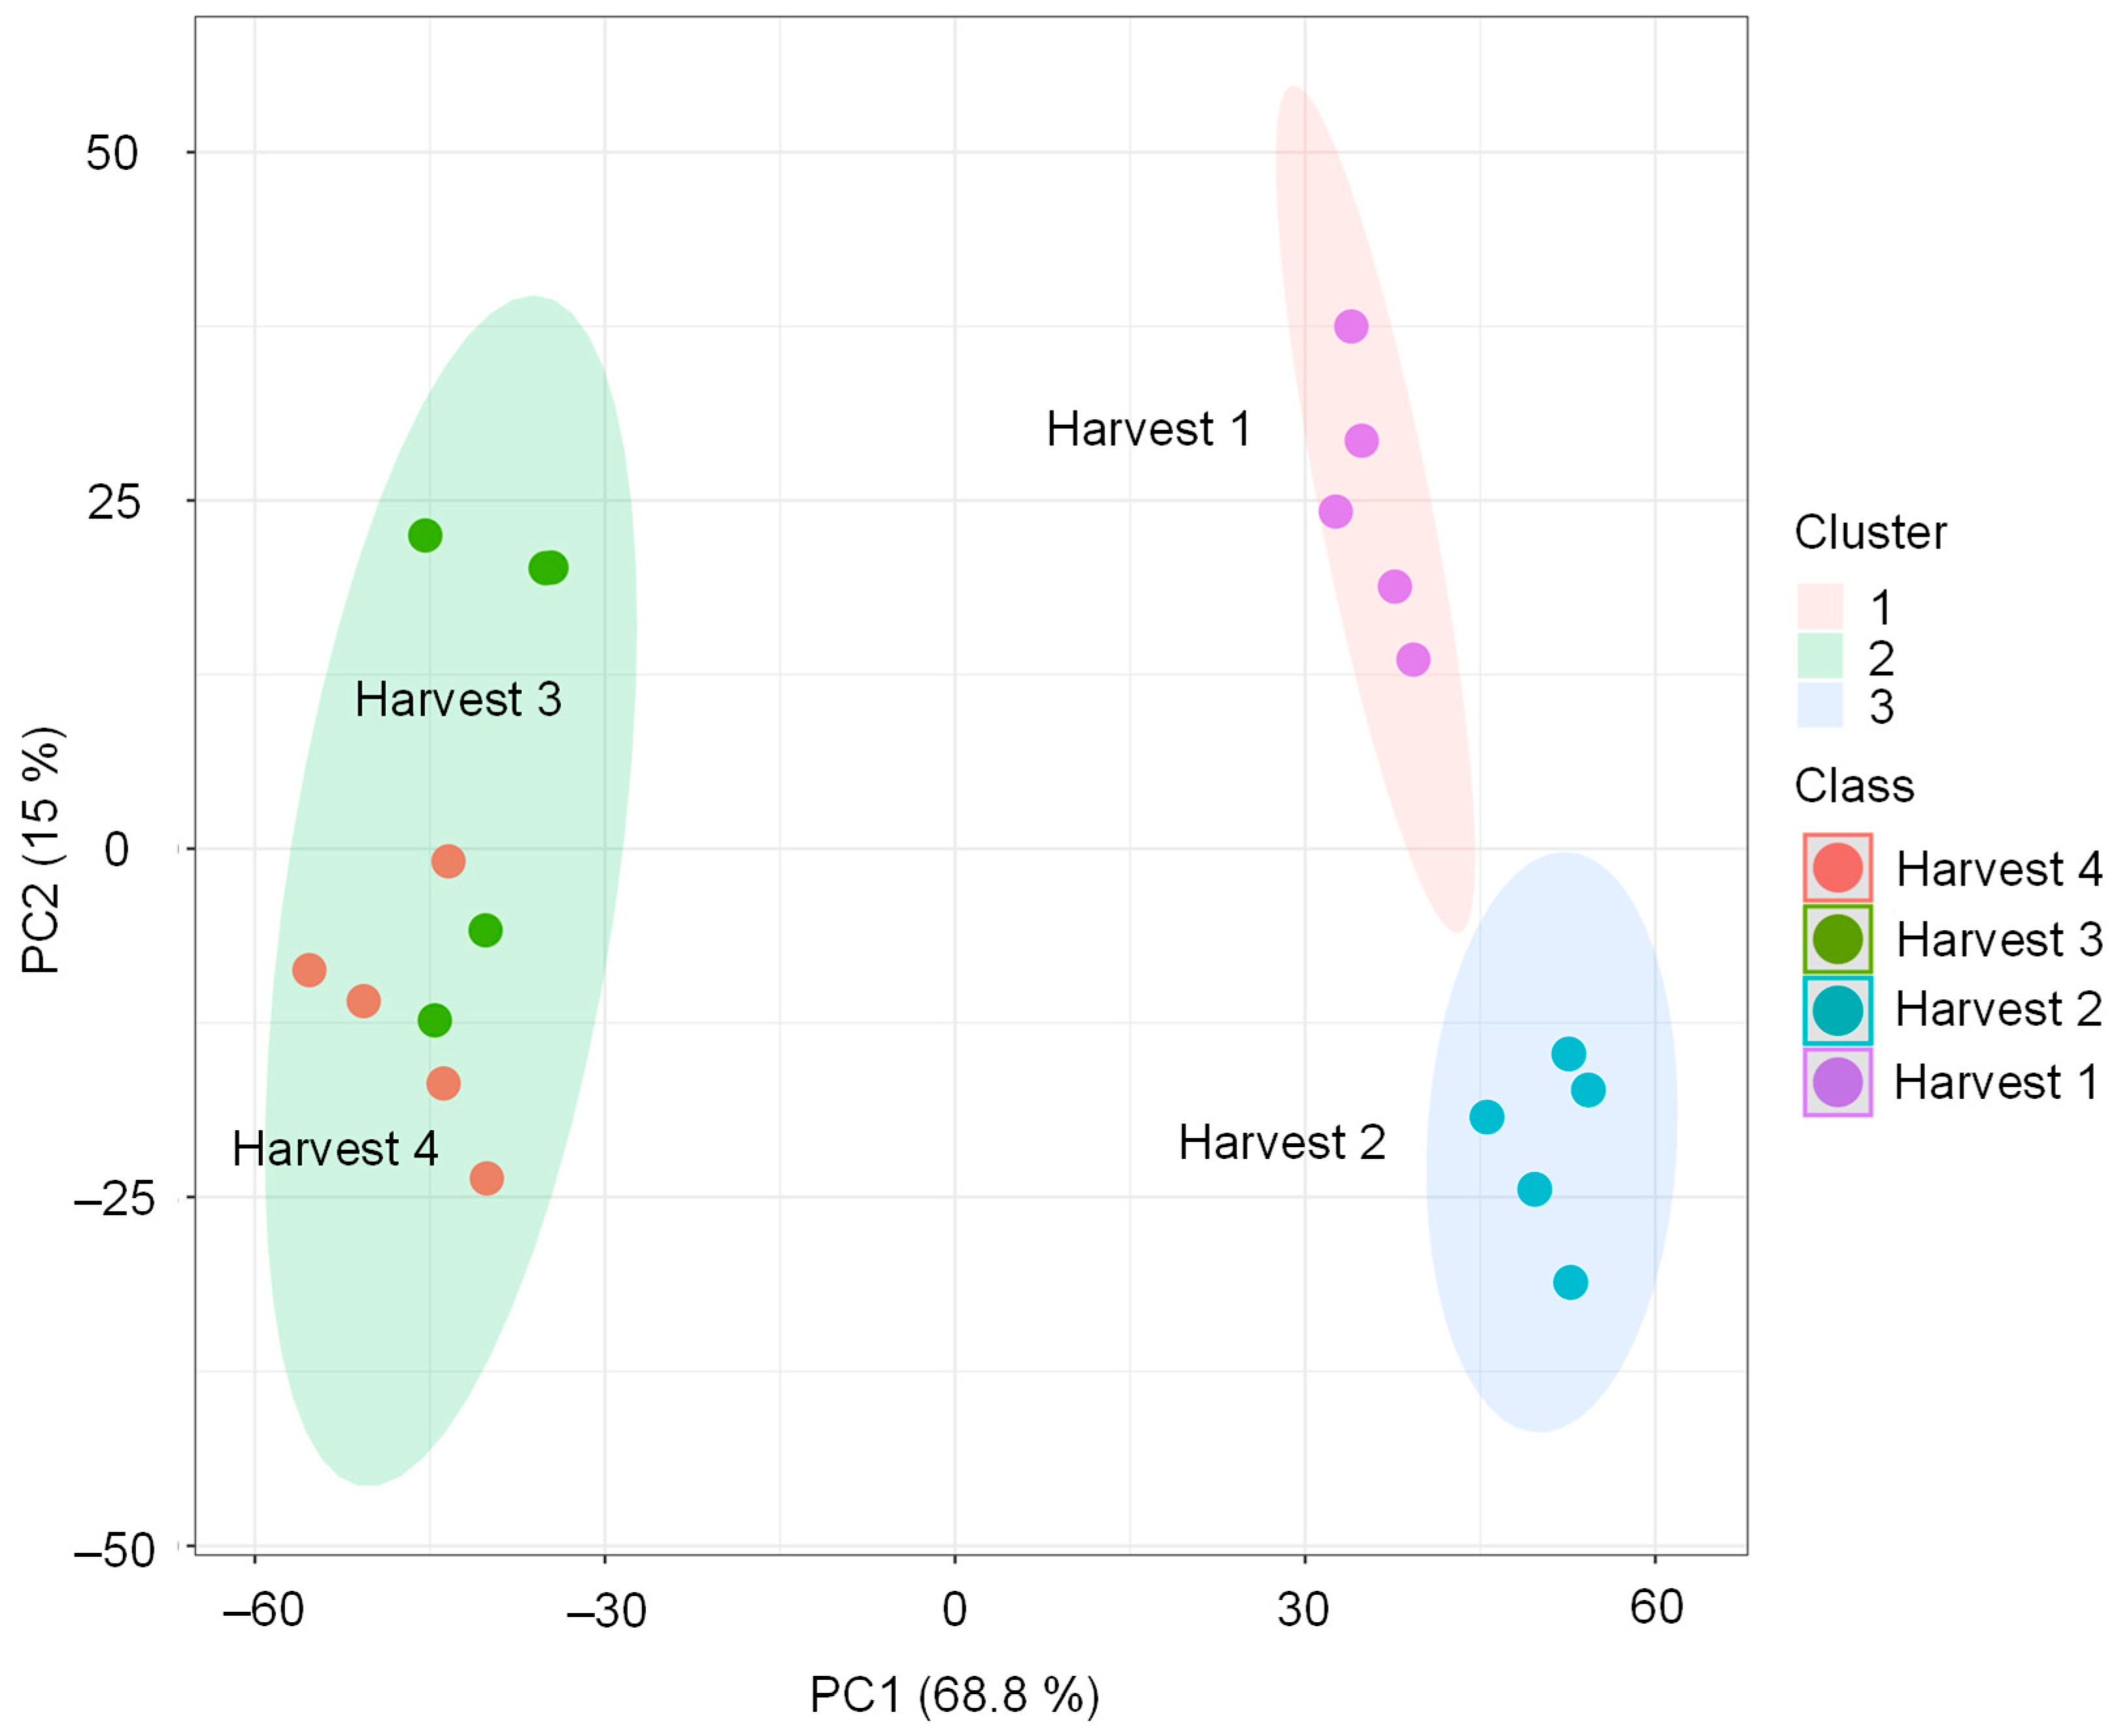
Figure 3 shows the clustering of the k-means algorithm. In this test, the k-mean algorithm was fed with total phenolic content, total flavonoid content, total anthocyanin content, total chlorophyll content, total carotenoid content, DPPH and ABTS radical scavenging activities, gallic acid, 3,4-dihydroxybenzoic acid, 4-hydroxyphenylacetic acid, chlorogenic acid, vanillic acid, ferulic acid, sinapic acid, rutin, and 2-hydroxycinnamic acid. The first two PCs explained 83.8% of the variance in the data. PC1 alone explained 68.8% of the variation; PC2 explained 15%. The loading plot shows membership in the corresponding group in the PCA. The fruits from harvest 1 (cluster 1) and harvest 2 (cluster 3) are very distinct, while the fruits from harvest 3 and harvest 4 show a somewhat similar composition (cluster 2).

4. Conclusions

These results show that the physicochemical properties, nutrients, chemical composition, and antioxidant capacity differed significantly across the four harvest times. Regarding the physicochemical properties, it was confirmed that pH, TSS (°Brix), TSS/TA ratio, and the a* coordinate increased during the ripening of O. mapora (sinami) fruits. A slight increase is observed in protein content, while carbohydrate and crude fiber content decrease rapidly in harvests 3 and 4. It should be noted that the lipid content increased rapidly to 30% in harvest 4. Furthermore, TPC, TFC, and antioxidant capacity decreased, while chlorophyll and carotenoid content were present in harvest 1 and harvest 2 and then disappeared in the last two harvests. On the other hand, the ripening of O. mapora fruits is accompanied by an increase in anthocyanin content. Regarding individual phenols, a significant increase was observed for gallic acid and rutin. 4-Hydroxyphenylacetic acid and ferulic acid decrease significantly, while the remaining phenolic acids do not show significant differences during ripening. Very high positive correlations were found between TPC, TFC, ABTS, and DPPH, with values ranging from 0.829 ≥ r ≤ 0.992.
The importance of these results, based on their nutrients and bioactive components obtained from preliminary studies, helps to understand the relationship between these and the harvest time. These results contribute substantially to the possibility of promoting the commercial value and use of sinami fruits as a source of vegetable oil. Although there is currently no large-scale exploitation of this Amazonian palm, conservation is being promoted to prevent indiscriminate logging for other non-food purposes. There is the valorization of byproducts, especially the sinami cake obtained after oil extraction. Based on our results, we propose harvesting sinami fruits in December to obtain ripe fruit and avoid over-ripening, damage caused by birds, or fungal infections. These results contribute significantly to the utilization of O. mapora (sinami) fruits for oil extraction and their subsequent use in the food and cosmetic industries.

Author Contributions

W.C.-N.: Investigation, Methodology, Formal Analysis, Writing—Original Draft. E.M.M.: Investigation, Formal Analysis, Writing—Original Draft. M.I.C.-P.: Conceptualization, Supervision. J.D.-V.: Conceptualization, Data Curation. A.M.M.: Supervision, Project Administration, Writing—Review and Editing. F.R.-E.: Investigation, Methodology, Writing—Review and Editing. All authors have read and agreed to the published version of the manuscript.

Funding

This research was funded by the Fondo Nacional de Desarrollo Científico, Tecnológico y de Innovación Tecnológica of Perú [Grant number: 108-2018-FONDECYT-BM-IADT-MU] and the APC was funded by Universidad San Ignacio de Loyola.

Institutional Review Board Statement

Not applicable.

Informed Consent Statement

Not applicable.

Data Availability Statement

The original contributions presented in this study are included in the article. Further inquiries can be directed to the corresponding author.

Conflicts of Interest

The authors declare no conflicts of interest.

References

  1. Pichardo-Marcano, F.J.; Nieto-Blázquez, M.E.; MacDonald, A.N.; Galeano, G.; Roncal, J. Phylogeny, Historical Biogeography and Diversification Rates in an Economically Important Group of Neotropical Palms: Tribe Euterpeae. Mol. Phylogenetics Evol. 2019, 133, 67–81. [Google Scholar] [CrossRef] [Scilit] [PubMed]
  2. Kahn, F.; Mejía-Carhuanca, K.M. Las Palmeras Nativas de Importancia Económica en la Amazonia Peruana. Folia Amaz. 1988, 1, 103–116. [Google Scholar] [CrossRef] [Scilit]
  3. Kahn, F. The Genus Astrocaryum (Arecaceae). Rev. Peru. Biol. 2008, 15, 31–48. [Google Scholar] [CrossRef] [Scilit]
  4. Sorita, G.D.; Favaro, S.P.; Rodrigues, D.S.; Junior, W.P.S.; Leal, W.G.O.; Ambrosi, A.; Di Luccio, M. Aqueous Enzymatic Extraction of Macauba (Acrocomia aculeata) Pulp Oil: A Green and Sustainable Approach for High-Quality Oil Production. Food Res. Int. 2024, 182, 114160. [Google Scholar] [CrossRef] [Scilit] [PubMed]
  5. Sosnowska, J.; Walanus, A.; Balslev, H. Asháninka Palm Management and Domestication in the Peruvian Amazon. Hum. Ecol. 2015, 43, 451–466. [Google Scholar] [CrossRef] [Scilit] [PubMed]
  6. Delgado, C.; Romero, R.; Espinoza, R.V.; Trigozo, M.; Correa, R. Rhynchophorus palmarum Used in Traditional Medicine in the Peruvian Amazon. Ethnobio. Lett. 2019, 10, 120–128. [Google Scholar] [CrossRef] [Scilit]
  7. Mineli, M.M.S.; Martins, G.A.S.; Pires, C.R.F.; Ferreira, E.M.S.; Oliveira, M.O.S.; da Silva, J.F.M. Development of Sub-Product from the Waste from Bacaba Processing (Oenocarpus bacaba Mart) As A Source of Value Aggregation and Income Generation. Res. Soc. Dev. 2021, 10, e15810313078. [Google Scholar] [CrossRef] [Scilit]
  8. Romero-Orejon, F.L.; Huaman, J.; Lozada, P.; Ramos-Escudero, F.; Muñoz, A.M. Development and Functionality of Sinami (Oenocarpus mapora) Seed Powder as a Biobased Ingredient for the Production of Cosmetic Products. Cosmetics 2023, 10, 90. [Google Scholar] [CrossRef] [Scilit]
  9. Martínez, E.; Ramos-Escudero, F. Valorization of Flours from Cocoa, Sinami and Sacha Inchi By-Products for The Reformulation of Peruvian Traditional Flatbread (‘Pan Chapla’). Int. J. Gastron. Food Sci. 2024, 36, 100930. [Google Scholar] [CrossRef] [Scilit]
  10. Smith, N. Oenocarpus mapora. In Palms and People in the Amazon; Smith, N., Ed.; Springer: Cham, Switzerland, 2015; pp. 421–428. [Google Scholar]
  11. Dettenborn de Cól, C.; Tischer, B.; Flôres, S.H.; Rech, R. Foam-mat Drying of Bacaba (Oenocarpus bacaba): Process Characterization, Physicochemical Properties, and Antioxidant Activity. Food Bioprod. Process 2021, 126, 23–31. [Google Scholar] [CrossRef] [Scilit]
  12. Vargas-Arana, G.; Merino-Zegarra, C.; Maytahuari-Aricari, G.; Ochoa-Ipushima, M. Valor Nutricional y Capacidad Antioxidante de Cuatro Frutos de Palmeras Nativas de la Amazonia Peruana. Folia Amaz. 2022, 31, 17–29. [Google Scholar] [CrossRef] [Scilit]
  13. de Oliveira, G.L.; Pacheco de Araújo, M.G.; Stauffer, F.; da Cunha, K.C.M. Comparative Morpho-Anatomy of the Female Flowers in Species of Amazonian Palm Genus Oenocarpus Martius. Flora 2025, 328, 152745. [Google Scholar] [CrossRef] [Scilit]
  14. Finco, F.D.B.A.; Kloss, L.; Graeve, L. Bacaba (Oenocarpus bacaba) Phenolic Extract Induces Apoptosis in the MCF-7 Breast Cancer Cell Line Via the Mitochondria-Dependent Pathway. NFS J. 2016, 5, 5–15. [Google Scholar] [CrossRef] [Scilit]
  15. Vargas-Arana, G.; Merino-Zegarra, C.; Del-Castillo, Á.M.R.; Quispe, C.; Viveros-Valdez, E.; Simirgiotis, M.J. Antioxidant, Antiproliferative and Anti-Enzymatic Capacities, Nutritional Analysis and UHPLC-PDA-MS Characterization of Ungurahui Palm Fruits (Oenocarpus bataua Mart) From the Peruvian Amazon. Antioxidants 2022, 11, 1598. [Google Scholar] [CrossRef] [Scilit] [PubMed]
  16. Muñoz, A.M.; Casimiro-Gonzales, S.; Gómez-Coca, R.B.; Moreda, W.; Best, I.; Cajo-Pinche, M.I.; Loja, J.F.; Ibañez, E.; Cifuentes, A.; Ramos-Escudero, F. Comparison of Four Oil Extraction Methods for Sinami Fruit (Oenocarpus mapora H. Karst): Evaluating Quality, Polyphenol Content and Antioxidant Activity. Foods 2022, 11, 1518. [Google Scholar] [CrossRef] [Scilit] [PubMed]
  17. Barriga-Sánchez, M.; Casimiro-Gonzales, S.; Ramos-Escudero, F.; Muñoz, A.M.; Anticona, M. Supercritical CO2 Assisted Extraction of Freeze-Dried Sinami Fruit Pulp (Oenocarpus mapora H. karst) Oil: An Experimental Optimization Approach. LWT-Food Sci. Technol. 2024, 198, 115956. [Google Scholar] [CrossRef] [Scilit]
  18. Best, I.; Rengifo, H.; Velarde, E.; Loja, J.F.; Portugal, A.; Rengifo, P.; Aguilar, L.; Ramos-Escudero, F.; Muñoz, A.M. Phenology of Oenocarpus mapora H. Karst in low-terrace and high-terrace forests of the Madre de Dios region, Peru. Forests 2021, 12, 1424. [Google Scholar] [CrossRef] [Scilit]
  19. Fawole, O.A.; Opara, U.L. Changes in Physical Properties, Chemical and Elemental Composition and Antioxidant Capacity of Pomegranate (cv. Ruby) Fruit at Five Maturity Stages. Sci. Hortic. 2013, 150, 37–46. [Google Scholar] [CrossRef] [Scilit]
  20. Cutire, F.C.F.; Casimiro-Gonzales, S.; Ramos-Escudero, F.; Muñoz, A.M. Valorización de Torta Residual de Aceite de Sinami (Oenocarpus Mapora H. Karst) Obtenida del Prensado por Tornillo Como un Recurso de Valor Agregado. Rev. Soc. Quím. Perú 2022, 88, 78–89. [Google Scholar] [CrossRef] [Scilit]
  21. Otzen, T.; Manterola, C. Técnicas de Muestreo Sobre una Población a Estudio. Int. J. Morphol. 2017, 35, 227–232. [Google Scholar] [CrossRef] [Scilit]
  22. Moon, P.; Fu, Y.; Bai, J.; Plotto, A.; Crane, J.; Chambers, A. Assessment of Fruit Aroma for Twenty-Seven Guava (Psidium guajava) Accessions Through Three Fruit Developmental Stages. Sci. Hortic. 2018, 238, 375–383. [Google Scholar] [CrossRef] [Scilit]
  23. Latimer, G.W. Official Methods of Analysis of AOAC International, 22nd ed.; Oxford University Press: New York, NY, USA, 2023. [Google Scholar]
  24. Ibourki, M.; Azouguigh, F.; Jadouali, S.M.; Sakar, E.H.; Bijla, L.; Majourhat, K.; Gharby, S.; Laknifli, A. Physical Fruit Traits, Nutritional Composition, and Seed Oil Fatty Acids Profiling in the Main Date Palm (Phoenix dactylifera L.) Varieties Grown in Morocco. J. Food Qual. 2021, 2021, 138043. [Google Scholar] [CrossRef] [Scilit]
  25. Tsombou, F.M.; Al Dhanhani, S.S.J.; Mirza, A.; Youssouf, B.; Ridouane, F.L. Effect of Harvest Timing and Plant Parts on The Nutritional and Chemical Profile of Five Potential Fodder Plants Found in Eastern Coast of United Arab Emirates. Sci. Rep. 2024, 14, 11371. [Google Scholar] [CrossRef] [Scilit] [PubMed]
  26. Brand-Williams, W.; Cuvelier, M.E.; Berset, C. Use of a Free Radical Method to Evaluate Antioxidant Activity. LWT Food Sci. Technol. 1995, 28, 25–30. [Google Scholar] [CrossRef] [Scilit]
  27. Re, R.; Pellegrini, N.; Proteggente, A.; Pannala, A.; Yang, M.; Rice-Evans, C. Antioxidant Activity Applying an Improved ABTS Radical Cation Decolorization Assay. Free Radic. Biol. Med. 1999, 26, 1231–1237. [Google Scholar] [CrossRef] [Scilit] [PubMed]
  28. Lee, J.; Durst, R.W.; Wrolstad, R.E. Determination of Total Monomeric Anthocyanin Pigment Content of Fruit Juices, Beverages, Natural Colorants, and Wines by the pH Differential Method: Collaborative Study. J. AOAC Int. 2005, 88, 1269–1278. [Google Scholar] [CrossRef] [Scilit]
  29. Briones-Labarca, V.; Giovagnoli-Vicuña, C.; Chacana-Ojeda, M. High Pressure Extraction Increases the Antioxidant Potential and In Vitro Bio-Accessibility of Bioactive Compounds from Discarded Blueberries. CyTA J. Food 2019, 17, 622–631. [Google Scholar] [CrossRef] [Scilit]
  30. Lichtenthaler, H.K.; Buschmann, C. Chlorophylls and Carotenoids: Measurement and Characterization by UV-VIS Spectroscopy. In Current Protocols in Food Analytical Chemistry; Wrolstad, R.E., Acree, T.E., An, H., Decker, E.A., Penner, M.H., Reid, D.S., Schwartz, S.J., Shoemaker, C.F., Sporns, P., Eds.; John Wiley and Sons: New York, NY, USA, 2001; pp. F4.3.1–F4.3.8. [Google Scholar]
  31. Pang, Z.; Lu, Y.; Zhou, G.; Hui, F.; Xu, L.; Viau, C.; Spigelman, A.F.; MacDonald, P.E.; Wishart, D.S.; Li, S.; et al. MetaboAnalyst 6.0: Towards a Unified Platform for Metabolomics Data Processing, Analysis and Interpretation. Nucleic Acids Res. 2024, 52, W398–W406. [Google Scholar] [CrossRef] [Scilit] [PubMed]
  32. de Oliveira, G.-L.; de Araújo, M.G.P.; Stauffer, F. Gynoecium and fruit development in Oenocarpus mapora Karsten (Arecoideae, Arecaceae). Flora 2025, 331, 152814. [Google Scholar] [CrossRef] [Scilit]
  33. Mendes, G.G.C.; de Gusmão, M.T.A.; Martins, T.G.V.; Rosado, R.D.S.; Sobrinho, R.S.A.; Nunes, A.-C.P.; Ribeiro, W.S.; Zanuncio, J.C. Genetic Divergence of Native Palms of Oenocarpus distichus Considering Biometric Fruit Variables. Sci. Rep. 2019, 9, 4943. [Google Scholar] [CrossRef] [Scilit] [PubMed]
  34. Ventura, L.J.M.; Pereira, J.S.L.; Mazzottini-dos-Santos, H.C.; de Lima, J.P.; Mercadante-Simões, M.O.; Lopes, P.S.N.; Ribeiro, L.M. Cytological Aspects of Butia capitata (Arecaceae) Fruit Maturation and Senescence. Sci. Hortic. 2022, 297, 110938. [Google Scholar] [CrossRef] [Scilit]
  35. Famiani, F.; Battistelli, A.; Moscatello, S.; Cruz-Castillo, J.G.; Walker, R.P. The Organic Acids That Are Accumulated in The Flesh of Fruits: Occurrence, Metabolism and Factors Affecting Their Contents—A Review. Rev. Chapingo Ser. Hortic. 2015, 21, 97–128. [Google Scholar] [CrossRef] [Scilit]
  36. Flor-Unda, O.; Guanochanga, F.; Samaniego, I.; Arias, V.; Ortiz, B.; Rosales, C.; Palacios-Cabrera, H. Physicochemical Characterization and Antioxidant Capacity of Açaí (Euterpe oleracea) in Ecuadorian Region. Foods 2024, 13, 3046. [Google Scholar] [CrossRef] [Scilit] [PubMed]
  37. Kou, X.; Wu, M. Characterization of Climacteric and Non-Climacteric Fruit Ripening. Methods Mol. Biol. 2018, 1744, 89–102. [Google Scholar] [CrossRef] [Scilit] [PubMed]
  38. Hossain, M.A.; Karim, M.M.; Juthee, S.A. Postharvest Physiological and Bio-Chemical Alterations in Fruits: A Review. Fundam. Appl. Agric. 2020, 5, 453–469. [Google Scholar] [CrossRef] [Scilit]
  39. Staveckienė, J.; Medveckienė, B.; Jarienė, E.; Kulaitienė, J. Effects of Different Ripening Stages on the Content of the Mineral Elements and Vitamin C of the Fruit Extracts of Solanum Species: S. melanocerasum, S. nigrum, S. villosum, and S. retroflexum. Plants 2024, 13, 343. [Google Scholar] [CrossRef] [Scilit] [PubMed]
  40. Garcia, L.G.C.; da Silva, F.A.; Asquieri, E.R.; Vilas Boas, E.V.B.; Ogando, F.I.B.; de Aguiar, C.L.; Damiani, M. Proximate Composition, Minerals Profile, and Predominant Sugars by Ion Chromatograph Along the Physiological Development of Jabuticaba Var. Pingo De Mel. Food Sci. Technol. Camp. 2018, 38, 16–21. [Google Scholar] [CrossRef] [Scilit]
  41. Pascual, I.; Antolín, M.C.; Goicoechea, N.; Irigoyen, J.J.; Morales, F. Grape Berry Transpiration Influences Ripening and Must Composition in Cv. Tempranillo (Vitis vinifera L.). Physiol. Plant. 2022, 174, e13741. [Google Scholar] [CrossRef] [Scilit] [PubMed]
  42. Ma, B.; Zhao, X.; Dai, B.; Zhao, M.; Yang, X.; Cui, L.; Shao, H. Changes in Phytochemical Compositions and Antioxidant Activity of Schisandra sphenathera Fruit During Ripening. Ind. Crops Prod. 2023, 199, 116773. [Google Scholar] [CrossRef] [Scilit]
  43. Chen, D.; Liu, Y.; Chen, Y.; Li, B.; Chen, T.; Tian, S. Functions of Membrane Proteins in Regulating Fruit Ripening and Stress Responses of Horticultural Crops. Mol. Hortic. 2024, 4, 35. [Google Scholar] [CrossRef] [Scilit] [PubMed]
  44. Cheng, Y.T.; Huang, P.H.; Chan, Y.J.; Chiang, P.Y.; Lu, W.C.; Hsieh, C.W.; Liang, Z.C.; Yan, B.W.; Wang, C.C.R.; Li, P.H. Investigate the Composition and Physicochemical Properties Attributes of Banana Starch and Flour During Ripening. Carbohydr. Polym. Technol. Appl. 2024, 7, 100446. [Google Scholar] [CrossRef] [Scilit]
  45. Hu, Q.; Zhang, J.; He, L.; Xing, R.; Yu, N.; Chen, Y. New Insight into The Evolution of Volatile Profiles in Four Vegetable Oils with Different Saturations During Thermal Processing by Integrated Volatolomics and Lipidomics Analysis. Food Chem. 2023, 403, 134342. [Google Scholar] [CrossRef] [Scilit] [PubMed]
  46. Kobori, R.; Yakami, S.; Kawasaki, T.; Saito, A. Changes in The Polyphenol Content of Red Raspberry Fruits During Ripening. Horticulturae 2021, 7, 569. [Google Scholar] [CrossRef] [Scilit]
  47. Li, Y.; Li, L.; Zhang, X.; Mu, Q.; Tian, J.; Yan, J.; Guo, L.; Wang, Y.; Song, L.; Yu, X. Differences in Total Phenolics, Antioxidant Activity and Metabolic Characteristics in Peach Fruits at Different Stages of Ripening. LWT Food Sci. Technol. 2023, 178, 114586. [Google Scholar] [CrossRef] [Scilit]
  48. Kapoor, L.; Simkin, A.J.; George Priya Doss, C.; Siva, R. Fruit Ripening: Dynamics and Integrated Analysis of Carotenoids and Anthocyanins. BMC Plant Biol. 2022, 22, 27. [Google Scholar] [CrossRef] [Scilit] [PubMed]
  49. Duan, X.; Wang, K.; Tang, R.; Liu, J.; Cheng, K.; Gao, G.; Wang, Y.; Qin, G. Recent Advances in Biosynthesis and Regulation of Strawberry Anthocyanins. Hortic. Res. 2025, 12, uhaf135. [Google Scholar] [CrossRef] [Scilit] [PubMed]
  50. de Sousa, S.H.B.; Mattietto, R.A.; Chisté, R.C.; Carvalho, A.V. Phenolic Compounds are Highly Correlated to the Antioxidant Capacity of Genotypes of Oenocarpus dtotichus Mart. Fruits. Food Res. Int. 2018, 108, 405–412. [Google Scholar] [CrossRef] [Scilit] [PubMed]
  51. Shi, J.; Wang, Y.; Wang, X.; Han, M.; Li, R.; Yu, C.; Peng, Z.; Gao, Y.; Liu, Z.; Shen, Y.; et al. Anthocyanin and Chlorophyll Accumulation by Targeted Metabolomic and Transcriptomic Analysis Involved in Pigment Accumulation During Fruit Maturation in Liriope spicata. J. Plant Physiol. 2025, 311, 154529. [Google Scholar] [CrossRef] [Scilit] [PubMed]
  52. Guevara-Terán, M.; Tejera, E.; Vásquez-Castillo, W.; Santos-Buelga, C.; González-Paramás, A.M.; Alvarez-Suarez, J.M. Influence of Altitudes and Development Stages on The Chemical Composition and Antioxidant Capacity of Andean Blackberries (Rubus glaucus Benth). Front. Nutr. 2024, 11, 1501889. [Google Scholar] [CrossRef] [Scilit] [PubMed]
  53. Xie, G.; Xu, X.; Zhou, X.; Liu, Y.; Zhao, Z. Changes in Phenolic Profiles and Antioxidant Activity in Rabbiteye Blueberries During Ripening. Int. J. Food Prop. 2019, 22, 320–329. [Google Scholar] [CrossRef] [Scilit]
  54. Arslan, D.; Özcan, M.M. Evaluation of Drying Methods with Respect to Drying Kinetics, Mineral Content and Colour Characteristics of Rosemary Leaves. Energy Convers. Manag. 2008, 49, 1258–1264. [Google Scholar] [CrossRef] [Scilit]
  55. Uylaşer, V.; Yildiz, G. The Historical Development and Nutritional Importance of Olive and Olive Oil Constituted an Important Part of the Mediterranean Diet. Crit. Rev. Food Sci. Nutr. 2014, 54, 1092–1101. [Google Scholar] [CrossRef] [Scilit] [PubMed]
  56. Noguera, N.H.; Noguera, D.C.L.H.; Machado, A.P.F.; Reguengo, L.M.; do Nascimento, R.P. Emerging Berries from The Brazilian Amazon and Atlantic Forest Biomes: New Sources of Bioactive Compounds with Potential Health Benefits. Food Funct. 2024, 15, 5752–5784. [Google Scholar] [CrossRef] [Scilit] [PubMed]
  57. Lima, A.S.; Cruz, T.M.; Silva, A.O.; Cox, T.; Dias, J.V.B.; Bezerra, J.A.; Lima, M.S.; Crispim, M.; Azevedo, L.; Magnani, M.; et al. Amazonian Pataua (Oenocarpus bataua) Pulp Extract: Bioaccessibility of Phenolic Compounds and Effects on Cellular Antioxidant and Antimalarial Activities. Future Foods 2025, 11, 100650. [Google Scholar] [CrossRef] [Scilit]
  58. Soares, S.D.; Lima, A.S.; Miranda, C.T.C.S.; Sales, G.M.; Ruiz, A.L.T.G.; Pontes, R.S.; Aguiar, J.P.L.; Arruda, H.S.; Catharino, R.R.; Numa, I.A.N.; et al. Unveiling the Chemical Composition and Biological Bioactivity of Two Amazonian Oenocarpus species. Eur. Food Res. Technol. 2025, 251, 4737–4751. [Google Scholar] [CrossRef] [Scilit]
  59. Asuero, A.G.; Sayago, A.; González, G. The Correlation Coefficient: An Overview. Crit. Rev. Anal. Chem. 2006, 36, 41–59. [Google Scholar] [CrossRef] [Scilit]
  60. Benchikh, Y.; Louaileche, H.; George, B.; Merlin, A. Changes in Bioactive Phytochemical Content and in Vitro Antioxidant Activity of Carob (Ceratonia siliqua L.) As Influenced by Fruit Ripening. Ind. Crops Prod. 2014, 60, 298–303. [Google Scholar] [CrossRef] [Scilit]
  61. Motilva, M.-J.; Romero, M.-P. The Effect of the Ripening Process of the Olive Fruit on the Chlorophyll and Carotenoid Fractions of Drupes and Virgin Oils. In Olives and Olive Oil in Health and Disease Prevention; Preedy, V.R., Watson, R.R., Eds.; Academic Press: London, UK, 2010; pp. 59–68. [Google Scholar]
Figure 1. Simple phenolic compounds by HPLC-DAD during the harvest time of sinami fruits. (A) gallic acid, (B) 3,4-dihydroxybenzoic acid, (C) 4-hydroxyphenylacetic acid, (D) chlorogenic acid, (E) vanillic acid, (F) ferulic acid, (G) sinapic acid, (H) rutin, and (I) 2-hydroxycinnamic acid. Results followed by letters are significantly different from Duncan’s Multiple Range test. Significant effect at p < 0.01 **, <0.001 *** and ns not significant. Harvests (H1, H2, H3, and H4).
Applbiosci 05 00065 g001
Figure 2. Heatmap of the Pearson correlation matrix between antioxidant capacity, phenol content, and plant pigments. Total phenolic content (TPC), total flavonoid content (TFC), total anthocyanin content (TAC), total chlorophyll content (TChC), total carotenoid content (TCC), DPPH and ABTS radical scavenging activities, gallic acid (GA), 3,4-dihydroxybenzoic acid (3,4-DHBA), 4-hydroxyphenylacetic acid (4-HPA), chlorogenic acid (ChA), vanillic acid (VA), ferulic acid (FA), sinapic acid (SA), rutin (RU), and 2-hydroxycinnamic acid (2-HCA).
Applbiosci 05 00065 g002
Figure 3. Cluster plot obtained after application of the k-means clustering on the PC1 and PC2 derived from data of TPC, TFC, TAC, TChC, TCC, DPPH, ABTS, GA, 3,4-DHBA, 4-HPA, ChA, VA, FA, SA, RU, and 2-HCA. PC1 and PC2 explained 68.8% and 15% of the total variance, respectively.
Applbiosci 05 00065 g003
Table 1. Characteristics of sinami fruit, including fruit weight, seed weight and peel + flesh weight.
Harvest TimeWeight per Unit (g)Seed (g)Peel + Flesh (g)
Harvest 14.52 ± 0.982.57 ± 0.561.34 ± 0.15
Harvest 24.60 ± 1.082.65 ± 0.491.41 ± 0.29
Harvest 34.73 ± 1.162.85 ± 0.761.50 ± 0.36
Harvest 45.35 ± 1.243.04 ± 0.741.84 ± 0.50
Average4.80 ± 0.382.78 ± 0.211.52 ± 0.22
F-value0.57 ns0.53 ns1.96 ns
ns Not significant.
Table 2. pH, total soluble solids (TSSs), titratable acidity (TA), maturity index (TSS/TA) and chromatic parameters during the maturity degree of sinami fruits.
ParametersHarvest Time (Dry Weight)F-Value
Harvest 1Harvest 2Harvest 3Harvest 4
pH3.90 ± 0.23 c4.20 ± 0.12 b4.39 ± 0.21 b4.65 ± 0.15 a15.07 ***
TA (g/100 g)0.65 ± 0.09 a0.45 ± 0.08 b0.32 ± 0.06 c0.26 ± 0.03 c30.96 ***
TSS (°Brix)5.74 ± 0.37 c6.98 ± 0.53 b8.04 ± 0.48 a8.68 ± 0.72 a28.46 ***
TSS/TA ratio8.98 ± 1.30 c16.12 ± 3.52 c25.61 ± 4.47 b33.75 ± 4.93 a40.21 ***
L*57.94 ± 2.65 a45.53 ± 3.22 b32.98 ± 3.84 c28.84 ± 2.02 d286.99 ***
a*1.40 ± 0.18 d4.30 ± 0.22 c6.60 ± 0.40 a5.46 ± 0.63 b474.55 ***
b*19.62 ± 1.23 a17.66 ± 1.07 b8.34 ± 0.20 c7.92 ± 0.13 c832.15 ***
C*ab19.67 ± 1.23 a18.18 ± 1.04 b10.64 ± 0.30 c9.63 ± 0.35 d565.07 ***
Hab85.91 ± 0.59 a76.26 ± 1.02 b51.69 ± 1.78 d55.52 ± 3.22 c1084.8 ***
TSS, total soluble solids; TA, titratable acidity (citric acid equivalent). L* (lightness), a* (red–green axis), b* (yellow–blue axis), chroma (C*ab) and hue angle (Hab). Results followed by different letters are significantly different from Duncan’s Multiple Range test. Significant effect at p < 0.001 ***.
Table 3. Proximate composition and antioxidant parameters during the maturity degree of sinami fruits.
ParametersHarvest Time (Dry Weight)F-Valuet-Value
Harvest 1Harvest 2Harvest 3Harvest 4
Moisture (g/100 g)6.85 ± 0.17 b7.29 ± 0.11 a6.10 ± 0.09 c5.51 ± 0.14 d185.28 ***
Protein (g/100 g)5.62 ± 0.51 b6.67 ± 0.14 a6.60 ± 0.16 a6.48 ± 0.21 a13.23 **
Lipid (g/100 g)0.46 ± 0.05 d6.03 ± 0.05 c22.37 ± 1.61 b31.47 ± 3.16 a326.63 ***
Ash (g/100 g)2.2 ± 0.09 a2.19 ± 0.04 a2.20 ± 0.08 a2.09 ± 0.15 a2.25 ns
Carbohydrate (g/100 g)84.83 ± 0.68 a77.82 ± 0.20 b62.73 ± 1.64 c54.45 ± 3.28 d275.01 ***
Fiber (g/100 g)27.97 ± 0.14 b28.29 ± 0.11 a18.03 ± 0.16 d18.59 ± 0.19 c6681.2 ***
TPC (mg GAE/g)30.80 ± 0.36 a30.71 ± 0.29 a28.64 ± 0.27 b20.63 ± 0.25 c1323.1 ***
TFC (mg CE/g)52.62 ± 0.46 c65.60 ± 0.40 a58.87 ± 0.34 b36.50 ± 0.41 d4683.4 ***
TAC (mg c-3-g/g)N.D0.29 ± 0.01 c1.65 ± 0.25 a1.00 ± 0.03 b112.97 ***
TChC (μg/g) 169.08 ± 1.21 b80.88 ± 1.39 aN.DN.D 14.34 ***
TCC (μg/g) 119.95 ± 0.23 b23.70 ± 0.23 aN.DN.D 25.77 ***
DPPH (mmol TE/g)4.89 ± 0.32 c5.61 ± 0.06 a5.35 ± 0.05 b4.76 ± 0.09 c27.72 ***
ABTS (mmol TE/g)10.27 ± 0.36 c12.89 ± 0.28 a11.43 ± 0.28 b5.95 ± 0.12 d599.74 ***
TPC, total polyphenols content; TFC, total flavonoid content; TAC, total anthocyanin content; TChC, total chlorophyll content; TCC, total carotenoid content; DPPH, 1,1-diphenyl-2-picryl-hydrazil; ABTS, 2,2′-azinobis-(3-ethylbenzothiazoline-6-sulfonic acid. N.D, not detected. Results followed by letters are significantly different from Duncan’s Multiple Range test. Significant effect at p < 0.01 **, <0.001 *** and ns not significant. 1 The t-student test was used to compare two samples.
Disclaimer/Publisher’s Note: The statements, opinions and data contained in all publications are solely those of the individual author(s) and contributor(s) and not of MDPI and/or the editor(s). MDPI and/or the editor(s) disclaim responsibility for any injury to people or property resulting from any ideas, methods, instructions or products referred to in the content.