
Article

Phytochemical and Nutritional Composition of Wild Salvia lavandulifolia Vahl. Seeds
by
María Quílez
1,
Gustavo J. Cáceres-Cevallos
1,*,
Pedro Sánchez-Gómez
2 and
María J. Jordán
1
1
Research Group on Rainfed Agriculture for Rural Development, Department of Rural Development, Oenology and Sustainable Agriculture, Murcian Institute of Agrarian and Environmental Research (IMIDA), La Alberca de las Torres, 30150 Murcia, Spain
2
Department of Plant Biology (Botany), Faculty of Biology, University of Murcia, Campus de Espinardo, 30100 Murcia, Spain
*
Author to whom correspondence should be addressed.
Seeds 2026, 5(4), 44; https://doi.org/10.3390/seeds5040044
Submission received: 5 June 2026 / Revised: 23 July 2026 / Accepted: 27 July 2026 / Published: 30 July 2026

Abstract

Salvia lavandulifolia Vahl. is an aromatic and medicinal plant cultivated as a rainfed crop for essential oil production in the western Mediterranean. New trends in the use of Lamiaceae seeds as functional ingredients warrant characterization of this species. Hence, studies were conducted to measure the proximate composition and amino acid profile, along with fatty acid profile, tocochromanol content, phenolic composition, and antioxidant activity in 10 wild populations. Defatted seed meal analysis demonstrates the potential usefulness of this species based on carbohydrate (50–60%), protein (13–21%), and oil (13–20%) content. The amino acid content ranged from 9.2 to 15.4 g/100 g. Seed oil analysis found a fatty acid content of 73–89 g/100 g with predominance of ω6 fatty acids, tocochromanol content of 62–89 mg/100 g, and a phenolic fraction of 7.5–148 mg/100 g with a high proportion of flavones. Antioxidant activity ranged from 10.6 to 23.1 µmol Trolox equivalents/100 g. Overall, seeds of S. lavandulifolia grown in subhumid conditions have strong nutritional and phytochemical profiles. These characteristics suggest opportunities for their use as functional ingredients. Further, strategies to minimize waste and maximize the availability of bioactive compounds will support the economic sustainability of this crop.

1. Introduction

The genus Salvia is one of the largest groups within the mint family (Lamiaceae), comprising over 900 species. Salvia is distributed worldwide but is particularly abundant in the Mediterranean region, Central and South America, and parts of Asia. Central and South America host the largest number of species globally, a total of 510, followed by West Asia with 270, Europe with 117, East Asia with 97, and North America with 94 species [1]. Several species are cultivated for their pharmacological and medical properties [2], while others are valued for culinary [3], ornamental [4], or cosmetic applications [5]. Some of the Salvia species most commonly used in the food industry include Salvia officinalis L. (common sage), Salvia hispanica L. (chia), Salvia sclarea L. (clary sage), Salvia miltiorrhiza Bunge (danshen), and Salvia lavandulifolia Vahl. (Spanish sage) [6].
Spanish sage is a widely used aromatic and medicinal plant native to the western Mediterranean basin, which stretches from southeastern France to the southern Moroccan Atlas [7]. This species is recognized for its high resilience and low water requirements, making it drought-resistant [8,9]. Its growth in these areas can play a significant role in mitigating soil erosion [10]. Taken together, these qualities help explain why this type of sage, known for its aromatic and medicinal properties, is commonly cultivated in the arid and semiarid regions of southeastern Spain, where the focus is primarily on the production of essential oils [11].
With this focus, Spanish sage remains underutilized, previous studies having highlighted numerous applications beyond essential oil extraction. In particular, several research articles have demonstrated the antioxidant properties of by-products from the distillation of Spanish sage [12]. It has also been explored for use as a food additive [13,14] and as a feed ingredient [15]. In particular, the seeds are an excellent source of lipids and vegetable protein. Therefore, they could be used as a new ingredient in human food or animal feed, potentially enhancing the economic value of the crop within the framework of a circular economy [16]. This concept is based on the principles of waste prevention and recovery outlined in Directive 2008/98/EC of the European Parliament [17], as well as the European Commission’s Communication COM/2011/0571 regarding the efficient use of resources [18].
All of these factors align with current societal trends. There is growing interest in healthy diets, functional foods, and nutraceuticals to promote health and manage disease [19]. Additionally, there is an increasing demand for locally sourced food products and environmentally friendly options [20]. This provides an opportunity to explore new crop management strategies that prioritize enhancing productivity, yield, and crop utilization, and could contribute to environmental, social, and economic sustainability [21].
A notable example is Salvia hispanica, commonly known as chia, which has seen a rise in commercial popularity due to its notable health benefits, documented in the scientific literature and attributable to the seeds’ strong biological activity [22]. Similar phenomena have also occurred with various oilseeds from other botanical families and genera that are commercially cultivated, including coriander (Coriandrum sativum) [23], flax (Linum usitatissimum) [24], sesame (Sesamum indicum) [25], borage (Echium vulgare and Buglossoides arvensis) [26,27], evening primrose (Oenothera biennis) [28], and poppy (Papaver rhoeas) [29].
Spanish sage is widely distributed and demonstrates significant ecological flexibility, which has resulted in considerable variability in both its morphology and chemical composition [8,30]. While the primary use of this species is in essential oil production, the potential for utilizing its seeds as a food ingredient remains largely unexplored. Additionally, it is uncertain whether the intraspecific variability in the chemical composition of its essential oils—observed among individuals even within the same population—is also reflected in the nutritional composition of its seeds.
Therefore, the main objective of this study was to characterize the phytochemical and nutritional composition of Salvia lavandulifolia Vahl. seeds from various populations in southeastern Spain. This research aims to create a knowledge base to support new applications in nutrition and health. Incorporating whole or ground seeds, or seed products (such as oil and meal), into various foods or nutraceuticals might enhance the value and profitability of the crop. This strategy is expected to both lessen the environmental impact of the production process and improve socioeconomic conditions for farmers.

2. Materials and Methods

2.1. Seeds

Seeds of Salvia lavandulifolia (identified by the authors) were collected from 10 wild populations belonging to different bioclimatic areas in the provinces of Murcia, Alicante, and Albacete (Spain) between July and August 2019. In each population, seeds were collected from five randomly selected individual plants, yielding a total of 50 samples. The bioclimatic zones and geographical locations are listed in Table 1 following the classification developed by Rivas-Martinez et al. [31]. The bioclimatic areas primarily correspond to pluvioseasonal oceanic zones, except for population 7, which is found in a xeric oceanic zone. After mechanical cleaning, the seeds were stored at 4 °C until analysis.

2.2. Seed Proximate Composition and Energy Value

Moisture, ash, crude protein, and oil yield were measured using methods of the Association of Official Analytical Collaboration (AOAC), adhering to the principles of the Weende proximate analysis system [32].

2.2.1. Measurement of Moisture and Ash Content

Moisture and ash contents were measured by gravimetric methods using 2 g of seeds. Moisture content was obtained by drying the sample at 105 °C to constant weight in a HERAEUS Instruments Series 7000 convection oven (Hanau, Germany). Ash content was determined by incineration of the samples in a HOBERSAL HK-11 muffle furnace (Barcelona, Spain), gradually increasing the temperature to 550 °C until reaching a constant weight.

2.2.2. Measurement of Protein Content

Total protein was determined in defatted seed meal after oven drying at 65 °C for 24 h. The analyses were performed using a combustion nitrogen/protein analyzer (LECO FP-528, Leco Corporation, St. Joseph, MI, USA). Protein content was calculated from total nitrogen using the conversion factor recommended for oilseeds (N × 5.3). Results are expressed as g of protein per 100 g of dry seeds.

2.2.3. Seed Oil Extraction and Lipid Yield Calculation

Total lipid content (including fats, waxes, resins, complex lipids, pigments, and fat-soluble vitamins) was determined using a Soxhlet extraction system (BÜCHI Extraction System B-811, Büchi, Flawil, Switzerland) [16]. Seed samples (2 g) were ground and extracted with ethyl acetate as the solvent (1:20 w/v). After 4 h of extraction and distillation, the solvent was removed under vacuum at 35 °C using an evaporator system (Syncore Polyvap R-96, Büchi). Lipid yield was expressed as g of oil per 100 g of dry seed.

2.2.4. Carbohydrate Content

The total carbohydrate content was calculated by subtracting the other content values measured from 100, as recommended [33]:
Carbohydrates (g/100 g) = 100 − (ash + moisture + protein + lipids)

2.2.5. Energy Value

The energy value of 100 g of seeds was calculated using an indirect method based on the Atwater system [34]. This method estimates kilocalories from the energy-yielding components of seeds by summing the calories contributed by proteins, carbohydrates, lipids, and, where applicable, alcohol. For this, we used reference values of 4 kcal/g for proteins and carbohydrates and 9 kcal/g for lipids.

2.3. Amino Acid Analysis

2.3.1. Protein Oxidation and Acid Hydrolysis

The AA profile of defatted seed meal (as described in Section 2.2.1) was determined using an AOAC Official Method, namely, the Performic Acid Oxidation with Acid Hydrolysis–Sodium Metabisulfite method [35], with minor modifications. In brief, for the oxidation process, 300 mg of dried sage meal was mixed with 5 mL of 88% formic acid and hydrogen peroxide at a ratio of 9:1 v/v, and incubated at 4 °C for 16 h. Following the oxidation step, 5 mL of 6 M hydrochloric acid containing 0.1% phenol was added, and the mixture was hydrolyzed under nitrogen at 112 °C for 23 h, using taurine as an internal standard.
After hydrolysis, the mixture was filtered and diluted to a final volume of 25 mL with Milli-Q water (Academic A10, Millipore, Molsheim, Francia). A 10-mL aliquot was vacuum-evaporated at 60 °C down to approximately 2 mL. Subsequently, 3 mL of Milli-Q water was added, and the evaporation process was repeated to eliminate residual hydrochloric acid. The final sample was adjusted to 25 mL and filtered through a 0.2 µm membrane before high-performance liquid chromatography (HPLC) analysis.

2.3.2. High-Performance Liquid Chromatography Analysis of Amino Acids

The AA composition of defatted seed meal was analyzed using HPLC with pre-column derivatization, as outlined by Slobodianiuk et al. [36]. The procedure was carried out using an automated programmable system with 9-fluorenylmethyl chloroformate and o-phthalaldehyde. Samples were examined on an AdvanceBio AAA column (4.6 × 100 mm, 2.7 µm), along with a pre-column (4.6 × 5 mm, 2.7 µm) from Agilent Technologies (Waldbronn, Germany). The column temperature was maintained at 40 °C.
The mobile phase A comprised 10 mM dibasic phosphate, 10 mM sodium borate decahydrate, and 5 mM sodium azide, adjusted to a pH of 8.2 using hydrochloric acid. Mobile phase B was a mixture of acetonitrile, methanol, and water at a ratio of 45:45:10 (v/v/v). Separation was conducted at a flow rate of 1.5 mL/min utilizing a gradient program: 0.35 min at 2% B, followed by a 13.4-min ramp to 57% B, a 2.2-min wash at 100% B, and equilibration back at 2% B. Detection was achieved using both UV and fluorescence: at λ = 338 nm with excitation/emission wavelengths (Ex/Em) of 340/450 nm for primary AAs, and at 262 nm with Ex/Em of 266/305 nm for secondary AAs.
AAs were identified by comparing their retention times to those of authentic standards obtained from Sigma-Aldrich (Merck, Darmstadt, Germany). The exceptions were methionine sulfone, which was sourced from TCI Chemicals (Zwijndrecht, Belgium), and proline, acquired from Scharlab (Sentmenat, Barcelona, Spain). For quantification, standard dilution curves and linear regression models were used. The results are expressed as grams of amino acid per 100 g of dry seed.
Tryptophan was not quantified since basic hydrolysis was not performed. Methionine and cysteine were determined as methionine sulfone and cysteic acid, respectively, after oxidation with performic acid.

2.4. Quantitative and Qualitative Characterization of Lipids

2.4.1. Cold Extraction of Lipid Fraction

To preserve heat-sensitive compounds, seed oils were extracted following the method described by Quílez et al. [16]. In brief, 2 g of powdered seeds were stirred with 40 mL of ethyl acetate for 4 h at 15 °C in darkness under an inert atmosphere. Water was removed with anhydrous sodium sulfate, and the solution was centrifuged at 4000 rpm for 10 min. The supernatant was filtered (0.45 µm) and evaporated to dryness at 35 °C under vacuum (Syncore Polyvap R-96, Büchi, Switzerland). Oils were stored at −80 °C, and the defatted meal was stored at −80 °C until AA analysis (Section 2.3.1).

2.4.2. Quantification of Fatty Acids: Gas Chromatography–Mass Spectrometry

To analyze the lipid fraction, fatty acids were converted into fatty acid methyl esters through a transesterification process involving both sequential alkaline and acid catalysis, as outlined in UNE-EN ISO [37]. For quantification, the authors followed the method described by Quílez et al. [16].
In summary, fatty acid methyl esters were injected into an Agilent Technologies (Waldbronn, Germany) 6890N Gas Chromatograph, which was coupled with an Agilent 5972 Mass Selective Detector. Separation was achieved using a 30 m × 0.25 mm i.d. DB-23 capillary column (Agilent technologies) with a film thickness of 0.25 μm. Helium served as the carrier gas, with a split ratio of 100:1 and an injection volume of 1 μL. The oven temperature program was started at 50 °C, increased to 175 °C at a rate of 25 °C/min, then to 211 °C at 4 °C/min, followed by 216 °C at 1 °C/min, and finally reached 230 °C at 5 °C/min. The injector and transfer line temperatures were set to 250 °C and 280 °C, respectively.
The mass spectrometer operated in electron impact mode (70 eV), scanning a mass-to-charge ratio (m/z) range of 45–425. Compounds were identified by comparing their retention times with reference standards and matching their mass spectra against the NBS75K Mass Spectral Library (U.S. National Bureau of Standards, 2002). All the standards were purchased from Sigma-Aldrich (Merck, Darmstadt, Germany). Quantification was performed using calibration curves, with nonadecanoic acid methyl ester as the internal standard. The target ions used for quantification included m/z 74 (SFAs), 55 (MUFAs), 69 (ω6 PUFAs), and 79 (ω3 PUFAs). For the quantification of the compounds that were not available, linear regression of similar components was used. The substitutions were 7-hexadecenoic acid by palmitoleic acid, hexadecanoic-14-CH3 acid and heptadecanoic-16-CH3 acid by palmitic acid, eicosanoic-14-CH3 acid by arachidic acid, and 15-tetracosenoic acid by eicosenoic acid.
The Atherogenicity Index (AI) and Thrombogenicity Index (TI) were calculated according to the equations proposed by Chen and Liu [38]:
AI = [C12:0 + (4 × C14:0) + C16:0]/ΣUFA
IT = (C14:0 + C16:0 + C18:0)/[(0.5 × ΣMUFA) + (0.5 × Σω6-PUFA) + (3 × Σω3-PUFA) + (ω3/ω6)]

2.4.3. Determination of Tocochromanol Content

The tocochromanol profile of the seed oils was analyzed using an Agilent 1200 HPLC System equipped with a G1311A binary pump, a G1315A photodiode array UV–Vis detector, and a G1321A fluorescence detector. Detection wavelengths were set at 262, 292, 296, and 298 nm for the diode array detector, while the fluorescence detector was operated at an excitation wavelength of 290 nm and an emission wavelength of 330 nm, following a previously reported method [16].
Samples were diluted in acetone (25–50 mg/mL), and 15 μL was injected onto a reverse-phase ZORBAX SB-C18 column (4.6 × 250 mm, 5 μm) protected with a guard column (ZORBAX SB-C18, 4.6 × 12.5 mm, 5 μm) (Agilent Technologies, Waldbronn, Germany). The column temperature was maintained at 25 °C and the flow rate at 1 mL/min. The mobile phase consisted of methanol (A) and tert-butyl methyl ether (B). The gradient program was as follows: 0 min, 1% B; 3 min, 2% B; 6 min, 3% B; 9 min, 4% B; 12 min, 5% B; 25 min, 11% B; 28 min, 25% B; 30 min, 1% B; and 35 min, 1% B. Individual tocochromanols were identified and quantified using calibration curves of the corresponding standard compounds. All the standards were purchased from Cymit Química S.L. (Barcelona, Spain).
Plastochromanol-8 (PC-8) was determined according to the method described by Gruszka and Kruk [39], with slight modifications. The mobile phase consisted of methanol (A) and tert-butyl methyl ether (B) at a flow rate of 1 mL/min. The gradient program was as follows: 0 min, 15% B; 3 min, 45% B; 5 min, 55% B; 8 min, 65% B; 12 min, 5% B; and 15 min, 15% B. Plastochromanol-8 was identified using flaxseed oil as a reference [40] and quantified using a calibration curve of γ-tocotrienol [41].

2.4.4. Phenolic Profile. HPLC-Diode Array Detector Quantitative Analysis

To assess the phenolic profile, the method described by Jordan et al. [42] was followed using the aforementioned Agilent (Waldbronn, Germany) 1200 HPLC System and the same analytical column as that used for tocochromanol analysis. Seed oils were diluted in ethyl acetate to a concentration of 150 ± 0.01 mg/mL. Before injection, the samples were filtered through 0.45 μm and 0.22 μm membrane filters (Millipore SAS, Molsheim, France). An injection volume of 20 μL was analyzed, and chromatographic separation was performed at 25 °C. The mobile phase consisted of acetonitrile (A) and acidified water containing 0.1% formic acid (B), with a flow rate of 1.0 mL/min. Detection wavelengths were set at 280 nm and 330 nm.
Phenolic compounds were identified by comparing their retention times and DAD spectra with those of analytically pure standards. All standards were purchased from Sigma-Aldrich (Merck, Darmstadt, Germany), with the exception of salvigenin, which was obtained from Cymit Química S.L. (Barcelona, Spain). Quantification was performed using external calibration curves created from standard solutions (Table S1). For caffeic acid, apigenin, and cirsiliol, independent linear calibration curves were used for quantification over different concentration ranges to ensure optimal linearity. The concentrations of individual phenolic compounds were expressed as mg per 100 g of oil.

2.4.5. Antioxidant Activity. DPPH Radical-Scavenging Activity

The radical scavenging activity of seed oils was determined using the method outlined by Krzyczkowska and Kozłowska [43], with slight modifications. Seed oil samples were diluted in ethyl acetate to a concentration of 150 mg/mL. An aliquot of 300 μL of the oil solution was mixed with 200 μL of methanol and 1 mL of a 0.1 mM DPPH methanolic solution. The mixtures were vortexed and incubated for 30 min at room temperature in the dark. The absorbance was then measured at 517 nm using a Shimadzu UV-VIS 2040PC Spectrophotometer (Shimadzu Corporation, Kyoto, Japan).
A Trolox calibration curve was prepared in the concentration range of 140–500 μM. The antioxidant activity was expressed as μmol of Trolox equivalents per 100 g of seed oil.

2.5. Statistical Analysis

Data are presented as mean ± standard deviation based on three analytical replicates for each sample. The homogeneity of variances was initially assessed using Levene’s test. Differences among samples were assessed using one-way analysis of variance, followed by Tukey’s post hoc test if significant differences were detected (p < 0.05). Statistical analyses were conducted using IBM SPSS Statistics (version 25) (IBM Corporation, New York, NY, USA).

3. Results

The chemical composition of Spanish sage seeds from several geographical locations in southeastern Spain was analyzed to assess their phytonutrient content and suggest potential applications. This includes the use of whole seeds, ground seeds, and seed products (such as oil and defatted flour or meal).

3.1. Proximate Composition

The analysis of the nutritional composition of the seeds (Table 2) revealed a high content of carbohydrates, followed by proteins, lipids, water, and ash. Significant differences were found in lipid, protein, and carbohydrate content by seed provenance.
The highest carbohydrate content was detected in populations 1 and 2 (60 ± 2.37 and 58.3 ± 2.48 g/100 g seeds, respectively), and the highest lipid content in populations 4 and 10 (20.4 ± 1.0 and 19.7 ± 1.12 g/100 g seeds, respectively), granting them the highest energy values (450.7 ± 4.85 and 448.4 ± 6.70 Kcal/100 g seeds), while the highest protein levels were detected in seeds from populations 6 and 7 (20.9 ± 1.3 and 20.5 ± 1.3 g/100 g).

3.2. Amino Acid Profile

The quantitative analysis of the amino acid (AA) content in defatted seed meal identified 16 AAs. Among these, histidine, threonine, methionine sulfone, valine, phenylalanine, isoleucine, leucine, and lysine are classified as essential amino acids (EAAs). The non-EAAs identified and quantified include aspartic acid, glutamic acid, serine, glycine, arginine, alanine, tyrosine, and proline (Table 3). Statistically significant differences were observed in the AA profile by seed provenance. The total AA content ranged from 9.1 to 15.2 g/100 g of seeds in populations 1 and 7, respectively. Within this range, the concentrations of EAAs varied from 3.8 g to 6.0 g and those of non-EAAs from 5.3 to 9.1 g per 100 g of seeds.
At the individual level, the predominant EAAs included leucine (0.7–1.1 g/100 g of seeds), followed by methionine (0.63–0.99 g/100 g) and phenylalanine (0.58–0.94 g/100 g). The most abundant non-EAAs quantified in the seeds were glutamic acid (1.56–3.01 g/100 g) and aspartic acid (1.0–1.8 g/100 g), along with alanine (0.9–1.6 g/100 g).

3.3. Seed Oil Composition

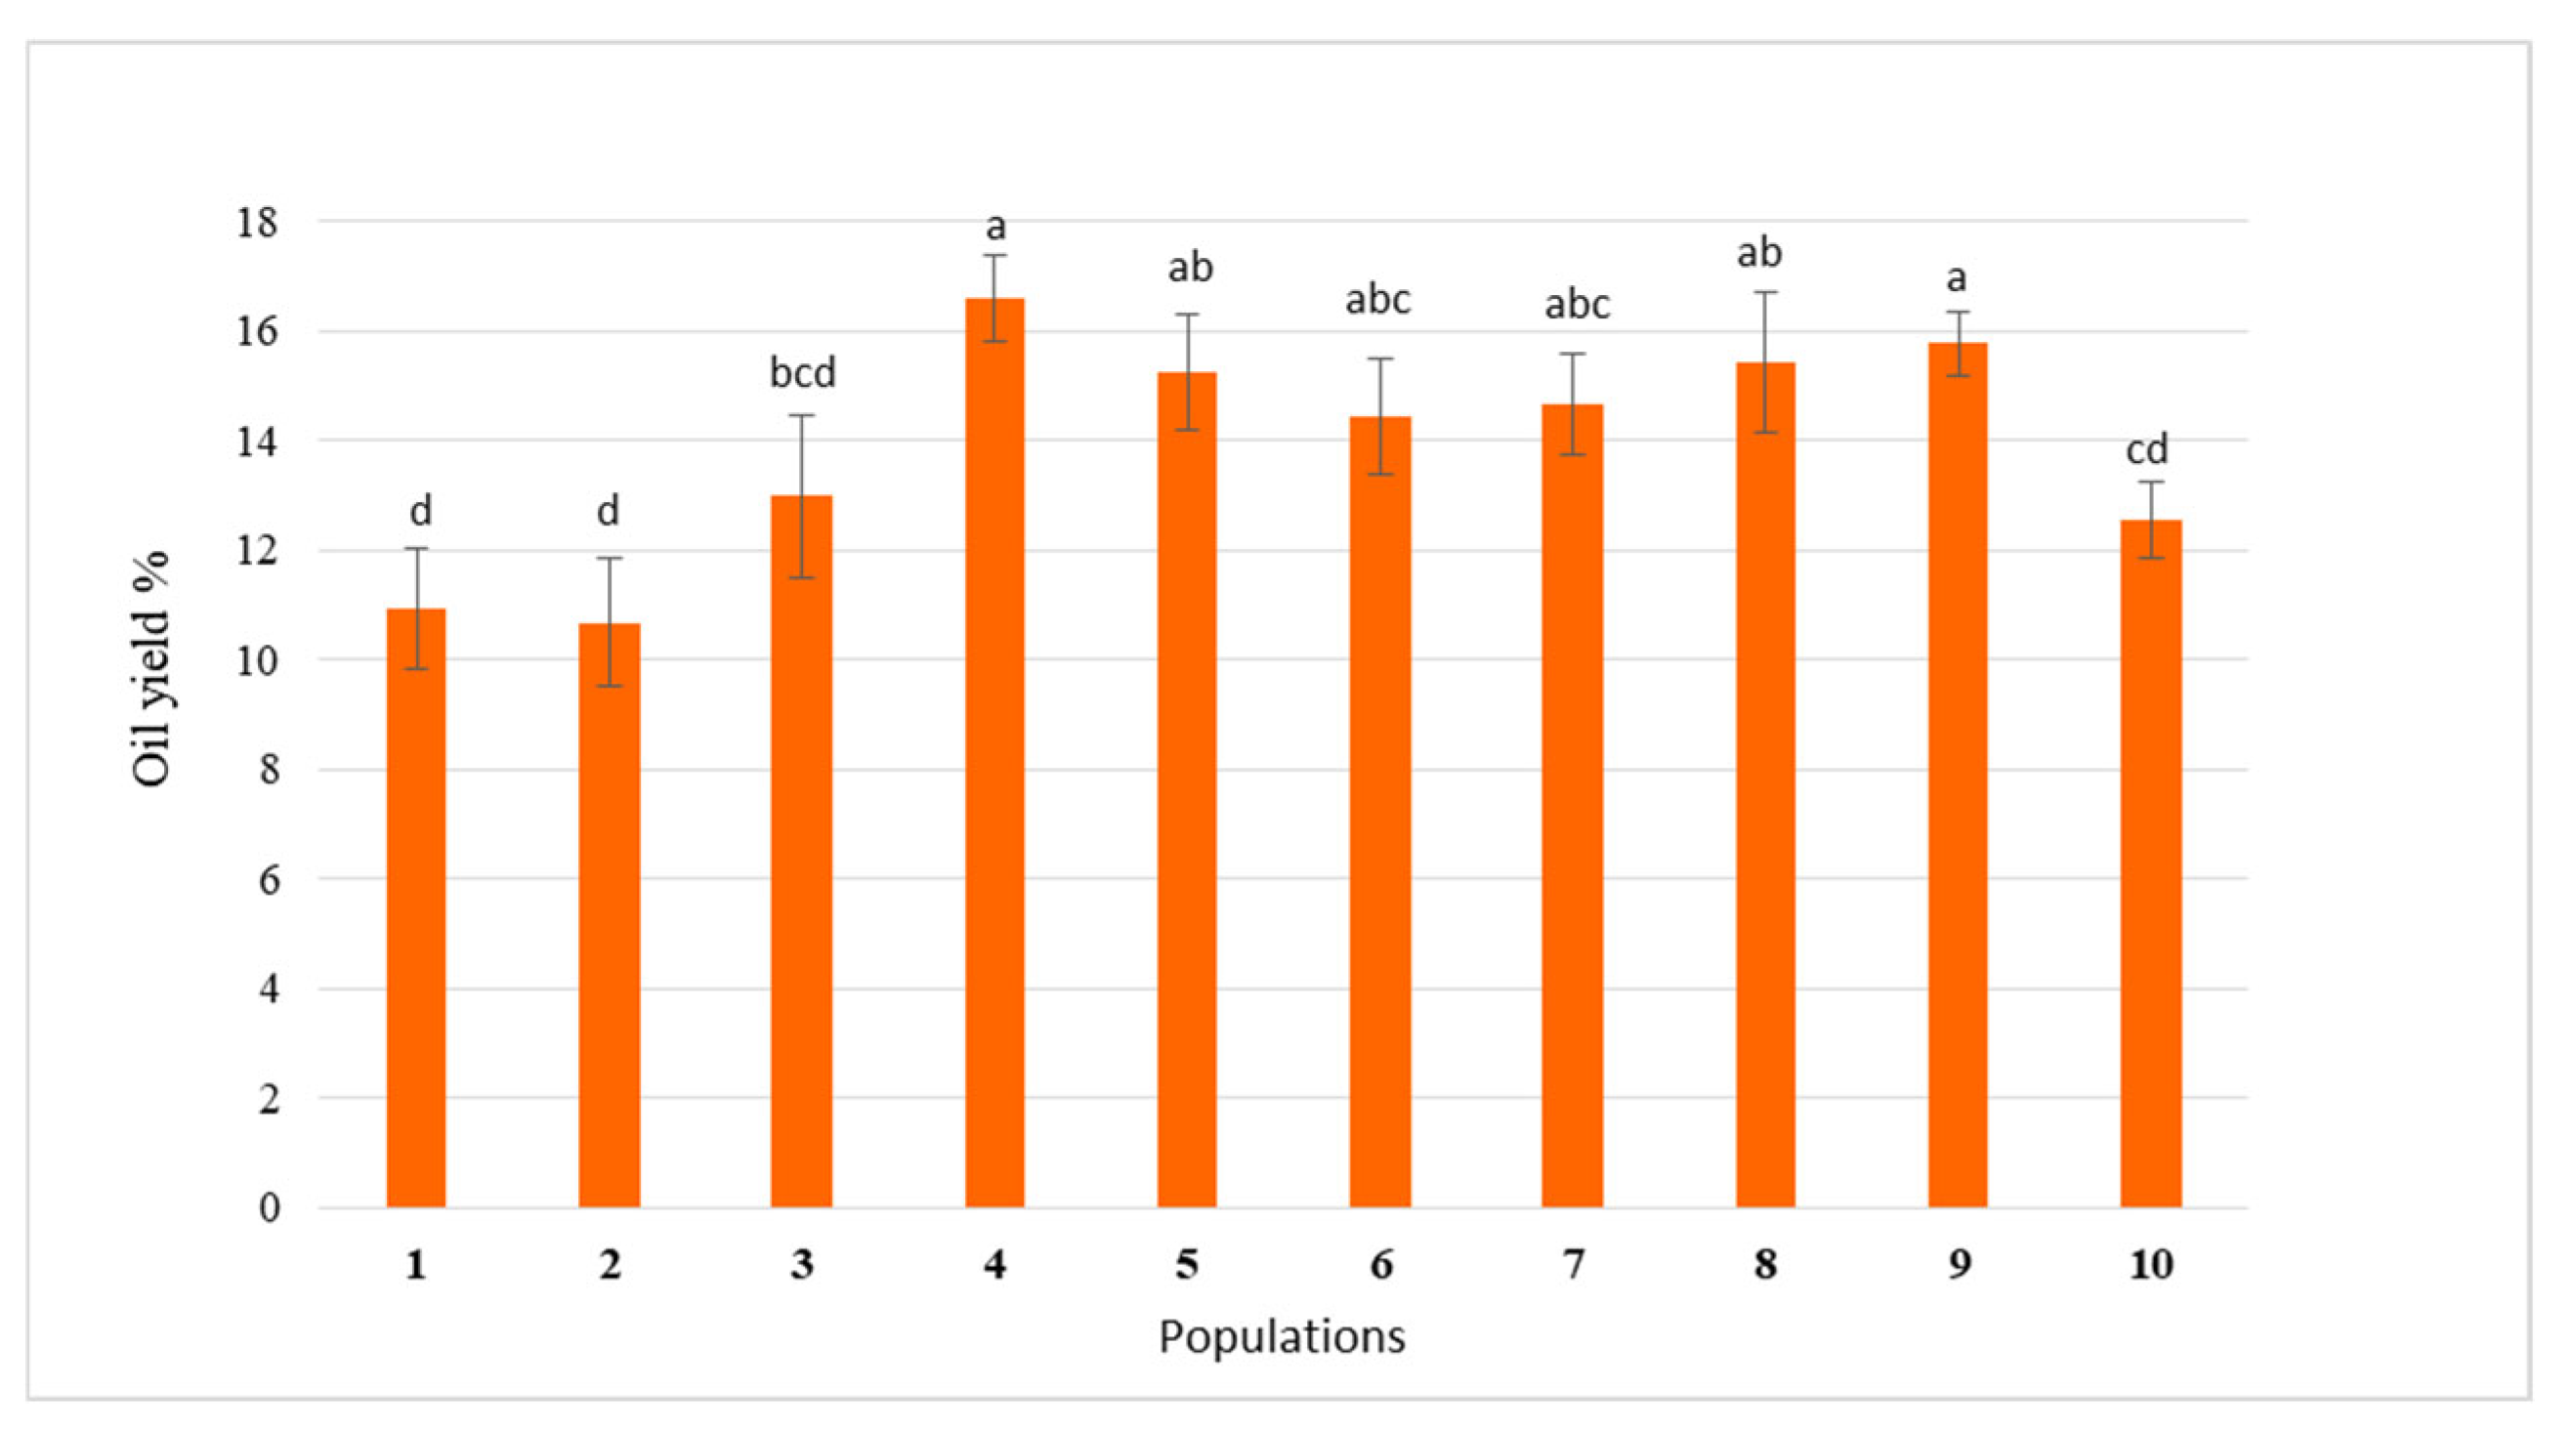
Oil yield varied significantly by seed provenance (Figure 1). On average, the yield was approximately 14%. Populations 2 and 4 exhibited the lowest and highest yields: 10.7 ± 1.17% and 16.7 ± 0.61%, respectively.

3.3.1. Fatty Acid Content

The chromatographic analysis of the seed oils identified 21 fatty acids, 5 of which were tentatively identified based on National Institute of Standards and Technology library spectra, as shown in Table 4. The total fatty acid content per 100 g of oil varied across the populations studied, from 73.5 g/100 g oil in population 10 to 88.9 g/100 g oil in population 3, with statistically significant differences between provenances.
The fatty acid profile of the seed oils is characterized by a high presence of ω6 polyunsaturated fatty acids (PUFAs), with concentrations ranging from 50.8 to 64.8 g/100 g oil. Following these, other major fatty acids include monounsaturated oleic acid (13.1–17.2 g/100 g oil) and stearic acid (1.2–1.8 g/100 g oil), along with the saturated fatty acid palmitic acid (4.8–9.1 g/100 g oil). The presence of ω3 PUFAs is minimal, with concentrations ranging from 0.6 to 0.8 g/100 g oil. Overall, the percentage of PUFAs is high, accounting for 65.69% to 74.68% of the total, while that of saturated fatty acids (SFAs) is relatively low, making up only 8.07% to 13.7%. This results in a favorable PUFA to SFA ratio of approximately 4.79 to 9.26, as well as a low SFA to unsaturated fatty acid (UFA) ratio of 0.02 to 0.03.

3.3.2. Tocochromanol Content

The tocopherol profile of the seed oils is shown in Table 5. The β- and γ-tocopherol forms could not be resolved with the ZORBAX SB-C18 reverse-phase column used for separating the tocopherol isomers investigated. However, the presence of β-tocopherol in seed oils of the Labiatae family has been reported to be negligible [39]. Consequently, the values reported in Table 5 correspond to the combined content of γ and β-tocopherol but can be interpreted primarily as representing γ-tocopherol.
As expected, tocopherols were the predominant class of tocochromanols in the seed oils analyzed, accounting for 73.3% to 90.5% of the total tocochromanol fraction. In contrast, tocotrienols were present only in small amounts, representing between 3.5% and 5.6% of the total fraction.
Total tocopherol content varied markedly among populations, ranging from 62.3 mg/100 g seed oil in population 1 to 89.2 mg/100 g seed oil in population 2. Overall, γ + β-tocopherol was the most abundant isomer, with concentrations spanning from 39.2 mg/100 g in population 1 to 63.8 mg/100 g in population 10, followed by δ-tocopherol, with levels ranging from 4.2 mg/100 g in population 4 to 11.1 mg/100 g in population 6. By contrast, α-tocopherol was detected at very low concentrations (0.02–4.3 mg/100 g seed oil) and was absent in two populations.
Within the tocotrienol fraction, γ-tocotrienol was the predominant isomer, with concentrations ranging from 1.4 mg/100 g seed oil in population 1 to 3.3 mg/100 g seed oil in population 6. Both α and β-tocotrienols, as well as plastochromanol-8 (PC-8), were present in minimal amounts across all samples analyzed. On the other hand, tocopherylquinone, an oxidation product of tocopherol isomers, was detected in all seed oil samples, with concentrations ranging from 3.3 mg/100 g seed oil in population 4 to 13.8 mg/100 g seed oil in population 1.

3.3.3. Polyphenolic Profile

The chromatographic analysis of the seed oil polyphenolic profile identified a total of 12 components (Figure S1), which can be categorized as follows: two hydroxybenzoic acids (protocatechuic acid and vanillic acid), one hydroxycinnamic acid derivative (caffeic acid), five hydroxy methoxyflavones (hispidulin, cirsiriol, cirsimaritin, cirsilineol, and salvigenin), and two hydroxyl flavones (apigenin and luteolin). Additionally, we detected glycosylated derivatives of apigenin, specifically 7-O-neohesperidoside and 7-glucoside.
However, a limitation in identifying the remaining phenolic compounds was the presence of chromatographic signals from minor, unknown compounds. The lack of commercial standards and discrepancies between their UV spectra and those of previously described phenolic compounds hindered their structural identification. Future studies employing complementary high-resolution mass spectrometry techniques, such as HPLC-DAD-ESI (Ion Trap)/MS and UPLC-ESI-QTOF/MS for qualitative analysis, would enable a more detailed characterization.
The data in Table 6 reveal pronounced variability in the total polyphenol content of the seed oils by sample origin. Among the populations analyzed, population 1 had the highest polyphenol concentration, reaching 148.3 ± 3.95 mg/100 g seed oil. In this population, apigenin was the dominant flavonoid (129.9 ± 2.9 mg/100 g seed oil), followed by cirsiliol (5.9 ± 0.29 mg/100 g seed oil).
Populations 2 and 3 also displayed relatively high polyphenol levels, with total contents of 76.8 ± 2.69 mg/100 g and 30.9 ± 1.52 mg/100 g seed oil, respectively. Apigenin and cirsiliol were the predominant polyphenols in population 2, whereas salvigenin was identified as the second most abundant polyphenol compound in population 3. In contrast, population 6 had the lowest polyphenol content, with a total concentration of only 7.5 ± 0.85 mg/100 g seed oil. Salvigenin was the most abundant flavonoid detected in this population (1.9 ± 0.29 mg/100 g seed oil). Overall, phenolic acids contributed minimally to the total polyphenolic profile of the Spanish seed oils analyzed, with individual concentrations generally remaining below 1.0 mg/100 g seed oil.

3.3.4. DPPH Scavenging Activity

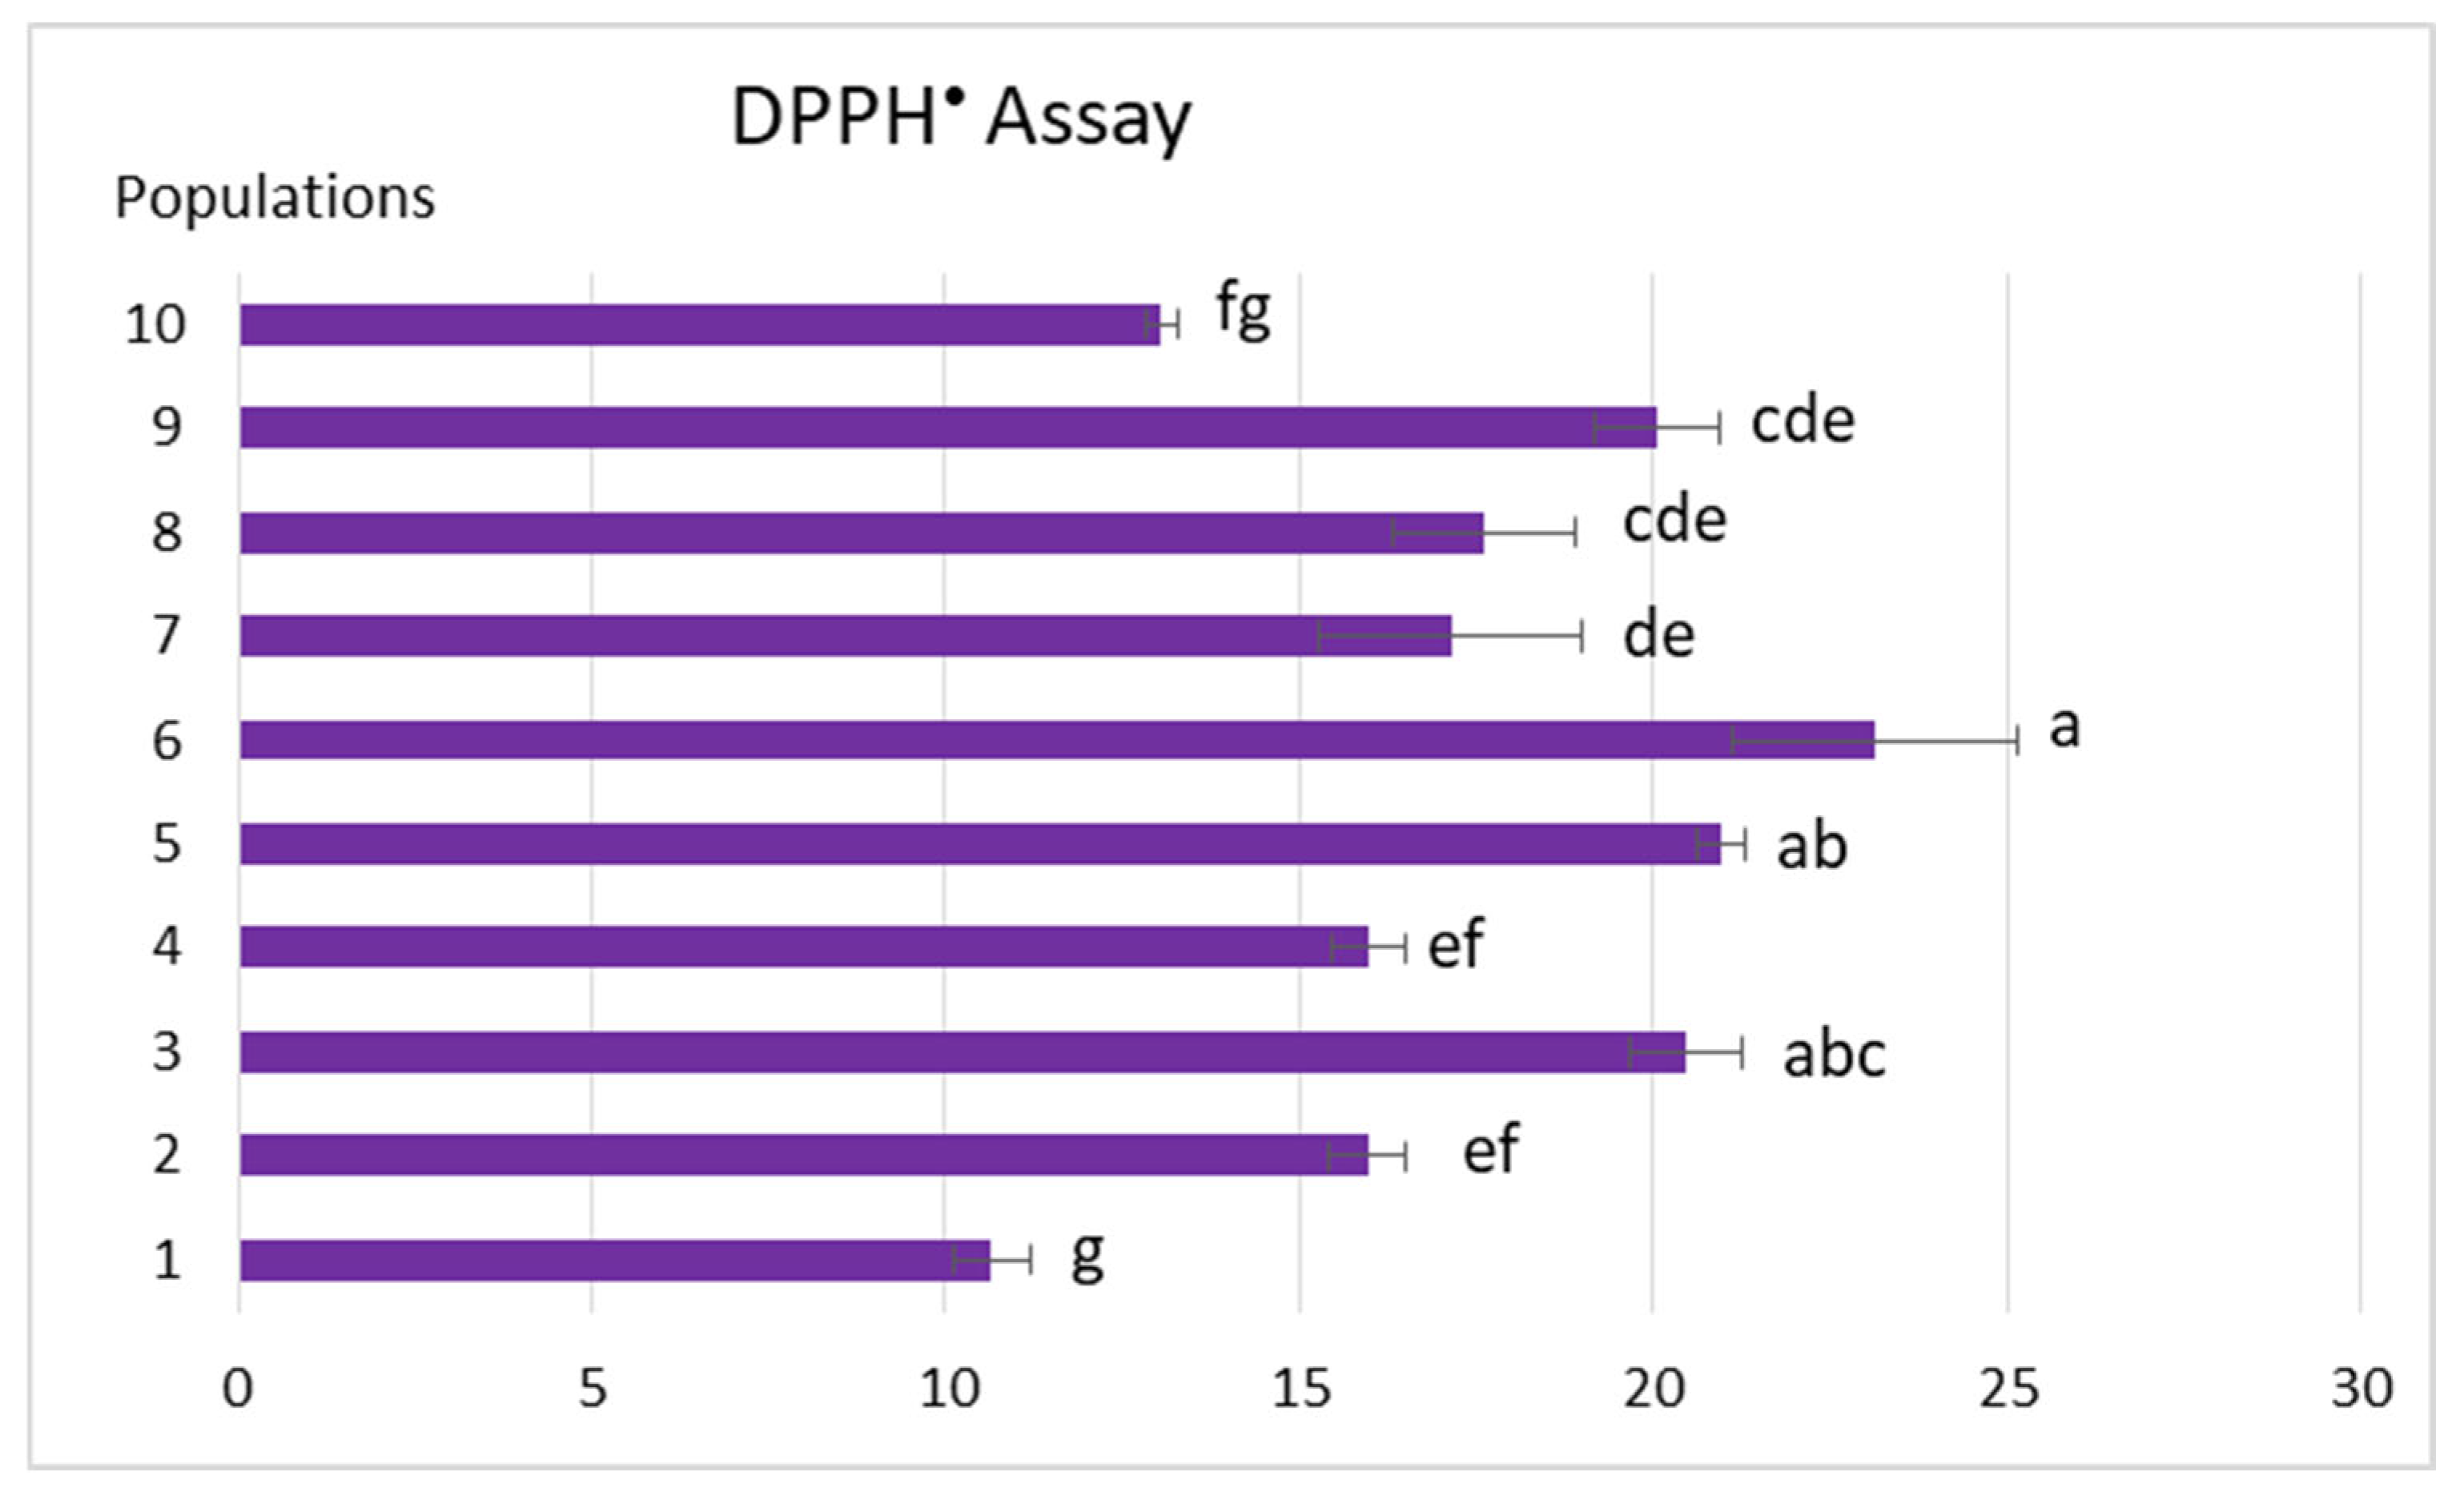
The scavenging activity against DPPH measured in the seed oils is illustrated in Figure 2. Population 6 exhibited the highest values, followed by populations 5, 3, and 9. In contrast, populations 1 and 10 showed the lowest antioxidant activity against this radical component.

4. Discussion

In addition to macronutrients and minerals, seeds are abundant in bioactive phytochemicals, such as polyphenols, lignans, phytosterols, tocopherols, and carotenoids, that contribute significantly to functional nutrition for disease prevention [44]. The European Food Safety Authority (EFSA) recognizes seeds as nutrient-dense foods that support human nutrition. At present, chia seeds are the main seed-based food ingredient specifically evaluated and included on the EU’s novel foods list issued by the EFSA [45]. The chemical composition of chia seeds differs by variety and region of cultivation [46]. These differences are linked to genetic and environmental factors, as well as their interactions, which influence nutrient uptake and how nutrients are distributed across proteins, oils, carbohydrates, and secondary metabolites [47].
To contribute to the body of knowledge in this emerging field, we studied the phytochemical composition of Spanish sage seeds from different natural populations in southeastern Spain. Generally, differences in the proximate composition of the seeds between samples do not seem to be just related to where the plants are grown. Only populations 1 and 2 had protein and lipid content that differed significantly from that of the other samples. Since these two populations displayed similar proximate compositions despite growing in different ombrotypes, the observed differences may reflect underlying genetic variation.
In accordance with the proximate composition of Spanish sage seeds, studies on seed proximate composition across different Salvia species have generally shown that they are moderately high in protein (16–27% dry weight), very high in fiber (17–28% dry weight), and rich in oils (7–38%), primarily PUFAs and phytosterols [48,49,50,51,52,53,54]. Our Spanish sage seeds also had a high carbohydrate content (over 50% in seeds from almost all origins). Across Salvia species, seeds have been found to contain substantial amounts of carbohydrates, primarily in the form of non-starch components. These carbohydrates are mainly composed of dietary fiber and complex polysaccharide gums, with a modest amount of free sugars. Chia (S. hispanica) seeds typically contain about one-third to two-fifths of their weight in carbohydrates, predominantly fiber [55]. Other Salvia seeds, such as those from S. miltiorrhiza and S. schimperi, as well as sage seed gums, are also rich in carbohydrates and structurally diverse polysaccharides [49,56].
Analyzing the AA profile is crucial for understanding nutritional quality. A balanced EAA profile enhances the biological value of protein [57]. In this regard, the essential-to-total AA ratio (as a percentage) in Spanish sage seeds ranged from 38.05 to 41.8%, reflecting the high quality of these proteins. The balance of EAAs can vary based on the calculation method and the specific fractions analyzed across different species. In chia seeds, Nitrayová et al. [57] found that EAAs accounted for approximately 38% of the total AA content in whole seed protein, while Wang et al. [58] reported that EAAs represent between 44.58% and 48.89% of the total AAs. Notably, the highest reported percentage of EAAs in the genus Salvia, around 59%, was found in S. miltiorrhiza [48].
In our Spanish sage, leucine, methionine sulfone, and phenylalanine were the main EAAs quantified. A high content of these EAAs is optimal for triggering muscle protein synthesis and supporting efficient protein metabolism [59]. Further, the seeds contained high concentrations of the following non-EAAs: glutamic acid, aspartic acid, and arginine. Overall, consistent with previous reports on the Salvia genus, particularly chia, Spanish sage seeds are rich in protein and provide a good balance of EAAs [58]. However, threonine, lysine, and leucine have been identified as limiting EAAs, similar to findings in S. hispanica.
From a nutritional perspective, it is also crucial to explore the physicochemical characteristics of Spanish sage seed oil. Seed oil content varies significantly across the Salvia genus, with reported yields ranging from approximately 2% to over 40%, depending on the species and environmental conditions [52,60,61]. The oil yields obtained for Spanish sage in the present study (11–17%, depending on the provenance) fall within this reported range. Based on the results obtained, these oils are potentially useful sources of essential fatty acids and fat-soluble vitamins such as tocochromanols, as well as polyphenolic components with high antioxidant power. The fatty acid composition of Spanish sage seed oil is similar to that of seed oils across the Salvia genus. That is, it is rich in PUFAs, especially linoleic acid (18:2), along with oleic acid (18:1), palmitic acid (16:0), and stearic acid (18:0) as main components. The most notable difference from the other Salvia species is the scarce presence of linolenic fatty acid [52,61,62]. Differences in fatty acid profile between species and even provenance can serve as chemotaxonomic markers, helping to distinguish species or populations within the genus [63].
PUFAs play a vital role in human health by helping to regulate lipid profiles. PUFA/SFA ratios are widely used to assess the impact of diet on cardiovascular health: the higher the ratio, the more positive the effect [38]. In addition, beyond serving as an energy source, PUFAs are crucial for maintaining cell membrane structure, regulating blood pressure and blood clotting, supporting immune function, and aiding the absorption of fat-soluble vitamins. They also influence the production of inflammatory and anti-inflammatory compounds and contribute to cardiovascular protection, making them important for overall health [64]. In relation to this, the Atherogenicity Index (AI) assesses the cardiovascular impact of seed oils by comparing pro-atherogenic saturated fatty acids with anti-atherogenic unsaturated fatty acids. The AI values differ between seed oils as a function of species, genotype, and environmental conditions [65]. In the studied populations of Spanish sage, all seed oils showed favorable AI values, indicating a healthy fatty acid profile. Notably, populations 2, 4, and 10 had the lowest AI value of 0.07, suggesting the greatest potential health benefits. This value is similar to those reported for chia, hemp, berry, and various other fruit seed oils, which range from 0.05 to 0.10 [65,66,67,68]. These results highlight Spanish sage seed oil as a potentially heart-healthy and nutritious edible oil.
Another parameter of interest is the Thrombogenicity Index (TI), a nutritional indicator that assesses the potential of oils and fats to promote thrombosis by evaluating the balance between pro-thrombogenic saturated fatty acids and anti-thrombogenic unsaturated fatty acids. In Spanish sage seed oil, the low TI values (<0.3) suggest a positive impact on cardiovascular health [65].
Fatty acid indices are essential for evaluating the quality of seed oils, but other minor bioactive compounds also have nutritional importance. Tocopherols and polyphenols, for instance, contribute to enhancing oxidative stability by scavenging free radicals, and they offer additional health benefits [69]. The tocochromanol content, which includes tocopherols and plastochromanol-8 (PC-8), varies with seed provenance. In all the studied populations, γ-tocopherol is the predominant form, a normal pattern in the seed oil composition across the Salvia genus, except for Salvia cilicica [70]. The levels of tocopherols and PC-8 in oilseeds are primarily influenced by genotype. Heritability studies indicate that genetic factors have a greater impact on these levels than environmental factors, though some homologues, such as δ-tocopherol, are more dependent on the environment [71]. Notably, oilseeds from population 6 contain significantly higher levels of this component than those from the other provenances studied.
From a regulatory standpoint, the EFSA classifies seed oils as foods that provide vitamin E and as raw materials used in the production of authorized food additives, specifically E306 to E309. However, their nutritional evaluation is based on α-tocopherol equivalents rather than total tocopherols [72]. Spanish sage seed oil has a high content of total tocopherols, comparable to that of other seed oils such as chia (13–74 mg/100 g of seed oil) [73], sunflower (55–75 mg/100 g) [74], and rapeseed (canola) oil (60–75 mg/100 g) [75]. The presence of γ-tocopherol as a main tocochromanol component gives this seed oil notable antioxidant and anti-inflammatory properties. This includes the ability to trap reactive nitrogen species and inhibit enzymes like cyclooxygenase and 5-lipoxygenase, which are involved in inflammation [76]. In this context, populations 2, 4, and 10 exhibited the highest levels of γ-tocopherol, with population 2 also having a relatively high concentration of polyphenolic components.
Additionally, flavonoids were the most abundant components identified, with the highest concentrations in populations 1, 2, and 3. These flavonoids have rarely been reported in seed oils, though apigenin and luteolin have been described in perilla seed oil [77]. Nonetheless, elevated levels of flavonoids did not correlate with high antioxidant activity, as other populations with lower levels of these compounds (3, 5, 6, and 9) showed the best radical scavenging activity among the seed oils analyzed. This antiradical activity may be associated with the high γ-tocopherol content, as observed in populations 6, 3, and 9.

5. Conclusions

Spanish sage seeds are currently considered by-products or waste. A greater understanding of their composition suggests that they could be upcycled into valuable ingredients, thereby reducing waste and supporting a circular, zero-waste agricultural system.
Specifically, after analyzing the chemical composition of seeds harvested from various populations across southeastern Spain, population 4 from a supramediterranean zone with a subhumid climate stands out from nutritional and health perspectives. This population has a proximate composition rich in proteins and lipids. It also features one of the best-balanced EAA profiles and a high oil yield. The fatty acid profile of its seeds indicates a low atherogenic potential (as measured by the AI), along with a high content of tocopherols. These findings demonstrate that Spanish sage seeds grown in supramediterranean subhumid climates provide enhanced nutritional and health benefits, similar to other commercial seeds recognized as novel foods. This supports their potential for future commercialization as a functional food. While the present findings highlight the promising nutritional potential of Spanish sage seeds, additional studies, including cytotoxicity and toxicological evaluations, could further support their future application in human nutrition.

Supplementary Materials

The following supporting information can be downloaded at: https://www.mdpi.com/article/10.3390/seeds5040044/s1.

Author Contributions

Conceptualization, M.Q. and M.J.J.; methodology, M.Q. and M.J.J.; software, M.Q., M.J.J. and G.J.C.-C.; validation, P.S.-G.; formal analysis, M.Q., M.J.J. and G.J.C.-C.; investigation, M.Q. and M.J.J.; resources, M.Q., P.S.-G. and M.J.J.; data curation, M.Q. and P.S.-G.; writing—original draft preparation, M.Q. and M.J.J.; writing—review and editing, M.Q., M.J.J., P.S.-G. and G.J.C.-C.; visualization, M.Q., M.J.J. and G.J.C.-C.; supervision, P.S.-G. and M.J.J.; project administration, M.J.J.; funding acquisition, M.J.J. All authors have read and agreed to the published version of the manuscript.

Funding

This work was supported by the Spanish National Institute for Agricultural and Food Research and Technology (INIA), through Project RTA2017-00031-C04-04, and by the European Regional Development Fund Regional Operational Programme for Murcia for 2023–2027, which financed 60% of an adaptation to and mitigation of climate change project under which this study was conducted.

Data Availability Statement

Data is contained within the article. The original contributions presented in this study are included in the article. Further inquiries can be directed to the corresponding author.

Acknowledgments

We thank Pascual Romero-Espinar for his assistance with seed collection for this research, María José Soler for her support in cleaning the seeds, and Inmaculada García for her help with extracting seed oils. All of these people work at the Department of Rural Development, Oenology, and Sustainable Agriculture, Murcia Institute of Agri-Food and Environmental Research (IMIDA).

Conflicts of Interest

The authors declare no conflicts of interest.

Abbreviations

The following abbreviations are used in this manuscript:
AAAmino acid
PUFApolyunsaturated fatty acid
SFAsaturated fatty acid
UFAunsaturated fatty acid
DPPH2,2-diphenyl-1-picrylhydrazyl
EFSAEuropean Food Safety Authority
EAAessential amino acid
AIatherogenicity Index
TIthrombogenicity index
PC-8plastochromanol-8
HPLChigh-performance liquid chromatography
MUFAmonounsaturated fatty acid
non-EAAsnon-essential amino acids

References

  1. Wei, Y.; Wang, Q.; Huang, Y. Species Diversity and Distribution of Salvia (Lamiaceae). Biodivers. Sci. 2015, 23, 3–10. [Google Scholar] [CrossRef] [Scilit]
  2. Imran, U.; Koçer, O.; Mohammed, F.S.; Lekesiz, Ö.; Doğan, M.; Şabik, A.E.; Sevindik, E.; Özbaş Gerçeker, F.; Sevindik, M. Pharmacological and Nutritional Properties: Genus Salvia. Adv. Pharmacol. Pharm. 2023, 11, 140–155. [Google Scholar] [CrossRef] [Scilit]
  3. Eraslan, E.C.; Uysal, I.; Mohammed, F.S.; Sevindik, M.; Akgül, H. Commonly Used Culinary Herbs and Their Properties in Gastronomy. In International Studies in Science and Mathematics; Serüven Publishing: Ankara, Turkey, 2023; pp. 235–247. [Google Scholar]
  4. Burlăcioiu, C.; Sorina, P.; Florin, T. Current State of Research on Biological, Ornamental and Utilitarian Particularities of Some Species of the Genus Salvia L. (Lamiaceae). Sci. Pap. Ser. B Hortic. 2024, 68, 585. [Google Scholar]
  5. Kintzios, S. The Folklore and Cosmetic Use of Various Salvia Species. In The Genus Salvia; Kintzios, S.E., Ed.; CRC Press: London, UK, 2000; pp. 1–28. [Google Scholar]
  6. Ghoran, S.H.; Taktaz, F.; Mozafari, A.A.; Saed-Moucheshi, A.; Hosseini, A. Sage Plants (Salvia Sp.; Lamiaceae) in the Middle East: Phytochemistry, Ethnopharmacology, and Traditional Use. In Ancient and Traditional Foods, Plants, Herbs and Spices Used in the Middle East; CRC Press: Boca Raton, FL, USA, 2023; pp. 263–277. [Google Scholar]
  7. Stefanaki, A.; van Andel, T. Mediterranean Aromatic Herbs and Their Culinary Use. In Aromatic Herbs in Food: Bioactive Compounds, Processing, and Applications; Elsevier: Amsterdam, The Netherlands, 2021; pp. 93–121. [Google Scholar] [CrossRef] [Scilit]
  8. Sánchez-Vioque, R.; Herraiz-Peñalver, D.; Melero Bravo, E.; Ortiz de Elguea-Culebras, G.; Herrero, B.; Santiago, Y.; Bueno, M.; Pérez-Magarino, S.; Asensio-Manzanera, M.C. Variability of the Essential Oil Composition of Cultivated Populations of Salvia lavandulifolia Vahl. Crop Sci. 2022, 62, 744–752. [Google Scholar] [CrossRef] [Scilit]
  9. Corell, M.; García, M.C.; Cermeño, P. Eficiencia en el uso del agua de dos especies del género Salvia. In Actas de Horticultura No. 52: Innovación y Futuro en la Jardinería, Proceedings of the I Simposio Iberoamericano–IV Jornadas Ibéricas de Horticultura Ornamental, Pontevedra, Spain, 14–18 October 2008; Sociedad Española de Ciencias Hortícolas: Pontevedra, Spain, 2008; pp. 295–299. [Google Scholar]
  10. Durán Zuazo, V.H.; Rodríguez Pleguezuelo, C.R.; Martín Peinado, F.J.; de Graaff, J.; Francia Martínez, J.R.; Flanagan, D.C. Environmental Impact of Introducing Plant Covers in the Taluses of Terraces: Implications for Mitigating Agricultural Soil Erosion and Runoff. Catena 2011, 84, 79–88. [Google Scholar] [CrossRef] [Scilit]
  11. Cáceres-Cevallos, G.J.; Quílez, M.; Ortiz de Elguea-Culebras, G.; Melero-Bravo, E.; Sánchez-Vioque, R.; Jordán, M.J. Agronomic Evaluation and Chemical Characterization of Salvia lavandulifolia Vahl. over 3 Consecutive Years Cultivated Under Harsh Climatic Conditions in Southeast Spain. Plants 2024, 13, 3022. [Google Scholar] [CrossRef] [Scilit] [PubMed]
  12. Ortiz de Elguea-Culebras, G.; Melero-Bravo, E.; Jordán, M.J.; Calvo-Martínez, A.; Caceres-Cevallos, G.; Quílez-Simón, M.; Sánchez-Vioque, R. Selection of Populations of Salvia lavandulifolia Vahl. Based on Crop Adaptations, Phenolic Chemotypes and Biological Capacities of the Distillation by-Products. Ind. Crops Prod. 2024, 213, 118337. [Google Scholar] [CrossRef] [Scilit]
  13. Cedeño-Pinos, C.; Martínez-Tomé, M.; Jordán, M.J.; Bañón, S. Revalorisation of Sage (Salvia lavandulifolia Vahl) By-Product Extracts as a Source of Polyphenol Antioxidants for Novel Jelly Candies. Antioxidants 2023, 12, 159. [Google Scholar] [CrossRef] [Scilit] [PubMed]
  14. Cedeño-Pinos, C.; Jiménez-Monreal, A.M.; Quílez, M.; Bañón, S. Polyphenol Extracts from Sage (Salvia lavandulifolia Vahl) By-Products as Natural Antioxidants for Pasteurised Chilled Yoghurt Sauce. Antioxidants 2023, 12, 364. [Google Scholar] [CrossRef] [Scilit] [PubMed]
  15. Jordán, M.J.; Martínez-Conesa, C.; Bañón, S.; Otal, J.; Quílez, M.; García-Aledo, I.; Romero-Espinar, P.; Sánchez-Gómez, P. The Combined Effect of Mediterranean Shrubland Pasture and the Dietary Administration of Sage By-Products on the Antioxidant Status of Segureña Ewes and Lambs. Antioxidants 2020, 9, 938. [Google Scholar] [CrossRef] [Scilit] [PubMed]
  16. Quílez, M.; Ferreres, F.; López-Miranda, S.; Salazar, E.; Jordán, M.J. Seed Oil from Mediterranean Aromatic and Medicinal Plants of the Lamiaceae Family as a Source of Bioactive Components with Nutritional. Antioxidants 2020, 9, 510. [Google Scholar] [CrossRef] [Scilit] [PubMed]
  17. European Parliament and Council. Directive 2008/98/EC of 19 November 2008 on Waste and Repealing Certain Directives. Off. J. Eur. Union 2008, L312, 3–30. [Google Scholar]
  18. European Commission. Communication from the Commission to the European Parliament, the Council, the European Economic and Social Committee and the Committee of the Regions: Roadmap to a Resource Efficient Europe; COM(2011) 571 Final; European Commission: Brussels, Belgium, 2011. [Google Scholar]
  19. Daliri, E.B.M.; Lee, B.H. New Perspectives on Probiotics in Health and Disease. Food Sci. Hum. Wellness 2015, 4, 56–65. [Google Scholar] [CrossRef] [Scilit]
  20. van Bussel, L.M.; Kuijsten, A.; Mars, M.; van ‘t Veer, P. Consumers’ Perceptions on Food-Related Sustainability: A Systematic Review. J. Clean. Prod. 2022, 341, 130904. [Google Scholar] [CrossRef] [Scilit]
  21. Niu, H.; Li, Z.; Zhang, C.; Li, M. Sustainable Food Systems under Environmental Footprints: The Delicate Balance from Farm to Table. Sci. Total Environ. 2024, 954, 176761. [Google Scholar] [CrossRef] [Scilit] [PubMed]
  22. Rabail, R.; Khan, M.R.; Mehwish, H.M.; Rajoka, M.S.R.; Lorenzo, J.M.; Kieliszek, M.; Khalid, A.R.; Shabbir, M.A.; Aadil, R.M. An Overview of Chia Seed (Salvia hispanica L.) Bioactive Peptides’ Derivation and Utilization as an Emerging Nutraceutical Food. Front. Biosci.-Landmark 2021, 26, 643–654. [Google Scholar] [CrossRef] [Scilit] [PubMed]
  23. Ismail, F.; Ismail, W.U.; Muhammad, G.; Hussain, M.A.; Zulfiqar, Z. Phytochemistry, Pharmacological Attributes, and Clinical Evaluations of Coriandrum Sativum: A Comprehensive Review. Nat. Prod. Commun. 2025, 20, 1934578X241312791. [Google Scholar] [CrossRef] [Scilit]
  24. Talwar, B.; Chopra, R.; Kumra Taneja, N.; Chand, M.; Homroy, S.; Dhiman, A.; Kumari Singh, P.; Chaudhary, S. Use of Flaxseed Cake as a Source of Nutrients in the Food Industry and Possible Health Benefits—A Review. Food Prod. Process. Nutr. 2025, 7, 22. [Google Scholar] [CrossRef] [Scilit]
  25. Lu, Y.; Li, W.; Yu, N.; Nie, X.; Ye, Q.; Meng, X. The Effects of Extraction Methods on the Active Ingredients and Antioxidant Activities of Sesamum indicum L. Oils. J. Food Sci. 2025, 90, e70166. [Google Scholar] [CrossRef] [Scilit] [PubMed]
  26. Wang, W.; Jin, J.; Xu, H.; Shi, Y.; Boersch, M.; Yin, Y. Comparative Analysis of the Main Medicinal Substances and Applications of Echium vulgare L. and Echium plantagineum L.: A Review. J. Ethnopharmacol. 2022, 285, 114894. [Google Scholar] [CrossRef] [Scilit] [PubMed]
  27. Saidaiah, P.; Banu, Z.; Khan, A.A.; Geetha, A.; Somraj, B. A Comprehensive Review of Omega-3 Fatty Acids: Sources, Industrial Applications, and Health Benefits. Ann. Phytomed. Int. J. 2024, 13, 209–225. [Google Scholar] [CrossRef] [Scilit]
  28. Nohutcu, L.; Tuncturk, M.; Tuncturk, R.; Selem, E. Investigation of Nutrient Element Content, Physicochemical and Biochemical Properties of Evening Primrose (Oenothera biennis L.). OKU J. J. Inst. Sci. Technol. 2024, 7, 2181–2189. [Google Scholar] [CrossRef] [Scilit]
  29. Butnariu, M.; Quispe, C.; Herrera-Bravo, J.; Pentea, M.; Sarac, I.; Küşümler, A.S.; Özçelik, B.; Painuli, S.; Semwal, P.; Imran, M.; et al. Papaver Plants: Current Insights on Phytochemical and Nutritional Composition Along with Biotechnological Applications. Oxid. Med. Cell. Longev. 2022, 2022, 2041769. [Google Scholar] [CrossRef] [Scilit] [PubMed]
  30. Herraiz-Peñalver, D.; Asensio-S Manzanera, M.C.; Herrero, B.; Martin, H.; Santiago, Y.; Zalacaín, A.; Berruga, M.I.; Sánchez-Vioque, R. Evaluation of the Morphological Variability in Iberian Salvia lavandulifolia Vahl Accessions. Genet. Resour. Crop Evol. 2017, 64, 1797–1806. [Google Scholar] [CrossRef] [Scilit]
  31. Rivas-Martínez, S. Nociones Sobre Fitosociología, Biogeografía y Bioclimatología. In La vegetación de España; Alcaraz Ariza, F., Peinado, M., Rivas-Martínez, S., Eds.; Universidad de Alcalá de Henares: Madrid, Spain, 1987. [Google Scholar]
  32. AOAC International. Official Methods of Analysis of AOAC International, 19th ed.; AOAC International: Gaithersburg, MD, USA, 2012. [Google Scholar]
  33. AOAC International. Official Methods of Analysis of AOAC International, 20th ed.; AOAC International: Gaithersburg, MD, USA, 2016. [Google Scholar]
  34. Merrill, A.L.; Watt, B.K. Energy Value of Foods: Basis and Derivation; U.S. Department of Agriculture: Washington, DC, USA, 1955.
  35. AOAC International. Official Method 994.12: Amino Acids in Feeds—Performic Acid Oxidation with Acid Hydrolysis–Sodium Metabisulfite Method. In Official Methods of Analysis of AOAC International; AOAC International: Rockville, MD, USA, 2023. [Google Scholar]
  36. Slobodianiuk, L.; Budniak, L.; Marchyshyn, S.; Basaraba, R. Determination of Amino Acids and Sugars Content in Antennaria Dioica Gaertn. Int. J. Appl. Pharm. 2019, 11, 39–43. [Google Scholar] [CrossRef] [Scilit]
  37. ISO 12966-2:2017; Aceites y Grasas de Origen Animal y Vegetal. Cromatografía de Gases de Ésteres Metílicos de Ácidos Grasos. Parte 2: Preparación de Ésteres Metílicos de Ácidos Grasos. ISO UNE-EN: Madrid, Spain, 2017.
  38. Chen, J.; Liu, H. Nutritional Indices for Assessing Fatty Acids: A Mini-Review. Int. J. Mol. Sci. 2020, 21, 5695. [Google Scholar] [CrossRef] [Scilit] [PubMed]
  39. Gruszka, J.; Kruk, J. RP-LC for Determination of Plastochromanol, Tocotrienols and Tocopherols in Plant Oils. Chromatographia 2007, 66, 909–913. [Google Scholar] [CrossRef] [Scilit]
  40. Górnás, P.; Baškirovs, G.; Siger, A. Free and Esterified Tocopherols, Tocotrienols and Other Extractable and Non-Extractable Tocochromanol-Related Molecules: Compendium of Knowledge, Future Perspectives and Recommendations for Chromatographic Techniques, Tools, and Approaches Used for Tococh. Molecules 2022, 27, 6560. [Google Scholar] [CrossRef] [Scilit] [PubMed]
  41. Ciftci, O.N.; Przybylski, R.; Rudzinska, M. Lipid Components of Flax, Perilla, and Chia Seeds. Eur. J. Lipid Sci. Technol. 2012, 114, 794–800. [Google Scholar] [CrossRef] [Scilit]
  42. Jordán, M.J.; Martínez, R.M.; Martínez, C.; Moñino, I.; Sotomayor, J.A. Polyphenolic Extract and Essential Oil Quality of Thymus Zygis Ssp. Gracilis Shrubs Cultivated under Different Watering Levels. Ind. Crops Prod. 2009, 29, 145–153. [Google Scholar] [CrossRef] [Scilit]
  43. Krzyczkowska, J.; Kozłowska, M. Effect of Oils Extracted from Plant Seeds on the Growth and Lipolytic Activity of Yarrowia Lipolytica Yeast. J. Am. Oil Chem. Soc. 2017, 94, 661–671. [Google Scholar] [CrossRef] [Scilit] [PubMed]
  44. Alasalvar, C.; Chang, S.K.; Boillng, B.; Oh, W.Y.; Shahidi, F. Specialty Seeds: Nutrients, Bioactives, Bioavailability, and Health Benefits: A Comprehensive Review. Compr. Rev. Food Sci. Food Saf. 2021, 20, 2382–2427. [Google Scholar] [CrossRef] [Scilit] [PubMed]
  45. Turck, D.; Castenmiller, J.; de Henauw, S.; Hirsch-Ernst, K.I.; Kearney, J.; Maciuk, A.; Mangelsdorf, I.; McArdle, H.J.; Naska, A.; Pelaez, C.; et al. Safety of Chia Seeds (Salvia hispanica L.) as a Novel Food for Extended Uses Pursuant to Regulation (EU) 2015/2283. EFSA J. 2019, 17, e05657. [Google Scholar] [CrossRef] [Scilit] [PubMed]
  46. Kulczyński, B.; Kobus-Cisowska, J.; Taczanowski, M.; Kmiecik, D.; Gramza-Michałowska, A. The Chemical Composition and Nutritional Value of Chia Seeds—Current State of Knowledge. Nutrients 2019, 11, 1242. [Google Scholar] [CrossRef] [Scilit] [PubMed]
  47. Imran, M.; Lee, S.-G.; Park, S.-Y.; Park, H.-M.; Kim, E.-H.; Oh, S.-W.; Jung, J.-W.; Choi, H.; Oh, T.-Y.; Go, Y.-S.; et al. Influence of Environmental Factors and Genotype on Natural Variation in the Chemical Composition of Maize Seeds. Sustainability 2024, 16, 10451. [Google Scholar] [CrossRef] [Scilit]
  48. Deng, R.; Ren, X.; Liu, D.; Lu, Z.; Liu, P. An Evaluation of the Edible Value of Salvia miltiorrhiza Seeds: Proximate Composition, Phytochemical Components and Antioxidant Activity. Molecules 2024, 29, 1483. [Google Scholar] [CrossRef] [Scilit] [PubMed]
  49. Belay, Y.; Azene, M.; Abebe, Z.; Habtamu, A.; Iweriebor, B.C.; Mkolo, N.M.; Shibeshi, W.; Assefa, S.; Ayelign, A. Nutritional, Anti-Nutritional, Physicochemical and Functional Properties of Raw and Roasted Salvia schimperi (Lamiaceae) Seeds: Ethiopian Indigenous Plant. Heliyon 2025, 11, e43408. [Google Scholar] [CrossRef] [Scilit]
  50. Yousefi, M.; Nazeri, V.; Moayedi, A.; Mirza, M. The First Report on Seed Chemical Compositions of Salvia leriifolia Benth. Anal. Chem. Lett. 2012, 2, 56–62. [Google Scholar] [CrossRef] [Scilit]
  51. Mohammed, O.B.R.; Bekhet, M.H.H.; Abd El-Razek, A.M.; Moharram, Y.G. Evaluation of Chia (Salvia hispanica L.) Seeds Meal as a Source of Bioactive Ingredients. Alex. Sci. Exch. J. 2019, 40, 177–189. [Google Scholar] [CrossRef] [Scilit]
  52. Moazzami Farida, S.H.; Radjabian, T.; Ranjbar, M.; Salami, S.A.; Rahmani, N.; Ghorbani, A. Fatty Acid Patterns of Seeds of Some Salvia Species from Iran—A Chemotaxonomic Approach. Chem. Biodivers. 2016, 13, 451–458. [Google Scholar] [CrossRef] [Scilit] [PubMed]
  53. Živković, J.; Ristić, M.; Kschonsek, J.; Westphal, A.; Mihailović, M.; Filipović, V.; Böhm, V. Comparison of Chemical Profile and Antioxidant Capacity of Seeds and Oils from Salvia sclarea and Salvia officinalis. Chem. Biodivers. 2017, 14, e1700344. [Google Scholar] [CrossRef] [Scilit] [PubMed]
  54. Karadeniz-Pekgöz, A.; Cesur Turgut, A.; Çinbilgel, İ.; Yavuz, O. Phytochemical Contents and Bioactivity of Four Endemic Salvia Seeds from Turkey: A Comparative Study to Chia Seed. J. Food Meas. Charact. 2024, 18, 5638–5645. [Google Scholar] [CrossRef] [Scilit]
  55. Muñoz, L.A.; Vera, C.N.; Zúñiga-López, M.C.; Moncada, M.; Haros, C.M. Physicochemical and Functional Properties of Soluble Fiber Extracted from Two Phenotypes of Chia (Salvia hispanica L.) Seeds. J. Food Compos. Anal. 2021, 104, 104138. [Google Scholar] [CrossRef] [Scilit]
  56. Yang, K.; Liu, Y.-J.; Zhang, J.-N.; Chen, Y.-J.; Yang, J.; Xiao, J.-P.; Lin, H.-B.; Yang, H.-J. Advances in the Structural Characterization and Pharmacological Activity of Salvia miltiorrhiza Polysaccharides. Front. Chem. 2025, 13, 1492533. [Google Scholar] [CrossRef] [Scilit] [PubMed]
  57. Nitrayová, S.; Brestenský, M.; Heger, J.; Patráš, P.; Rafay, J.; Sirotkin, A. Amino Acids and Fatty Acids Profile of Chia (Salvia hispanica L.) and Flax (Linum usitatissimum L.) Seed. Potravinarstvo 2014, 8, 72–76. [Google Scholar] [CrossRef] [Scilit] [PubMed]
  58. Wang, Y.; Sánchez-Velázquez, O.A.; Martínez-Villaluenga, C.; Goycoolea, F.M.; Hernández-Álvarez, A.J. Effect of Protein Extraction and Fractionation of Chia Seeds Grown in Different Locations: Nutritional, Antinutritional and Protein Quality Assessment. Food Biosci. 2023, 56, 103238. [Google Scholar] [CrossRef] [Scilit]
  59. Gorissen, S.H.M.; Crombag, J.J.R.; Senden, J.M.G.; Waterval, W.A.H.; Bierau, J.; Verdijk, L.B.; van Loon, L.J.C. Protein Content and Amino Acid Composition of Commercially Available Plant-Based Protein Isolates. Amino Acids 2018, 50, 1685–1695. [Google Scholar] [CrossRef] [Scilit] [PubMed]
  60. Moazzami Farida, S.H.; Radjabian, T. Phytosterols in Salvia Seeds: Content and Composition and Correlation with Environmental Parameters. Iran. J. Sci. Technol. Trans. Sci. 2019, 43, 2129–2140. [Google Scholar] [CrossRef] [Scilit]
  61. Azcan, N.; Ertan, A.; Demirci, B.; Baser, K.H.C. Fatty Acid Composition of Seed Oils of Twelve Salvia Species Growing in Turkey. Chem. Nat. Compd. 2004, 40, 218–221. [Google Scholar] [CrossRef] [Scilit]
  62. Kara, Y.; Koçak, A.; Çitil, O.B.; Tulukcu, E. A Comparative Study of the Fatty Acid Composition and Lipid Content of Salvia sclarea. Chem. Nat. Compd. 2010, 46, 612–614. [Google Scholar] [CrossRef] [Scilit]
  63. Gören, A.C.; Kiliç, T.; Dirmenci, T.; Bilsel, G. Chemotaxonomic Evaluation of Turkish Species of Salvia: Fatty Acid Compositions of Seed Oils. Biochem. Syst. Ecol. 2006, 34, 160–164. [Google Scholar] [CrossRef] [Scilit]
  64. Mititelu, M.; Lupuliasa, D.; Neacșu, S.M.; Olteanu, G.; Busnatu, Ș.S.; Mihai, A.; Popovici, V.; Măru, N.; Boroghină, S.C.; Mihai, S.; et al. Polyunsaturated Fatty Acids and Human Health: A Key to Modern Nutritional Balance in Association with Polyphenolic Compounds from Food Sources. Foods 2024, 14, 46. [Google Scholar] [CrossRef] [Scilit] [PubMed]
  65. Khalili Tilami, S.; Kourimská, L. Assessment of the Nutritional Quality of Plant Lipids Using Atherogenicity and Thrombogenicity Indices. Nutrients 2022, 14, 3795. [Google Scholar] [CrossRef] [Scilit] [PubMed]
  66. Velicki, R.; Fuentes, J.B.; Bijelic, K.; Hitl, M.; Kladar, N.; Torovic, L. Fatty Acid Nutritional Indices of Hemp Seed Oil. Proceedings 2024, 91, 124. [Google Scholar] [CrossRef] [Scilit]
  67. Rigano, F.; Vento, F.; Cafarella, C.; Trovato, E.; Trozzi, A.; Dugo, P.; Mondello, L. Determination of Main Lipids and Volatile Compounds in Unconventional Cold-Pressed Seed Oils through Chromatographic Techniques. J. Food Sci. 2025, 90, e17661. [Google Scholar] [CrossRef] [Scilit] [PubMed]
  68. Górska, A.; Piasecka, I.; Wirkowska-Wojdyła, M.; Brys, J.; Kienc, K.; Brzezinska, R.; Ostrowska-Ligeza, E. Berry Seeds—A By-Product of the Fruit Industry as a Source of Oils with Beneficial Nutritional Characteristics. Appl. Sci. 2023, 13, 5114. [Google Scholar] [CrossRef] [Scilit]
  69. Pointner, T.; Rauh, K.; Auñon-Lopez, A.; Kostadinović Veličkovska, S.; Mitrev, S.; Arsov, E.; Pignitter, M. Comprehensive Analysis of Oxidative Stability and Nutritional Values of Germinated Linseed and Sunflower Seed Oil. Food Chem. 2024, 454, 139790. [Google Scholar] [CrossRef] [Scilit] [PubMed]
  70. Bagci, E.; Vural, M.; Dirmenci, T.; Bruehl, L.; Aitzetmüller, K. Fatty Acid and Tocochromanol Patterns of Some Salvia L. Species. Z. Naturforsch. C. J. Biosci. 2004, 59, 305–309. [Google Scholar] [CrossRef] [Scilit] [PubMed]
  71. Siger, A.; Michalak, M.; Lembicz, J.; Nogala-Kałucka, M.; Cegielska-Taras, T.; Szała, L. Genotype × Environment Interaction on Tocochromanol and Plastochromanol-8 Content in Seeds of Doubled Haploids Obtained from F1 Hybrid Black × Yellow Seeds of Winter Oilseed Rape (Brassica napus L.). J. Sci. Food Agric. 2018, 98, 3263–3270. [Google Scholar] [CrossRef] [Scilit] [PubMed]
  72. World Health Organization; Food and Agriculture Organization of the United Nations. Vitamin E. In Vitamin and Mineral Requirements in Human Nutrition; WHO, Ed.; World Health Organization: Geneva, Switzerland, 2004. [Google Scholar]
  73. Abad, A.; Shahidi, F. Compositional Characteristics and Oxidative Stability of Chia Seed Oil (Salvia hispanica L). Food Prod. Process. Nutr. 2020, 2, 9. [Google Scholar] [CrossRef] [Scilit]
  74. CODEX STAN 210-1999; Codex Alimentarius Commission Standard for Named Vegetable Oils. FAO: Rome, Italy; WHO: Rome, Italy, 2019.
  75. Gunstone, F.D. (Ed.) Vegetable Oils in Food Technology: Composition, Properties and Uses, 2nd ed.; Wiley-Blackwell: Chichester, UK, 2011. [Google Scholar]
  76. Es-Sai, B.; Wahnou, H.; Benayad, S.; Rabbaa, S.; Laaziouez, Y.; El Kebbaj, R.; Limami, Y.; Duval, R.E. Gamma-Tocopherol: A Comprehensive Review of Its Antioxidant, Anti-Inflammatory, and Anticancer Properties. Molecules 2025, 30, 653. [Google Scholar] [CrossRef] [Scilit] [PubMed]
  77. Guan, L.; Zhu, L.; Zhang, X.; Han, Y.; Wang, K.; Ji, N.; Yao, X.; Zhou, Y.; Li, B.; Chen, Q.; et al. Perilla Seed Oil and Protein: Composition, Health Benefits, and Potential Applications in Functional Foods. Molecules 2024, 29, 5258. [Google Scholar] [CrossRef] [Scilit] [PubMed]
Figure 1. Oil yield of Salvia lavandulifolia Vahl. seeds. Different letters indicate significant differences between values, at p < 0.05 according to the Tukey test.
Seeds 05 00044 g001
Figure 2. Radical scavenging activity measured by a DPPH assay of Salvia lavandulifolia seed oils. Different letters indicate significant differences between values, at p < 0.05 according to the Tukey test.
Seeds 05 00044 g002
Table 1. Termotype, geographical ombrotype and lithosol data of the locations in the southeast Iberian Peninsula of Salvia lavandulifolia Vahl. populations.
PopulationProvinceAltitude
(masl)
TermotypeOmbrotypeLatitudeLongitudeSoil *
1. Sierra de BíarAlicante980MesomediterraneanDry38.628811 N0.727065 WCalcareous
2. Sierra de Aitana1159MesomediterraneanSubhumid38.658310 N0.321578 WCalcareous
3. RobledoAlbacete1001MesomediterraneanDry38.774054 N2.452964 WCalcareous
4. Sierra de Alcaraz1222SupramediterraneanSubhumid38.542243 N2.615465 WCalcareous–dolomitic
5. Sierra Espuña 1Murcia1406SupramediterraneanDry37.861802 N1.611155 WCalcareous–dolomitic
6. Sierra Espuña 21486SupramediterraneanDry37.863007 N1.603776 WCalcareous
7. Sierra del Cambrón1501SupramediterraneanDry37.919992 N1.699775 WDecalcification clay
8. Zaén1340SupramediterraneanDry38.238281 N2.096162 WCalcareous–dolomitic
9. Sierra de Rematalejo1134MesomediterraneanDry37.891862 N2.091068 WCalcareous
10. La Rogativa1115MesomediterraneanDry38.149020 N2.228226 WCalcareous
* Predominantly lithosols.
Table 2. Proximate composition of Salvia lavandulifolia Vahl. seeds by population (g/100 g dry seeds).
PopulationLipidsTotal ProteinMoistureAshCarbohydratesEnergy (Kcal.)
113.4 ± 1.34 c13.4 ± 1.35 c7.4 ± 0.06 bc5.7 ± 0.06 a60.0 ± 2.37 a414.3 ± 6.46 cd
213.1 ± 1.45 c14.8 ± 0.96 bc8.1 ± 0.06 a5.6 ± 0.1 a58.3 ± 2.48 ab410.6 ± 6.86 d
315.9 ± 1.85 bc18.5 ± 1.37 ab7.2 ± 0.06 c5.7 ± 0.7 a52.7 ± 3.00 bc428.1 ± 8.95 bc
420.4 ± 1.00 a18.9 ± 0.36 a7.3 ± 0.06 bc5.5 ± 0.12 ab48.0 ± 1.21 c450.7 ± 4.85 a
518.7 ± 1.29 ab17.9 ± 1.32 ab7.4 ± 0.12 bc5.6 ± 0.06 a50.3 ± 2.62 c441.5 ± 6.70 ab
617.8 ± 1.22 bc20.9 ± 1.30 a7.6 ± 3.85 b5.7 ± 0.04 a47.9 ± 1.53 c435.8 ± 6.12 ab
717.9 ± 1.28 bc20.5 ± 2.40 a7.5 ± 0.06 bc5.6 ± 0.05 a48.1 ± 3.25 c437.1 ± 6.18 ab
818.9 ± 0.58 bc18.9 ± 1.3 a7.5 ± 0.08 bc5.2 ± 0.17 bc49.5 ± 1.61 c443.5 ± 3.26 ab
917.9 ± 1.86 ab19.1 ± 1.39 a7.5 ± 0.19 bc4.9 ± 0.15 d50.7 ± 2.66 c440.3 ± 9.08 ab
1019.7 ± 1.12 a18.1 ± 1.65 ab7.5 ± 0.30 bc5.1 ± 0.31 dc49.7 ± 2.70 c448.4 ± 6.70 a
Results are expressed as means (n = 5) ± standard deviation. The different lowercase letters (a–d) in the same column indicate a significant difference in value (p < 0.05 by Tukey’s test).
Table 3. Amino acid content in the Salvia lavandulifolia Vahl. seeds by population (g/100 g of seed).
Population
Amino Acid12345678910
Histidine0.2 ± 0.02 c0.2 ± 0.05 c0.3 ± 0.01 abc0.3 ± 0.05 abc0.4 ± 0.01 bc0.4 ± 0.03 a0.4 ± 0.04 a0.3 ± 0.03 abc0.3 ± 0.07 bc0.3 ± 0.04 abc
Threonine0.4 ± 0.01 b0.4 ± 0.02 b0.5 ± 0.01 ab0.5 ± 0.04 ab0.5 ± 0.01 ab0.5 ± 0.03 ab0.6 ± 0.04 a0.5 ± 0.04 ab0.4 ± 0.14 ab0.5 ± 0.05 ab
Methionine sulfone 0.6 ± 0.02 d0.6 ± 0.03 d0.8 ± 0.03 bc0.9 ± 0.07 ab0.8 ± 0.02 c0.9 ± 0.06 abc1.0 ± 0.09 a0.6 ± 0.05 d0.6 ± 0.05 d0.6 ± 0.08 d
Valine0.5 ± 0.02 c0.5 ± 0.03 c0.7 ± 0.02 ab0.7 ± 0.06 b0.7 ± 0.01 b0.7 ± 0.05 ab0.8 ± 0.05 ab0.7 ± 0.04 b0.7 ± 0.06 ab0.8 ± 0.09 a
Phenylalanine0.6 ± 0.03 e0.6 ± 0.02 de0.8 ± 0.05 bc0.8 ± 0.05 bc0.8 ± 0.01 bc0.9 ± 0.07 ab0.9 ± 0.09 a0.8 ± 0.05 bc0.7 ± 0.04 cd0.7 ± 0.06 bc
Isoleucine0.4 ± 0.01 c0.4 ± 0.02 c0.5 ± 0.02 ab0.5 ± 0.05 ab0.5 ± 0.02 b0.6 ± 0.04 ab0.6 ± 0.05 ab0.5 ± 0.04 abc0.6 ± 0.04 ab0.6 ± 0.07 a
Leucine0.7 ± 0.03 c0.7 ± 0.02 c0.9 ± 0.04 ab0.9 ± 0.06 ab0.9 ± 0.02 b1.0 ± 0.07 ab1.1 ± 0.94 a0.9 ± 0.06 ab0.9 ± 0.06 b1.0 ± 0.09 ab
Lysine0.4 ± 0.06 c0.4 ± 0.07 c0.5 ± 0.03 b0.5 ± 0.04 ab0.5 ± 0.05 bc0.5 ± 0.06 ab0.6 ± 0.03 a0.5 ± 0.03 b0.5 ± 0.04 b0.6 ± 0.05 ab
Total essential amino acids3.8 ± 0.17 c3.9 ± 0.25 c5.1 ± 0.23 b5.2 ± 0.40 ab5.0 ± 0.04 b5.5 ± 0.47 ab6.0 ± 0.48 a4.8 ± 0.31 b4.8 ± 0.45 b5.1 ± 0.70 ab
Aspartic acid1.0 ± 0.15 c1.0 ± 0.11 c1.4 ± 0.05 b1.4 ± 0.20 b1.4 ± 0.02 b1.5 ± 0.09 b1.8 ± 0.11 a1.4 ± 0.14 b1.5 ± 0.11 ab1.6 ± 0.12 ab
Glutamic acid1.6 ± 0.07 c1.7 ± 0.08 c2.1 ± 0.44 bc2.4 ± 0.21 ab2.4 ± 0.11 ab2.7 ± 0.21 ab3.0 ± 0.40 a2.5 ± 0.18 ab2.5 ± 0.19 ab2.5 ± 0.33 ab
Serine0.5 ± 0.02 c0.5 ± 0.03 c0.7 ± 0.03 b0.7 ± 0.03 ab0.7 ± 0.02 b0.8 ± 0.04 ab0.8 ± 0.06 a0.7 ± 0.04 b0.7 ± 0.04 b0.7 ± 0.07 ab
Glycine0.6 ± 0.04 c0.6 ± 0.04 c0.7 ± 0.04 bc0.7 ± 0.03 ab0.7 ± 0.02 ab0.8 ± 0.05 ab0.8 ± 0.06 a0.7 ± 0.04 bc0.7 ± 0.09 bc0.7 ± 0.08 ab
Arginine 0.9 ± 0.11 c1.0 ± 0.07 bc1.4 ± 0.11 ab1.4 ± 0.05 ab1.4 ± 0.04 ab1.6 ± 0.09 a1.5 ± 0.29 a1.5 ± 0.16 a1.5 ± 0.12 a1.5 ± 0.20 a
Alanine0.3 ± 0.01 c0.3 ± 0.01 bc0.4 ± 0.02 a0.4 ± 0.03 a0.4 ± 0.03 a0.4 ± 0.03 a0.5 ± 0.04 a0.4 ± 0.02 a0.4 ± 0.04 ab0.4 ± 0.05 a
Tyrosine0.3 ± 0.01 c0.3 ± 0.02 c0.4 ± 0.02 b0.4 ± 0.04 b0.4 ± 0.01 b0.4 ± 0.04 ab0.5 ± 0.01 a0.4 ± 0.02 b0.4 ± 0.03 b0.4 ± 0.05 b
Proline0.1 ± 0.01 c0.1 ± 0.06 c0.2 ± 0.04 bc0.2 ± 0.06 bc0.2 ± 0.01 bc0.2 ± 0.02 bc0.2 ± 0.04 b0.2 ± 0.04 bc0.3 ± 0.06 b0.4 ± 0.03 a
Total non-essential amino acids5.3 ± 0.03 c5.6 ± 0.29 c7.2 ± 0.44 b7.6 ± 0.55 b7.6 ± 0.04 b8.3 ± 0.44 ab9.1 ± 0.69 a7.8 ± 0.40 b7.9 ± 0.47 b8.3 ± 0.67 ab
Total amino acids9.1 ± 0.20 c9.4 ± 0.47 c12.2 ± 0.54 b12.8 ± 0.94 b12.6 ± 0.08 b13.8 ± 0.90 ab15.2 ± 1.09 a12.6 ± 0.67 b12.7 ± 0.91 b13.4 ± 1.38 ab
Results are expressed as means (n = 15) ± standard deviation. Different lowercase letters (a–e) in the same row indicate significant differences (p < 0.05 by Tukey’s test).
Table 4. Absolute quantification of the fatty acid profile in Salvia lavandulifolia Vahl. seed oils (g/100 g of oil).
Population
Fatty Acid Profile12345678910
Myristic acid0.1 ± 0.03 a0.05 ± 0.01 b0.09 ± 0.01 a0.05 ± 0.01 b0.07 ± 0.01 b0.06 ± 0.01 b0.06 ± 0.01 b0.06 ± 0.01 b0.05 ± 0.01 b0.05 ± 0.01 b
Palmitic acid 8.8 ± 2.86 a5.04 ± 0.84 b9.08 ± 0.91 a5.41 ± 0.52 a6.52 ± 0.56 a5.74 ± 0.53 a6.27 ± 1.41 a6.01 ± 1.03 a5.19 ± 1.35 a4.80 ± 0.64 a
7-hexadecenoic acid *0.04 ± 0.004 a0.03 ± 0.01 a0.04 ± 0.01 a0.03 ± 0.002 a0.03 ± 0.004 a0.03 ± 0.01 a0.04 ± 0.01 a0.03 ± 0.003 a0.03 ± 0.01 a0.03 ± 0.003 a
Palmitoleic acid0.2 ± 0.01 a0.13 ± 0.01 abc0.16 ± 0.01 a0.11 ± 0.004 bc0.14 ± 0.01 ab0.12 ± 0.01 bc0.14 ± 0.03 abc0.11 ± 0.01 bc0.15 ± 0.01 a0.10 ± 0.01 c
11-palmitoleic acid *0.02 ± 0.002 c0.02 ± 0.004 c0.03 ± 0.002 c0.02 ± 0.003 c0.02 ± 0.003 c0.02 ± 0.01 c0.05 ± 0.02 b0.02 ± 0.003 c0.05 ± 0.01 b0.07 ± 0.01 a
Hexadecanoic-14-CH3 acid *0.1 ± 0.002 bc0.08 ± 0.004 ab0.06 ± 0.003 c0.08 ± 0.004 ab0.09 ± 0.005 a0.09 ± 0.011 a0.09 ± 0.012 a0.07 ± 0.006 bc0.07 ± 0.002 bc0.09 ± 0.003 a
Margaric acid0.04 ± 0.001 a0.04 ± 0.002 ab0.04 ± 0.001 a0.03 ± 0.002 c0.03 ± 0.001 c0.03 ± 0.002 c0.04 ± 0.005 bc0.03 ± 0.002 c0.03 ± 0.001 c0.03 ± 0.001 c
10-heptadecenoic acid0.04 ± 0.002 abc0.03 ± 0.001 abc0.04 ± 0.002 a0.04 ± 0.003 ab0.04 ± 0.007 ab0.03 ± 0.002 c0.03 ± 0.006 bc0.03 ± 0.005 bc0.03 ± 0.002 bc0.03 ± 0.002 c
Heptadecanoic-16-CH3 acid *0.1 ± 0.002 a0.06 ± 0.001 a0.05 ± 0.002 ab0.03 ± 0.003 b0.05 ± 0.013 b0.05 ± 0.008 ab0.05 ± 0.012 ab0.05 ± 0.006 a0.04 ± 0.002 ab0.05 ± 0.02 a
Stearic acid 1.8 ± 0.28 a1.5 ± 0.04 b1.4 ± 0.073 bc1.3 ± 0.06 bc1.4 ± 0.06 bc1.5 ± 0.16 b1.4 ± 0.14 bc1.4 ± 0.03 bc1.5 ± 0.03 bc1.2 ± 0.03 c
Oleic acid14.7 ± 0.43 bc13.9 ± 0.28 bc17.2 ± 0.56 a13.4 ± 0.81 bc13.1 ± 0.39 c14.2 ± 2.08 bc13.7 ± 1.48 bc14.8 ± 0.46 bc15.5 ± 0.41 ab14.0 ± 0.27 bc
Z-vaccenic acid1.1 ± 0.04 bcd1.04 ± 0.02 bcde1.3 ± 0.05 a0.99 ± 0.05 cde1.1 ± 0.04 b1.0 ± 0.04 cde1.1 ± 0.10 bc1.0 ± 0.04 de1.2 ± 0.03 b0.94 ± 0.02 e
Linoleic acid51.8 ± 1.62 e58.5 ± 1.73 bc57.9 ± 2.09 c64.8 ± 4.1 a62.8 ± 2.08 a57.8 ± 2.70 c62.4 ± 2.59 ab56.1 ± 2.12 cd53.0 ± 1.58 ed50.8 ± 0.78 e
Linolenic acid0.7 ± 0.01 ab0.7 ± 0.02 abc0.80 ± 0.026 a0.73 ± 0.047 ab0.75 ± 0.03 ab0.70 ± 0.06 abc0.77 ± 0.086 ab0.68 ± 0.048 bc0.56 ± 0.01 d0.61 ± 0.02 cd
Arachidic acid0.1 ± 0.01 a0.09 ± 0.004 b0.08 ± 0.004 c0.06 ± 0.002 d0.07 ± 0.007 cd0.07 ± 0.007 cd0.07 ± 0.009 cd0.07 ± 0.004 cd0.1 ± 0.003 cd0.07 ± 0.003 cd
11-eicosenoic ac id0.4 ± 0.004 b0.4 ± 0.01 b0.41 ± 0.019 a0.36 ± 0.014 b0.34 ± 0.010 b0.35 ± 0.011 b0.36 ± 0.020 b0.35 ± 0.012 b0.36 ± 0.011 b0.37 ± 0.007 b
Eicosanoic-14-CH3 acid *0.03 ± 0.002 abcd0.03 ± 0.003 abc0.02 ± 0.003 d0.04 ± 0.002 a0.03 ± 0.01 abcd0.03 ± 0.01 ab0.03 ± 0.005 abc0.027 ± 0.002 bcd0.03 ± 0.002 cd0.03 ± 0.001 abc
11–14-eicosadienoic acid0.06 ± 0.003 bc0.07 ± 0.005 ab0.06 ± 0.006 bc0.07 ± 0.002 a0.06 ± 0.005 ab0.07 ± 0.009 ab0.07 ± 0.007 a0.06 ± 0.007 bc0.05 ± 0.004 c0.05 ± 0.004 c
Behenic acid0.05 ± 0.005 a0.04 ± 0.001 b0.04 ± 0.003 b0.03 ± 0.001 d0.03 ± 0.002 d0.03 ± 0.003 cd0.03 ± 0.004 cd0.03 ± 0.003 d0.03 ± 0.003 bc0.03 ± 0.002 cd
Erucic acid0.07 ± 0.004 ab0.07 ± 0.004 abc0.07 ± 0.002 a0.06 ± 0.001 de0.06 ± 0.006 bcd0.06 ± 0.003 bcd0.07 ± 0.006 ab0.05 ± 0.003 e0.06 ± 0.002 de0.06 ± 0.004 cde
15-tetracosenoic acid *0.09 ± 0.004 bc0.09 ± 0.009 bc0.10 ± 0.007 a0.09 ± 0.004 bc0.08 ± 0.007 cd0.09 ± 0.008 bc0.09 ± 0.007 ab0.07 ± 0.005 d0.09 ± 0.004 bc0.08 ± 0.006 bcd
Total SFAs11.0 ± 3.12 a7.0 ± 0.87 b10.8 ± 0.91 b7.1 ± 0.60 b8.3 ± 0.58 b7.6 ± 0.45 b8.1 ± 1.40 b7.8 ± 1.07 b7.0 ± 1.36 b6.4 ± 0.64 b
ω7 MUFAs 1.3 ± 0.04 bcd1.2 ± 0.03 cde1.5 ± 0.05 a1.2 ± 0.06 de1.35 ± 0.04 bc1.2 ± 0.05 de1.3 ± 0.13 bc1.1 ± 0.05 e1.4 ± 0.04 ab1.1 ± 0.02 e
ω9 MUFAs 15.2 ± 0.42 bc14.4 ± 0.29 bc17.8 ± 0.59 a14.0 ± 0.83 bc13.6 ± 0.41 c14.7 ± 2.08 bc14.3 ± 1.50 bc15.3 ± 0.46 bc16.0 ± 0.42 b14.5 ± 0.28 bc
Total MUFAs16.5 ± 0.46 bc15.7 ± 0.30 bc19.3 ± 0.63 a15.2 ± 0.89 c15.0 ± 0.45 c15.9 ± 2.11 bc15.6 ± 1.45 bc16.4 ± 0.50 bc17.4 ± 0.45 b15.6 ± 0.29 bc
ω3 PUFAs 0.7 ± 0.01 cd0.7 ± 0.02 bcd0.8 ± 0.03 a0.7 ± 0.05 ab0.8 ± 0.03 ab0.7 ± 0.06 abc0.8 ± 0.09 ab0.7 ± 0.05 bc0.6 ± 0.01 d0.6 ± 0.02 cd
ω6 PUFAs 51.9 ± 1.62 d58.6 ± 1.73 b57.9 ± 2.09 b64.9 ± 4.01 a62.9 ± 2.09 a57.9 ± 2.71 b62.4 ± 2.60 a56.2 ± 2.12 bc53.0 ± 1.58 cd50.9 ± 0.78 d
Total PUFAs 52.6 ± 1.63 d59.3 ± 1.75 b58.7 ± 2.11 b65.6 ± 4.06 a63.7 ± 2.10 a58.6 ± 2.76 b63.2 ± 2.59 a56.8 ± 2.152 bc53.6 ± 1.59 cd51.5 ± 0.78 d
TOTAL FA g/100 g OIL80.1 ± 4.97 b81.9 ± 2.66 b88.9 ± 2.91 a87.9 ± 5.53 a86.9 ± 2.81 a82.0 ± 2.47 b86.9 ± 3.12 a81.0 ± 2.26 b77.98 ± 2.75 b73.5 ± 1.21 c
ω6/ω3 ratio69.983.172.588.684.382.781.582.693.883.2
PUFA/SFA ratio4.798.495.439.267.677.737.837.317.708.04
Atherogenicity Index0.130.070.120.070.090.080.080.090.080.07
Thrombogenicity Index0.290.170.260.160.190.190.190.200.180.17
Results are expressed as means (n = 15). Different lowercase letters (a–e) in the same row indicate significant differences (p < 0.05). (*) Compound tentatively identified by NIST and Wiley Registry library search. FA: fatty acid; SFA: sum of all saturated fatty acids; MUFA: sum of all monounsaturated fatty acids; MUFA ω7: sum of all ω7 monounsaturated fatty acids; MUFA ω9: sum of all ω9 monounsaturated fatty acids; PUFA: sum of all polyunsaturated fatty acids.
Table 5. Tocopherol content in Salvia lavandulifolia Vahl. seed oils (mg/100 g of oil).
Population
Tocochromanol12345678910
γ-tocotrienol1.4 ± 0.04 d2.2 ± 0.36 dcb2.2 ± 0.35 cb2.96 ± 0.326 ba2.2 ± 0.32 dcb3.3 ± 0.43 a1.7 ± 0.40 cd2.8 ± 0.15 ba2.7 ± 0.33 ba2.3 ± 0.24 cb
β-tocotrienol0.8 ± 0.03 ab0.9 ± 0.09 a0.01 ± 0.01 e0.3 ± 0.06 dn.d.0.4 ± 0.06 cd0.3 ± 0.04 d0.6 ± 0.14 bc0.2 ± 0.17 den.d.
α-tocotrienoln.d.0.5 ± 0.12 bcd0.7 ± 0.16 abc0.5 ± 0.10 bcd0.4 ± 0.05 d0.8 ± 0.10 a0.4 ± 0.16 d0.4 ± 0.17 cd0.5 ± 0.05 cd0.8 ± 0.07 ab
Tocopherylquinone13.8 ± 0.33 a9.9 ± 0.70 b7.6 ± 0.62 cd3.3 ± 0.44 g7.8 ± 0.49 c4.8 ± 0.12 f4.8 ± 0.84 f5.9 ± 0.67 ef6.3 ± 0.61 def7.2 ± 0.27 cde
δ-tocopherol6.5 ± 0.48 cd8.6 ± 0.46 b7.1 ± 0.51 bc4.2 ± 0.61 e5.3 ± 0.63 de11.1 ± 1.17 a4.7 ± 0.68 e5.7 ± 0.56 cde5.4 ± 0.30 de6.7 ± 0.29 cd
γ + β tocopherol39.2 ± 1.53 d62.5 ± 2.11 a59.0 ± 2.14 ab62.0 ± 1.97 a46.2 ± 2.48 cd60.7 ± 3.98 ab55.4 ± 5.4 abc49.5 ± 4.38 bcd52.9 ± 8.54 abc63.8 ± 1.23 a
α-tocopheroln.d.4.3 ± 0.61 a0.1 ± 0.01 f3.3 ± 0.61 b2.2 ± 0.21 c0.1 ± 0.01 ef0.8 ± 0.05 e1.5 ± 0.11 d2.4 ± 0.38 cn.d.
Plastochromanol-80.6 ± 0.06 a0.6 ± 0.08 an.d.0.1 ± 0.05 bn.d.n.d.n.d.0.04 ± 0.005 b0.65 ± 0.06 an.d.
Total tocopherols62.3 ± 2.44 e89.2 ± 4.50 a76.6 ± 3.72 abcd76.8 ± 4.1 abcd64.1 ± 4.12 de81.12 ± 5.5 ab67.5 ± 6.4 cde65.7 ± 4.89 cd70.9 ± 7.65 bcde80.7 ± 2.07 abc
Results are expressed as means (n = 5) ± standard deviation. Different lowercase letters (a–g) in the same row indicate significant differences (p < 0.05 by Tukey’s test). n.d., not detected.
Table 6. The main polyphenol compounds quantified in Salvia lavandulifolia Vahl. seed oils (mg/100 g of oil).
Population
Phenolic Compound12345678910
Protocatechuic acid0.6 ± 0.03 cd0.7 ± 0.02 bc0.9 ± 0.04 a0.6 ± 0.02 cd0.8 ± 0.03 ab0.9 ± 0.11 a0.6 ± 0.14 cd0.5 ± 0.05 cd0.5 ± 0.04 cd0.5 ± 0.01 d
Vanillic acid1.0 ± 0.06 a0.7 ± 0.02 b0.6 ± 0.03 b0.4 ± 0.02 cdn.d.0.3 ± 0.02 en.d.n.d.0.4 ± 0.04 cd0.5 ± 0.01 c
Caffeic acid0.3 ± 0.06 a0.3 ± 0.01 a0.1 ± 0.02 bc0.2 ± 0.01 b0.2 ± 0.01 b0.1 ± 0.05 bcd0.1 ± 0.04 cd0.1 ± 0.01 cd0.1 ± 0.01 d1.0 ± 0.01 cd
Apigenin 7-O-neohesperidoside0.7 ± 0.06 a0.4 ± 0.04 b0.2 ± 0.02 d0.2 ± 0.02 d0.3 ± 0.02 cn.d.0.2 ± 0.05 d0.3 ± 0.02 c0.2 ± 0.03 d0.2 ± 0.01 d
Apigenin 7-glucoside1.0 ± 0.05 a0.6 ± 0.03 c0.6 ± 0.04 cn.d.0.9 ± 0.03 bn.d.0.5 ± 0.05 c0.6 ± 0.05 c0.6 ± 0.05 c0.6 ± 0.02 c
Luteolin1.6 ± 0.08 b1.4 ± 0.09 bc1.1 ± 0.09 c4.6 ± 0.16 a0.7 ± 0.05 d0.4 ± 0.06 d0.6 ± 0.20 d1.2 ± 0.04 c1.3 ± 0.24 bc1.1 ± 0.06 c
Apigenin129.9 ± 2.9 a63.1 ± 1.97 b19.2 ± 0.62 c5.4 ± 0.42 d1.9 ± 0.21 ef1.0 ± 0.06 f4.0 ± 1.76 de5.8 ± 0.75 d4.0 ± 0.17 de4.9 ± 0.21 de
Hispidulinn.d.0.7 ± 0.05 dn.d.n.d.1.2 ± 0.05 b0.8 ± 0.03 c1.0 ± 0.10 c1.3 ± 0.10 ab1.4 ± 0.08 a1.3 ± 0.06 ab
Cirsiliol5.9 ± 0.29 a3.3 ± 0.19 b2.2 ± 0.18 c1.4 ± 0.06 d0.8 ± 0.04 fg0.5 ± 0.11 g0.8 ± 0.15 egf1.3 ± 0.03 d0.9 ± 0.11 ef1.1 ± 0.07 e
Cirsimaritin1.8 ± 0.26 a1.3 ± 0.08 bc1.6 ± 0.06 ab1.6 ± 0.11 ab1.5 ± 0.07 ab1.1 ± 0.11 c1.4 ± 0.32 bc1.5 ± 0.04 ab1.3 ± 0.06 bc1.8 ± 0.08 a
Cirsilineol2.7 ± 0.06 a1.6 ± 0.11 b1.2 ± 0.08 c1.1 ± 0.08 c1.1 ± 0.06 cd0.6 ± 0.04 f0.6 ± 0.07 f0.9 ± 0.10 de0.7 ± 0.12 ef0.9 ± 0.03 de
Salvigenin2.8 ± 0.13 bcd2.9 ± 0.15 bcd3.4 ± 0.34 ab3.6 ± 0.11 a3.2 ± 0.11 abc1.9 ± 0.29 f2.0 ± 0.57 ef2.6 ± 0.10 cde2.4 ± 0.19 def3.9 ± 0.12 a
Total phenolic compounds148.3 ± 3.95 a76.8 ± 2.69 b30.9 ± 1.52 c19.1 ± 1.00 d12.5 ± 0.66 ef7.5 ± 0.85 g11.8 ± 2.13 f16.0 ± 1.02 def13.7 ± 0.85 ef16.8 ± 0.65 de
Results are expressed as means (n = 5). Different lowercase letters (a–g) in the same row indicate significant differences (p < 0.05). n.d., not detected.
Disclaimer/Publisher’s Note: The statements, opinions and data contained in all publications are solely those of the individual author(s) and contributor(s) and not of MDPI and/or the editor(s). MDPI and/or the editor(s) disclaim responsibility for any injury to people or property resulting from any ideas, methods, instructions or products referred to in the content.