4. Results and Discussions
The proposed active resistor, realized using TSMC 40nm CMOS technology, operates at a typical bootstrapped supply voltage of 2.1 V from the DC 1 V input voltage. To compare the variation of resistance with the input voltage, the linearity figure of merit (FOM) is defined as follows:
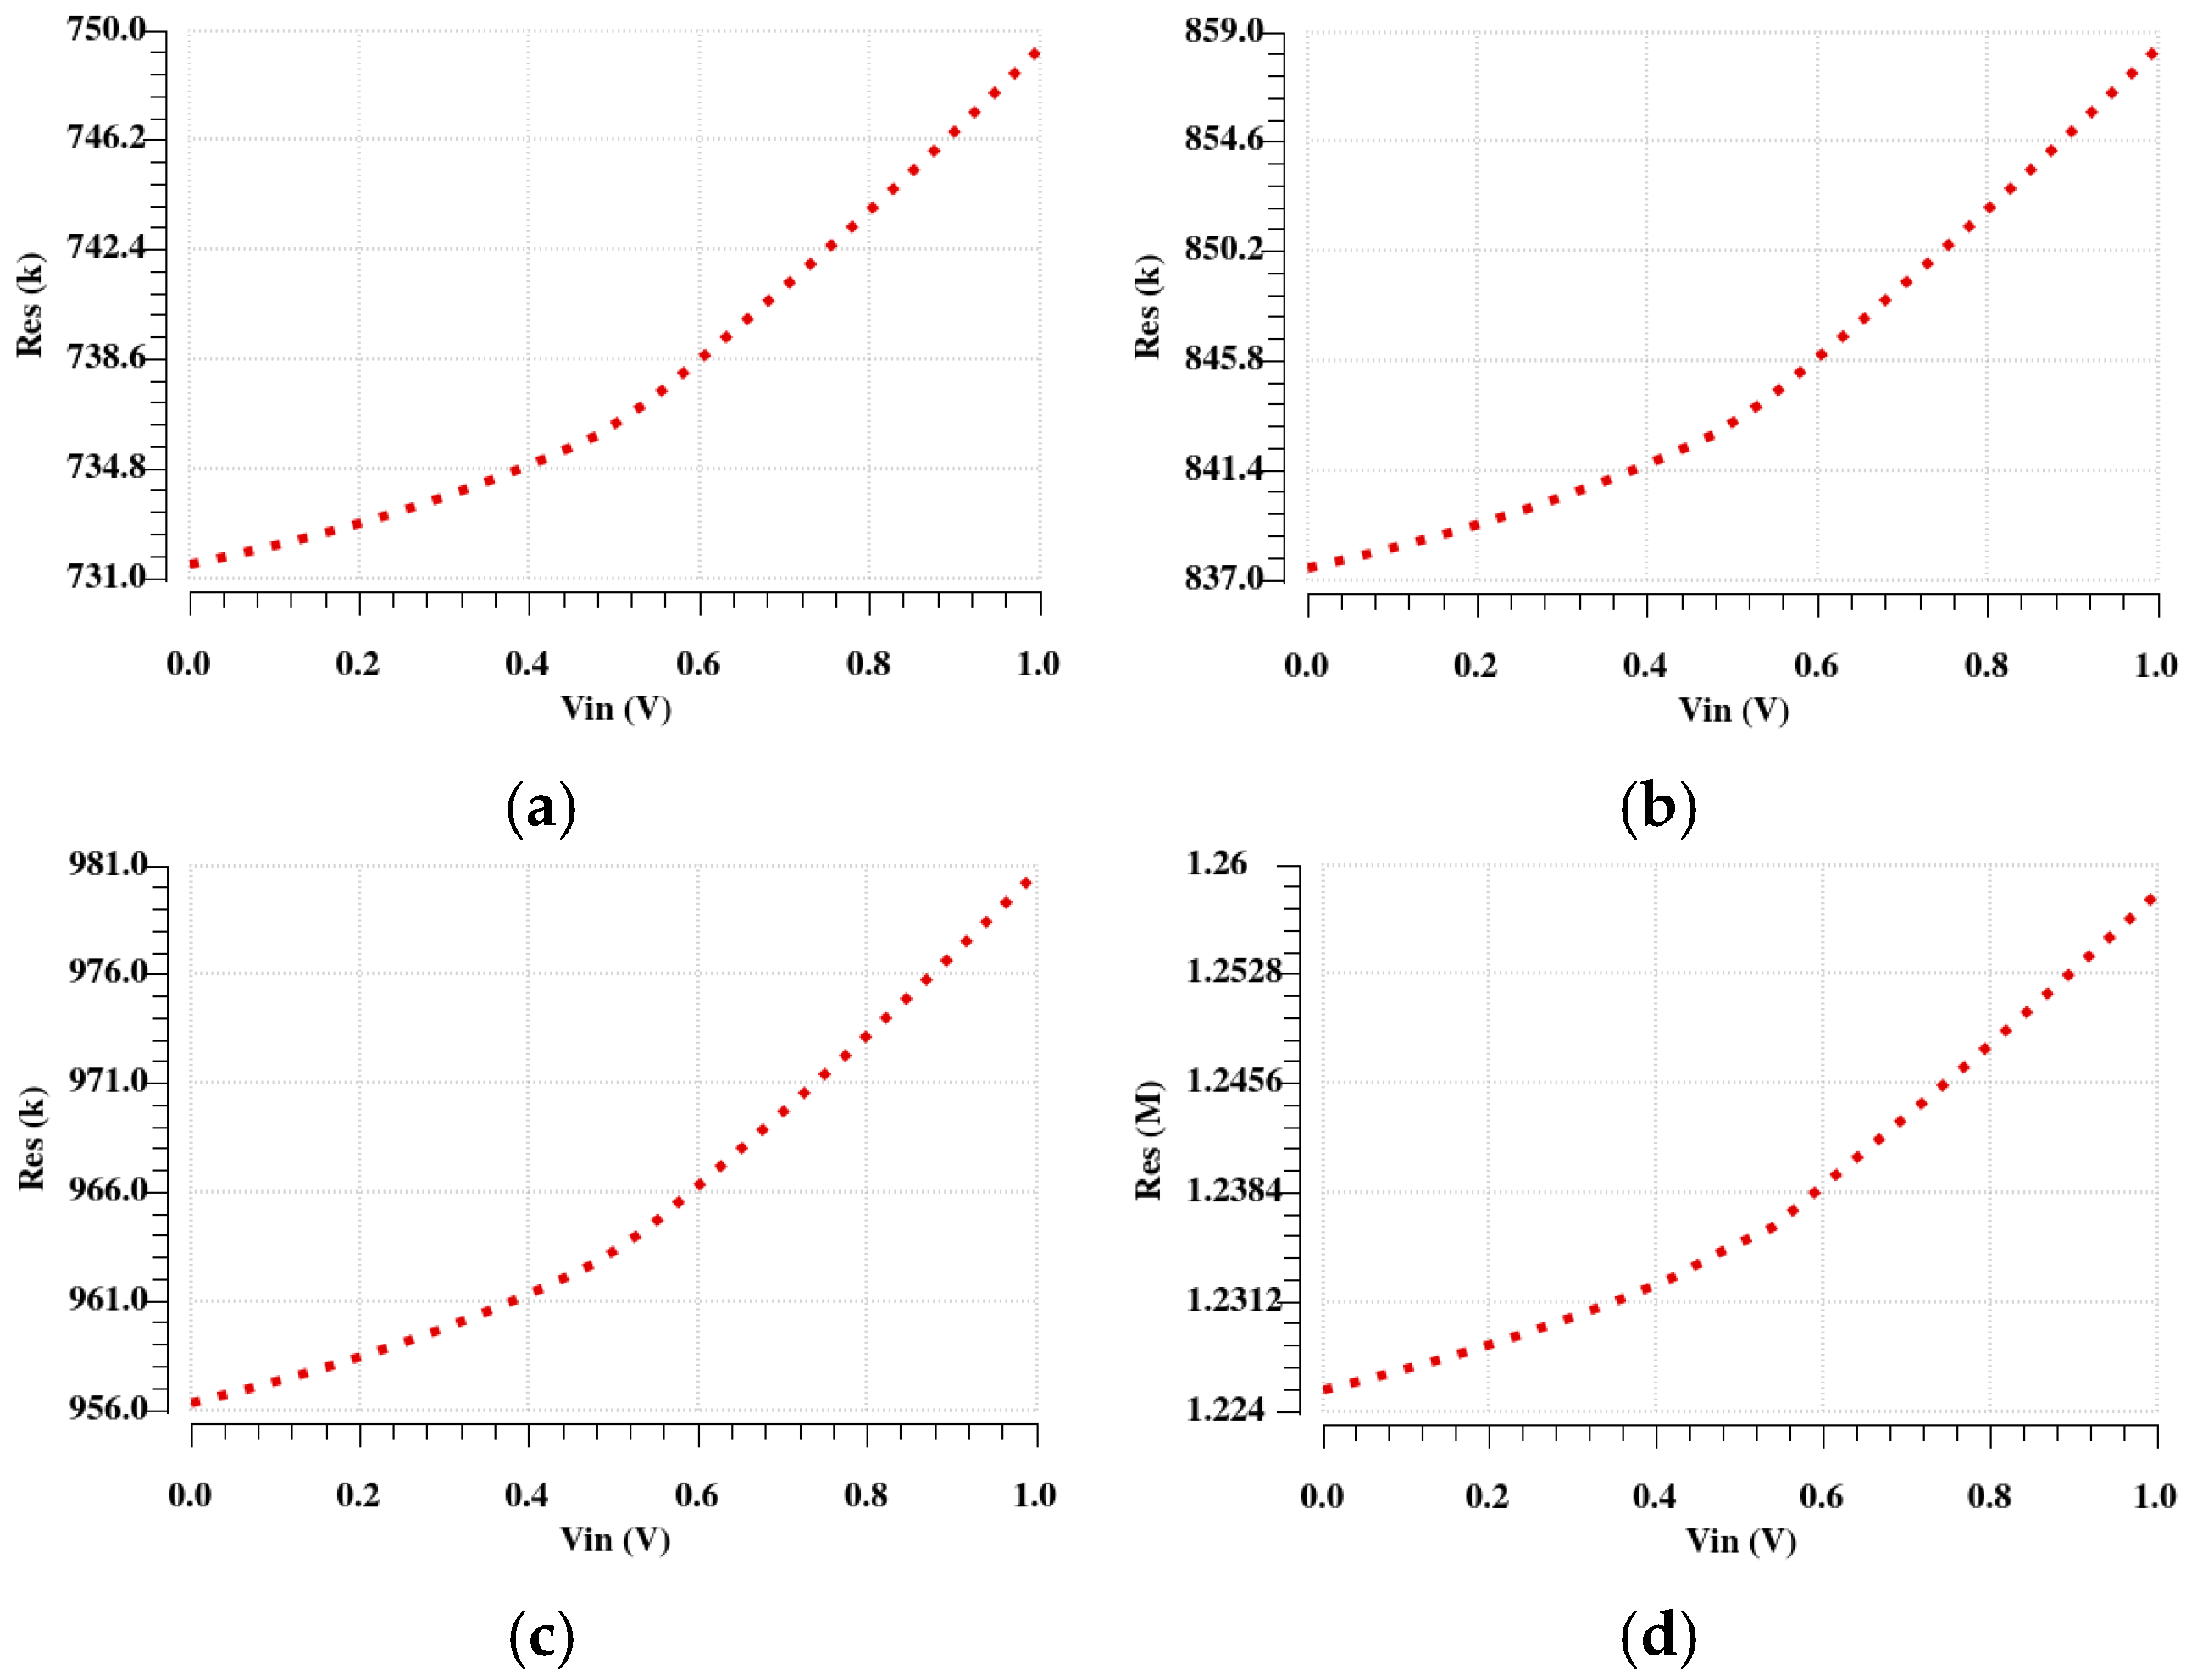
It can be seen that the resistance variation is evaluated at different temperatures, such as −25 °C, 0 °C, 27 °C, and 85 °C. Then, the linearity of the resistance can be assessed.
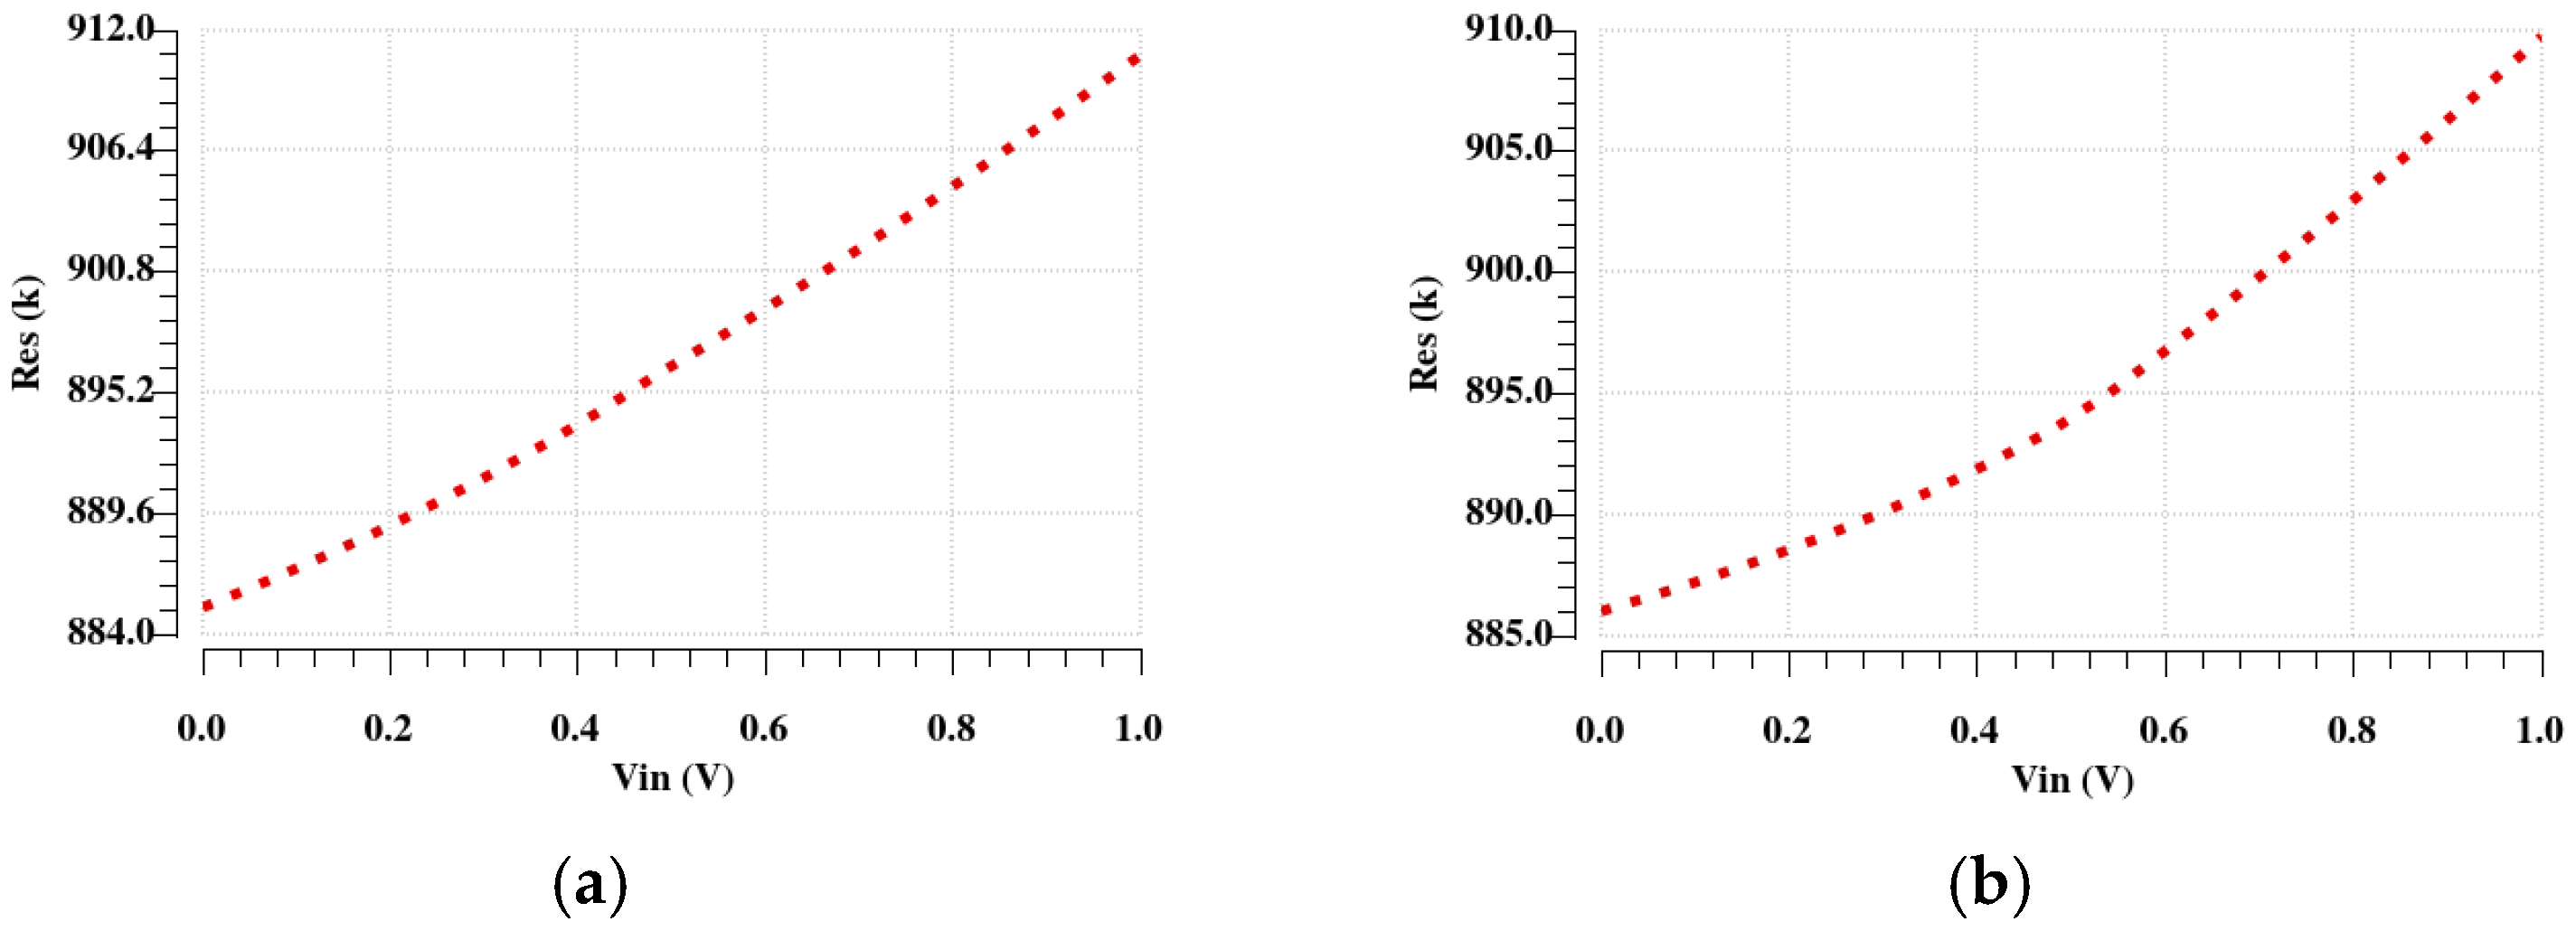
Figure 18 and
Figure 19 show the results before and after applying the automatic tuning, respectively. The term
represents the resistance change with respect to the range of applied voltage. The smaller the value, the better the stability of the resistance. Dividing by
Rnor ensures that the linearity measure is independent of the absolute value of resistance through normalization. This makes it suitable for comparing resistors at different nominal values.
In order to compare the linearity FOM numerical value with and without automatic tuning circuit, the calculated results at different temperatures are summarized in
Table 5.
The results have revealed that without the tuning circuit, the linearity FOM remains relatively stable across temperatures, ranging from to , suggesting that the resistance variation with input voltage is within a reasonable range. With the tuning circuit, the variation of linearity FOM suggests that the resistance is dependent on the input voltage across most temperature conditions, but leads to some increase in nonlinearity at extreme temperatures of −25 °C and 85 °C, at and , respectively. Nevertheless, the increase is within an acceptable range.
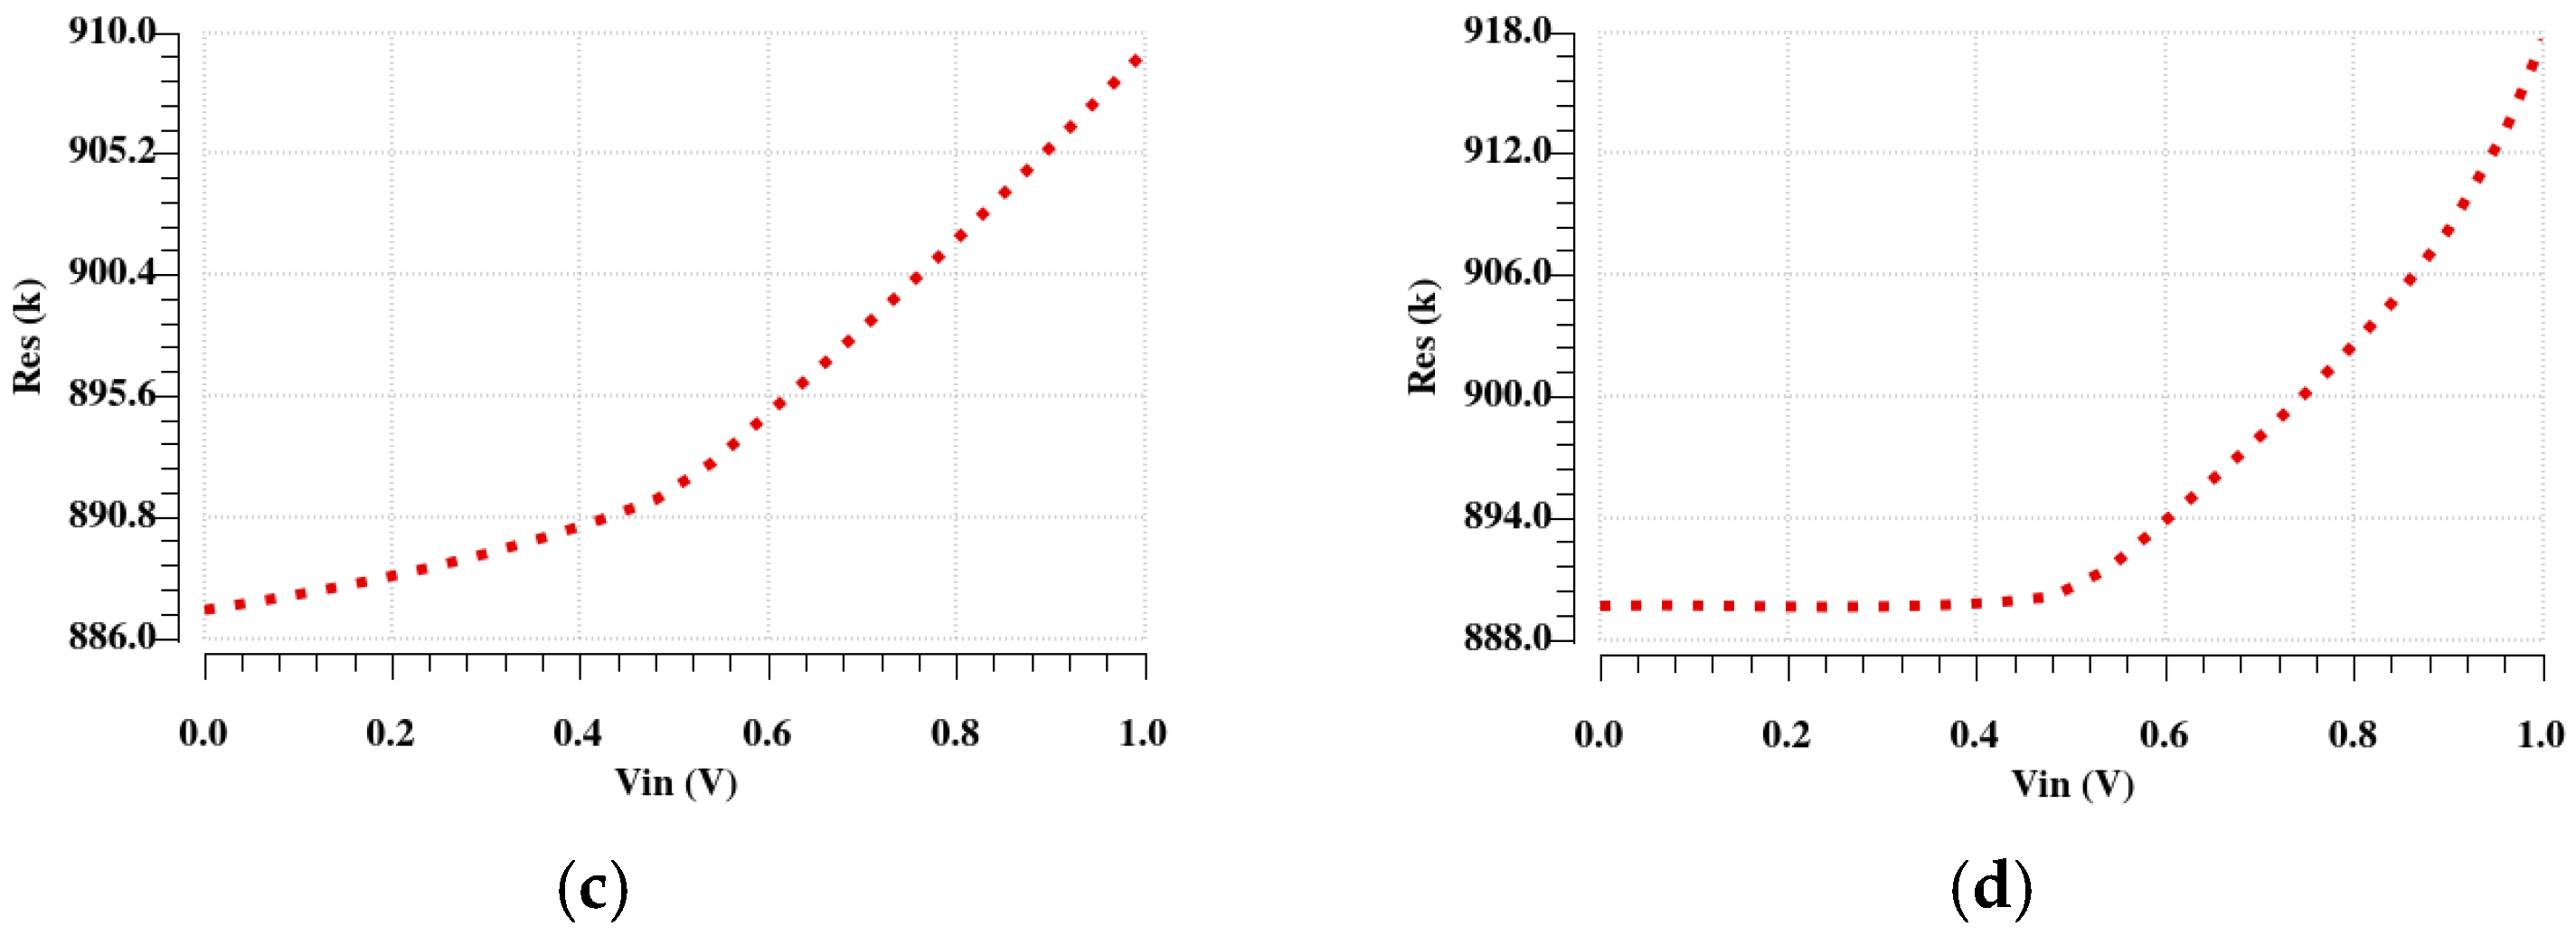
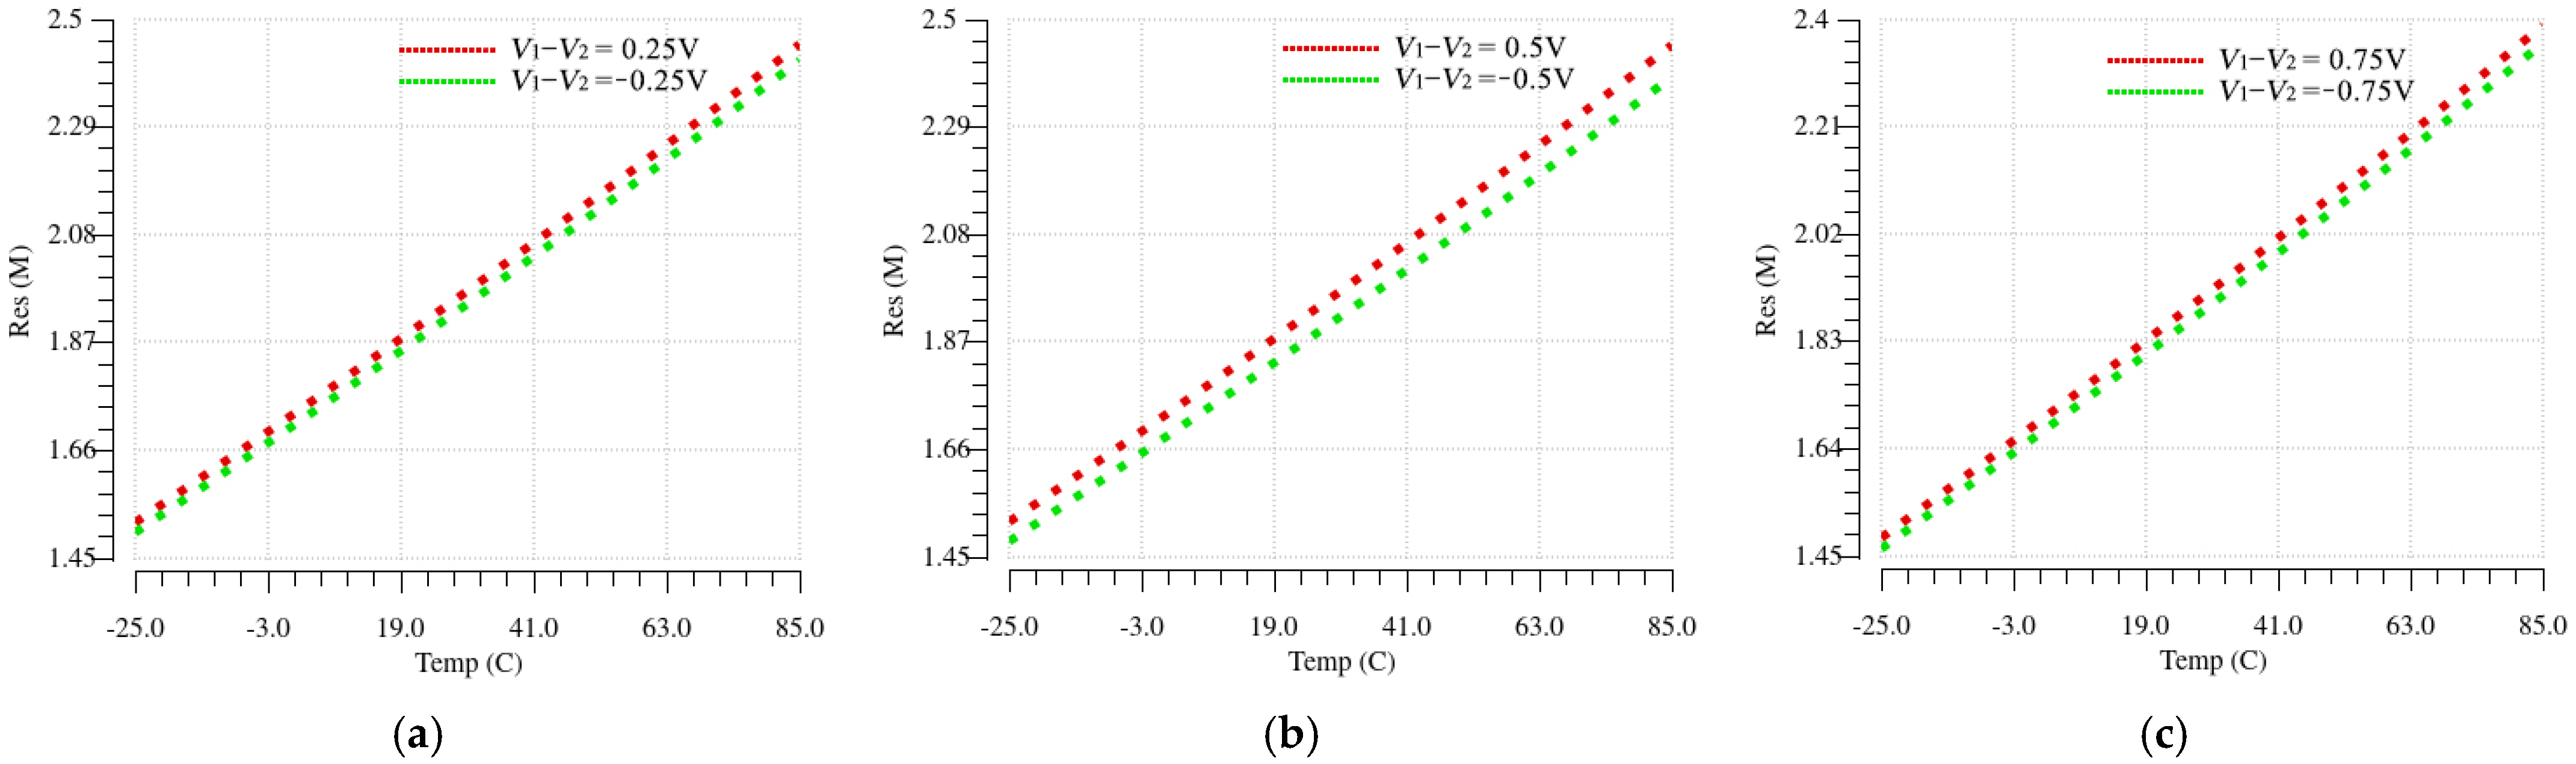
Furthermore, the resistance variation with temperature needs to be evaluated. This is achieved by controlling different drain-source voltages (
V1 −
V2), such as ±0.25 V, ±0.5 V, and ±0.75 V, while the resistance change over temperature is recorded. This setup also serves to demonstrate that the floating resistor can accommodate bidirectional signal flow, ensuring stable operation across varying input conditions. The ability to maintain consistent resistance characteristics in both positive and negative voltage scenarios further highlights its adaptability in practical applications.
Figure 20 and
Figure 21 illustrate the resistance variation without and with the automatic tuning circuit.
In order to compare the TC performance without and with the automatic tuning circuit, the calculated values are summarized in
Table 6.
Table 6 presents a comparison of
T.
C. before and after applying the automatic tuning circuit. Without the tuning circuit, the
T.
C. remains consistently high at about 4.3 × 10
3 ppm/°C. This has confirmed significant high temperature sensitivity. However, with the tuning circuit, the
T.
C. is dramatically reduced to the worst maximum value of 61.36 ppm/°C, demonstrating an improvement by nearly two orders of magnitude. This significant reduction in
T.
C. highlights the effectiveness of the automatic tuning circuit in compensating for the variation of transistors’ parameters in the active resistor against temperature change. This permits the active resistor to maintain a stable resistance across different operating conditions.
The Monte Carlo (MC) simulation results of the proposed active resistor will reveal a statistical analysis of its resistance change against the temperature variation at different process corners.
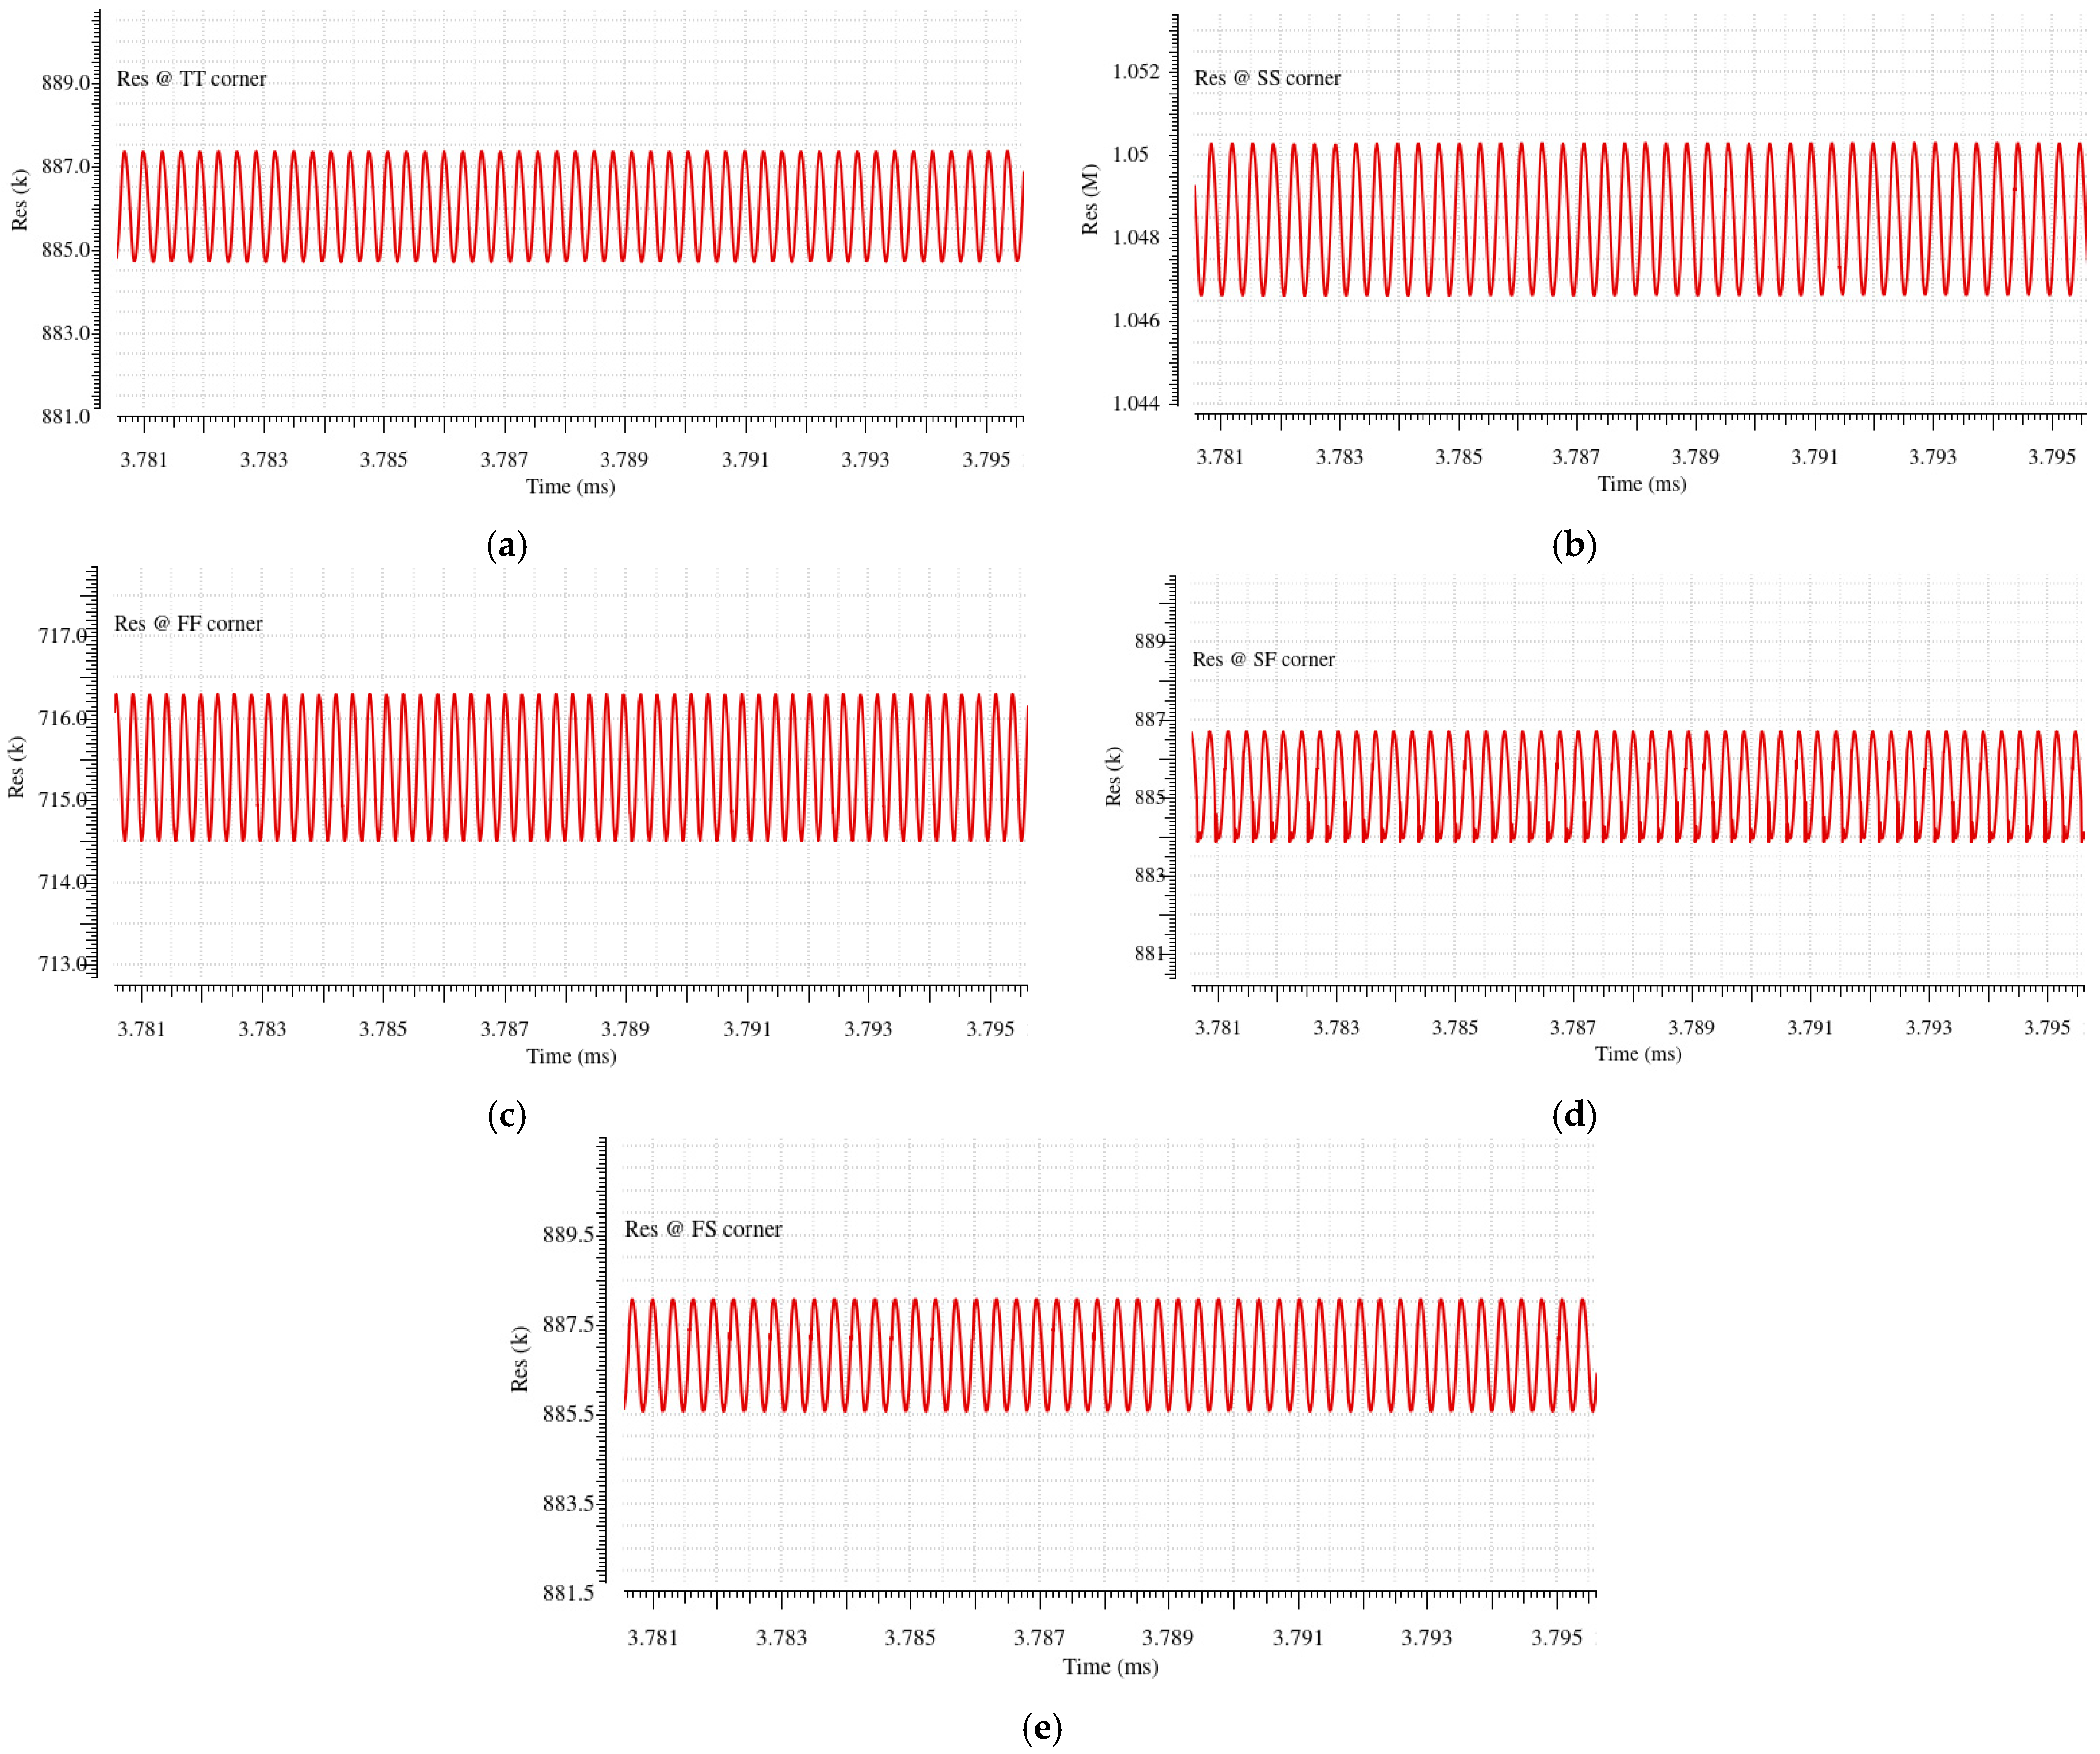
Figure 22 shows the MC simulation of the resistance, which is conducted over 800 samples, under TT, SS, FF, SF, and FS process corners at a bootstrapped supply voltage of 2.1 V.
The corresponding statistical data are summarized in
Table 7. With the automatic tuning circuit, the average resistance values for the TT, SS, FF, SF, and FS process corners are obtained as 887.41 kΩ, 1.05 MΩ, 716.19 kΩ, 886.63 kΩ, and 888.20 kΩ, respectively. These results have indicated a stable performance, with the resistance variation being well contained within acceptable ranges. The SS corner represents the extreme process conditions with the largest deviation from the nominal resistance. The SS corner corresponds to slower transistors with higher resistances, while the FF corner corresponds to faster transistors with lower resistances. The SF and FS corners with respect to the TT corner display a similar level of process sensitivity.
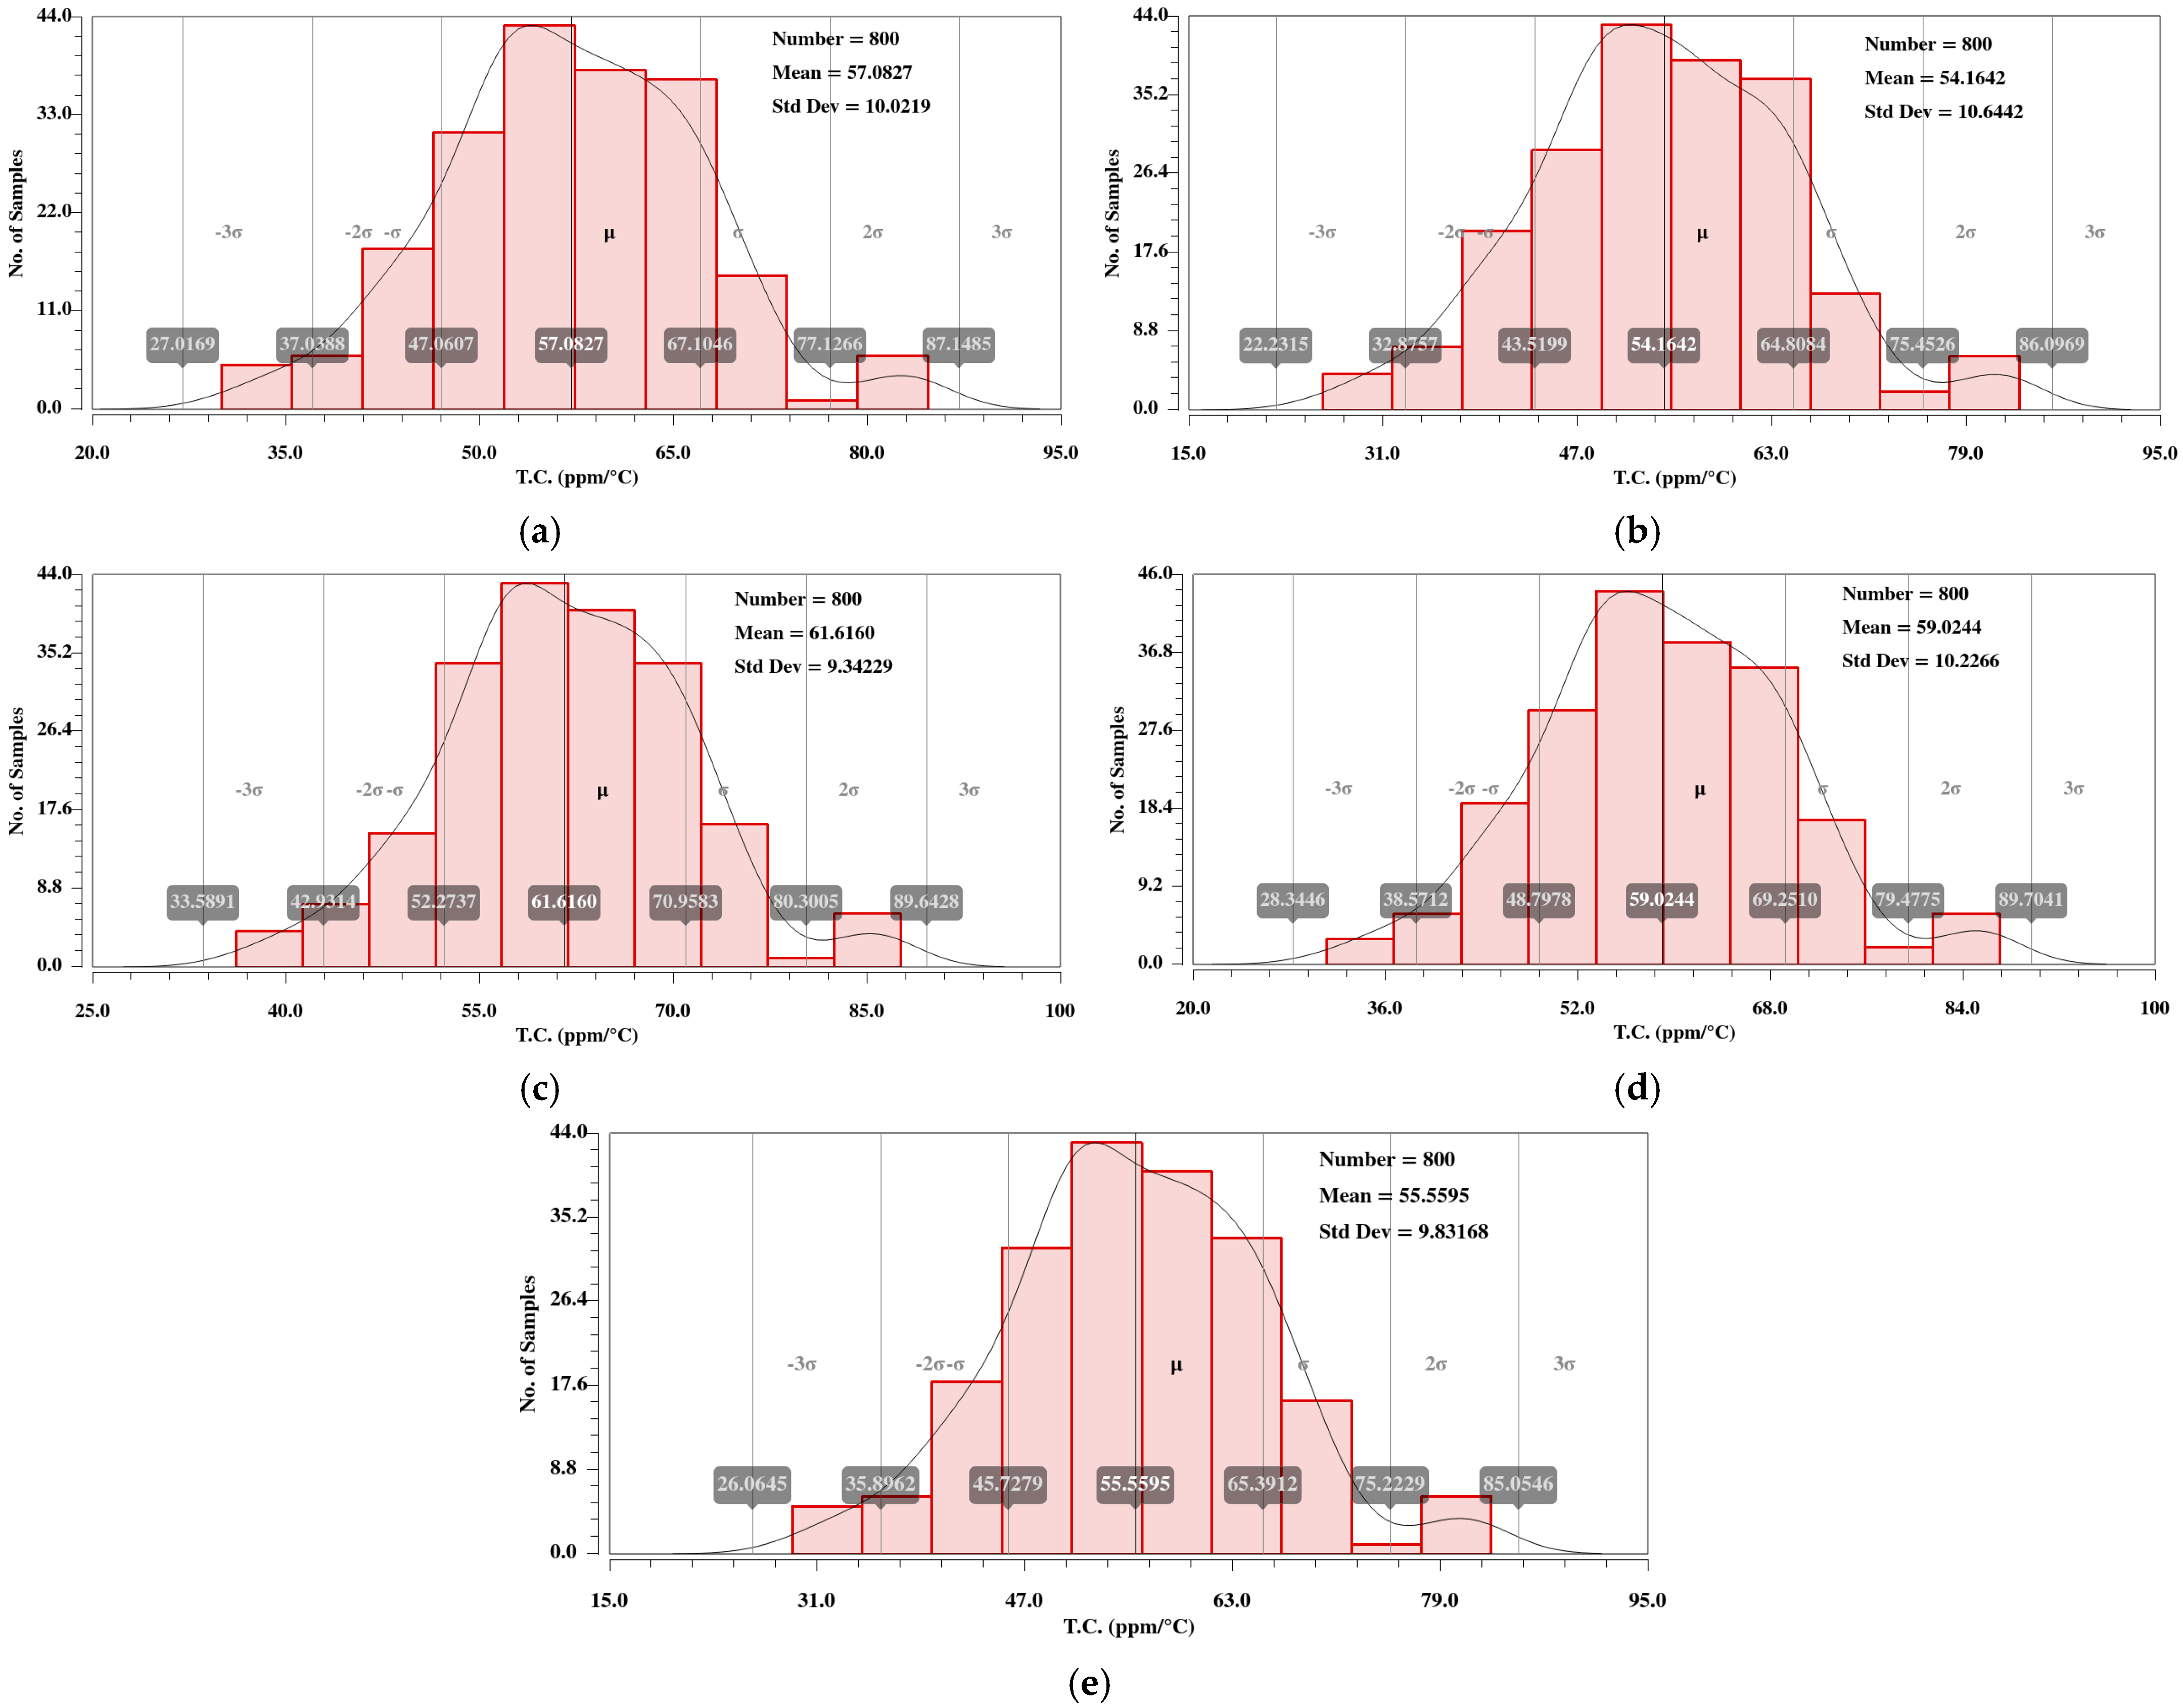
For the analysis of the active resistor’s
T.
C. with temperature range from −25 °C to 85 °C in statistical performance, the MC simulation results are shown in
Figure 23.
The statistical data values pertaining to the sensitivity of the active resistor at different process corners are summarized in
Table 8.
The T.C. values for the TT, SS, FF, SF, and FS corners, under automatic tuning circuit, are obtained as 57.08 ppm/°C, 54.16 ppm/°C, 61.61 ppm/°C, 59.02 ppm/°C, and 55.56 ppm/°C, respectively. These results have demonstrated that the active resistor exhibits a reasonably low T.C. across most corners, except for the FF corner, where the value increases to a certain extent due to faster transistors but still an acceptable value. The calculated sensitivities for TT, SS, FF, SF, and FS corners are 17.55%, 19.64%, 15.15%, 17.32%, and 17.69%, respectively. The low sensitivity reflects the effectiveness of the compensation strategies employed, ensuring robust operation over a wide temperature range. However, the increased T.C. and sensitivity in the SS corner suggest that the process variation can increase the resistor’s temperature dependency to an acceptable extent.
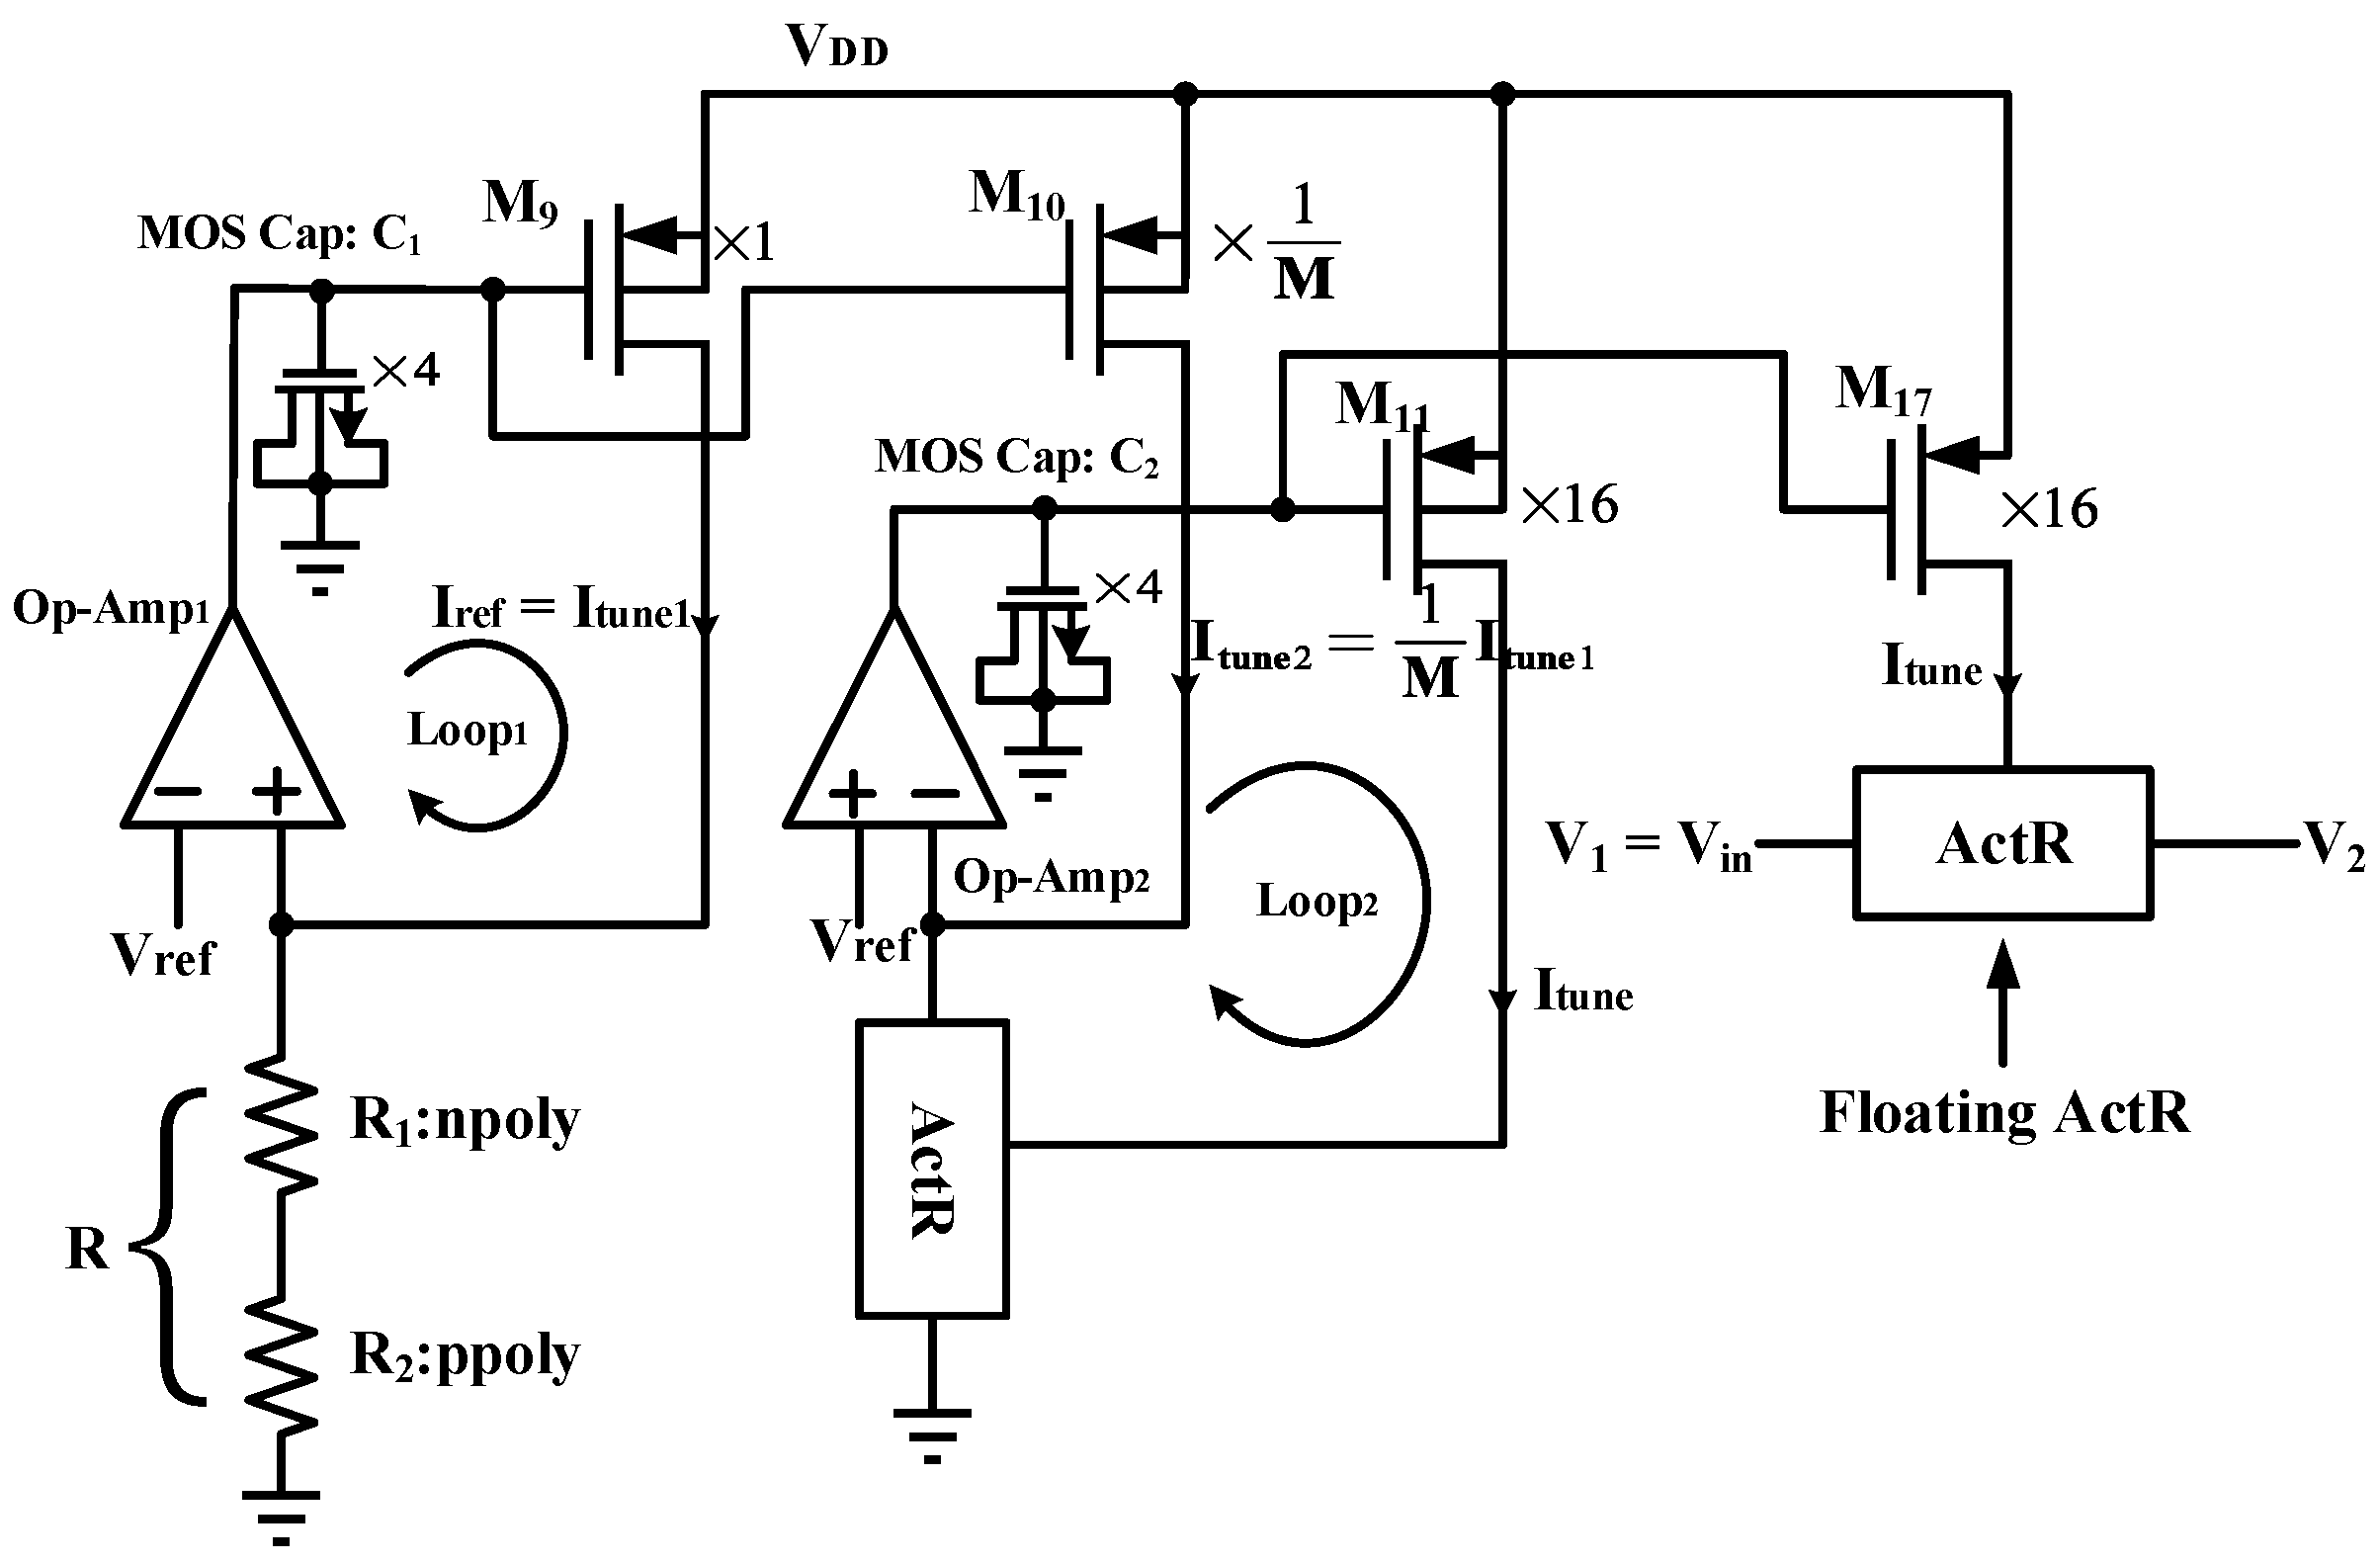
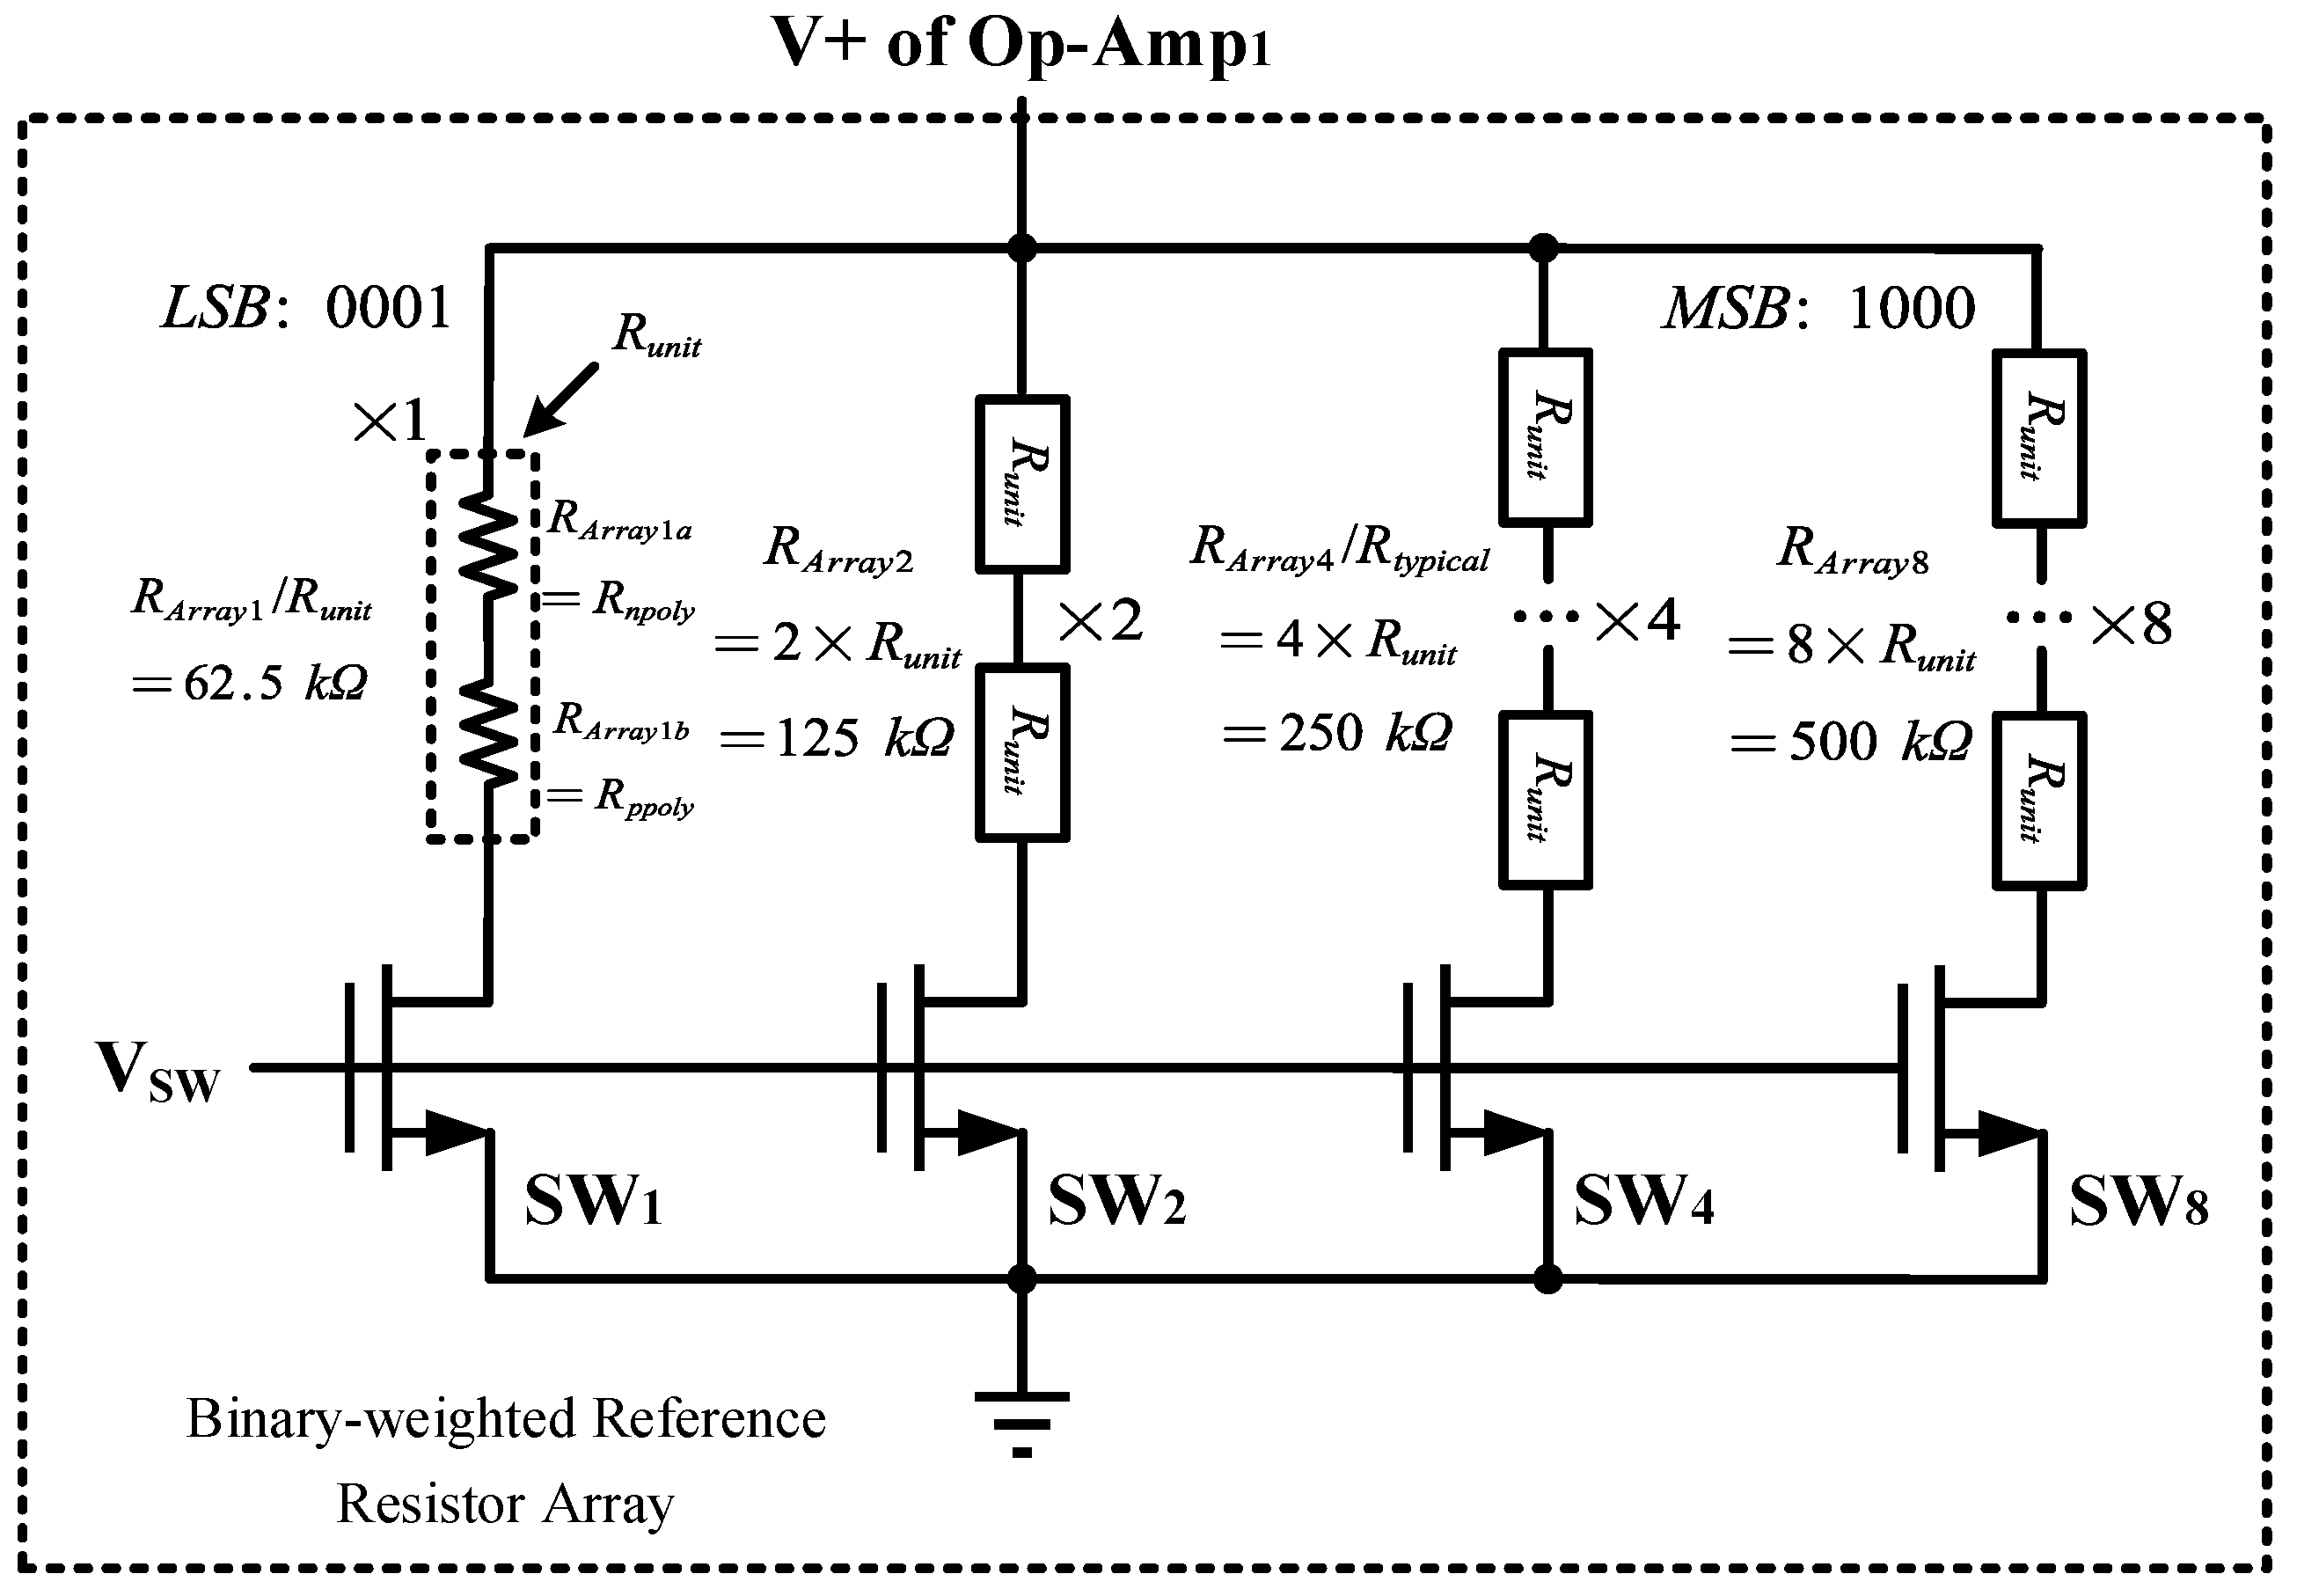
Moreover, the resistance of the active resistor should be tuned for practical applications. A tuning strategy is implemented by the binary-weighted reference resistor array. Specifically, the reference resistor in
Figure 9 is replaced by four reference resistors with binary weights (1, 2, 4, and 8) [
31] which are configured in a switchable array, enabling adjustment of the tuning current by digital means, as shown in
Figure 24. The typical resistor used in the automatic tuning circuit is split into four unit resistors. Each unit resistor comprises two passive resistors with opposite
T.
C. They are series-connected to achieve close to zero
T.
C. for the combined resistor
Runit.
Table 9 shows the device types and sizes for the binary-weighted reference resistor array.
As a result, the resistance tuning range is significantly expanded, achieving values from approximately 430.5 kΩ to 1.71 MΩ. This corresponds to a tuning range greater than ±50% around the nominal value, which is denoted as 887.4 kΩ in this design. The resistance of ActR in response to the change of frequency is shown in
Figure 25. It can be observed that the ActR resistance remains constant when frequency is up to about 4.6 kHz before dropping in value. This design provides enhanced flexibility and control over the resistor’s value, thus making it suitable for various application requirements.
The performance comparison demonstrates that the proposed active resistor design achieves technical merits such as process sensitivity, temperature stability, wide tuning range of the resistance, very low power consumption and good linearity. The performance results of active resistors are compared with those of the representative reported works in
Table 10.
Since many ActRs can share the same control unit, the overhead design for the proposed work is significantly reduced when compared to others [
3,
6,
33] in which each active resister relies on an individual control unit. Referring to
Table 10, the proposed design achieves a process sensitivity of 0.64% corresponding to the resistance variation, which is lower than that of prior works with sensitivity of 1.33% [
9]. With the automatic tuning circuit, the temperature coefficient (
T.
C.) is reduced to 57 ppm/°C over a wide temperature range of −25 °C to 85 °C with the sensitivity of 17.55%. The
T.
C. with the tuning circuit is 80 times lower than that without the tuning circuit. It is a significant improvement compared to
T.
C. of up to 500 ppm/°C in earlier designs [
6]. These results have shown the robustness of the proposed design against process and temperature variation through the effective use of automatic tuning and temperature compensation techniques.
In terms of linearity, the reported design has achieved a good result of 2.4 × 10⁻² V−1. Regarding power consumption, the single active resistor only dissipates 0.25 µW under a low bias control current of 121 nA. Additionally, the total power consumption of the active resistor with the automatic tuning circuit is approximately 13 µW. When the charge pump is included, the overall power consumption is 42 µW. These indicate that it is suitable for realization in low-power and compact systems.
As interpreted from
Table 10, it can be observed that after applying the tuning circuit, the temperature and process sensitivity increase in value, though not by much. This is primarily because the tuning circuit forces ActR to track the temperature behavior of the passive resistor
R, whose resistance value can vary differently across process corners and temperature variation. Another reason is that of the variation of the tuning circuit’s loop gain under different process corners. To verify the issues, the
T.
C. of the passive resistor
R and the loop gain pertaining to loop
2 variation across five standard process corners are evaluated and shown in
Table 11.
The slight change in the T.C. of the passive resistor across process corners and the moderate loop gain fluctuation in the tuning circuit contribute the imperfections in this circuit implementation. However, as can be observed from the good stability in overall performance, their influences are considered insignificant.
In summary, the proposed active resistor has demonstrated an excellent balance among power, linearity and T.C., while addressing key limitations of earlier reported designs and offering an economical design perspective in which many PRs can share one common control unit.
To demonstrate the practical application of the proposed active resistor, a tunable Sallen–Key low-pass filter (SKLPF) [
34] is implemented and illustrated in
Figure 26. In this design, the conventional passive resistors
R9 and
R10 are replaced with the proposed active resistors, enabling electronic tuning of the cutoff frequency
fc. The
fc and the quality factor
Q of an SKLPF are defined as follows:
where
R9 and
R10 are the tunable active resistors, and
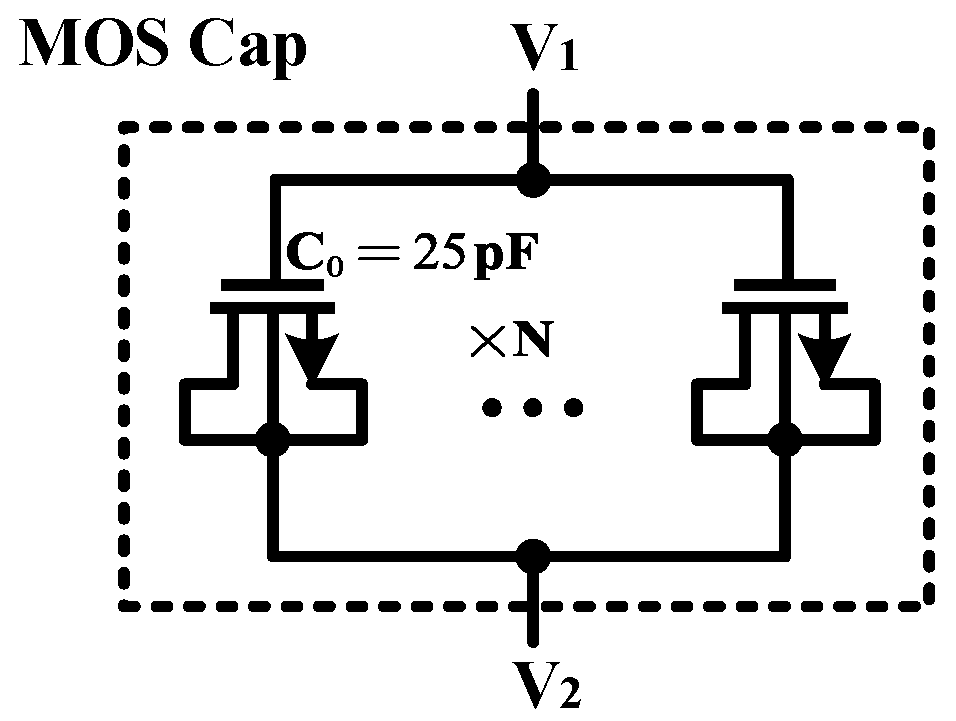
C9 and
C10 are the active capacitors realized by the MOS capacitor, as depicted in
Figure 10. Considered without peaking effect, the quality factor
Q is set to 0.707 (Butterworth response). In this design,
R9 =
R10 and
C9 = 2
C10 = 200 pF.
To validate the tunable function of ActR, the binary-weighted reference resistor array is applied in the design.
Figure 27 shows the plot of different frequency responses of the SKLPF with reference to that of benchmark implementation using an ideal resistor
R. Their cut-off frequencies are summarized in
Table 12.
As shown in
Table 12, by tuning the resistance values of
R9 and
R10 within the range of 430.5 kΩ to 1.714 MΩ,
fc is dynamically tuned from 0.627 kHz to 2.496 kHz. Additionally, the cutoff frequency
fc of the Sallen–Key low-pass filter using the proposed ActR closely matches that of an ideal resistor. Across various tuning configurations, the deviation remains within 5%, with the maximum error being only 4.3%. The slight reduction in
fc can be attributed to the intrinsic parasitic effects of the MOSFET-based ActR, which effectively increase the total capacitance in the circuit and slightly shift the frequency response downward. Despite this minor variation, the ActR maintains reasonable accuracy and reliability, particularly for low-frequency applications. The results have confirmed that the proposed tunable ActR can be a good replacement to a passive resistor in integrated filter design.
Taking routing area into account, the estimated layout area for each circuit block is stated in the following. They are summarized in
Table 13. As can be seen, the active resistor core occupies approximately 150 × 35 μm
2. The single op-amp consumes 30 × 20 μm
2. The automatic tuning circuit with the binary-weighted reference resistor array is 150 × 35 μm
2, and the DCP occupies 300 × 255 μm
2. Hence, the overall layout area is approximately 0.096 mm
2 or 320 μm × 300 μm. Of particular note is that the charge pump and the core tuning circuitry serve as the common resource of the tunable resistor system; the actual active resistor area is small and they can be applied on a large scale without requiring significant silicon area or power consumption.


