1. Introduction
The decarbonization of the industrial sector is essential for achieving sustainability targets and reducing the reliance of industrialized economies on fossil fuels. The industrial sector accounts for about one-third of global energy demand, with most of the demand being heat and the remainder being electricity [
1,
2]. Approximately 50% of industrial heat is required at low (<150 °C) and medium (150–400 °C) temperatures, which are essential for a wide variety of industrial processes.
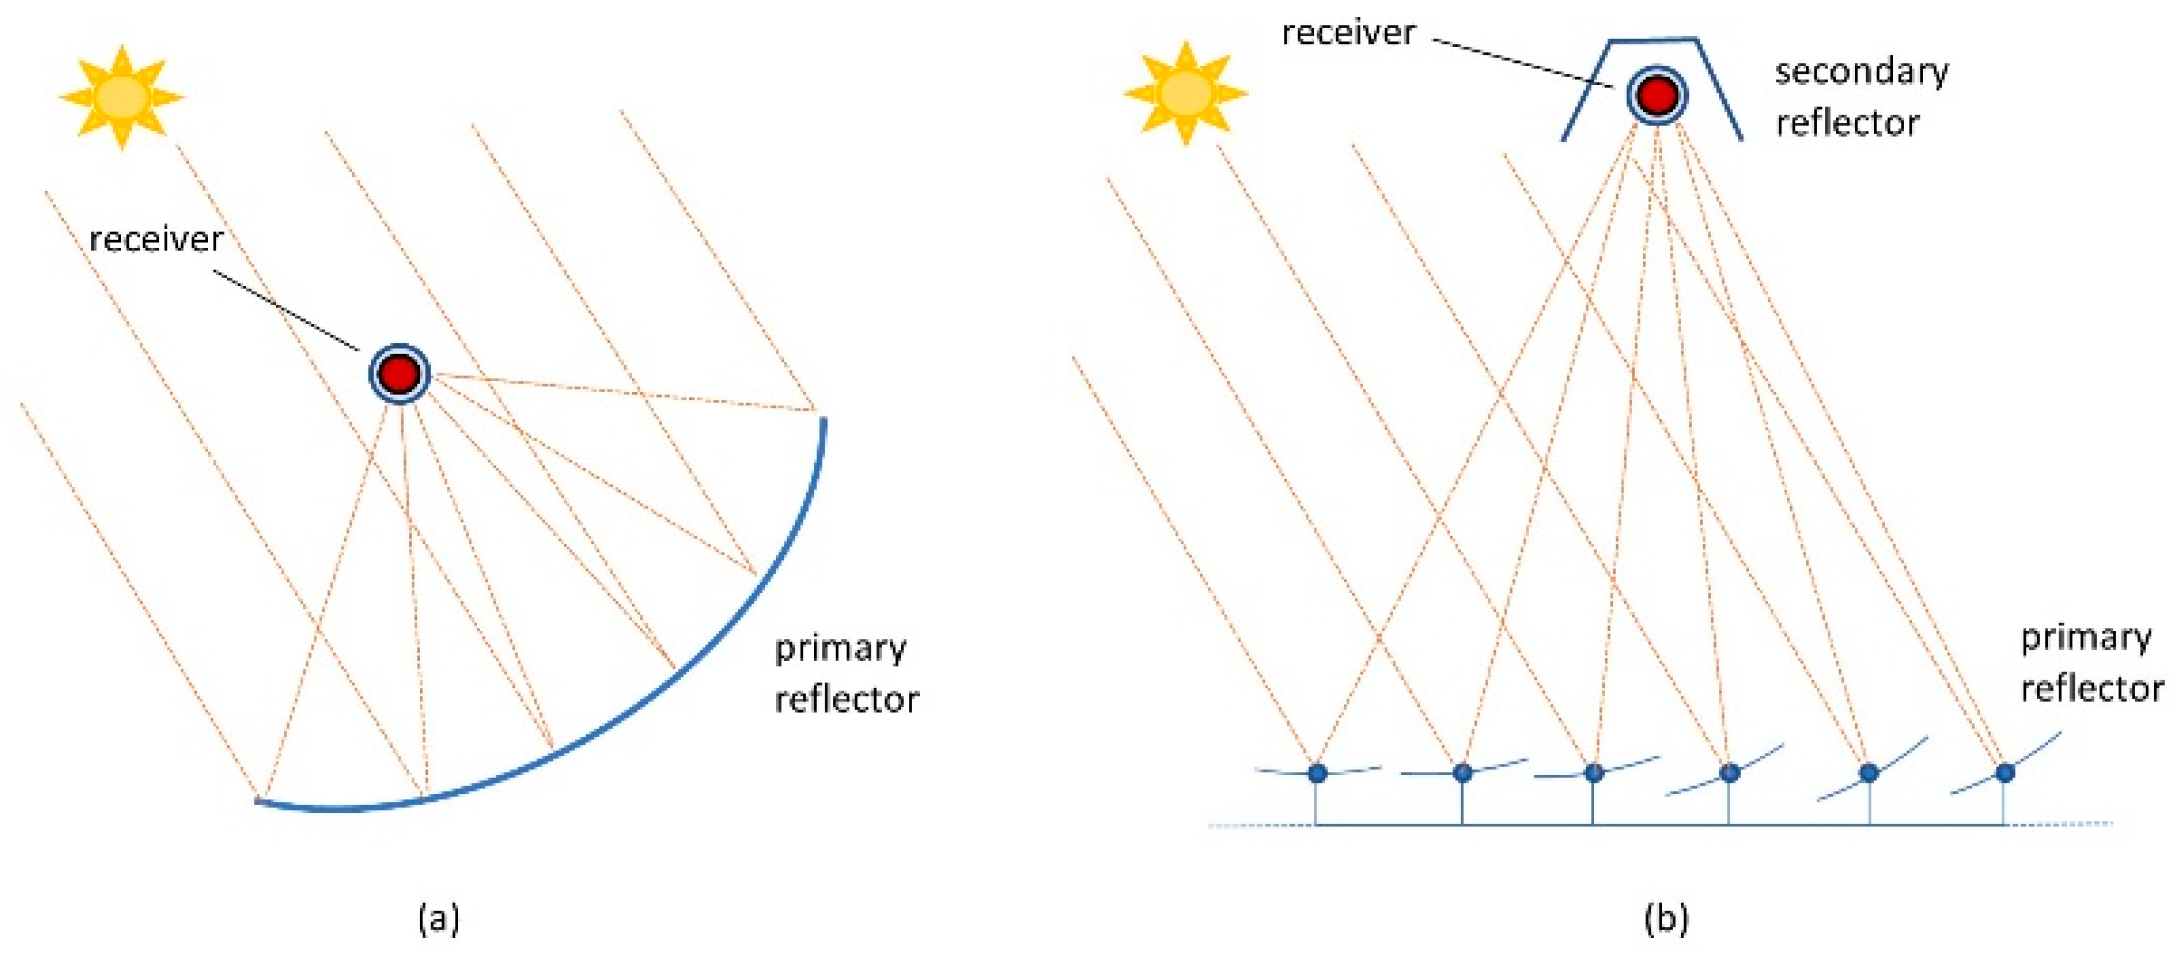
Solar thermal technologies (STs) can efficiently supply heat across different temperature ranges at competitive costs. Concentrating solar thermal (CST) technologies, such as parabolic trough collectors (PTCs) and linear Fresnel collectors (LFCs), perform well in the low and medium temperature range and offer high efficiency. These technologies are available in modular forms and at various scales, with costs steadily decreasing. Both LFCs and PTCs,
Figure 1, are commercially available for Solar Heat for Industrial Processes (SHIP) applications. Farjana et al. [
3], among others, describe typical applications of CST for industrial heat supply across several industrial sectors.
According to the Solar Heat Worldwide 2024 report [
4], at the end of 2023, the total operational solar thermal capacity reached 560 GWt. Among them, a minor share is devoted to SHIP, with an estimated capacity of 951 MWt and a total number of plants of approximately 1200 systems for a 1.4 million square meters collector area. Although non-concentrating solar collectors had been the dominant solar thermal technology in the market for years, by 2023, concentrating collectors had become the predominant choice, especially in industrial systems. According to the reported systems in [
5], by the end of 2023, 26 LFC systems were in operation with a thermal installed power of 12 MWt, while PTC technology is used in 72 systems with a total installed thermal power amount of 482 MWt.
In industry, steam is widely used as a heat carrier for the heat supply from 100 to 200 °C. Industrial steam is mostly produced from fossil fuels, mainly in gas-fired steam boilers. The steam boilers inject saturated steam into the steam distribution network of the factory, which brings it to the thermal processes.
The integration of concentrating solar thermal technology into an existing conventional steam generation scheme can be addressed in several ways. Common integration concepts have been identified in [
6]. It can take place at the process level, directly supplying heat/steam to individual processes, or at the supply level, hence supplying solar heat to the heat distribution network of a factory. Integration can be implemented in parallel with the main steam boilers, providing a fraction of the total steam needed or, in a series, preheating the feeding water. With respect to solar installation, the steam generation can take place directly into the solar receivers as direct steam generation or indirectly through a primary heat transfer fluid (HTF) heated in the solar field, which supplies heat to a kettle reboiler steam generator (SG).
Solar photovoltaic (PV) energy is rapidly gaining market share because of its decreasing costs and is now the leading solar technology in the electricity sector. In industrial applications, photovoltaic energy is not only used to meet conventional electricity demand but is also becoming increasingly relevant for providing process heat. Additionally, electrifying industrial thermal demand is a key strategy in a landscape with high renewable energy penetration in the electrical grid. “Power-to-heat” solutions, which harness solar and renewable electricity for industrial heat supply, are now essential and highly attractive. Electrical industrial steam boilers are capable of producing steam from electricity [
7]. Electric heaters (resistive or induction-based) are widely applied in industry for process heat applications.
Among the power-to-heat options, heat pumps (HP) are suitable solutions for using electricity, either coming from the grid or a local solar PV, for thermal purposes. They can lift ambient or waste heat (heat source) to a higher temperature (heat sink) with reduced electrical consumption, according to their coefficient of performance (COP). Although commercial and industrial heat pumps are limited to low-temperature applications, recent developments are bringing to the market high-temperature heat pumps (HT-HP) capable of providing heat above 150 °C [
8].
Arpagaus et al. [
8] reviewed the high-temperature heat pump state-of-the-art, identifying several technologies and providers. Most of them have a sink temperature between 90 and 160 °C. They report on increasing research activity aimed at raising the sink temperature above 120 °C, aimed at industrial low-pressure steam generation. The main barriers found in the literature on the technical aspects refer to the lack of high-temperature suitable refrigerants and the lack of integration. Moreover, from a commercial perspective, the lack of demonstrators, lack of knowledge on integration possibilities, as well as low level of awareness of potential among industrial users are identified as the main barriers to their wide adoption. Insights on the state-of-the-art of high-temperature HP are given in [
9]. They consider several types of heat pump providers, indicating that several technologies are reaching maturity, providing heat up to 180 °C. More challenging projects aimed at 250 °C heat supply are ongoing. The more promising ones are based on reverse Brayton with CO
2 and multistage vapor compression cycles with water. They pointed out that steam compression is suitable where heat supply and source have a constant temperature, while vapor compression with zeotropic mixtures or gas cycles as reverse Brayton is better with large temperature glides, typical of single-phase fluid heating. Additional insight into steam-generating heat pumps for industry can be found in a detailed review by [
10] as well as by [
11]. The database provided by Annex 58 [
12] reports 34 HT-HP models with a Technological Readiness Level (TRL) from 4 to 9 and sink temperature between 100 and 280 °C,
Table 1.
The HP by Spilling is a steam compressor device that works with a three-stage piston compressor to upgrade steam from 120 °C/2 bar up to 210 °C/19 bar with a maximum of 280 °C/40 bar. The Enerin model is a Stirling-type heat pump using a cycle with helium as a fluid. Q-pinch technology is inspired by the adenosine diphosphate cycle in living cells to set a phosphate absorption heat transformer. It is driven by residual low-temperature heat and only uses power to drive centrifugal pumps. The Piller HP does not use refrigerant but the process fluid water–steam, being a centrifugal single-stage compressor able to upgrade the low-pressure steam up to the required pressure and temperature level. Turboden HP works on the reverse Rankine cycle using different fluids and reaches a temperature lift of 100 °C, with sink temperatures up to 200 °C. The Olvondo HP is a reserved alpha, double-acting Franchot Stirling cycle with helium as fluid. ToCircle is a mechanical vapor recompression system able to upgrade low-pressure excess steam up to 180 °C/20 bar. The Kobelco model is composed of a heat pump unit lifting residual heat to 115 °C for heating a pressurized water steam, which then goes into a flash tank. The vapor is compressed in the vapor compressor unit, which provides up to 175 °C/8 bar saturated steam. The Heaten HP is a piston compressor device working up to 200 °C.
Considering the recent literature, several studies are devoted to assessing the techno-economic viability of solar heat production for industrial processes using CST, either LFC or PTC. Bolognese et al. [
13] analyzed the integration of solar heat into an industrial pasta factory through a techno-economic analysis of several CST technologies, including PTC and LFC. Buscemi et al. [
14] studied an LFC plant for process heat in a pasta factory in Italy, carrying out a detailed techno-economic analysis. Masera et al. [
15] analyze steam production using LFC collectors using different integration concepts, such as direct and indirect steam generation, focusing on the dairy industry. Quiñones et al. [
16] assess the potential application of non-concentrating collectors and PTC as heat sources for the Chilean mining industry, identifying the energetic and economic performances for their comparison with conventional fossil fuels. Silva et al. [
17] implemented a methodology for the optimization of solar fields using PTCs for industrial process heat supply, considering either technical and economical and a multi-objective approach. Although they are an emerging technology, high-temperature heat pumps have been considered in several studies for industrial heat. Vieren et al. [
18] studied the potential of vapor compression heat pumps for supplying heat in the chemical industry. They carry out an energetic and financial analysis for saturated and superheated steam production. Marina et al. [
19] used a bottom-up approach to assess the potential of industrial heat pump application in European countries, focusing on several industrial sectors such as the food, paper, chemical, and refining sectors and considering a maximum sink temperature of 200 °C.
Although CST and HP have been studied for their applications to industrial steam generation by the abovementioned studies. In addition, a few works focus on comparing them from a technical and economic perspective and consider the possibility of hybrid configurations. Among them, [
20] compared different options for low-pressure industrial steam production at 120 °C and 150 °C: linear Fresnel collectors, electric boilers, high-temperature heat pumps, and absorption heat transformers. They apply a techno-economic analysis to assess the potential of European industry. Rosales-Pérez et al. [
21] review the possible hybrid configurations using solar thermal and other heat supply technologies, including HP assisted by PV, focusing on assessing the potential and identifying the key performance indicators. Nevertheless, this study mainly refers to low-temperature heat applications. A comparative techno-economic analysis of CST and HP for industrial steam generation is carried out in [
22]. They consider a high-temperature heat pump and commercial PTC with a small aperture for steam generation at 140 °C/3.9 bar. They additionally consider hybridization possibilities, assessing performance through numerical simulations. Study [
23] carried out a multi-objective optimization for the side-by-side CST and PV installation for effective industrial heat production. Three objective functions, including economic, technical, and environmental, are applied individually or in combination to assess the optimum mix of solar technologies. The methodology is applied to different locations across the world. In the framework of the SUSHEAT project, study [
24] analyzes the potential of hybrid configurations, including HTHP, CST, and TES, to decarbonize European industrial thermal energy consumption between 150 and 250 °C, upgrading industrial waste heat. In the same project, study [
25] considers the implementation of a digital twin to optimize the hybrid configuration.
From the consulted literature, CST and HP technologies are attracting attention as decarbonizing solutions for industrial steam generation. Nevertheless, due to the large variety of technologies available, the continuous evolution of their performances and costs, and the multiple possibilities of integration offered, a comprehensive assessment of their potential is still needed.
This study analyses the generation of steam for industrial applications using commercial linear Fresnel as CST and the pre-commercial Stirling-type high-temperature heat pump powered by photovoltaic solar energy. The configurations considered aim at indirect steam generation at 8 bars, which is largely used in industrial processes. Detailed techno-economic modeling allows for the assessment of their potential application in European countries. This study proposes a methodology for hybridization, giving insights into the potential advantages and limitations. This work is an extended version of the conference paper [
26].
2. Methodology
2.1. Integration Schemes
Steam is widely used as a heat carrier in industry. In most cases, it is produced by a conventional gas-fired steam boiler and distributed to several processes through a dedicated steam network. The condensate is driven back to the steam boiler. An alternative source, such as solar thermal or any other renewable technology for decarbonization, can deliver heat to partially substitute or complement the main steam boiler in a few ways, including the preheating of the condensate or generating steam in parallel to the main boiler. Parallel steam generation is analyzed in this study, being a preferable industrial option, which minimizes the impact of integration on the conventional steam generation system. As a drawback, it requires the solar or renewable steam to be provided at the same condition imposed by the main boiler, being introduced directly into the same steam network. Commonly, steam conditions in industry range between 4 and 8 bar, covering a large variety of uses in several sectors (food and beverage, pulp and paper, and manufacturing, among others).
Considering concentrating solar thermal as a heat source, steam can be produced by direct evaporation of the water in the solar field or indirectly in a dedicated kettle reboiler steam generator (SG), heated by a heat transfer fluid, which can be pressurized water or thermal oil.
The integration scheme chosen for this study for CST is the indirect generation of steam in parallel to a conventional natural gas steam boiler,
Figure 2. The kettle steam generator is fed by condensate from the industrial network while the heat is supplied through a primary heat transfer fluid circulating in the solar field. The saturated steam generated by the kettle is injected into the industrial distribution network. In this study, the heat transfer fluid is pressurized water, which is a commonly used option in the expected temperature range (150–200 °C).
In addition to being a common option for CST, indirect steam generation is also a suitable scheme when using a high-temperature heat pump (HP) as an alternative heat source. The HTF is heated at the high-temperature side (sink) of the HP and delivers heat to a kettle reboiler parallel to the main boiler. In this study, the configuration of
Figure 3 is analyzed, with an HP heating up a pressurized water circuit. The HP is driven by a PV plant installed at the factory. The use of grid electricity for powering HP is out of the scope of this work. The low-temperature side (source) of the HP can absorb heat from a low-temperature waste heat source as well as from the ambient air. The higher the temperature of the waste heat, the higher the COP and the performance of the HP. Nevertheless, waste heat is rarely available, the industrial processes being mostly optimized. In this study, the heat source is ambient heat provided by liquid water at a condition of 25 °C as a reference.
In addition to comparing CST and PV-HP steam generation from an energetic and economic perspective, the possible combination of the two schemes in a hybrid configuration is analyzed. In this configuration, CST and PV-HP are combined in parallel to heat up the pressurized water, which then delivers heat to a unique kettle reboiler, as shown in
Figure 4.
2.2. Modeling
The energetic and economic analysis of the proposed steam generation schemes is carried out through numerical simulation. A steady-state model of each configuration is implemented and run for each hour of a typical meteorological year (TMY) to obtain annual results.
Detailed numerical models have been implemented in Python 3.12 and include the SG vapor generation, the concentrating solar field CST, the photovoltaic solar field PV, and the heat pump HP, in addition to the control algorithm appropriate for each configuration. In addition to the energetic model, the economic model of the components considered is also implemented. The models for CST and PV were verified against the validated simulator GREENIUS [
27], reporting agreement in the results within the
tolerance. HP models have been implemented using the manufacturer data sheet [
28] and validated performance characteristics. Cost estimations of components considered in the analysis rely on the updated off-the-shelf data and parameters reported in the technical literature. Geographical variation in the installation cost of technologies is not considered in this work, and average values are assumed.
2.2.1. Steam Generator SG
A kettle-type steam generator is placed parallel to the main steam generator (boiler, BO), which requires saturated steam to be identical to the main boiler. On the steam side, the conditions are defined by the saturated steam pressure and the temperature , while water inlet temperature is defined by the condensate return line.
On the liquid side, a fixed temperature difference is considered
. The variation in the useful thermal power delivered by CST or PV-HP,
, is taken into account as a mass flow rate variation
. Transient aspects of the steam generator are neglected so that a steam flow rate
is provided according to steam generation thermal power
, water–steam specific latent heat
, and liquid sensible specific heat
Equation (1).
As the primary liquid is pressurized water, the pressure on the liquid side
is set above the saturation temperature to avoid two-phase flow,
, being
an overtemperature parameter for safety. Outlet water temperature
is defined based on the given steam temperature
as
, being
the temperature difference required inside the kettle for an effective heat exchange and
. The design parameters are reported in
Table 2. A steam pressure of 8 bar is considered as the reference case, corresponding to a saturated steam temperature of 170 °C. The primary water circuit is pressurized at 23.4 bar, with a temperature inlet/outlet of 180/210 °C.
Simplified estimation of the installation costs
of the SG steam generator is obtained from the area of the heat exchanger
, given by a heat transfer reference value
, Equation (2).
Corrective factors that consider the pressure
and the material
are applied to the base cost
, [
29]. Equations (3)–(5), with
and
of stainless steel, and
conversion factor USD to EUR,
in
and pressure
in
. The
accounts for inflation, according to the CEPCI index [
30].
2.2.2. Concentrating Solar Thermal CST
A linear Fresnel collector is chosen as CST technology in this work. Although parabolic trough collectors are the dominant technology in CSP projects devoted to electricity production, LFC is gaining attention as a suitable solution for process heat generation. The segmented primary reflector allows for smaller mirror apertures, minimizing the cost of tracking systems as well as foundation, thanks to lower wind load. Although LFCs have lower optical efficiency than PTCs, they offer some other technical advantages, such as the fixed receiver, avoiding the complexity of flexible connections and associated leakage risks.
A commercial LFC manufactured in [
31] is selected for techno-economic analysis. The main technical features are reported in
Table 3. The LFC is equipped with a single standard evacuated tube receiver, ensuring high thermal efficiency.
The solar field is composed of loops with the same orientation and length, hydraulically connected in parallel between them. Each loop is formed by a row of collectors in series reaching a desired length .
The LFC is modeled by calculating heat flux
concentrated on the receiver’s perimeter
, by means of an optical efficiency
including a peak optical efficiency
, and two incidence angle modifiers (IAMs) for the transversal and longitudinal components of the zenith angle,
[
32]. Two additional parameters,
Table 3, account for the cleanliness level of the mirrors,
and for partial mirrors, failures, and malfunctioning through an averaged availability,
. Irradiance
and solar position is obtained using the Python library Pvlib [
33].
The row length
is not always irradiated because of the end losses effect, occurring at the extremities of the receiver for
when part of solar irradiance is concentrated out of the receiver length. This is accounted for by considering an effective row length
instead of
, Equations (8) and (9).
The length of the receiver is discretized into
elements for increasing the accuracy since the
as well as HTF properties are temperature-dependent and must be computed at each element. The thermal power generated by the fluid across a portion of receiver length
is obtained according to [
34] using the collector efficiency factor
and the heat dissipation factor
, Equations (9) and (10). Internal heat transfer
coefficient is computed using the Gnielinski correlation. The global heat transfer coefficient of the receiver tube
is obtained by means of a polynomial expression obtained from experimental data [
35].
In addition to the solar field, connection piping has been considered in the model for the computation of delivered thermal power , including an inlet and outlet pipe length for each row and a common inlet and outlet piping length for the whole solar field, connecting with the BOP. A formulation analogous to Equations (9) and (10) is used with and proper obtained from the thermal insulation layer thermal conductivity.
The solar field area is sized based on a given ground area
. Since the mirror aperture is
and the ground aperture, including proper spacing, is
, a land use factor
is defined for CST. The solar field area
is defined from the
The number of loops and their length are adjusted to fit the available area.
A simplified cost estimation is carried out on the basis of available information from the manufacturer. The installation cost of a solar field is obtained from an estimated cost per area
. This cost is retrieved from the manufacturer’s simulation tool [
36] implemented by [
31] for a large solar field without BOP, applying the CEPCI inflation correction factor [
30].
2.2.3. Solar Photovoltaic Field PV
The photovoltaic solar field is defined by the total area of PV modules
. Analogously to CST, the available ground area
is the initial design parameter. The land use factor
for the PV field is related to the PV tilt and the spacing between rows. In this study, two options are considered: the first one is installing the PV module horizontally, which is a typical solution for industrial rooftops; the second option considers an optimized tilt
, depending on the latitude (
of the location, according to [
37] Equation (13).
The spacing between rows
can be subject to optimization. Here, a widely accepted criterion is assumed, setting the distance as the ground projection of the shadow during the winter solstice when the solar zenith angle is
, Equation (14). The land use factor for a PV field is computed in Equation (15).
Mutual shadowing between consecutive PV rows still occurs at low sun elevation. Although it is often taken into account by an average annual value, here, the loss of direct irradiance due to shadowing is computed from sun elevation at each time step of the simulation. The portion of the module height shadowed
is obtained by geometric calculations, Equations (17) and (18) from the solar elevation
, solar azimuth
and PV azimuth
, and
Figure 5.
The power output of the PV field is obtained from Equation (20), considering the shadowing factor
Equation (19), and direct (normal to the PV surface) and diffuse irradiance,
and
the PV area,
, and the conversion efficiency,
Irradiance
and
and solar position were computed using the Python library Pvlib [
33].
The conversion efficiency of the PV module
is influenced by several factors. In this study, a simplified model is implemented as in Equation (21), including a conversion efficiency term
of the panels, the inverter efficiency
, the cleanliness of the solar field
the effect of aging through an averaged value
, and the energy lost by Joule dissipation in wires and electrical connections,
.
According to the Greenius PV simulator model [
27], electrical conversion efficiency
is related to module temperature and load conditions. The peak efficiency at reference ambient condition
and nominal load
; it reduces into partial load as described by Equation (23), being
the solar irradiance and
the peak solar irradiance. In addition, the efficiency drops with an increased temperature of the cell, which is estimated as in Equations (24) and (25) from
considering the irradiance
and a coefficient
. These parameters are summarized in
Table 4.
The PV installation cost is obtained from the cost per peak power from a world average computed by [
38] for utility-scale projects, resulting as
, Equations (26) and (27). As for other technologies, geographical variation in PV installation cost is not considered in this work.
2.2.4. High-Temperature Heat Pump
The high-temperature heat pump considered is a pre-commercial Stirling-type model manufactured by Enerin [
28]. The real
of the heat pump is obtained from the ideal
, according to the efficiency
reported in [
39], as a function of the average temperatures of the heat source temperature
and the heat sink temperature
The
variation with the mean sink and source temperatures is depicted in
Figure 6. The heat transfer fluid is pressurized water on both low and high-temperature sides, with maximum temperature glides of 25 °C and 40 °C, respectively. The maximum temperature drop (lift) indicated by the manufacturer is 200 °C, with a maximum heat sink temperature of 250 °C. The heat supply capacity is between 0.3 MWt and 10 MWt (Annex 58 Task 1). The installation cost is calculated from the unitary cost of sink thermal power
as
, being the thermal power delivered by HP at nominal conditions. The HP is sized according to the peak power of the PV field, according to COP at the given nominal temperatures, Equation (30). HP design parameters are reported in
Table 5. Under the conditions of the present study, the
is achieved,
Table 5. Variation in performance with partial load operation has been included in the model on the basis of updated information provided by the manufacturer. A linear variation in COP with load conditions is modeled as the first approximation, assuming a 10% reduction in COP at 50% of load, in accordance with experimental performances reported by [
40].
2.3. Annual Energy Yield
The models allow to carry out annual simulations considering the typical meteorological year (TMY) for each location considered, which are obtained from PVgis [
41]. Hence, the simulation considers a time interval of 1 h, according to meteorological data.
The comparison of CST and PV-HP systems is carried out on the basis of the same ground area occupied by the solar field. Land availability in industrial areas surrounding the factories is, in most cases, the limiting factor for sizing solar installations, either thermal or photovoltaic. All provided solar heat is supposed to be used by the steam network; this assumption is equivalent to a continuous 24/7 thermal load with a nominal load higher than the peak solar thermal power. As reference value is considered. Nevertheless, it should be noticed that the main indicators used in this study are independent of the size, apart from parasitic losses, so that the results can be generalized for medium-to-large scale solar plants (thermal power greater than 1 MWt).
Hence, CST is defined assuming the same ground area so that and . The steam generator SG is sized according to the peak thermal power of CST and PV-HP, respectively.
For the hybrid scheme, the available ground area
is used by CST and PV so that
. A hybridization ratio
is defined as in Equation (31) to account for the land use partitioning, being
for CST alone and
for PV-HP alone.
As a result of the annual simulation, hourly values are obtained for the energy provided by the CST, PV, HP, and SG. Annual energy delivered as solar steam
per unit of ground area
is considered as key performance parameter,
, in Equation (32), together with the ground area per unit of energy provided,
, Equation (33).
Figure 7 shows the flowchart describing the main steps of the logic algorithm implemented to carry out the energetic and economic analysis.
2.4. Levelized Cost of Heat LCOH
The levelized cost of heat (LCOH) is used as the main economic indicator, Equation (37). The LCOH is the heat generation cost, as well as the minimum price that must be sold to recover the installation costs (CAPEX) and the operation and maintenance costs (OPEX) during the useful life of the plant. It is defined in a similar way to the level of energy cost LCOE used for the financial analysis of electricity production.
According to [
42], the LCOH can be estimated as in Equation (37), considering constant annual discount, assuming
,
years.
is a widely accepted assumption in solar systems.
3. Results
3.1. Comparative Analysis of CST and PV-HP
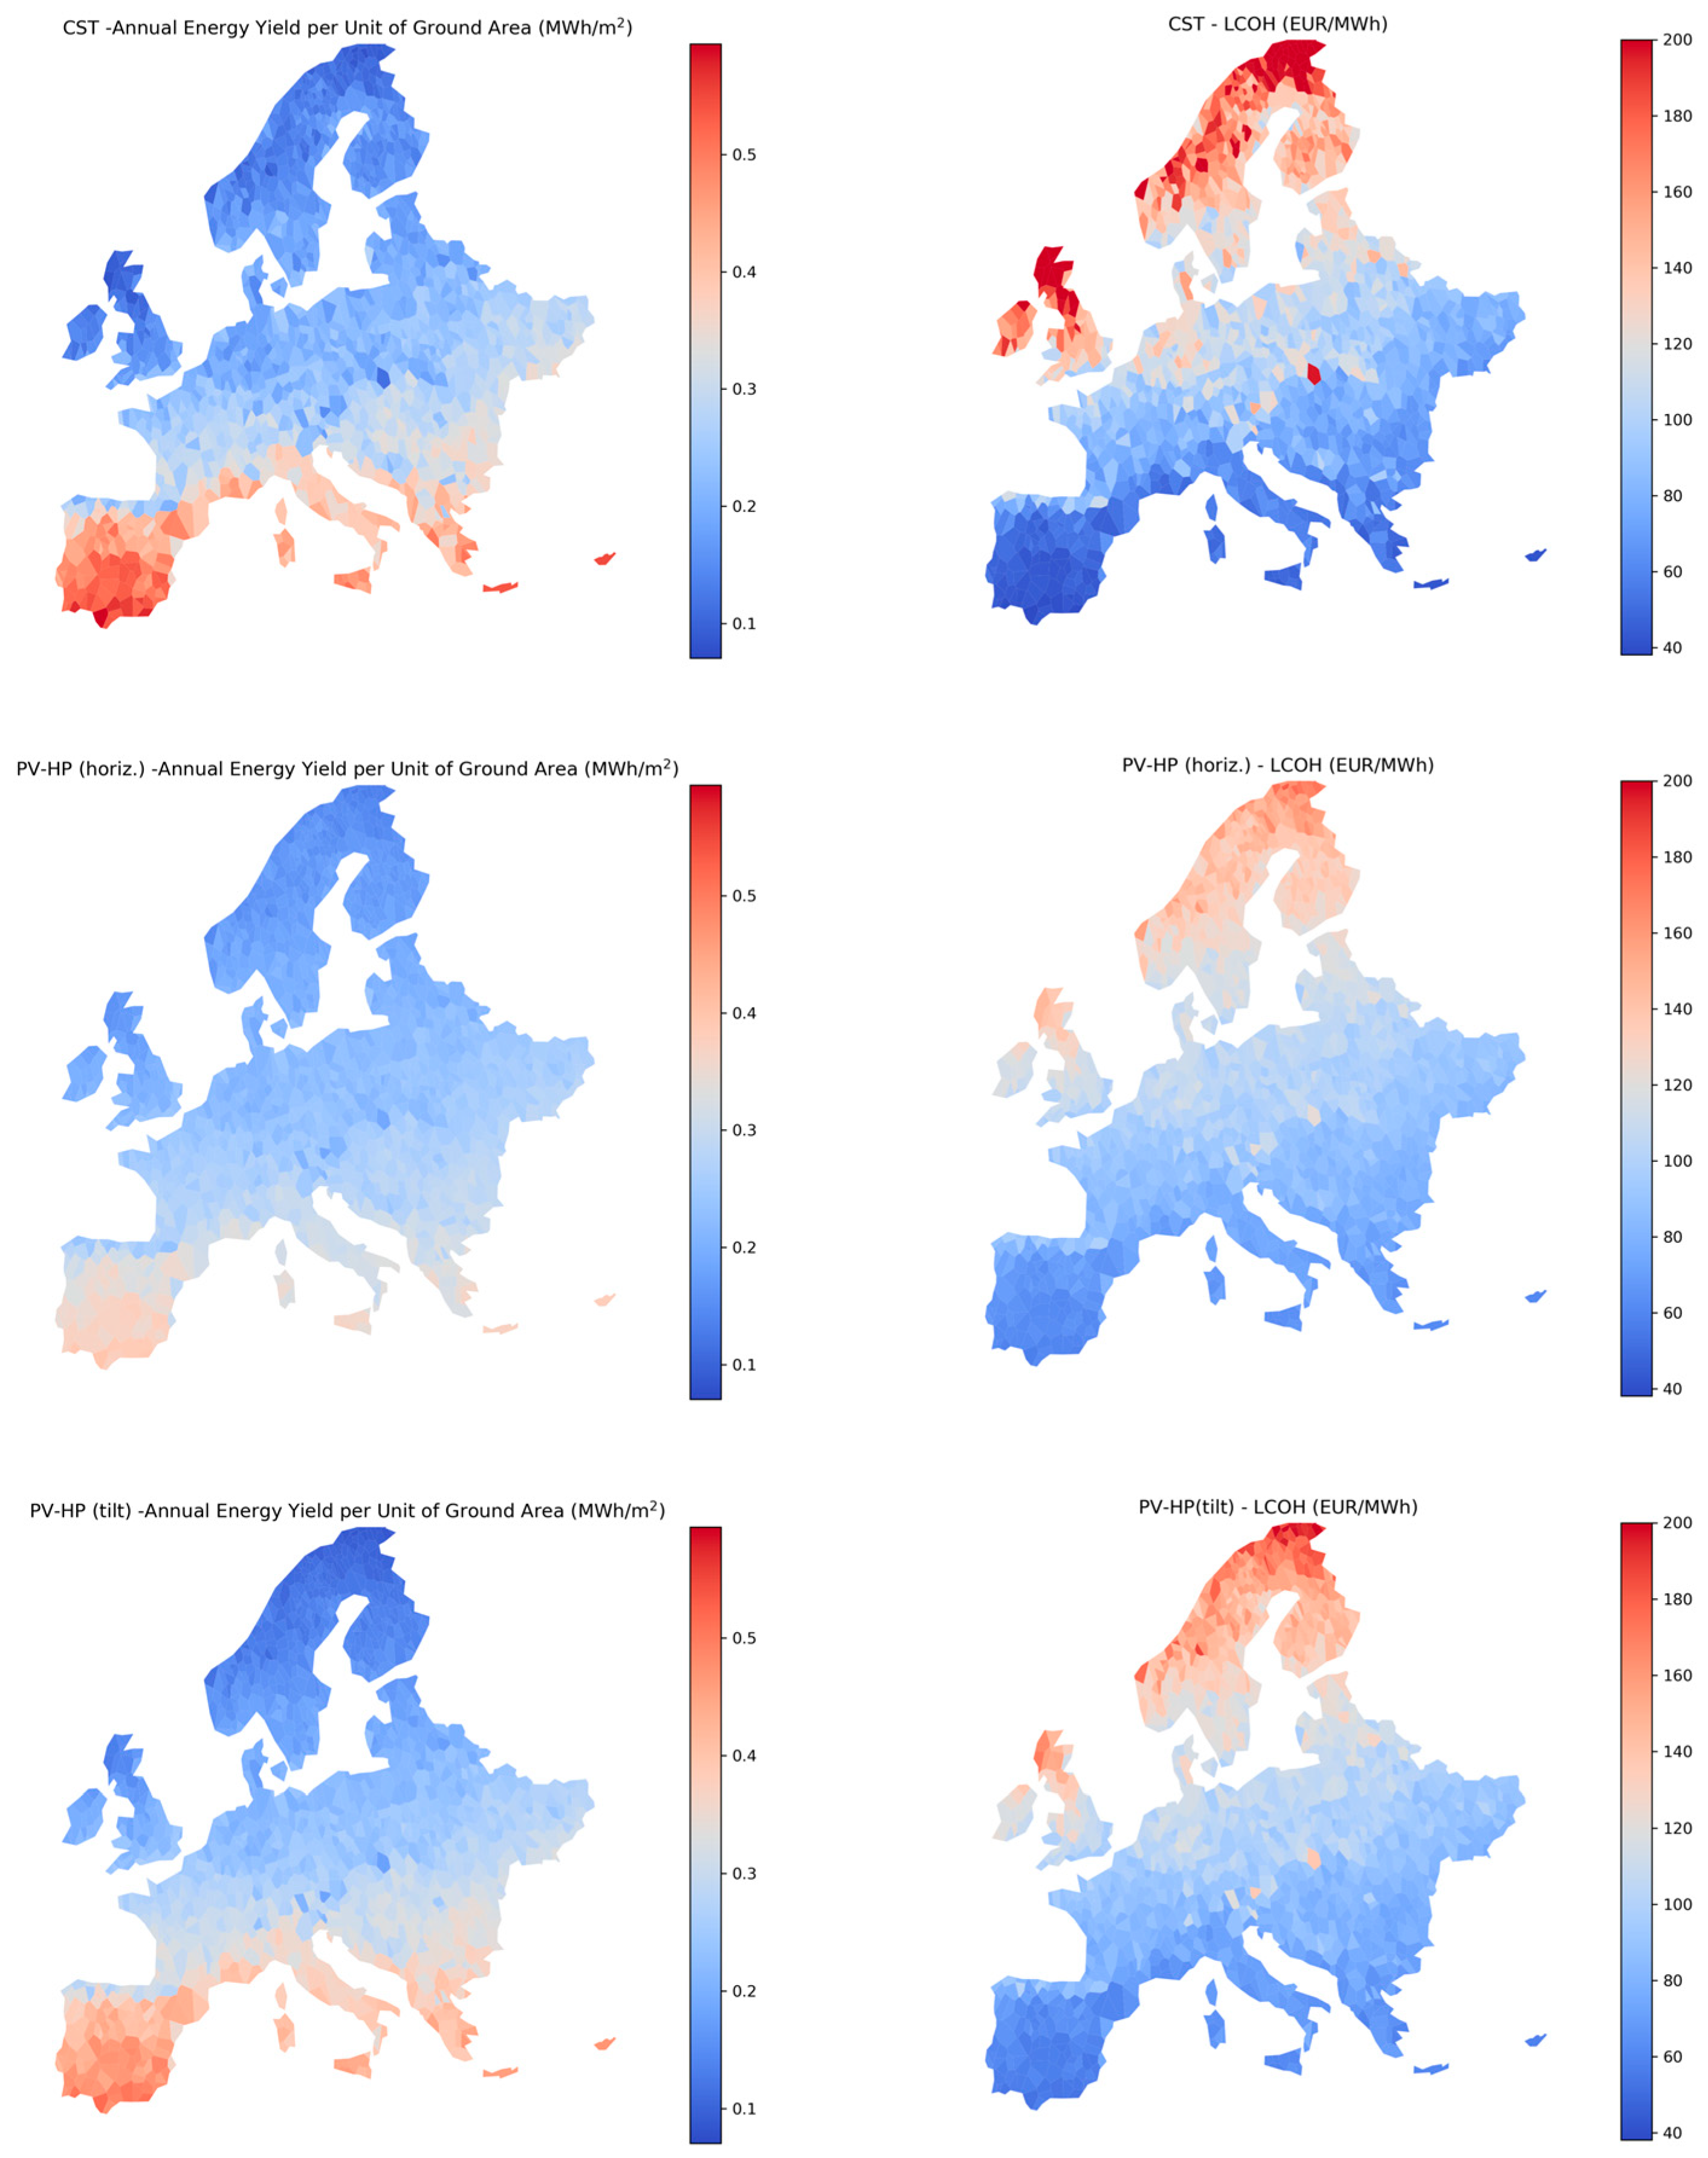
The comparative analysis is devoted to assessing the energetic and economic performance of CST and PV-HP steam generation schemes across European locations. The simulation of two configurations is carried out across each hourly interval of the typical meteorological year (TMY) to obtain annual results for any considered location. About 1000 locations are randomly selected across EU27 countries for the simulations. The PV-HP is simulated considering two different configurations, one driven by a horizontal solar field and the second one driven by a tilted solar field with optimal tilt
and associated spacing between the rows. As a key performance indicator, the annual energy yield per unit of gross area
is chosen, together with the
. The results are reported in a geographic map representation in
Figure 8 for CST, horizontal PV-HP, and tilted PV-HP cases.
Considering energy production, both CST and PV-HP show a remarkable variation across the considered location, as expected because of solar resource variation. CST gives the highest production above in southern Spain, decreasing to less than 0.1 in the Scandinavian region. The PV-HP has a lower peak production level for the southern regions but shows higher performance in the intermediate and high latitudes. The difference between the horizontal and tilted PV is appreciable mainly in the northern location, where horizontal PV gives slightly higher performance.
Upon examining g at economic figures, CST reached its lowest value at a low latitude (Spain), below
. The cost of CST energy is lower than PV-HP for southern European locations, while the trend is reversed in northern regions. For a direct comparison, the simulation results are plotted against the horizontal global radiation GHI in
Figure 9. It is possible to visualize the main trends. CST has greater energy performance for
, while the PV-HP produces more for lower
In terms of
, CST clearly has a lower cost for
. Below
the PV-HP has a clear lower
, with some overlapping in the medium
zone.
For each location, it is possible to identify which is the most favorable option between CST and PV-HP regarding both the energetic (
) and economic (
) key performance indicators. A geographical map representation is depicted in
Figure 10.
Figure 10a displays evidence that in southern countries such as Spain, Portugal, Italy, and Greece, CST maximizes the
. Looking at LCOH, CST is a favorable option in most of southern and central Europe,
Figure 10b. On the other hand, it is evident that for high latitude, PV-HP is the best option for both objectives. Similarly, at the lowest latitudes, CST is the best option for both objectives, whereas in the intermediate latitudes, the favorable option is not the same for the two objectives; see
Figure 10c. In the grey zone of
Figure 10c, the hybrid CST/PV-HP schemes have the potential to fit the requirements of both objectives by finding a trade-off between
maximization and
minimization.
3.2. Hybrid CST and PV-HP Scheme
To assess the potential of a hybrid configuration with CST and PV-HP, as shown in
Figure 4, several representative cities are selected and analyzed. Selecting fewer than 20 locations with diverse meteorological conditions and latitudes allows for in-depth analysis of each case while still providing a representative overview of the potential application on the entire European region.
For each selected city,
Table 6, a new set of simulations is carried out on the hybrid scheme, assigning different values of the hybridization ratio
. This represents the portion of the available ground area that is devoted to PV-HP. Varying
between 0 and 1, all the possible ground area partitioning between CST and PV for the CST/PV-HP configuration are included. The analysis aims at evaluating the best configuration between CST, PV-HP, or hybrid one on the basis of available surface area, for what the main energetic indicators are the annual energy yield per unit of ground area
and the ground area required per unit of energy provided
. LCOH is used as an economic indicator.
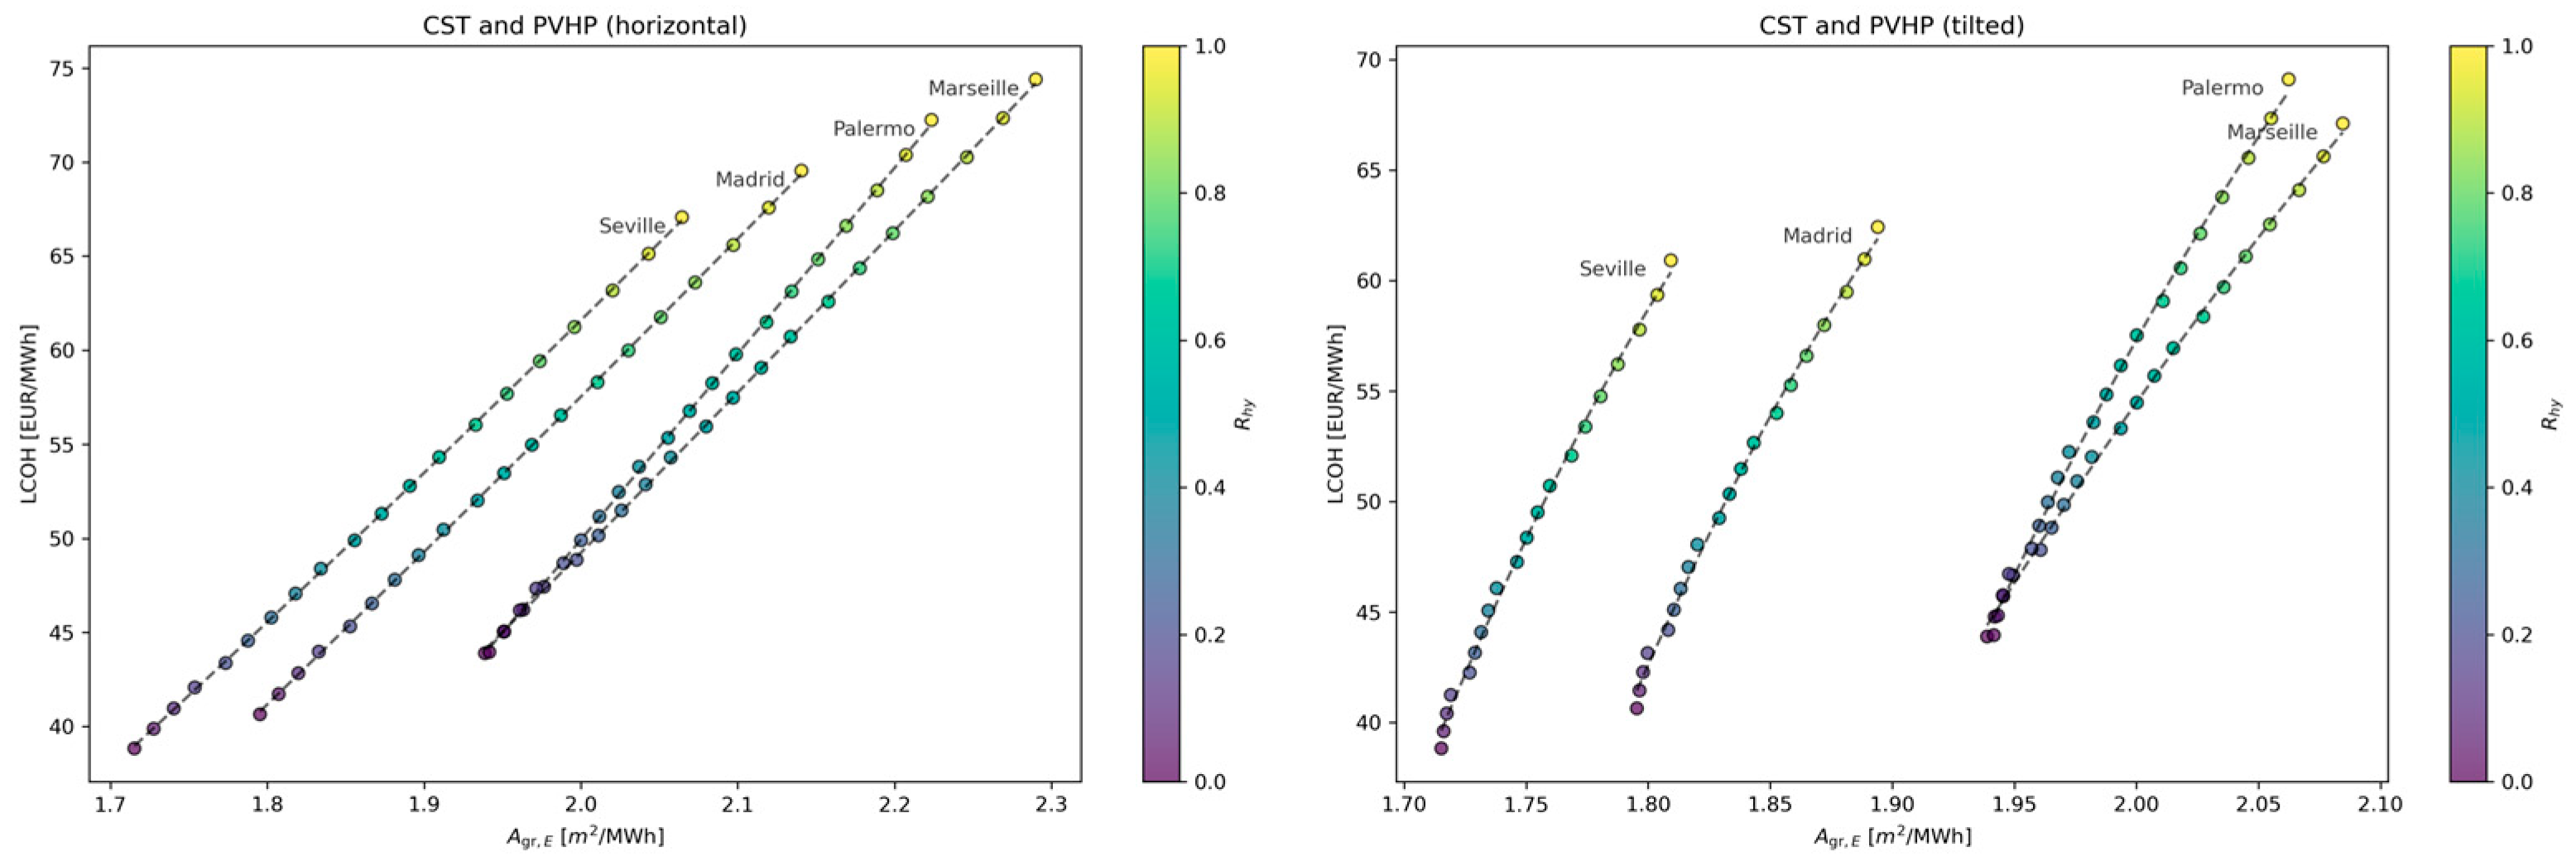
According to previous analysis, for high irradiance locations, CST is the favorable option both from an energetic and economic point of view. This is the case in cities such as Madrid, Seville, Palermo, and Marseille, where
is the best option, hence, with 100% of the available surface devoted to CST. This trend can be observed in
Figure 11, which reports the variations in
and LCOH with
either considering horizontal and tiled PV. As
increases from 0 (100% CST) to 1 (100% PV-HP), both
and LCOH increase.
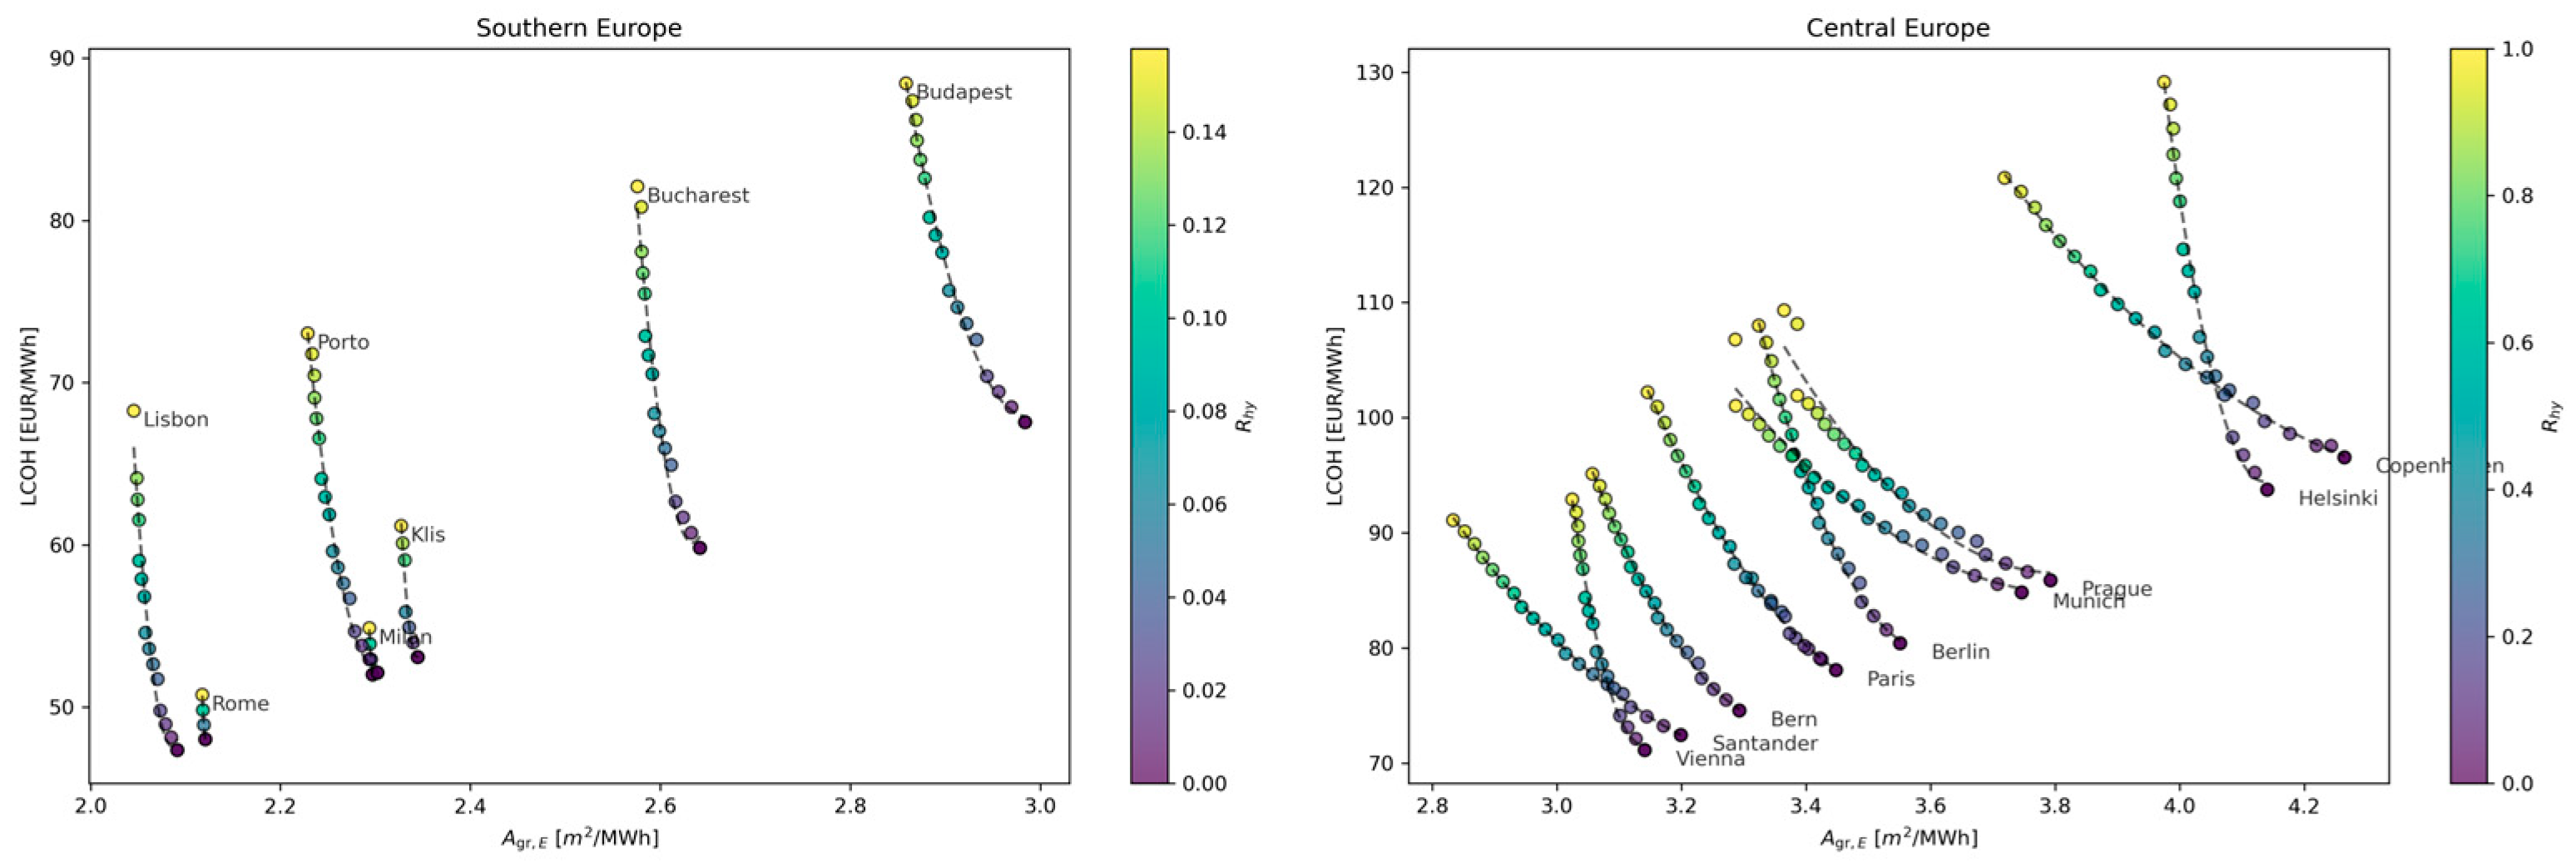
For medium irradiance locations, CST is still the favorable option for the economic indicator, while the PVHP has a higher hence a lower area is required per MWh provided . For these locations, a hybrid solution, CST-PVHP, would result in an optimal solution as a trade-off between the cost and required area.
Figure 12 shows the results for the selected cities. It is worth noticing that instead of
the reverse values
is reported on the horizontal axis so that an optimum solution would be able to minimize both values.
As a general trend, increasing the hybridization ratio from (100% CST) to (100% PV-HP) leads the required area to diminish with an increase in LCOH.
Bi-objective optimization can be successfully applied for the location where economic and energetic objectives lead to different solutions.
Figure 10 shows the results for the cities for which the two objectives give opposite results; hence, a Pareto front appears. It is worth noticing that only the best option is shown between CST-PVHP with horizontal and CST-PVHP with tilted modules.
For each location, identifying an optimum , hence, an optimum area partitioning between CST and PV-HP depends on the criteria selected by an expert decision-maker.
A simple decision algorithm, such as the minimum normalized weighted sum, can be applied to identify the optimum
once the weights for the two objectives are defined as in Equation (38):
The optimum hybridization ratio is the that minimizes the normalized weighted sum Equation (39).
Assigning the same weight to both objectives
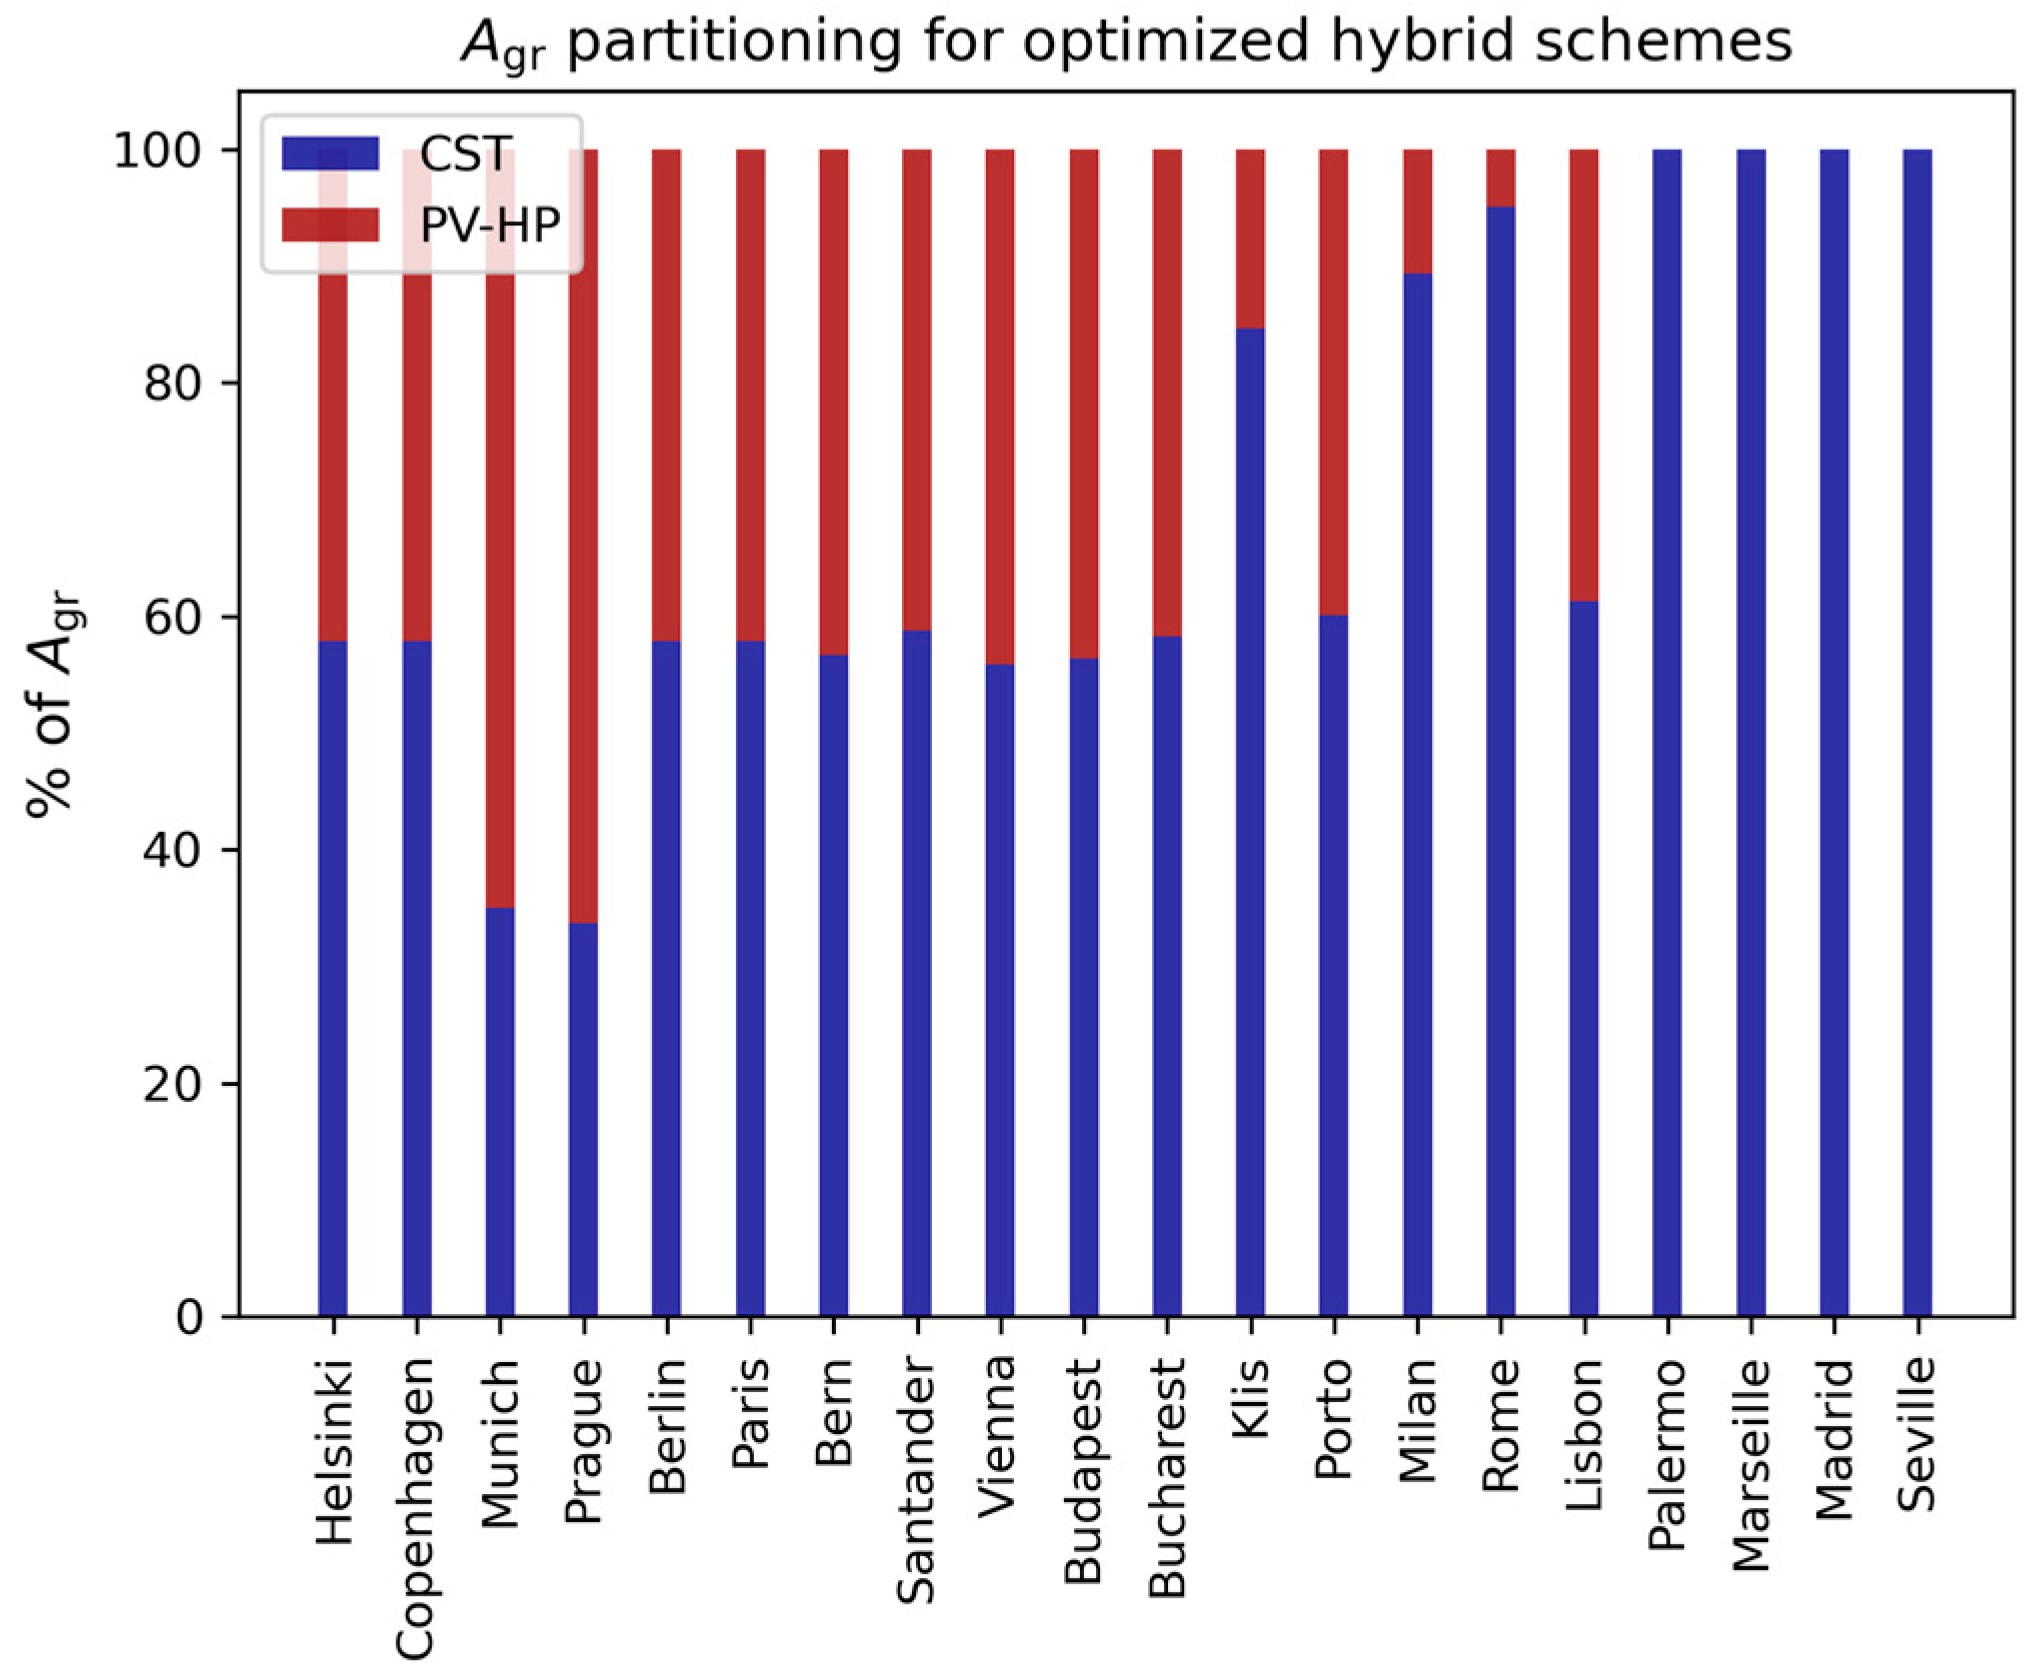
, the following results are obtained, as shown in
Figure 13, for each city, sorted by growing GHI.
is 100% devoted to CST for southern cities, then
decreases toward central and northern Europe (lower GHI).
The total amount of energy per unit of area provided by the hybrid system is shown in
Figure 14. The energy provided by each subsystem, CST and PV-HP, is also shown. The contribution of the PV-HP grows with the
for decreasing GHI.
The hybrid solution CST/PV-HP allows for an increase in the amount of energy provided per unit of ground area with respect to the CST alone for all the central European locations considered. This is shown in
Figure 15a, where the increments of
for the CST/PV-HP with respect to
for the CST alone are reported.
Figure 15b reports the increase in LCOH due to hybridization, as PV-HP has a higher cost with respect to CST.
For Lisbon city increases by 2%, showing a 40% in devoted to PV instead of CST alone, which is associated with a +14% of LCOH. As an example of a lower GHI location, Munich has an optimum PV area of 63% of , which provides an increment of +10% in annual energy , with an increase in the cost, +12% LCOH.
The illustrated methodology enables the determination of an optimal area allocation between PV and CST systems, balancing cost and specific energy yield. This approach is particularly relevant for locations with intermediate solar irradiance. In high-irradiance locations, CST tends to be the most favorable option, offering both higher energy yield and lower cost compared to PV-HP systems. The methodology is based on the assumption of a homogeneous, continuous, and flat area suitable for the installation of both PV and CST technologies. However, industrial sites may face other spatial constraints, such as parceled land with heterogeneous characteristics. While CST systems require homogeneous, continuous, and flat surfaces, PV installations are more flexible—they can be mounted on tilted surfaces, rooftops with limited load capacity, parcels, or discontinuous areas that can be electrically interconnected. Under these conditions, a hybrid system can improve surface utilization by identifying the optimal mix of CST and PV-HP technologies. Moreover, the analysis remains valuable for techno-economic evaluations in scenarios where the hybridization ratio is determined by external constraints rather than by techno-economic optimization.
4. Conclusions
This study analyses two configurations for solar industrial steam production: one that uses concentrating solar thermal CST and the other that considers a high-temperature heat pump driven by a PV solar field. The CST configuration employs a commercial linear Fresnel collector field. While PV is a mature technology, high-temperature heat pumps remain pre-commercial with medium-high TRL.
A techno-economic analysis is carried out using numerical simulation to assess the performance of the two configurations across a wide number of locations in Europe. The comparison is based on the same solar field ground area, considered as the limiting design factor, according to the constraints on land availability in industrial areas. Both tilted and horizontal PV are considered. Steam conditions are set to 8 bar pressure (), which is a common requirement in several sectors. Although HP can be fed by waste heat at a higher temperature, the least favorable case is chosen with the ambient temperature for the HP source, considered the most common scenario. In addition to technical assumptions, economic considerations have been made on the basis of the current state-of-the-art, as for the CST cost (), the PV cost (), and the HP cost ( Provided annual energy per unit of ground area and the levelized cost of heat LCOH are defined as the key performance parameters. Although the simulations are carried out for an available ground area of , the results are presented per unit of area, keeping general validity for industrial-scale plants . Summarizing the results of the comparative analysis:
CST shows a greater production than PV-HP in southern European locations with . Moreover, it has a lower LCOH with an even lower threshold of .
PV-HP is the favorable option for energy production in northern locations with , and it is also favorable for LCOH for .
Tilted and horizontal PV give similar results in terms of energy and LCOH when a constraint on the ground area is set.
The highest energy production is achieved in southern Spain with for CST and for PV-HP, with an LCOH of and , respectively.
For the locations with intermediate GHI levels, corresponding to central Europe, CST is the favorable option for LCOH, but the PV-HP has better energy performance, which indicates that a hybrid solution with a side-by-side CST and PV solar field can be the most favorable choice. In this region, bi-objective optimization is applied, identifying the Pareto front of suitable solutions that result from different ground area ratios between the CST solar field and the PV-HP solar field. The optimization is carried out in a selected group of cities with different solar resources. For each of them, a correlation for the Pareto front is obtained, which can be useful for a decision-making process devoted to selecting the best CST/PV-HP combination.
In addition, using a simple decision algorithm, the optimum ground area partitioning is obtained to analyze the optimum hybridization further. The ground area devoted to PV in the optimized hybrid scheme grows as GHI decreases.
In addition to the detailed quantitative results achieved on a large spectrum of locations based on state-of-the-art technology, the methodology is set for design optimization of the combined CST/PV-HP on the constraint of available ground area, which can be extended to further analysis.
Further studies can assess the impact of the design assumptions on the results, both for technical constraints such as steam conditions and waste heat temperature for the HP, or economical as unitary cost of the linear Fresnel, PV, and HP. Moreover, driving the HP by grid electricity, in combination with PV, can be explored to increase the flexibility of the system.


