Abstract
The transition to renewable energy is critical to enhance Puerto Rico’s energy resilience and reduce dependence on imported fossil fuels. Rooftop photovoltaic (PV) systems provide a scalable opportunity to meet these objectives. This study evaluates the potential of rooftop PV systems across Puerto Rico using the National Renewable Energy Laboratory’s (NREL) PV Rooftop Database, processing detailed roof surface data to estimate installed capacity, energy generation, Levelized Cost of Electricity (LCOE), and solar resource potential at municipal and barrio levels. Findings reveal high solar rooftop capacity in urban neighborhoods, with areas like Sabana Abajo and Hato Tejas each exceeding 450 GWh/year in potential generation. Solar rooftop resource values peak at 3.67 kWh/kW in coastal areas, with LCOE values (0.071–0.215 USD/kWh) below current electricity rates. All municipalities demonstrate technical potential to meet their electricity demand with rooftop PV system alone. This research contributes through (1) developing Puerto Rico’s first comprehensive solar rooftop potential map; (2) providing unprecedented barrio-level analysis; (3) introducing a methodology for estimating missing post-disaster consumption data; and (4) integrating technical, economic, and equity indicators to inform energy policy. These findings demonstrate the importance of rooftop solar in achieving renewable energy goals and provide an understanding of spatial energy inequalities.
1. Introduction
Puerto Rico’s electrical grid supplies power to more than 3 million residents [1], but it faces persistent challenges rooted in a centralized grid, decades of underinvestment [2], and neglect of maintenance and vegetation management [3]. An imbalance between electricity demand and local generation capacity [4], coupled with a strong dependence on fossil fuel-dependent infrastructure, has led to frequent power outages, severely compromising the reliability of the island’s energy [5]. The main contributors to this crisis are austerity measures [6] and aging power plants, exacerbated by years of financial neglect and maintenance deficiencies [3]. Facilities such as Central San Juan in 1950, Palo Seco, Costa Sur, and the Aguirre Power Complex in 1974 remain in service well beyond their intended operational useful life [7]. This overreliance on outdated infrastructure further amplifies system inefficiencies and increases reliability concerns.
In addition to aging inefficient infrastructure, Puerto Rico’s dependence on imported fossil fuels contributes to some of the highest electricity costs in the United States (US). As shown in Table 1, the archipelago is almost entirely dependent on imported fuels for electricity generation, exposing its energy system to global price volatility and economic uncertainty [8]. Compounding this vulnerability is the spatial imbalance between generation and demand: most large-scale power plants are located in the southern part of the island, while the highest electricity demand is concentrated in the north. This geographic mismatch, illustrated in Figure 1, requires long-distance transmission across mountainous terrain, significantly complicating maintenance, increasing energy losses, and increasing exposure to system failures. The heavy reliance on these transmission corridors has repeatedly emerged as a critical weakness during extreme events, highlighting the urgent need for a more decentralized and resilient energy infrastructure [9].

Table 1.
Energy imports and electricity costs comparison between Puerto Rico and the United States. Adapted from [8].
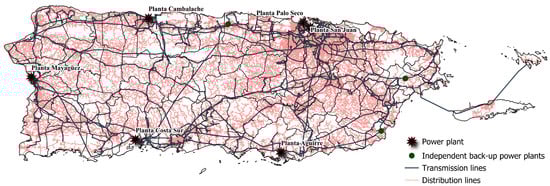
Figure 1.
Overview of power generation assets and the electrical grid. Own elaboration based on data from [10].
Extreme events have repeatedly exposed the structural fragility of Puerto Rico’s electrical infrastructure. The most devastating example remains Hurricane María in 2017, which triggered the longest blackout in US history, with some communities left without electricity for up to 10 months [11,12]. In Figure 2, the extent of the outage is clearly visualized: the neighborhoods shaded in darker tones indicate areas that remained without service for more than 122 days.
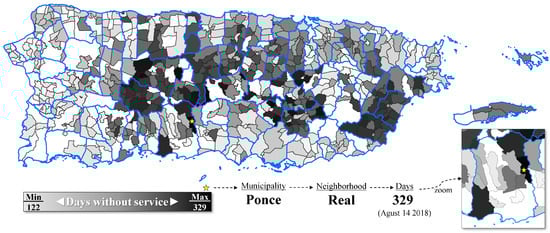
Figure 2.
Neighborhoods without power service for more than 122 days after Hurricane María. Adapted from [13].
The spatial pattern reveals a deep energy inequality in remote and mountainous interior communities that endured the longest recovery times. In extreme cases, neighborhoods such as Real in Ponce experienced outages that lasted up to 329 days, highlighting the disparities in access and restoration capacity. This crisis exposed systemic vulnerabilities in grid design and emergency response that remain unresolved. More recent disasters, including the 2020 Guayanilla earthquake [14] and Hurricane Fiona in 2022 [15], have reinforced the urgency of transitioning to a more resilient, decentralized, and modernized electrical grid [16].
In response to these challenges, Puerto Rico’s energy landscape is undergoing a significant transformation driven by a collective demand for greater reliability, reduced dependence on centralized infrastructure, and an end to prolonged blackouts. This shift is supported by advances in renewable energy technologies, growth in distributed generation, and a strong policy framework. Among these initiatives is the Energy Public Policy Act (Act 17). Enacted in 2019, Law 17-2019 establishes aggressive renewable energy targets of 40% by 2025, 60% by 2040, and 100% by 2050 [17]. These policies aim to reduce fossil fuel dependency, reduce greenhouse gas emissions, and enhance the resilience of the archipelago’s power system. Rapid expansion of renewable energy, particularly rooftop solar power, is essential to achieve these goals and to foster a more sustainable and equitable energy future for Puerto Rico.
Puerto Rico’s electrical grid faces persistent challenges, including aging infrastructure, a heavy dependence on imported fossil fuels, frequent service interruptions, and a high vulnerability to extreme events. Although the island has set ambitious goals for renewable energy, such as achieving 100% renewable generation by 2050, progress has been hampered by systemic barriers and infrastructural deficiencies [17]. In this context, rooftop photovoltaic systems offer a scalable and location-sensitive solution to improve energy resilience, reduce electricity costs, and decentralize energy generation [18]. This study evaluates the potential of rooftop solar energy at both the municipal and neighborhood levels. By analyzing advances in solar infrastructure, particularly rooftop installations, and integrating detailed geospatial data from the PV Rooftop Database for Puerto Rico with historical electricity consumption records, the study identifies areas of high solar suitability, estimates rooftop solar capacity and energy generation at barrio level, assesses the levelized cost of energy, and provides initial insights into spatial energy inequalities. This foundational analysis aims to inform strategies that support a more sustainable, resilient, and equitable energy transition in Puerto Rico.
2. Background and Literature Review
2.1. Puerto Rico’s Energy Landscape
This section explores the historical evolution of Puerto Rico’s energy system, its current challenges, and future pathways toward a more resilient and sustainable energy future. The historical development of Puerto Rico’s electrical system began in 1915 with Guayama hydroelectric plants. A significant change occurred in the 1940s with the Puerto Rico Water Resources Authority [19], which became the Puerto Rico Electric Power Authority (PREPA). In the 1950s, the first thermal power plant, Central San Juan, was built, followed by Palo Seco and Costa Sur. The 1960s saw a nuclear attempt with the Bonus plant. In 1974, 98% of electricity came from fossil fuels, coinciding with the Aguirre Power Complex [7]. PREPA was formalized in 1979 through Act 57 [20]. In the early 2000s, diversification continued with the EcoEléctrica LNG plant and the AES coal plant in Guayama. Renewable energy efforts advanced with Law 114 in 2007, which introduced the Net Metering Program, and Law 83 in 2010, which established the Green Energy Fund to support renewable projects with more than USD 100 million incentives [7].
The power generation of PREPA is concentrated in eight main facilities, as described in Table 2. In addition, PREPA owns around 200 MW of smaller diesel and hydroelectric units. The AES and EcoEléctrica plants, together with operational renewable energy projects totaling approximately 250 MW, are privately owned.
Table 2.
Power generation assets. Adapted from [21].
Puerto Rico’s energy grid continues to struggle with reliability concerns, exacerbated by hurricanes and other extreme weather conditions. The centralized grid structure of the archipelago remains highly vulnerable, as evidenced by widespread and prolonged power outages following Hurricane Maria in 2017 [22]. Aging infrastructure, coupled with deferred maintenance and inadequate investment, has resulted in frequent service disruptions that impact the residential and industrial sectors [23].
A key measure of the reliability of the grid is the analysis of the System Average Interruption Duration Index (SAIDI) and the System Average Interruption Frequency Index (SAIFI), which reflect the average duration and frequency of power interruptions per customer. The data indicate an increasing trend, where a higher frequency of interruptions correlates with longer total outage durations, as shown in Figure 3, which also presents the relationship between SAIDI and SAIFI in Puerto Rico’s Transmission and Distribution (T&D) system. Figure 3 presents a critical visualization of the reliability of our electrical system, showing the relationship between the duration and frequency of power interruptions per customer. The chronological trend reveals a concerning pattern: As the frequency of service interruptions increases, so does their cumulative duration. Data from specific periods, ranging from June 2021 (green) to December 2024 (blue), indicate that most values surpass the performance benchmarks set by the Puerto Rico Energy Bureau. Particularly alarming is that 70% of the analyzed months (30 months, orange rectangle) show longer outages than expected, compared to only 30% (13 months, blue circle) meeting the standards. This pattern suggests a systemic trend toward deteriorating service reliability. Most data points exceed the reference line set by the Puerto Rico Energy Bureau benchmark, indicating that the system experiences longer outages than expected.
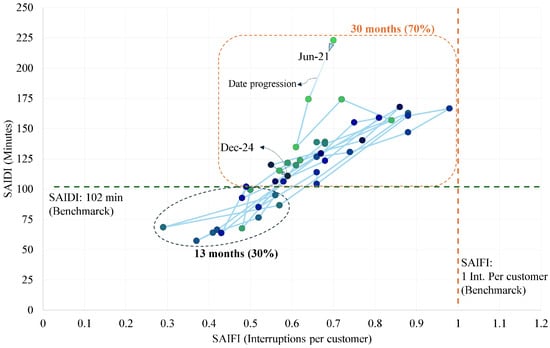
Figure 3.
Quality indicators: SAIDI vs. SAIFI in Puerto Rico’s T&D system. Based on data from [24].
Historically, Puerto Rico has been heavily reliant on imported fossil fuels, particularly petroleum, which represented 60% of the energy consumption in 2022 [8]. This dependence contributes to high electricity costs and environmental concerns associated with greenhouse gas emissions [25]. Despite regulatory efforts, renewable energy generation still constitutes just 6% of total production in 2022 [8].
Figure 4 places Puerto Rico within a broader Caribbean context, revealing its position in the relationship between costs and energy demand. With a peak demand of approximately 2866 MW and average residential rates of 0.21 USD/kWh, Puerto Rico occupies an intermediate position that indicates limitations and opportunities. Although prices are lower than those of smaller islands such as Montserrat (0.51 USD/kWh), they notably exceed that of Trinidad and Tobago (0.046 USD/kWh). The graph highlights how island economies of similar dimensions face comparable challenges, suggesting that system size and import dependence are determining factors in cost structure.
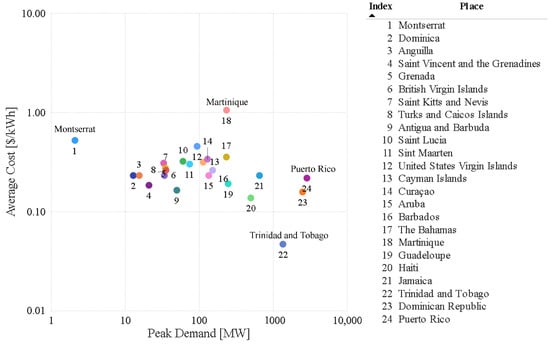
Figure 4.
Average residential electricity cost vs. peak demand in Caribbean places. Based on data from [26].
Figure 5 provides a granular analysis of electricity pricing across customer segments throughout the Caribbean, revealing important disparities within the cost structure of Puerto Rico. Although the residential sector faces relatively moderate rates compared to other islands, the industrial sector benefits from rates that rank among the most competitive in the region. This pricing disparity creates an uneven burden distribution in which residential and commercial customers pay 0.02 or 0.03 USD/kWh more (10% to 15% higher), a pattern that reflects broader economic priorities embedded in the energy policy framework.
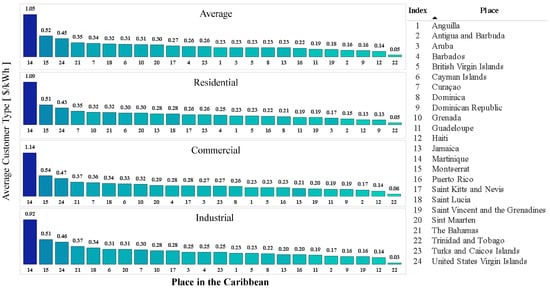
Figure 5.
Electricity prices in the Caribbean by average customer type [USD/kWh]. Based on data from [26].
The PR100 study by the US Department of Energy (DOE) presents a strategic road map for Puerto Rico’s transition to 100% renewable energy by 2050 and explores distributed PV and storage investments over time, offering projections throughout the mid-century [27]. The study underscores the need for substantial investments in infrastructure, grid modernization, and active community participation to facilitate this transition. Complementing this, the Telos Energy study emphasizes the technical feasibility and cost-effectiveness of integrating distributed energy resources (DERs) on a scale, noting that rooftop solar and storage can play a central role in enhancing resilience and reducing long-term energy costs in Puerto Rico [28]. Research highlights rooftop solar as crucial for energy independence, identifying prime locations for deployment [23]. The SLOPE tool specifically offers data on the solar potential for low- to moderate-income residential rooftops, modeling annual generation capacity with affordability filters [29]. Additionally, the ARET (Achievable Renewable Energy Targets for Puerto Rico’s Renewable Energy Portfolio Standard) underscores the feasibility of integrating renewable energy into the island’s electricity portfolio. The report highlights that utilizing only 65% of the available residential rooftop area, could generate 100% of Puerto Rico’s 2006 electricity consumption [30].
2.2. The Role of Solar Energy
In Puerto Rico, various methods have been employed to assess rooftop solar potential and track installed systems. These approaches range from advanced remote sensing and geospatial modeling to ground-based data collection and community-level surveys. Each method provides unique insights into where solar panels can be installed and how much energy they could generate. Remote sensing and Geographic Information System (GIS) tools, such as high-resolution aerial and satellite imagery, have been instrumental in evaluating the solar rooftop potential in Puerto Rico. For example, Google’s Project Sunroof applied machine learning to aerial imagery to assess approximately 44,000 rooftops after Hurricane María, finding that more than 90% were viable for solar installation [31]. This highlights significant untapped potential, as the tool identifies optimal roof areas and estimates solar output. However, coverage is limited to only a portion of the archipelago, excluding rural areas.
To identify existing installations, utility interconnection data currently offers the most comprehensive view. As shown in Figure 6, by December 2024, approximately 145,715 homes and businesses were enrolled in net metering programs, representing a combined installed capacity exceeding 1032 MW [32]. Although these data capture the rapid growth in distributed solar adoption since 2017, they are aggregated at the regional level and lack the granularity needed for neighborhood-scale analysis. At finer spatial scales, some initiatives have mapped solar installations in critical community facilities. For example, an NGO-led effort developed an interactive dashboard to track solar and battery systems installed in schools, fire stations, and clinics in various towns following Hurricane María [33].
An alternative effective method for assessing rooftop solar adoption is through direct surveys and community involvement. Academic teams in Puerto Rico have conducted neighborhood-level studies to better understand the prevalence of solar systems and the experiences of residents. In particular, as part of the DOE PR100 study, researchers from the University of Puerto Rico conducted a comprehensive survey of households with rooftop photovoltaic systems, collecting data on system sizes, performance, and lived experiences of using solar energy during grid outages [34]. Although this approach offers rich, ground-level insights, it also presents limitations. Questionnaires often rely on voluntary participation, which could result in the over-representation of more active, tech-literate, or content solar users. In contrast, people with negative experiences, restricted internet access, or poorer awareness could be underrepresented, which could potentially distort the findings.
Although these methods provide valuable information about technical potential and user experience, they are not the primary tools used in the analysis. Instead, the next part focuses on understanding the adoption patterns over time using net metering data to evaluate the growth and distribution of solar energy systems in Puerto Rico.
Following Hurricanes María in 2017 and Fiona in 2022, rooftop solar adoption in Puerto Rico accelerated significantly. The prolonged experience of living without electricity during and after these disasters increased public awareness among residents and businesses about the critical importance of energy independence and having a reliable power source in times of crisis. In addition to seeking resilience against future outages and system unreliability, many households were motivated by the opportunity offered through net metering programs, which allow them to export excess electricity to the grid. As illustrated in Figure 6, the number of residential customers with net-metered solar systems increased, particularly after mid-2020. The graph reveals a steep adoption trajectory, with residential installations rising from approximately 40,000 in 2020 to more than 141,000 by the end of 2024, representing a more than three-fold increase in just four years. In stark contrast, adoption in the commercial and industrial sectors remained relatively flat during the same period. This exponential growth among residential users signals a fundamental change in how Puerto Rican households perceive energy resilience and self-sufficiency. The temporal markers corresponding to Hurricanes María and Fiona serve as clear inflection points, underscoring the role of extreme events as powerful catalysts for both behavioral and infrastructural change in energy consumption patterns. The deterioration of power reliability when Luma started operating the grid, along with an improvement in net-metering processing time in 2021 might have also motivated the fast adoption of residential rooftop solar combined with batteries.
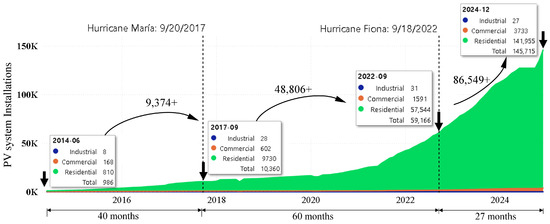
Figure 6.
Customers with solar systems and net metering by class. Date progression between June 2014 and December 2024. Based on data from [35].
In addition, the integration of Battery Energy Storage Systems (BESS) has gained momentum, helping stabilize intermittent solar generation and improve energy resilience. Figure 7 reveals a synchronized growth pattern between photovoltaic systems and battery energy storage installations, demonstrating how these technologies are evolving as complementary solutions. The steady paralleling of the orange (PV) and blue (BESS) trend lines indicates that approximately 80% of new solar installations now incorporate battery storage, up from less than 60% in 2021. This integration trend reflects a maturing understanding among consumers that energy resilience requires not just solar generation capacity but also storage capability to buffer against grid instability. The convergence is particularly evident in the post-Fiona period, where both technologies show accelerated adoption rates, suggesting that lessons from recent disasters have fundamentally altered Puerto Rico’s approach to residential energy infrastructure.
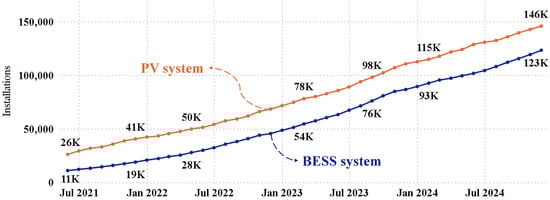
Figure 7.
Comparison of the number of PV and BESS installations based on data from [24].
Figure 8 quantifies the scaling relationship between photovoltaic and storage capacity, revealing that energy storage installations are being proportionally sized to match photovoltaic deployment. The widening gap between the blue (BESS) and orange (PV) lines indicates that while total MW capacity remains higher for solar, the battery storage sector is growing at a faster rate, suggesting an evolving strategy where new installations prioritize higher storage-to-generation ratios. This trend toward greater storage density per MW of solar generation reflects both technological improvements in battery economics and a strategic shift toward maximizing energy autonomy during grid outages. The trajectory projects Puerto Rico toward a future where energy storage could approach parity with generation capacity, fundamentally altering the island’s energy resilience paradigm.
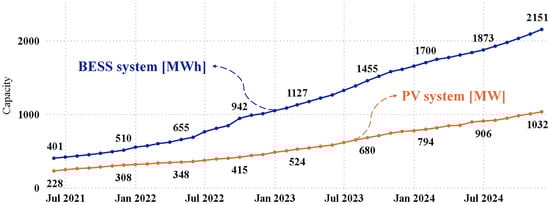
Figure 8.
Comparison of the number of PV systems and BESS installed capacity. Based on data from [24].
Several studies highlight Puerto Rico’s substantial rooftop solar potential [23,36,37]. The National Renewable Energy Laboratory provides geospatial data that indicate that Puerto Rico could generate approximately 31.76 TWh annually from rooftop PV installations, exceeding the total electricity demand [27].
3. Methodology
3.1. Data Collection
The data collection process incorporates geospatial and electricity consumption data sets to analyze Puerto Rico’s solar energy potential and energy demand trends. Geospatial data are sourced from the Geographic Information Systems of Puerto Rico and the National Renewable Energy Laboratory PV Rooftop Database for Puerto Rico, which is a lidar-derived data set that provides geospatially resolved information on suitable roof surfaces and their photovoltaic technical potential for almost all buildings on the island [38]. This data set enables precise estimations of the solar generation capacity based on rooftop characteristics. Electricity consumption data are obtained from Puerto Rico’s utility reports (2000–2023) [24,39], which offer historical information on energy demand and regional consumption patterns over two decades. This data set provides a comprehensive view of the trends in electricity usage, supporting analyses of the integration of distributed solar generation with existing demand profiles.
3.2. Data Processing and Quality Control
Data processing and quality control procedures ensure the accuracy and reliability of collected data through validation and correction methodologies. Data validation involved the cross-referencing of the data sources to identify and resolve inconsistencies while addressing anomalies in the data set. Notable data inconsistencies were detected for May 2012; September, October, and November 2017; February, April, May, and October 2018; and September 2022. The discrepancies in 2018 and 2022 align with the impacts of Hurricanes María and Fiona, respectively, which disrupted energy consumption patterns. To correct for these inconsistencies, Equation (1) was used to estimate the missing or unreliable consumption values. This estimation method relies on historical proportions between each consumption category and the net generation recorded for the same months in other years. Specifically, the estimated consumption of a given component () was determined using the formula
where represents the estimated consumption for a specific category (e.g., total, residential, commercial), is the historical average proportion of consumption relative to net generation, and G is the recorded net generation for the month. The proportion factor or ratio was calculated as
Table 3 provides a detailed overview of the calculations used to estimate energy consumption between different components for November 2017. This example demonstrates the applied methodology and results, offering insight into the distribution of energy use among various sectors and highlighting the discrepancies between the estimated and recorded values.
Table 3.
Summary of the estimated consumption for November 2017. Own elaboration based on data from [39].
This approach ensures consistency in energy consumption estimations by leveraging historical trends, thereby minimizing the impact of anomalous data points caused by external disruptions such as extreme weather events. Comparison of net electricity generation and Total Energy Consumption from 2000 to 2023, as shown in Figure 9, provides valuable information on seasonal fluctuations in energy usage, long-term consumption trends, and anomalies caused by external disruptions.
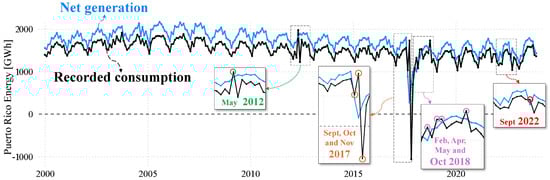
Figure 9.
Net generation vs. recorded total consumption. Based on data from [39].
Figure 9 highlights critical anomalies in consumption data, revealing the challenges of accurately tracking energy flows during periods of crisis. The graph shows pronounced negative deviations in recorded consumption, most notably between September and November 2017 (post-Hurricane María) and from February to October 2018, where the reported values appear to fall below zero even though net generation remains positive. These inconsistencies likely stem from disruptions in the metering infrastructure and reporting systems caused by extreme events, reflecting the broader measurement challenges that arise in damaged grid conditions. The orange connecting lines underscore the extent of data gaps, illustrating how hurricane-induced infrastructure failures compromise the ability to maintain accurate energy accounting. These blind spots in utility data can persist for months, preventing both operational decision-making and long-term energy planning.
Figure 10 demonstrates the effectiveness of our data correction methodology, in which the estimated consumption values (green line) offer a more plausible reconstruction of energy demand patterns during crisis periods. Unlike the problematic negative values shown in Figure 9, this visualization reflects consumption levels that maintain realistic proportions to generation throughout the 2000–2023 period. The methodology effectively bridges data gaps while preserving seasonal fluctuation patterns, providing a reliable basis for energy planning despite infrastructure damage. This approach is essential to ensure continuity in energy policy analysis during recovery phases and serves as a model to maintain data integrity in disaster-prone electrical systems. The equations used to estimate category-specific consumption based on net generation (Equations (1) and (2)) were developed by the authors specifically for this study. These formulations were designed to reconstruct missing or inconsistent consumption records in a transparent and replicable manner, using proportional relationships derived from historical data.
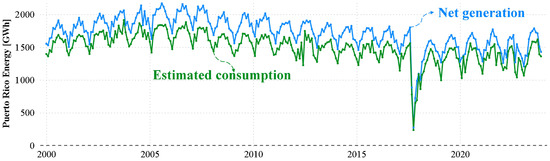
Figure 10.
Net generation vs. estimated total consumption. Based on data from [39].
This study expands its scope to assess the potential of rooftop solar systems in advancing Puerto Rico’s renewable energy objectives. Figure 11 outlines the key steps in this analysis, illustrating how rooftop solar can support the island’s transition to a more resilient and self-sufficient energy system. The methodology details the transformation of raw LiDAR data into actionable insights, encompassing the entire process, from data acquisition to the development of decision support maps. This framework demonstrates how geospatial technologies can be effectively leveraged to generate granular data at the neighborhood level for distributed energy planning. The workflow emphasizes a multidimensional analysis that integrates technical potential, economic viability (through the levelized cost of energy), and social equity considerations (such as access at the community level). By converting technical data sets into visual maps using QGIS, the approach helps democratize access to solar planning information, empowering both policymakers and local communities to identify optimal deployment zones with unprecedented spatial resolution.
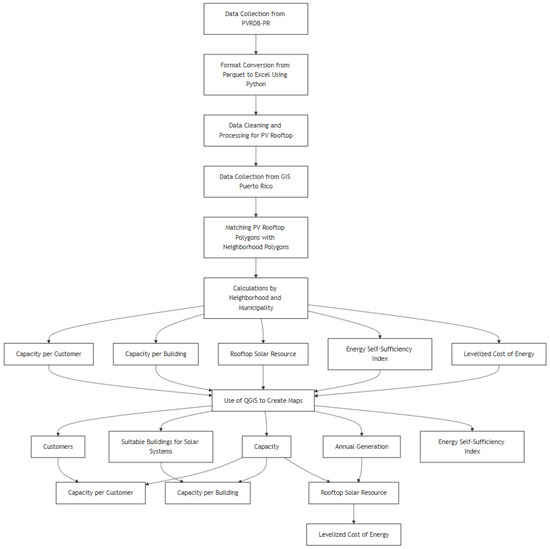
Figure 11.
Methodology for PV rooftop data analysis and mapping in Puerto Rico.
The data set used for this assessment is provided in Parquet format and can be accessed from [40]. For this study, all files related to Puerto Rico’s municipalities were retrieved and processed, containing detailed information on developable rooftop surfaces, including their technical potential and spatial characteristics. A custom Python 3.13.0 script was developed to process the data, using the PV Rooftop Database-Puerto Rico (PVRDB-PR) from the National Renewable Energy Laboratory. The script enabled data visualization in both CSV files and Python, focusing on key variables such as all buildings available and ID, roof azimuth, tilt, flat and sloped areas, installed solar capacity (kW), and estimated annual energy generation (kWh). These variables facilitated an initial exploration of the data set and laid the foundation for further analysis.
Although the methodology applied in this study provides a robust framework for estimating energy consumption and solar potential, several sources of uncertainty must be recognized. First, historical electricity consumption data can contain reporting inconsistencies, particularly during or immediately after extreme weather events, which can affect the reliability of input data. Second, the estimation of missing values using proportional relationships assumes stability in consumption generation patterns over time; however, behavioral, technological, or policy-driven changes may introduce deviations. Third, the PV Rooftop Database, although based on high-resolution lidar data, may not reflect recent building modifications or structural conditions that affect solar suitability. Furthermore, while utility interconnection data provide broad insight into installed systems, they lack spatial granularity and may not capture off-grid installations. Despite these uncertainties, the methodology was designed to minimize error propagation by applying transparent, replicable assumptions and cross-validating multiple data sources. Future studies could further refine this approach by incorporating real-time monitoring data, higher-resolution consumption records, and expanded field validation.
4. Calculation Framework
To support rooftop solar analysis, this study used the PV Rooftop Database for Puerto Rico (PVRDB-PR), which applies advanced GIS methods and updated modeling assumptions from the NREL PV Rooftop Model v2.0 [41]. PVRDB-PR includes smaller rooftop surfaces (≥1.62 ), shading threshold ( unshaded area) and surface tilt (), considers all azimuth orientations, including north-facing planes, and incorporates surface-level shading into generation estimates using the System Advisor Model (SAM). Although this leads to slightly lower generation estimates (kWh/kW) compared to US values, it improves the precision of Puerto Rico’s unique conditions. PV performance simulations assumed a power density of 183 , an inverter efficiency of 96%, and a DC-to-AC ratio of 1.2. The model relies on high-resolution LiDAR from NASA G-LiHT and USGS 3DEP, combined with OpenStreetMap building footprints, to assess building-level suitability.
Then, a Geographic Information System mapping approach was used to visualize Puerto Rico’s solar potential. To assess the potential of the rooftop at the neighborhood level, key metrics were calculated, including total installed capacity (kW), annual energy generation (kWh), and the number of buildings suitable for photovoltaic installation. These values were aggregated using unique building identifiers (bldg_fid) to ensure accurate spatial attribution. This methodology provided a comprehensive overview of Puerto Rico’s rooftop solar capacity and helped identify regions with a high renewable energy potential on a granular scale.
The analysis was refined to the neighborhood level by spatially aligning the rooftop coordinates (EPSG: 4326) with the official neighborhood boundaries, as illustrated in Figure 12. This represents a paradigm shift in solar resource mapping, moving beyond municipal-level generalizations to neighborhood-specific granularity that more accurately captures the complexity of Puerto Rico’s solar landscape. The detailed overlays reveal that even within high-potential municipalities such as San Juan and Bayamón, solar resources are unevenly distributed across neighborhoods. This spatial variability exposes critical energy access inequities, from solar-rich coastal corridors to relatively underserved interior areas.
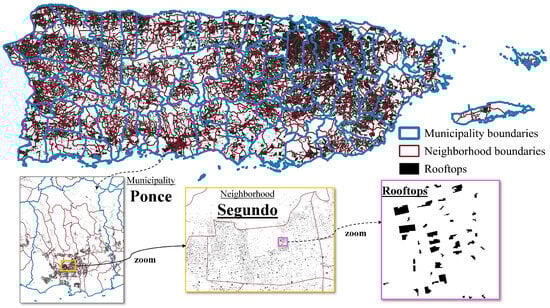
Figure 12.
Rooftop PV in Puerto Rico by neighborhood.
Through this refined spatial assessment, the study calculated key metrics for each neighborhood, including estimated solar capacity, annual energy generation, and the number of buildings suitable for photovoltaic installations. By aggregating building polygons based on their unique identifiers (bldg_fid), the analysis identified specific neighborhoods with high rooftop solar potential. These insights provide essential guidance for equitable and strategic solar deployment, highlighting both areas ripe for concentrated development and those requiring targeted infrastructure investments to ensure inclusive access to renewable energy benefits.
Using data from capacity potential and estimated annual energy output, a solar resource calculation is generated, focusing specifically on rooftop solar energy generation. The calculation is as follows:
where is the average daily energy generation per kilowatt of installed PV capacity in kWh/kW, represents the total annual energy generation (kWh per year), and refers to the total installed PV capacity (kW). This metric provides a standardized way to assess the efficiency and potential output of rooftop solar installations in different locations.
Subsequently, the Levelized Cost of Energy is calculated using the output of the solar resource assessment. LCOE is a widely recognized metric in the energy sector, used to evaluate the economic viability and cost-competitiveness of power generation technologies over their operational lifespan. In this study, the LCOE is calculated using Equation (4), following the methodology outlined by the US Department of Energy [42].
where
- denotes the investment expenditures in year t;
- represents the operations and maintenance (O&M) costs in year t;
- corresponds to the fuel costs in year t (which is zero in this case since solar energy is used);
- is the electricity generation in year t;
- r represents the discount rate;
- n denotes the system’s lifetime.
To account for the long-term decline in the performance of the photovoltaic system, an annual degradation rate of 0.5% is applied. This factor models the gradual reduction in energy output over time by decreasing the estimated annual generation by 0.5% for each subsequent year of system operation. Although this degradation rate captures the effects of aging on panel efficiency, other key loss factors, such as temperature effects, panel soiling, shading, and inverter inefficiencies, were incorporated directly into the annual generation estimates provided by the PV Rooftop Database for Puerto Rico (PVRDB-PR). These values were modeled using NREL’s System Advisor Model, which integrates localized assumptions for system performance losses.
To provide a comprehensive economic assessment, two Levelized Cost of Energy scenarios are evaluated. The parameters used for each scenario are summarized in Table 4. These values are based on a 6 kW direct current (DC) residential solar PV system, which reflects the average system size currently installed in Puerto Rico. This assumption ensures that the analysis is grounded in local installation trends and offers a realistic representation of cost variations under different financing and operational conditions.
Table 4.
Summary of parameters used for LCOE calculation.
Finally, the Energy Self-Sufficiency Ratio (ESSR) is calculated to assess the extent to which rooftop solar energy can meet the total annual electricity demand at the municipal level [43]. This metric serves as a meaningful indicator of local energy independence by comparing estimated rooftop PV generation with the average electricity consumption. Annual solar generation is estimated using the PVWatts Calculator, while the total average annual electricity consumption data is sourced from the public data sets of the Puerto Rico Energy Bureau [44]. The ESSR is calculated using Equation (5) and is defined as
where
- Local Energy Generation refers to the annual electricity produced by rooftop PV systems within a given municipality;
- Total Energy Consumption represents the total annual electricity demand in the same municipality.
The ESSR values are interpreted as follows:
- ESSR = 100%: the municipality is fully self-sufficient;
- ESSR < 100%: the municipality remains dependent on external energy sources;
- ESSR > 100%: the municipality generates more electricity than it consumes and could potentially export surplus energy.
By quantifying the capacity of each municipality to meet its own electricity needs through locally generated rooftop solar energy, the ESSR offers a clear and actionable measure for energy planners and policymakers. It helps identify areas with strong potential for solar self-sufficiency, as well as those requiring supplemental infrastructure or diversified energy strategies. This analysis is particularly relevant for advancing equitable and resilient renewable energy deployment in Puerto Rico.
To effectively communicate the findings, QGIS was used to generate geospatial visualizations that show solar capacity, annual energy generation, solar resource, and LCOE in municipalities and neighborhoods. By integrating geospatial analysis with municipal and neighborhood-level aggregation, this framework provides critical information on Puerto Rico’s renewable energy landscape, helping drive informed decisions to maximize the island’s solar adoption potential.
5. Results
5.1. Geographic Feasibility Analysis
Puerto Rico presents exceptionally favorable geographic and climatic conditions for the implementation of distributed photovoltaic systems. According to a comprehensive PR100 study, the archipelago has an average solar irradiance between 4.5 to 5.5 kWh/m2/day, positioning it in the upper percentile of global solar resources, comparable to optimal regions such as Arizona [27]. Spatial analysis of solar irradiance and rooftop photovoltaic production indicates that even the central mountain regions of Puerto Rico, traditionally perceived as less favorable for solar installation, achieve relative efficiency levels exceeding 75% compared to high-performing coastal areas. This finding is supported by the solar resource assessment of the University of Puerto Rico at Mayagüez, which demonstrates that much of the island, including the municipalities in the north, receives annual average irradiance levels greater than 330 W/m2, indicating a strong baseline solar potential in various terrains [30]. These findings align with the conclusion of the PR100 study that solar resources are relatively uniform across the island, strengthening the viability of distributed photovoltaic deployment beyond coastal zones.
The existing transmission infrastructure, despite limitations exposed by extreme events, has the technical capacity to integrate distributed generation up to 40% of the regional peak demand, according to the absorption capacity modeling documented in PR100. This integration capacity is complemented by an established technical ecosystem, as evidenced by the official list of approximately 89 Renewable Energy Installation Companies (REICs) approved by the CDBG-MIT Nueva Energía Program, establishing a solid foundation for massive system deployment. Historical climate patterns from PR100 indicate that approximately 92% of days present suitable conditions for significant solar generation, with average capacity factors reaching 16–22% in optimally oriented systems, according to the criteria of the database used [38].
5.2. Socioeconomic Feasibility Assessment
The comprehensive socioeconomic feasibility of residential photovoltaic systems has been extensively validated for different socioeconomic strata in Puerto Rico through multiple case studies, including the comprehensive analysis of PR100. The economic projections of the study demonstrate that for households with annual incomes above USD 35,000, representing approximately 42% of Puerto Rican residences, standard 6 kW DC systems present investment recovery periods between 7 and 9 years, considering current average electricity rates of 0.21 USD/kWh [36]. However, research on post-disaster energy inequities documents significant disparities in access and energy recovery among different communities, confirming that implementation strategies must consider not only economic viability but also existing structural barriers [45].
For lower income strata, the Nueva Energa Community Development Block Grant Mitigation Program (CDBG-MIT) of the Department of Housing has implemented an innovative financing scheme that covers 100% of costs up to a maximum of USD 30,000 for the installation of renewable energy systems in single-family residences whose family income is below 80% of the area median income (AMFI). This program requires systems to include both photovoltaic panels and battery storage, with minimum capacities of 3kW for generation and 9kW for batteries, and installed by any of the 89 approved REICs. The accumulated post-María experience, where more than 35,000 residential installations have demonstrated engineering viability under extreme climatic conditions [36], provides evidence of operational feasibility. Furthermore, the lessons learned about the inequities in energy service restoration [45] underscore the importance of designing implementation schemes that actively address the disparities between the neighborhoods identified in this study.
5.3. Rooftop Solar Capacity Potential
The rooftop solar capacity potential across Puerto Rico is illustrated in Figure 13, which presents a comparative view at both the municipal and neighborhood levels. Major urban centers such as San Juan, Bayamón, Caguas, and Ponce exhibit the highest potential, each exceeding 827 MW of estimated rooftop capacity. This concentration is largely attributed to high population density and the prevalence of large building stock. The graduated color scale in the municipal map clearly highlights how a small number of municipalities, particularly San Juan, emerge as dominant contributors, collectively accounting for more than 40% of the total rooftop solar capacity of the island.
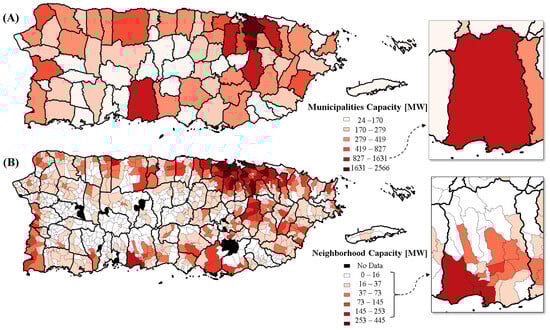
Figure 13.
Rooftop solar capacity potential. (A) Municipalities’ capacity [kW]. (B) Neighborhoods’ capacity [kW].
However, the neighborhood-level analysis reveals critical disparities masked by municipal averages. Although some neighborhoods within high-potential municipalities function as solar hubs, others, such as Jagüey in Ponce, display significantly lower capacity, underscoring intra-municipal inequalities in solar resource distribution. This neighborhood-level granularity challenges conventional solar planning approaches that rely solely on aggregated municipal data and highlights the importance of localized strategies tailored to specific spatial and socioeconomic contexts.
Figure 13 therefore serves as a foundational tool for identifying both high-priority zones for rooftop solar installations and underserved communities in need of targeted investment. For example, the five neighborhoods with the highest estimated rooftop capacity include Sabana Abajo in Carolina (444 MW), Hato Tejas in Bayamón (383 MW), Santurce and Gobernador Piñero in San Juan (358 MW and 356 MW, respectively), and Minillas in Bayamón (311 MW). In contrast, neighborhoods such as Muñoz Rivera in Patillas (5 kW) and Jagüey in Rincón (9 kW) reflect minimal capacity, influenced in part by limited infrastructure and gaps in LiDAR data coverage. These findings emphasize the need for spatially equitable solar policies that consider both technical potential and data limitations.
5.4. Annual Solar Potential
Figure 14 presents a detailed spatial analysis of the island’s annual rooftop solar generation potential. The visualization highlights a pronounced geographic disparity in renewable energy capacity, with central mountain municipalities consistently underperforming compared to their coastal and urban counterparts. Rural regions generate less than 40 GWh annually, while major urban centers such as San Juan, Bayamón, Ponce, and Caguas exceed 1.1 TWh. This contrast reflects not only the density of the population but also the variations in rooftop availability, building concentration, and urban infrastructure.
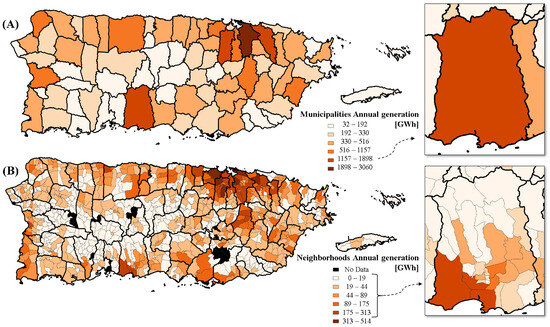
Figure 14.
Annual rooftop solar generation potential. (A) Municipalities’ annual generation [kWh]. (B) Neighborhoods’ annual generation [kWh].
The map functions as a strategic atlas of renewable energy resources, helping to identify high-yield corridors for investment in solar infrastructure. For example, neighborhoods like Sabana Abajo in Carolina alone exhibit a generation potential that exceeds 513.9 GWh, enough to power approximately 50,000 homes per year. Other top-performing neighborhoods include Hato Tejas in Bayamón (461 GWh), Santurce (452 GWh) and Gobernador Piero (425 GWh) in San Juan, and Sabana Seca in Toa Baja (368 GWh). These areas play a critical role in meeting Puerto Rico’s renewable energy goals.
In contrast, neighborhoods such as Muñoz Rivera in Patillas (4.5 GWh) and Jagüey in Rincón (8.5 GWh) demonstrate substantially lower generation capacity. These limitations stem from a combination of factors, including fewer suitable rooftops, shading due to vegetation, and the climatic and topographic challenges typical of interior municipalities. In some cases, low values may also reflect gaps in LiDAR data coverage. Understanding these spatial disparities is essential to direct equitable solar development efforts and ensure that all communities can benefit from the energy transition.
5.5. Solar Resource
Puerto Rico’s first neighborhood-level rooftop solar resource map represents a significant advancement in the assessment of distributed solar potential on the island. By offering high-resolution localized data on solar irradiance and generation efficiency, this visualization provides a valuable tool for guiding energy planning, infrastructure investment, and equitable policy development. Figure 15 presents the spatial variation in the average daily energy generation per installed kilowatt (kWh/kW), highlighting key regional differences in rooftop solar performance.
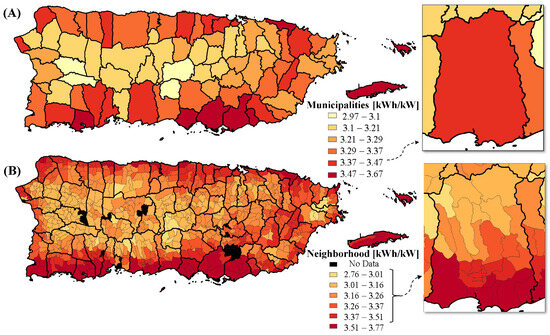
Figure 15.
Solar rooftop resources. (A) Average daily solar energy generation per unit of installed photovoltaic capacity at the municipal level [kWh/kW]. (B) Average daily solar energy generation per unit of installed photovoltaic capacity at the neighborhood level [kWh/kW].
The highest solar efficiency is concentrated in the eastern and southeastern coastal municipalities, including Vieques, Luquillo, and Maunabo, where values reach up to 3.7 kWh/kW. These elevated outputs are driven by high solar irradiance levels and reduced cloud cover, which together optimize photovoltaic system performance. In contrast, municipalities in the central and western interior, such as San Germán and Lajas, exhibit lower values ranging from 2.9 to 3.1 kWh/kW, largely due to increased cloudiness and topographic constraints.
At the neighborhood level, the areas with the highest rooftop solar efficiency are located primarily in the southern and coastal zones. Notable examples include Palmas Altas in Barceloneta (3.5 kWh/kW), Ensenada in Guánica (3.7 kWh/kW), and Playa Sardinas II in Culebra (3.5 kWh/kW). In contrast, mountainous neighborhoods such as Vegas Arriba in Adjuntas (3.1 kWh/kW) and Callejones in Lares (3.1 kWh/kW) experience reduced efficiency. These lower values are influenced by hill shading, dense vegetation, and complex terrain, which collectively limit direct solar exposure on rooftops.
5.6. Levelized Cost of Energy
The Levelized Cost of Energy (LCOE) analysis highlights clear spatial disparities in the economic feasibility of rooftop solar in Puerto Rico. As shown in Figure 16 and Figure 17, coastal and southern municipalities generally benefit from lower LCOE values, while higher costs are concentrated in mountainous and rural interior regions. Municipalities such as Santa Isabel, Guayama, Culebra, Guánica, and Salinas demonstrate the most favorable conditions for cost-effective solar installation, with LCOE Low values ranging from 0.073 to 0.075 USD/kWh and LCOE High values between 0.162 and 0.165 USD/kWh. These areas benefit from high solar resource availability, flat terrain, and fewer shading obstacles.
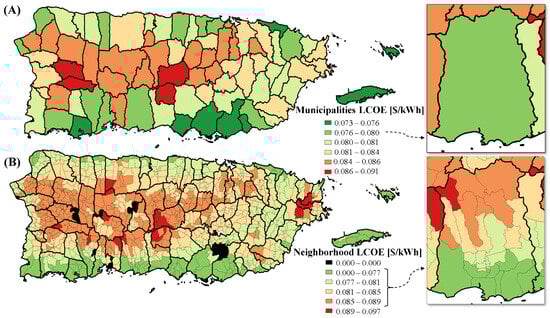
Figure 16.
Levelized cost of energy (Low LCOE).(A) Estimated low levelized cost of energy at the municipal level [$/kWh]. (B) Estimated low levelized cost of energy at the neighborhood level [USD/kWh].
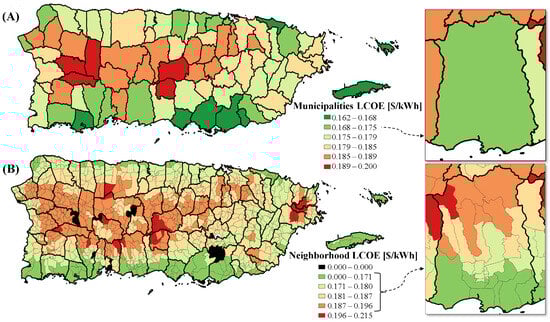
Figure 17.
Levelized cost of energy (High LCOE). (A) Estimated high levelized cost of energy at the municipal level [USD/kWh]. (B) Estimated high levelized cost of energy at the neighborhood level [USD/kWh].
In contrast, municipalities in the central highlands, including Villalba, Maricao, Las Marías, and Orocovis, face higher installation and generation costs due to topographic complexity and reduced solar efficiency. These regions exhibit low LCOE values that exceed 0.086 USD/kWh and high LCOE values that exceed 0.189 USD/kWh, making solar energy comparatively less competitive.
At the neighborhood level, the LCOE values continue to reflect localized variation within municipalities. For example, in Santa Isabel, the Barrio Pueblo neighborhood exhibits highly competitive costs with an LCOE Low of 0.071 USD/kWh and an LCOE High of 0.157 USD/kWh, while the neighboring Boca Velázquez shows slightly elevated values. Similarly, in Fajardo, Cabezas maintains relatively low costs (0.075 USD/kWh LCOE Low and 0.167 USD/kWh LCOE High), whereas Boca Naranjo incurs significantly higher costs, reaching 0.097 USD/kWh (LCOE Low) and 0.215 USD/kWh (LCOE High). These intra-municipal disparities underscore the importance of high-resolution cost mapping to guide the implementation of equitable and efficient solar policy throughout the island.
5.7. Energy Self-Sufficiency Ratio
The Energy Self-Sufficiency Ratio (ESSR) in Puerto Rico, depicted in Figure 18, presents a heatmap of the monthly ESSR for each municipality in Puerto Rico. ESSR values, calculated as the ratio of estimated rooftop PV generation to monthly average electricity consumption, highlight seasonal and spatial variability in the adequacy of solar energy throughout the island. Although most municipalities consistently exceed 100% ESSR throughout the year, indicating technical potential to fully meet local demand with rooftop solar, variations in magnitude and seasonal consistency can be observed. Coastal and rural areas often maintain high levels of ESSR throughout the year, while municipalities with a higher population density or a more limited rooftop area show more pronounced monthly fluctuations.
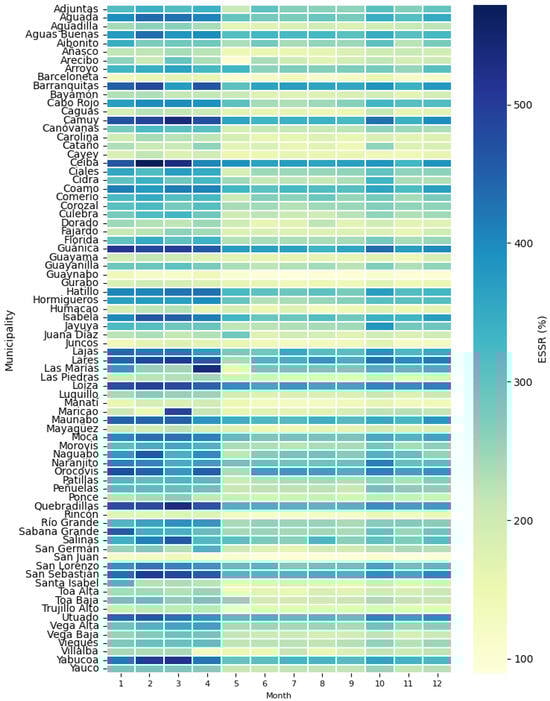
Figure 18.
Monthly energy self sufficiency ratio by municipalities.
Figure 19 isolates the municipalities of Guaynabo and San Juan, the only two to drop below 100% ESSR in at least one month of the year. These municipalities reflect structural constraints such as limited available rooftop space relative to demand and higher population densities. The figure reveals that while both cities exceed 100% in the early part of the year, their ESSR values decline below self-sufficiency thresholds during the summer and fall months, with San Juan showing more persistent deficits. These findings suggest that additional strategies such as demand management, battery storage, or integration with community-scale solar may be needed to ensure energy resilience in dense urban centers.
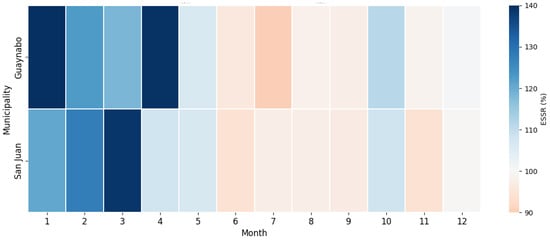
Figure 19.
Municipalities with ESSR < 100% in any month.
The average ESSR in Figure 20 shows to what extent municipalities could meet or exceed their annual electricity demand through rooftop photovoltaic (PV) generation alone. The ratio compares the potential annual rooftop solar generation with the total electricity consumption of the actual electricity, offering a clear metric of localized energy independence.
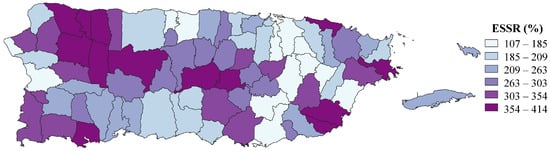
Figure 20.
Average energy self-sufficiency ratio.
Several north-central municipalities, including Camuy, San Sebastián, and Lares, exceed a solar self-consumption ratio of 300%. This indicates that these areas have the potential not only to meet their own energy needs but also to contribute excess energy to surrounding regions. Such surplus-generating municipalities could serve as hubs of distributed energy resilience and bolster island-wide grid stability.
In contrast, municipalities along the eastern and southern coasts, such as Fajardo, Carolina, and parts of Humacao, exhibit lower solar self-consumption ratios, generally ranging from 107% to 209%. These lower values are mainly influenced by the increased electricity consumption associated with denser populations and urbanized infrastructure. These areas may require complementary measures, such as battery storage or grid-tied imports, to enhance their energy resilience.
Interestingly, some municipalities defy regional trends. For example, Ceiba on the eastern coast achieves a relatively high ESSR despite being located in a region typically characterized by lower values. This anomaly can be attributed to a combination of a lower population density, reduced electricity demand, and favorable solar conditions.
In general, the spatial distribution of ESSR underscores the need for geographically tailored energy strategies. Municipalities with lower ratios can benefit from targeted investments in energy efficiency, load management, or hybrid systems, while those with surplus generation potential can be prioritized for grid support and energy export strategies.
6. Conclusions
This study presents four fundamental contributions to existing knowledge on distributed renewable energy in Puerto Rico and other island territories. First, we have developed the first detailed rooftop-based solar potential map for the entire island, overcoming the partial coverage limitations of previous efforts. Second, our barrio-level analysis reveals energy disparities previously masked by municipal aggregations, providing an unprecedented level of spatial granularity. Third, the proposed methodology for estimating missing consumption data during crisis periods offers a robust solution to maintain continuity in post-disaster energy analysis, applicable to other territories vulnerable to extreme events. Fourth, the combination of technical, economic, and equity metrics (LCOE, self-sufficiency ratio, kWh/kW efficiency) constitutes a comprehensive evaluative framework that can inform localized and socially just energy policies.
The development of the first rooftop solar resource map for Puerto Rico marks a crucial step in evaluating the archipelago’s distributed solar energy potential. This map provides a comprehensive visualization of solar productivity in various municipalities and barrios, quantifying expected generation in terms of kWh/kW. Importantly, the map indicates that solar energy development opportunities are widespread throughout the archipelago, demonstrating the potential for solar adoption in both urban and rural areas, reinforcing that distributed solar could play a pivotal role in Puerto Rico’s renewable energy future.
The findings also underscore the economic advantages of solar energy, particularly when comparing the LCOE for rooftop solar with current grid electricity costs. With the highest LCOE observed in some barrios at 21.5 cents/kWh, which remains below the current residential electricity price of 26.74 cents/kWh, solar energy presents a competitive alternative. By reducing reliance on centralized power generation, distributed solar can improve grid resilience and offer a more affordable, sustainable energy option.
Puerto Rico’s future of renewable energy is closely tied to the successful deployment of rooftop solar systems, which could potentially meet or even exceed the archipelago’s electricity consumption. Geospatial analysis reveals that municipalities, particularly those in the central region, possess significant solar generation potential. These areas are not only well-suited for the development of solar energy but also more vulnerable to the impacts of disasters, making solar adoption a critical strategy for improving energy resilience.
The analysis of rooftop solar in Puerto Rico supports the Sustainable Development Goals (SDGs) of the United Nations, particularly SDG 7 (Affordable and Clean Energy) and SDG 13 (Climate Action). Unlike traditional fossil-fuel-based generation, which is costly, emissions-intensive, and reliant on imported fuels, rooftop solar offers a clean, decentralized energy alternative with minimal environmental impact. In the long term, solar installations can significantly reduce household energy costs through self-generation and net metering, contributing to energy affordability and financial resilience. In addition, by reducing greenhouse gas emissions and decreasing dependence on centralized infrastructure, rooftop solar supports climate adaptation and mitigation strategies essential for small island states vulnerable to extreme weather events. By identifying priority deployment zones in underserved areas, this approach addresses energy access gaps and improves local resilience, making rooftop solar a key strategic solution for Puerto Rico’s energy needs and global sustainability goals.
Author Contributions
Conceptualization, M.C.-S. and C.A.P.-B.; Methodology, M.C.-S., A.I.-R. and C.A.P.-B.; Software, C.A.P.-B. and D.F.A.-V.; Formal analysis, C.A.P.-B.; Investigation, C.A.P.-B., W.A.P.-C. and D.F.A.-V.; Resources, C.A.P.-B.; Data curation, C.A.P.-B. and D.F.A.-V.; Writing—original draft preparation, C.A.P.-B.; Writing—review and editing, C.A.P.-B., W.A.P.-C., D.F.A.-V., A.I.-R. and M.C.-S.; Visualization, C.A.P.-B. and W.A.P.-C.; Supervision, M.C.-S.; Funding acquisition, M.C.-S. All authors have read and agreed to the published version of the manuscript.
Funding
This research was funded in part by the US Department of Energy’s projects titled “Puerto Rico Resilience Hubs” awarded through Interstate Renewable Energy Council (IREC), award number DE-ED0000762, and “Opportunities for Distributed Solar to Improve Resilience and Energy Justice in Puerto Rico”, contracted through Sandia National Laboratories, under contract number 1999908, as part of the PR100 Study. Funding for PR100 was provided by the US Federal Emergency Management Agency and performed under the technical management of the Department of Energy Grid Deployment Office. The views expressed in the article do not necessarily represent the views of IREC, the DOE, FEMA, or the US Government. The publisher, by accepting the article for publication, acknowledges that the US Government retains a nonexclusive, paid-up, irrevocable, worldwide license to publish or reproduce the published form of this work, or allow others to do so, for US Government purposes.
Institutional Review Board Statement
Not applicable.
Informed Consent Statement
Not applicable.
Data Availability Statement
All original data sources are publicly available and have been cited within the article.
Conflicts of Interest
The authors declare no conflicts of interest. The funders had no role in the design of the study; in the collection, analyses, or interpretation of data; in the writing of the manuscript; or in the decision to publish the results.
References
- Census Bureau, United States. Puerto Rico Profile. Available online: https://data.census.gov/profile/Puerto_Rico?g=040XX00US72 (accessed on 15 January 2024).
- Smith-Nonini, S. The Debt/Energy Nexus behind Puerto Rico’s Long Blackout: From Fossil Colonialism to New Energy Poverty. Lat. Am. Perspect. 2020, 47, 64–86. [Google Scholar] [CrossRef]
- Rosenberg, M.; Bahramirad, S. Grid Talk: Hardening Puerto Rico-Transforming Our Grid. Available online: https://www.energy.gov/electricity-insights/articles/grid-talk-hardening-puerto-rico-transforming-our-grid (accessed on 15 September 2024).
- LUMA Energy. Limitada Generación Provocará Relevos de Carga. Available online: https://lumapr.com/news/limitada-generacion-provocara-relevos-de-carga/ (accessed on 16 January 2024).
- Guemárez, A. El Nuevo Día. Comienzan Los Relevos de Carga por déFicit de Generación de Energía Eléctrica. Available online: https://www.elnuevodia.com/noticias/locales/notas/comienzan-los-relevos-de-carga-por-deficit-de-generacion-de-energia-electrica/ (accessed on 15 September 2024).
- García-Cooper, R.; Castro-Sitiriche, M.; Irizarry-Rivera, A.; Andrade-Rengifo, F. True cost of electric service: What reliability metrics alone fail to communicate. Electr. J. 2024, 37, 107386. [Google Scholar] [CrossRef]
- de Puerto Rico, G. Puerto Rico Innovation & Technology. Transformación Energética en Puerto Rico. Available online: https://www.energy.pr.gov/transformacion (accessed on 16 September 2024).
- US Energy Information Administration. Puerto Rico Territory Energy Profile. Available online: https://www.eia.gov/state/print.phpsid=RQ#:~:text=Puerto%20Rico%20Territory (accessed on 17 September 2024).
- The Financial Oversight and Management Board for Puerto Rico. 2023 Certified Fiscal Plan for the Puerto Rico Electric Power Authority. Certified Fiscal Plans. Available online: https://oversightboard.pr.gov/fiscal-plans/ (accessed on 5 February 2024).
- Puerto Rico Innovation & Technology Service. Disponibilidad de Geodatos, WFS Mediante Geoserver. Available online: https://gis.pr.gov/Pages/default.aspx (accessed on 21 February 2024).
- García-López, G.A. The Multiple Layers of Environmental Injustice in Contexts of (Un)natural Disasters: The Case of Puerto Rico Post-Hurricane Maria. Environ. Justice 2018, 11, 101–108. [Google Scholar] [CrossRef]
- Méndez-Curbelo, P.; Peña, C.; Pacheco, W.; Castro-Sitiriche, M. Energy Injustice Metrics for Puerto Rico. In Proceedings of the 2023 IEEE 50th Photovoltaic Specialists Conference (PVSC), San Juan, PR, USA, 11–16 June 2023. [Google Scholar] [CrossRef]
- Moscoso-Cabrera, J.; Méndez-Curbelo, P.; Pacheco-Cano, W.; Peña-Becerra, C.; Burgos-Rivera, A.; Jesús-Soto, M.D.; Castro-Sitiriche, M. Boricua Energy Justice as a Humanitarian Claim. In Proceedings of the 2023 IEEE International Humanitarian Technology Conference (IHTC), Santa Marta, Colombia, 1–3 November 2023; pp. 1–6. [Google Scholar] [CrossRef]
- Acevedo, N.; Brock, S.; Angulo, E. Puerto Rico Crisis. Restoring an Earthquake-Hit Power Plant in Puerto Rico Could Take a Year. Available online: https://www.nbcnews.com/news/latino/restoring-earthquake-hit-power-plant-puerto-rico-could-take-year-n1113186 (accessed on 8 February 2024).
- McSorley, A.M. Center for the Study of Racism, Social Justice & Health. Hurricane Fiona Exposes More Than Crumbling Infrastructure in Puerto Rico. Available online: https://www.racialhealthequity.org/blog/annamichellmcsorley/puertorico/hurricanefiona (accessed on 12 February 2024).
- Aros-Vera, F.; Gillian, S.; Rehmar, A.; Rehmar, L. Increasing the resilience of critical infrastructure networks through the strategic location of microgrids: A case study of Hurricane Maria in Puerto Rico. Int. J. Disaster Risk Reduct. 2021, 55, 102055. [Google Scholar] [CrossRef]
- US Department of Energy. Puerto Rico Grid Recovery and Modernization. Available online: https://www.energy.gov/gdo/puerto-rico-grid-recovery-and-modernization (accessed on 14 February 2024).
- US Department of Energy. Puerto Rico Energy Resilience Fund. Available online: https://www.energy.gov/gdo/puerto-rico-energy-resilience-fund (accessed on 14 February 2024).
- Geoff Burrows. Rural Hydro-Electrification and the Colonial New Deal: Modernization, Experts, and Rural Life in Puerto Rico, 1935–1942. Agric. Hist. 2017, 91, 293–319. [Google Scholar] [CrossRef]
- Linda Agosto Flores. Historia de la Autoridad de Energía Eléctrica: Parte 3. 2018; ; Asociación de Jubilados de la Autoridad de Energίa Eléctrica 2017. Available online: https://ajaee.org/2018/04/25/historia-de-la-autoridad-de-energia-electrica-parte-3/ (accessed on 15 February 2024).
- Gobierno de Puerto Rico. Puerto Rico Innovation & Technology. Energy Transformation in Puerto Rico. Interactive Maps. Available online: https://www.energy.pr.gov/en/progress (accessed on 16 September 2024).
- Massol-Deyá, A.; Stephens, J.C.; Colón, J.L. Renewable energy for Puerto Rico. Science 2018, 362, 6410. [Google Scholar] [CrossRef] [PubMed]
- Echevarria, A.; Rivera-Matos, Y.; Irshad, N.; Gregory, C.; Castro-Sitiriche, M.J.; King, R.R.; Miller, C.A. Unleashing Sociotechnical Imaginaries to Advance Just and Sustainable Energy Transitions: The Case of Solar Energy in Puerto Rico. IEEE Trans. Technol. Soc. 2023, 4, 255–268. [Google Scholar] [CrossRef]
- LUMA Energy. The Performance of the Puerto Rico Electric Power Authority. Motion Submitting Quarterly Report on System Data for October Through December 2024 Asunto: Resumen Métricas Máster January 2025. Available online: https://energia.pr.gov/wp-content/uploads/sites/7/2025/01/Resumen-Metricas-Master_January2025.xlsx (accessed on 10 February 2025).
- Santiago, R.; de Onís, C.M.; Lloréns, H. Powering Life in Puerto Rico: The struggle to transform Puerto rico’s flawed energy grid with locally controlled alternatives is a matter of life and death. NACLA Rep. Am. 2020, 52, 178–185. [Google Scholar] [CrossRef]
- US Department of Energy. Island Energy Snapshots—Caribbean and Atlantic Islands. Available online: https://www.energy.gov/eere/island-energy-snapshots (accessed on 22 February 2024).
- US Department of Energy. Puerto Rico Grid Resilience and Transitions to 100% Renewable Energy Study (PR100). Available online: https://www.nrel.gov/docs/fy24osti/88384.pdf (accessed on 3 February 2025).
- Telos Energy. Puerto Rico Distributed Energy Resource Integration Study. Cambio & Institute for Energy Economics and Financial Analysis (IEEFA). 2021. Available online: https://cambiopr.org/wp-content/uploads/2021/03/Puerto-Rico-Distributed-Energy-Resource-Integration-Study-Telos-Energy.pdf (accessed on 2 May 2024).
- National Renewable Energy Laboratory. “LMI Residential Rooftop Solar Potential,” State and Local Planning for Energy. Available online: https://maps.nrel.gov/slope (accessed on 20 February 2025).
- Irizarry–Rivera, A.A.; Colucci–Ríos, J.A.; O’Neill–Carrillo, E. Achievable Renewable Energy Targets for Puerto Rico’s Renewable Energy Portfolio Standard (ARET). 2009. Available online: https://www.uprm.edu/aret/ (accessed on 30 May 2024).
- Google. Bringing Project Sunroof Solar Data to Puerto Rico. 2020. Available online: https://blog.google/products/maps/bringing-project-sunroof-solar-data-puerto-rico/ (accessed on 30 May 2024).
- Puerto Rico Energy Bureau (PREB). Renewable Energy Resource Development. Available online: https://dashboard.energia.pr.gov/Renewables (accessed on 15 January 2025).
- ArcGIS Dashboard. Puerto Rico Solar and Battery Installations—Post-Hurricane María. Available online: https://www.arcgis.com/apps/dashboards/8bff169133f543a4a7c526400b77cded (accessed on 30 May 2024).
- University of Puerto Rico. PV Questionnaire—Resident Survey for the PR100 Study. Available online: http://cohemisferico.uprm.edu/pr100/pdf/Memo02UPRMpr100_PVQuestionnaire.pdf (accessed on 30 May 2024).
- US Energy Information Administration. Form EIA-861M (Formerly EIA-826) Detailed Data. Available online: https://www.eia.gov/electricity/data/eia861m/#:~:text=Form%20EIA%2D861M%2C%20Monthly%20Electric,utilities%20in%20the%20United%20States (accessed on 4 February 2025).
- Krantz, D. Solving Problems like Maria: A Case Study and Review of Collaborative Hurricane-Resilient Solar Energy and Autogestión in Puerto Rico. J. Sustain. Res. 2021, 3, e210004. [Google Scholar] [CrossRef]
- Sweeney, S. Puerto Rico’s Energy Future: Keeping Power with the People. New Labor Forum 2018, 27, 87–92. [Google Scholar] [CrossRef]
- Mooney, M.; Waechter, K. PV Rooftop Database for Puerto Rico (PVRDB-PR); National Renewable Energy Laboratory (NREL): Golden, CO, USA, 2020. [Google Scholar] [CrossRef]
- Generación, Consumo, Costo, Ingresos y Clientes del Sistema Eléctrico de Puerto Rico. Indicadores.pr. Available online: https://www.indicadores.pr/dataset/generacion-consumo-costo-ingresos-y-clientes-del-sistema-electrico-de-puerto-rico (accessed on 5 February 2025).
- Open Energy Data Initiative (OEDI). “Pv-rooftop-pr.” AWS S3 Explorer for the Open Energy Data Initiative. 2020. Available online: https://data.openei.org/s3_viewer?bucket=oedi-data-lake&prefix=pv-rooftop-pr%2F (accessed on 4 February 2025).
- openEDI Project. PV Rooftop Database for Puerto Rico (PVRDB-PR): Methods and Assumptions. Available online: https://github.com/openEDI/documentation/blob/main/PVROOFTOPS_PR.md (accessed on 31 May 2024).
- US Department of Energy. Levelized Cost of Energy (LCOE). 2015. Available online: https://www.energy.gov/sites/prod/files/2015/08/f25/LCOE.pdf (accessed on 31 May 2024).
- Wang, S.; Tae, S.; Jang, H. Prediction of the Energy Self-Sufficiency Rate of Major New Renewable Energy Types Based on Zero-Energy Building Certification Cases in South Korea. Sustainability 2021, 13, 11552. [Google Scholar] [CrossRef]
- Negociado de Energía de Puerto Rico (NEPR). Número de Orden NEPR-MI-2019-0007. FY25-Q3 Performance Metrics by Area- Overall System. Available online: https://energia.pr.gov/numero_orden/nepr-mi-2019-0007/ (accessed on 30 May 2024).
- Tormos-Aponte, F.; García-López, G.; Painter, M.A. Energy inequality and clientelism in the wake of disasters: From colorblind to affirmative power restoration. Energy Policy 2021, 158, 112550. [Google Scholar] [CrossRef]
Disclaimer/Publisher’s Note: The statements, opinions and data contained in all publications are solely those of the individual author(s) and contributor(s) and not of MDPI and/or the editor(s). MDPI and/or the editor(s) disclaim responsibility for any injury to people or property resulting from any ideas, methods, instructions or products referred to in the content. |
© 2025 by the authors. Licensee MDPI, Basel, Switzerland. This article is an open access article distributed under the terms and conditions of the Creative Commons Attribution (CC BY) license (https://creativecommons.org/licenses/by/4.0/).