
Article

The Selection of Optimal Drying and Grinding Techniques to Maximize Polyphenol Yield from Blueberry (Vaccinium corymbosum L.) Powder Extracts

1
Faculty of Chemistry and Technology, University of Split, Ruđera Boškovića 35, 21 000 Split, Croatia
2
Department of Ecology and Agronomy, University of Zadar, Mihovila Pavlinovića 1, 23 000 Zadar, Croatia
3
Faculty of Science, University of Zagreb, Horvatovac 102a, 10 000 Zagreb, Croatia
4
Faculty of Science, University of Split, Ruđera Boškovića 33, 21 000 Split, Croatia
5
Centre for Food Technology and Biotechnology, Faculty of Food Technology and Biotechnology, University of Zagreb, Petra Kasandrića 3, 23 000 Zadar, Croatia
*
Author to whom correspondence should be addressed.
AppliedChem 2026, 6(1), 10; https://doi.org/10.3390/appliedchem6010010
Submission received: 6 November 2025 / Revised: 19 January 2026 / Accepted: 28 January 2026 / Published: 2 February 2026
(This article belongs to the Special Issue Women’s Special Issue Series: AppliedChem)

Abstract

This study investigated the influence of drying techniques such as convection hot-air drying, vacuum drying, and freeze drying with slow and flash pre-freezing on the total phenolic content and the profile of dominant phenolic compounds in cultivated blueberry (Vaccinium corymbosum L.). Although fresh blueberries exhibited higher total phenolic content (1350.85 mg GAE/100 g), total flavonol glycosides (66.20 mg/100 g), and total anthocyanins (218.23 mg/100 g) compared with dried samples, freeze-dried samples, particularly those subjected to flash pre-freezing, retained higher contents of these components in the dried material compared to other drying techniques. This could be attributed to the microstructural preservation of plant tissue during freeze drying. Furthermore, the study demonstrated that subsequent milling of freeze-dried samples, whether using a knife mill or a ball mill, also affects the availability of bioactive compounds in freeze-dried blueberry powders. The combination of flash pre-freezing followed by ball milling yielded the highest availability of bioactive components in the processed blueberry powder.

1. Introduction

The highbush (cultivated) blueberry (Vaccinium corymbosum L., family Ericaceae) is listed among the 100 richest dietary sources of polyphenols according to the Phenol Explorer database and can be classified as a “superfruit” [1]. V. corymbosum is a North American blueberry species, domesticated in the late nineteenth century. It is a perennial shrub reaching up to 4 m in height. The second major commercial species of blueberry is the lowbush (wild) blueberry (V. angustifolium Aiton), which has been harvested since antiquity [2]. Global blueberry production is increasing due to its flavor and numerous health benefits, with international trade currently valued at nearly USD 7 billion and projected to reach USD 10 billion by 2030 [3]. The United States is the largest producer of blueberries, followed by southern Chile and Peru [4,5].
Blueberries can be consumed frozen, fresh, or dried, and are used in the production of various food products such as yogurts, beverages, purée, jams, and jellies. They are also incorporated into pet foods, beauty products and dietary supplements [5]. Blueberries are a rich source of polyphenols, vitamins, minerals and dietary fiber. Phenolic compounds in blueberries are classified into two groups: flavonoids, such as anthocyanins, which are predominantly concentrated in the skin, and non-flavonoids, such as phenolic acids. Anthocyanins account for up to 60% of the total polyphenol content in ripe blueberries [6]. The most common anthocyanins in blueberries are delphinidin, cyanidin, malvidin, and petunidin and their concentration varies between 137 and 272 mg/kg [7,8,9].
The scientific literature on the phytochemical and health-promoting potentials of blueberries is comprehensive [10]. Currently established health benefits of blueberry consumption are associated with the prevention of pre-diabetes and type 2 diabetes, cardiovascular diseases, brain health, cognitive function, and the gut balance [11]. Furthermore, studies also suggest that blueberry consumption inhibits oxidative stress, inflammation, cholesterol metabolism, and supports gut microbiota balance [4].
Blueberries are highly perishable fruit, susceptible to rapid spoilage due to their high water content (81–87%) and must be preserved by freezing or drying to extend their shelf life. Dried blueberries represent a profitable and rapidly expanding market [12]. The global dried blueberries market is valued at approximately USD 6.16 billion in 2024 and is projected to reach USD 10.20 billion by 2032 [13]. Studies on novel drying methods for producing high-quality dried blueberries focus on preserving the dominant phenolic compounds. Available studies on putative higher phenolic content, and consequently higher antioxidant activity, of dried blueberries compared to fresh ones, as well as the effect of various drying techniques on total phenolic content, have produced highly controversial results. Some authors reported that freeze-dried blueberries contained the highest total anthocyanin content compared to blueberries dried by hot-air drying, vacuum drying, and infrared drying, and exhibited the highest antiproliferative activity against A549 and H1299 cell lines. However, other studies found no significant differences in total anthocyanin content between freeze drying and convection hot-air drying [12,14]. Ngo et al. [15] reported that freeze drying preserved the content of anthocyanins, sugars and organic acids in blueberries more effectively than hot-air drying and dehumidified-air drying. In contrast, Zhang et al. [16] found that microwave vacuum drying resulted in the highest levels of total phenols and total anthocyanins in blueberries compared with freeze drying, hot-air drying, and microwave vacuum drying. These inconsistencies may be attributed to the inherent difficulties of the blueberry drying process and to the variations in process parameters (temperature, humidity, thickness). Blueberries have a dense wax coating on the peel, which protects the berry from drying, and require pre-treatments (enzymatic, ultrasonic, mechanical cutting, chemical additives) before drying [17]. Petrova et al. [17] reported that mechanical pre-treatment of blueberries with a knife blade is the best method to preserve the characteristics of the berries, as it has almost no effect on the quality of the whole fruit. In addition, blueberries have high sugar content, and as moisture is removed during drying, the sugars become concentrated and slow the drying process.
Even though hot-air drying is a widely used technique, it is nevertheless characterized by long drying times due to slow diffusion of moisture from the center to the surface of the sample, and it carries a high potential for oxidation. Vacuum drying is characterized by higher drying rates, lower temperature, and reduced pressure, which lowers the boiling point of water and accelerates evaporation. Freeze drying is a low-temperature, low-pressure dehydration process in which frozen water is removed by sublimation. Samples can be frozen either slowly or rapidly (flash freezing). Flash freeze drying is carried out under extremely rapid freezing, which reduces excessive cell shrinkage and prevents the formation of large ice crystals within the sample [18]. Flash freezing results in a numerous fine ice crystals, distributed both outside and inside the cells, thereby ensuring minimal damage to the texture, which preserves the quality parameters of the fruit [19]. Excepting the formation of small ice crystals in food matrices, flash freezing by liquid nitrogen is characterized by high heat transfer coefficient, fast freezing rate, and short freezing time and can result in better preservation of phenolic compounds [20].
To improve the availability of phenolic compounds after drying, blueberries are milled in order to decrease particle size, i.e., increasing surface area and facilitating their extraction. Appropriate selection of drying and grinding techniques may drastically improve the quality of blueberry extracts and could significantly increase total anthocyanin content. Although many studies on blueberry preservation have been conducted, research on the optimal selection of drying and subsequent milling methods for producing anthocyanin-rich blueberry powder still remains scarce.
This study aims to select the optimal drying and milling techniques for blueberries to preserve total phenolic content, maximize anthocyanins yield, and enhance the nutritional value of blueberries. Three different drying techniques were selected: convection hot-air drying, vacuum drying and freeze drying with slow and flash pre-freezing. In both fresh and dried blueberries, total phenolic content and the identification of dominant phenolic compounds were determined, and microstructural characterization of fresh and dried samples was performed using light microscopy. After selecting the optimal drying technique, dried samples were ground using a knife mill and a ball mill. Total phenolic content and identification of dominant phenolic compounds were determined in blueberry powder extracts. Particle size distribution, color parameters, and surface microstructural analysis using scanning electron microscopy were carried out on the blueberry powder.

2. Materials and Methods

2.1. Plant Material

Fresh blueberries (500 g) were purchased from a local grocery store (INTERSPAR hypermarket, brand “Vrtovi Hrvatske”, Split, Croatia). The variety is V. corymbosum (cultivated, North American species of blueberry). A portion of the sample (62 g) was taken for extraction of fresh plant material, and the other three portions (3 × 109.5 g) were subjected to different drying methods: freeze drying, convection hot-air drying, and vacuum drying (Figure 1).

2.2. Drying of Plant Material

2.2.1. Freeze Drying

The plant material was freeze-dried for 48 h using a freeze-dryer (FreeZone 2.5, Labconco, Kansas City, MO, USA) at a temperature of −50 °C (±0.4 °C) and a pressure of 0.122 (±0.007) mbar. Due to the waxy skin of blueberries, known as “bloom”, which acts as a strong protective layer, the fruits were cut in half before freeze drying (mechanical pre-treatment). In addition, prior to freeze drying, one portion of the samples (109.5 g) was stored in Ziplock bags (26 × 27 cm) at −80 °C (slow freezing) in an automated sample cold storage system (Thermo Scientific HERAfreeze, Marietta, OH, USA), while the other portion of plant material (109.5 g) was treated with liquid nitrogen (−196 °C) immediately prior to freeze drying (flash freezing). Dried samples were stored in sealed plastic bags, treated with inert gas (helium), and subjected to analyses as soon as possible because of the high sugar content in the fruits (the drying process was performed without encapsulating agents).

2.2.2. Convection Drying

Fresh blueberry samples (109.5 g) were cut in half before drying and placed in a convection drying oven (Memmert, UF 30, Fisher Scientific, Roskilde, Denmark) for 10 h, with samples weighed at a constant temperature of 60 °C under atmospheric pressure. Dried samples were stored in sealed plastic bags, treated with inert gas (helium), and used for analyses as soon as possible.

2.2.3. Vacuum Drying

Fresh blueberry samples (109.5 g) were cut in half before drying and placed in a vacuum drying oven (Thermo Fischer Scientific, 3608-ICE, Roskilde, Denmark) for 8 h, at 60 °C and a pressure of 78 mm Hg until the samples reached a constant mass. The dried samples were stored in sealed plastic bags, treated with inert gas (helium), and used for analyses as soon as possible.

2.3. Microstructural Indicators of Drying Process Scanned by Light Microscopy

Samples of raw and dried blueberries were fixed in 10% formaldehyde and dehydrated in an ascending series of ethanol. Paraffin impregnation was performed in three paraffin baths (each for one hour at 58 °C). The samples were then embedded in paraffin blocks using the HistoCore Arcadia (Leica, Nussloch, Germany). The slide microtome SM 2012R (Leica, Nussloch, Germany) was used to obtain 5 μm thick sections. The sections were stained with Periodic Acid Schiff as described by Umana et al. [21] and observed under a DM3000 LED (Leica, Nussloch, Germany) light microscope. Photomicrographs were taken with a DMC 4500 (Leica, Nussloch, Germany) digital camera.

2.4. Grinding of Dried Plant Material

Dried plant material obtained by different drying techniques was ground using (a) a coffee grinder for 3 min with occasional breaks to prevent heating and reduce the rate of oxidative deterioration of the plant material, and (b) ball milling (Retsch, MM 400, Berlin, Germany) for 3 min at a frequency of 30 Hz. For both methods, 14 g of dried plant material was used.

2.5. Characterization of Fine Blueberry Powder Obtained After Freeze Drying with Slow and Flash Freezing

2.5.1. Particle-Size Distribution (PSD)

Particle size distribution was determined using standard sieves with mesh sizes ranging from 1000 to 63 µm on a Retsch vibratory sieve shaker (Retsch AS 200 Basic, Berlin, Germany). Sieving time was 10 min with an amplitude of 1.5 mm.
The mean diameters and standard deviations of the powder particles from the analyzed samples were calculated using the formulas described in previous studies [22,23].

2.5.2. Color

The color of the freeze-dried blueberry powder was determined using a colorimeter (Konica Minolta CR-5, Tokyo, Japan). Before the measurements, the device was calibrated with a white calibration plate. The top facing measurement port was set to 3 mm. The color parameters were defined according to the CIE scale: L*—lightness (brightness), a*—red component (redness), b*—yellow component (yellowness) [12].

2.5.3. Powder Surface Microstructure by Scanning Electron Microscopy (SEM)

A Schottky field emission scanning electron microscope JEOL JSM-7610FPlus (JEOL Ltd., Tokyo, Japan) was used to determine the microstructure of freeze-dried blueberry powder produced by knife and ball milling. Samples were coated with a thick gold layer (5 nm) using the Quorum Q150 ES plus sputter coater (Quorum, Laughton, UK). The signal from backscattered electrons was used for imaging, with an acceleration voltage of 1 kV and a working distance of 15 mm.

2.6. Extraction of Phenolic Compounds from Fresh and Dried Blueberry and from Blueberry Fine Powder

Extraction of phenolic compounds from fresh and dried blueberry samples, as well as from blueberry fine powder obtained by grinding with a knife mill and a ball mill, was based on the method described by Elez et al. [24]. Two grams of the sample were placed in an Erlenmeyer flask, and 8 mL of an 80% methanol–water solution (v/v) containing 1% formic acid was added. The flask was treated with inert gas (helium), and the extraction procedure was conducted in an ultrasonic bath at a frequency of 40 kHz (Digital Pro, Argolab, Capri, Italy) at a temperature of 50 °C for 15 min. The extract was filtered through Whatman No. 40 filter paper (Whatman International Ltd., Kent, UK), and the filtrates were adjusted to 10 mL in a volumetric flask with the solvent. The obtained extracts were used for the determination of total phenolic content and HPLC-DAD analysis of phenolic compounds. All treatments were carried out in triplicate.

2.7. Determination of Total Phenolic Content (TPC)

The total phenolic content (TPC) was determined in extracts from fresh and dried blueberries, as well as from blueberry powder obtained by grinding freeze-dried blueberries subjected to slow and flash pre-freezing. The total phenolic content was measured using a spectrophotometer (UV-1900i Shimadzu, Tokyo, Japan) based on the method of Singleton and Rossi [25]. Gallic acid was used as a standard and the results were expressed in grams of gallic acid equivalents (GAEs) per liter of extract. Measurements were repeated in triplicate.

2.8. HPLC-DAD Analysis of Phenolic Compounds

Analysis of phenolic compounds from extracts prepared from fresh and dried blueberries, as well as from freeze-dried blueberry powder, after grinding with a knife and ball mill, was performed using HPLC with a DAD detector (Agilent 1260 Quaternary LC Infinity System, Agilent Technologies, Santa Clara, CA, USA) according to the method described by Zorić et al. [26]. The extract samples were filtered through 0.45 µm syringe filters (Macherey-Nagel GmbH & Co. KG, Duren, Germany) into glass vials. An automatic injector and Chemstation software (v. C.01.03) (Agilent, Santa Clara, CA, USA) were used for data processing and instrument control. Phenolic compounds were separated using a chromatographic column (250 × 4.6 mm) (Luna 100-5C18, Phenomenex, Aschaffenburg, Germany), with an injection volume of 5 µL. Mobile phase A contained 3% formic acid in water, while B solution contained 3% formic acid in 80% acetonitrile. The gradient was as follows: 0–28 min 0% B, 28–32 min 25% B, 35–40 min 50% B, 40–45 min 80% B, and the last 10 min 0% B. The flow rate was 0.8 mL/min. Detection was performed using a UV/Vis photo diode detector at wavelengths from 220 to 570 nm. Anthocyanins were identified at λ = 520 nm, phenolic acids at λ = 280 nm, and flavonol glycosides at λ = 360 nm. Anthocyanins were identified by comparing their retention times and absorption spectra with those of standards (dephinidin-3-glucoside, cyaniding-3-glucoside, petunidin-3-glucoside, peonidin-3-glucoside, malvidin-3-glucoside). The concentrations of standards ranged from 15 to 100 mg/L and were prepared in methanol with 1% formic acid. Other phenolic compounds were identified by comparing their retention times and absorption spectra with standards prepared in methanol (chlorogenic acid, caffeic acid, p-coumaric acid, gallic acid, procyanidins B1 and B6, epigallocatechin gallate, catechin, quercetin-3-glucoside and kaempferol-3-rutinoside). The concentrations of standards ranged from 10 to 50 mg/L for phenolic acids and 25 to 200 mg/L for flavonol glycosides. All results were expressed as mg/L in the form of mean value ± standard deviation.

2.9. Statistical Analysis

Statistical analysis was performed using Statistica v. 14.1.08 (TIBCO, San Ramon, CA, USA). All experiments were conducted in triplicate, and sample means were compared using one-way analysis of variance (ANOVA) followed by post hoc Duncan’s new multiple range test (DNMRT). Results were considered statistically significant when p ≤ 0.05.

3. Results and Discussion

3.1. Effect of Drying on Total Phenolic Contents, Composition and the Cell Morphology

Blueberries are considered a “superfruit” due to their high concentration of phenolic compounds, especially anthocyanins—a subgroup of flavonoids responsible for their blue-purple color. Due to their high moisture content (approximately 81–87%), blueberries have a relatively short shelf life compared to many other fruits, making drying an effective method for prolonging their shelf life. The results presented in Table 1 show that the applied drying methods significantly reduced the total phenolic content in blueberries. Fresh blueberries (FB) exhibited the highest total phenolic content (1350.85 mg GAE/100 g d.w.) followed by the dried samples: freeze-dried blueberries with flash pre-freezing (FDFF) (989.12 mg GAE/100 g d.w.), freeze-dried blueberries with slow pre-freezing (FDSF) (725.23 mg GAE/100 g d.w.), vacuum-dried blueberries (VD) (621.45 mg GAE/100 g d.w.) and convection hot-air dried blueberries (CD) (453.11 mg GAE/100 g d.w.). Freeze drying with flash pre-freezing reduced the total phenolic content by 26.78% compared to fresh blueberries. Freeze drying with slow pre-freezing resulted in a 46.32% decrease compared to fresh blueberries, while the reduction in total phenolic content was even more pronounced after vacuum drying (54%) and convection hot-air drying (66.46%). Freeze drying causes a loss of the total phenolic content in starfruit, mango, papaya, and watermelon compared to their fresh samples [27]. These findings confirm that phenolic compounds are highly unstable and may be lost during the drying process [28].
Muñoz-Fariña et al. [14] investigated the effect of different drying methods on the phenolic compound content of cultivated blueberries. According to their results, convection hot-air drying (CD) was the most effective method for preserving phenolic compounds, and no significant differences were observed in total anthocyanin content between convection hot-air drying (CD) and freeze drying (FD). Their study found that freeze drying reduced the proportion of total phenolic content by up to 63%. Akcicek et al. [29] studied the effect of four drying techniques, including vacuum drying, freeze drying, convection hot-air drying, and ultrasound-assisted vacuum drying, on total phenolic content in blueberries. Their results showed that freeze drying had the least impact on total phenolic content, while all other drying techniques caused a significant reduction. The results of their study are consistent with those of the present study and confirm that the preservation of total phenolic content was the highest after freeze drying, followed by vacuum drying, and then convection hot-air drying. Results from numerous studies on the influence of drying techniques on the total phenolic content in blueberries remain inconsistent. Some findings have shown that total phenolic content in freeze-dried blueberries is significantly higher than in fresh blueberries [30], while other studies have reported higher phenolic content in fresh blueberries compared to freeze-dried ones [31,32]. In addition, there are conflicting findings regarding the effect of freeze drying versus hot-air drying [14,30], as well as hot-air drying versus vacuum drying [33], on the preservation of total phenolic content in blueberries. These differences could be explained by variations in drying conditions (time, temperature, air flow rates, etc.), pre-treatment procedures (mechanical, chemical, enzymatic, etc.), and variability among different cultivars of blueberries. The mechanical pre-treatment, applied in this study (cutting the fruit into two equal parts), is considered as one of the most effective ways to preserve the quality of blueberries, as it has minimal impact on the quality of the whole fruit [17]. For industrial production, intact fruit can be pre-treated using a pulsed electric field, a carbon dioxide laser, or blanching with steam [17].
Table 2 shows the phenolic composition (expressed as mg/100 g) of fresh and dried blueberries, determined using the HPLC-DAD technique.
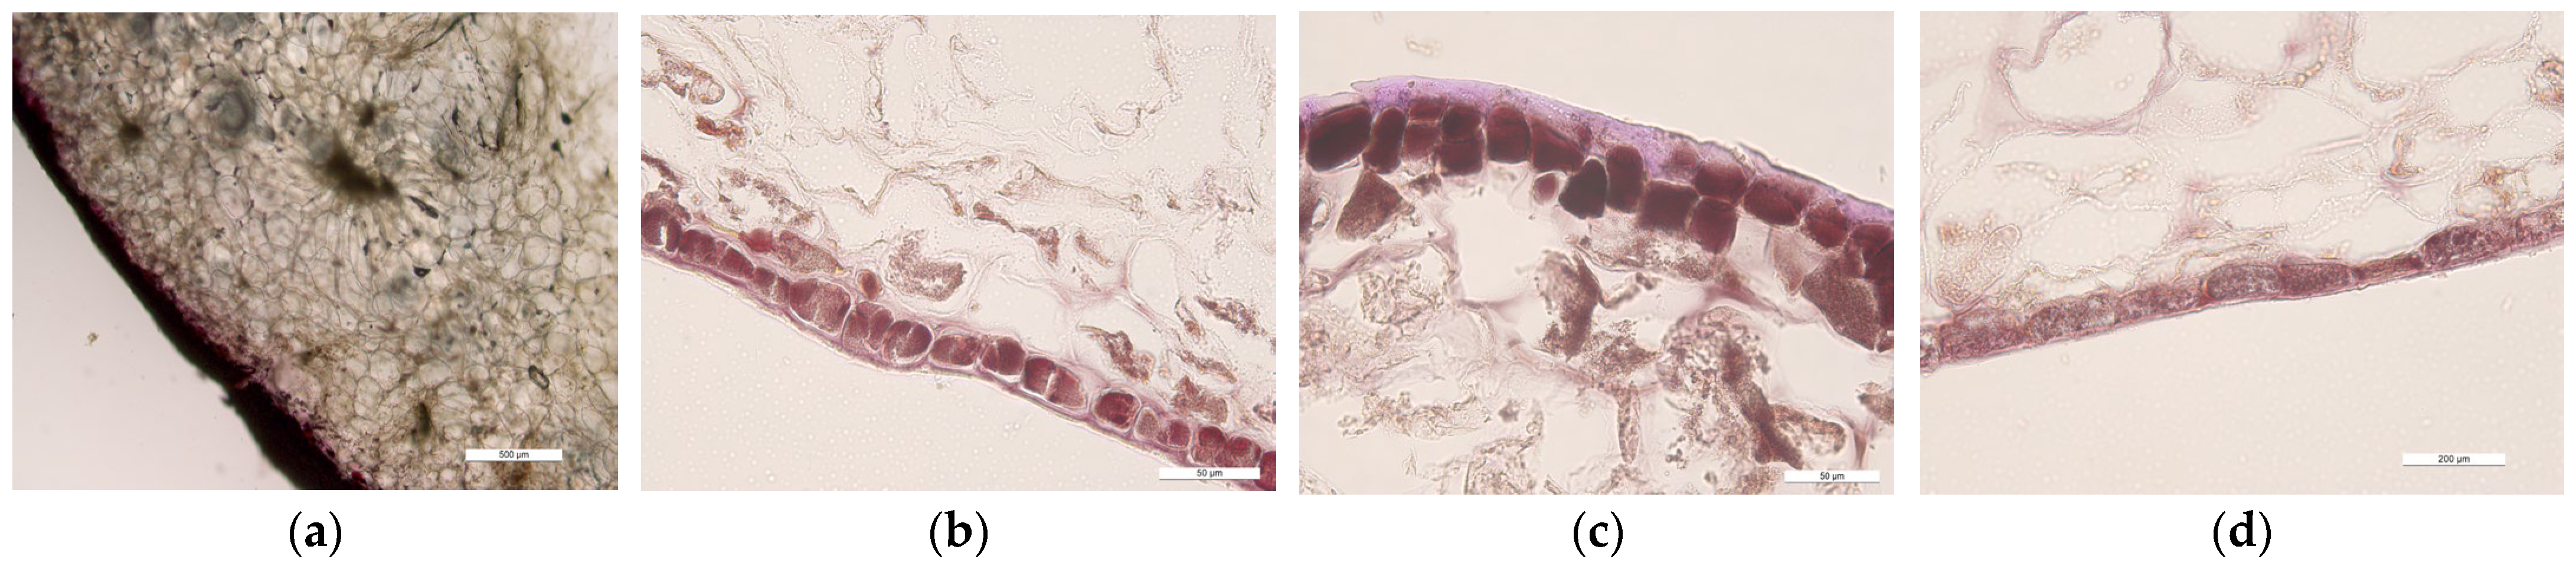
The predominant phenolic acid in fresh blueberries is chlorogenic acid, as reported in previous studies [7,34]. Chlorogenic acid is an ester of caffeic acid and quinic acid. Due to the unsaturated double bonds in its structure, it is unstable, easily oxidized, and can undergo isomerization reactions, yielding neochlorogenic acid, cryptochlorogenic acid, and/or other isomers. This results in a higher content of chlorogenic acid transformation/degradation products in dried fruits [35,36], as also reported in this study (Table 2). This effect is more pronounced in freeze-dried blueberries with flash pre-freezing (FDFF—56.97 mg/100 g) and slow pre-freezing (FDSF—51.57 mg/100 g) than in vacuum-dried (VD—21.84 mg/100 g) and convection hot-air dried (CD—7.93 mg/100 g) blueberries. Interestingly, some authors have explained the increase in chlorogenic acid during freezing by the accumulation of sugars [37]. Fresh blueberries (FB) contained a higher total flavonol glycosides content (66.20 mg/100 g) compared to freeze-dried blueberries with flash pre-freezing (FDFF) (46.66 mg/100 g), freeze-dried blueberries with slow pre-freezing (FDSF) (41.28 mg/100 g), vacuum-dried blueberries (VD) (18.16 mg/100 g) and convection hot-air dried blueberries (CD) (5.57 mg/100 g). The dominant flavonol glycoside in blueberries was quercetin-glucoside (45.57 mg/100 g in FB). The decrease in total flavonol glycosides content after drying was as follows: 29.52% after freeze drying with flash pre-freezing, 37.65% after freeze drying with slow pre-freezing, 72.57% after vacuum drying, and 91.59% after convection hot-air drying. The lower content of flavonol glycosides after drying is explained by their degradation under conditions of heating, oxidation, and pre-freezing [38]. Seke et al. [27] found that freeze drying reduced the concentration of flavonoid glycosides in C. macrocarpa and explained it by the disruption of cells and decompartmentalization that had facilitated the contact and activity of enzymes. The dominant anthocyanins in fresh blueberries (FB) were malvidin-3-galactoside (45.83 mg/100 g), delphinidin-3-galactoside (40.54 mg/100 g), malvidin-3-arabinoside (28.72 mg/100 g), and delphinidin-3-arabinoside (23.62 mg/100 g), which is consistent with the results of other authors [7,39]. In this study, fresh blueberries (FB) had a higher total anthocyanin content (218.23 mg/100 g) compared to freeze-dried blueberries with flash pre-freezing (FDFF) (157.77 mg/100 g), freeze-dried blueberries with slow pre-freezing (FDSF) (122.04 mg/100 g), vacuum-dried blueberries (VD) (76.22 mg/100 g), and convection hot-air dried blueberries (CD) (41.20 mg/100 g) (Table 2). The decrease in total anthocyanin content after drying was as follows: 27.71% after freeze drying with flash pre-freezing, 44.08% after freeze drying with slow pre-freezing, 65.08% after vacuum drying, and 81.13% after convection hot-air drying. Freeze-dried blueberries with flash pre-freezing retain high levels of anthocyanins, while their significant loss after vacuum and convection hot-air drying can be explained by thermal degradation [40]. Muñoz-Fariña et al. [14] did not observe an influence of convection hot-air drying on the concentration of cyanidin-3-glucoside. In contrast, Nemzer et al. [41] observed a higher proportion of total anthocyanin content in blueberries after freeze drying compared to convection hot-air drying. Ochmian et al. [42] attribute the loss of anthocyanin from blueberry fruits after convection hot-air drying to increased polyphenol oxidase enzyme activity. Uribe et al. [12] found that freeze drying best preserved total anthocyanin content, which decreased significantly with other drying methods (hot-air drying, vacuum drying, infrared drying). In contrast to flavonol glycosides, the loss of anthocyanins in dried blueberries was lower because they are concentrated in the skin, which acts as a protective barrier with cell structure resisting damage from pre-freezing and drying better than the softer pulp cells (see Figure 2a–d).
Drying significantly influenced cell morphology. Light microscopy was used to compare the cell morphology of fresh and dried blueberries. As shown in Figure 2a, the parenchyma cells in fresh blueberries were intact, with prominent cell walls and clearly visible filamentous structures. Parenchyma cells in dried blueberries lost their typical arrangement and became expanded, especially after convection hot-air drying (Figure 2b). This is consistent with other studies [12]. Unlike parenchyma cells, the skin cells remained preserved during drying due to their hardness and imperforation. Notably, in freeze-dried blueberries (Figure 2d), the cell surface area increased, the cells became deformed and generally elongated, but the tissue is not as degraded as in samples after convection and vacuum drying (Figure 2b,c). Freeze drying preserves the cells because the water in them sublimates directly from ice to gas, thus reducing the risk of damage.

3.2. Characterization of Freeze-Dried Blueberry Powder

Freeze-dried blueberries with slow (FDSF) and flash pre-freezing (FDFF) retain high levels of total phenolic compounds compared to blueberries dried by vacuum drying (VD) and convection hot-air drying (CD), as shown in Table 1. Therefore, freeze-dried samples were milled using a knife mill and a ball mill to achieve a higher yield of phenolic compounds, especially anthocyanins, in the blueberry powder extracts, by increasing their availability through the enlarged powder surface area generated during milling. Table 3 shows the effect of milling on the yield of total phenolic compounds in freeze-dried blueberries. Milling with both techniques resulted in an increased content of total phenolic compounds in the freeze-dried blueberries extracts. This is to be expected, since phenolic content in extracts increases as the particle size of the powder decreases [43]. Furthermore, powder extracts from freeze-dried blueberries with flash pre-freezing (FDFF), after both milling techniques, resulted in higher total phenolic content than powder extracts from freeze drying with slow pre-freezing (FDSF). Both milling techniques have a similar effect on the efficiency of extraction of total phenolic content from freeze-dried blueberries, although the results showed that ball milling was slightly more efficient than knife milling (Table 3). It has already been reported that ball milling improves the availability of phenolic compounds in powders [44]. However, to the best of our knowledge, no studies have compared the effect of ball and knife milling on the extraction of phenolic compounds from milled blueberries.
Table 4 shows the composition of phenolic compounds in extracts from freeze-dried blueberry powders obtained by knife and ball milling. The extract from freeze-dried blueberry powder with slow pre-freezing obtained after knife milling (FDSF-K) exhibited the highest concentration of chlorogenic acid degradation/transformation products (183.15 mg/100 g) compared to freeze-dried blueberry with slow pre-freezing obtained after ball milling (FDSF-B) (111.11 mg/100 g), freeze-dried blueberry with flash pre-freezing obtained after knife milling (FDFF-K) (97.20 mg/100 g), and freeze-dried blueberry with flash pre-freezing obtained after ball milling (FDFF-B) (77.88 mg/100 g) (Table 4). The results indicate that the content of chlorogenic acid in the processed blueberry powders depends on the sample treatment prior to drying, including whether slow or flash freezing was applied, as well as the post-drying milling technique. The differences caused by the freezing method can be attributed to the effect of crystallization kinetics during freezing on the material’s morphological properties. Flash freezing promotes ice nucleation at lower temperatures, causing a high nucleation rate and slow crystal growth and producing many small ice crystals. Conversely, slow freezing leads to nucleation at higher temperatures, forming fewer nuclei but allowing more pronounced crystal growth, resulting in fewer but larger ice crystals [45,46]. The formation and growth of large crystals may destroy fruit tissue, thereby facilitating compound migration and potentially reducing their stability or availability. The content of chlorogenic acid transformation/degradation products increased after drying, as reported by other studies [34,35]. Furthermore, its tendency to form transformation/degradation products easily after cutting explains its significant increase after ball and knife milling [47]. Both milling techniques resulted in the loss of flavonol glycosides in all samples, except for quercetin glucoside and kaempferol-rutinoside (Table 2 and Table 4). The highest content of quercetin glucoside was found in extracts from powders of freeze-dried blueberry with slow pre-freezing obtained after knife milling (FDSF-K) (38.76 mg/100 g) followed by freeze-dried blueberry with flash pre-freezing obtained after knife milling (FDFF-K) (29.65 mg/100 g). According to the literature, flavonoids are thermally unstable and susceptible to oxidative degradation which may explain their almost complete degradation after knife and ball milling. Mechanical forces also break cell walls and release intracellular content. It is known that flavonoids are located in the vacuoles of epidermal cells which are more damaged by milling than waxy layer epidermal cells [48]. We can speculate about the retention of only two flavonol glycosides, quercetin glucoside and kaempferol rutinoside, in extracts from milled powders. The role of the food matrix is known to be very complex, and the high fiber content in blueberries may be one possible reason for their retention. Generally, there is a lack of studies on the effect of various milling techniques on the stability of flavonoids. The total anthocyanin content in extracts from freeze-dried blueberry powder after both milling techniques was very high (376.00 mg/100–824 mg/100 g). This content was, on average, 38.5% higher in powder extracts from freeze-dried blueberries with flash pre-freezing than with slow pre-freezing, and 22.4% higher in the powder extract obtained after knife milling than after ball milling (Table 4). Anthocyanins are very unstable compounds, but their location in plant tissue differs from that of flavonol glycosides. In blueberries, anthocyanins are concentrated in the waxy layer of epidermal cells, which are more resistant to degradation than parenchyma pulp cells (Figure 2a–d). Interestingly, some anthocyanins (malvidin-3-glucoside, delphinidin-3-glucoside, malvidin-3-arabinoside, peonidin-3-glucoside) are not detected in the extracts from milled freeze-dried blueberries with flash pre-freezing. These anthocyanins are detected after both milling processes in extracts from freeze-dried blueberries with slow pre-freezing, as well as after freeze drying. The effect of flash pre-freezing combined with the milling process and/or their extraction from the plant matrix can be postulated as a reason for their disappearance. However, this remains speculative, as it is not possible to find an answer in the available literature.
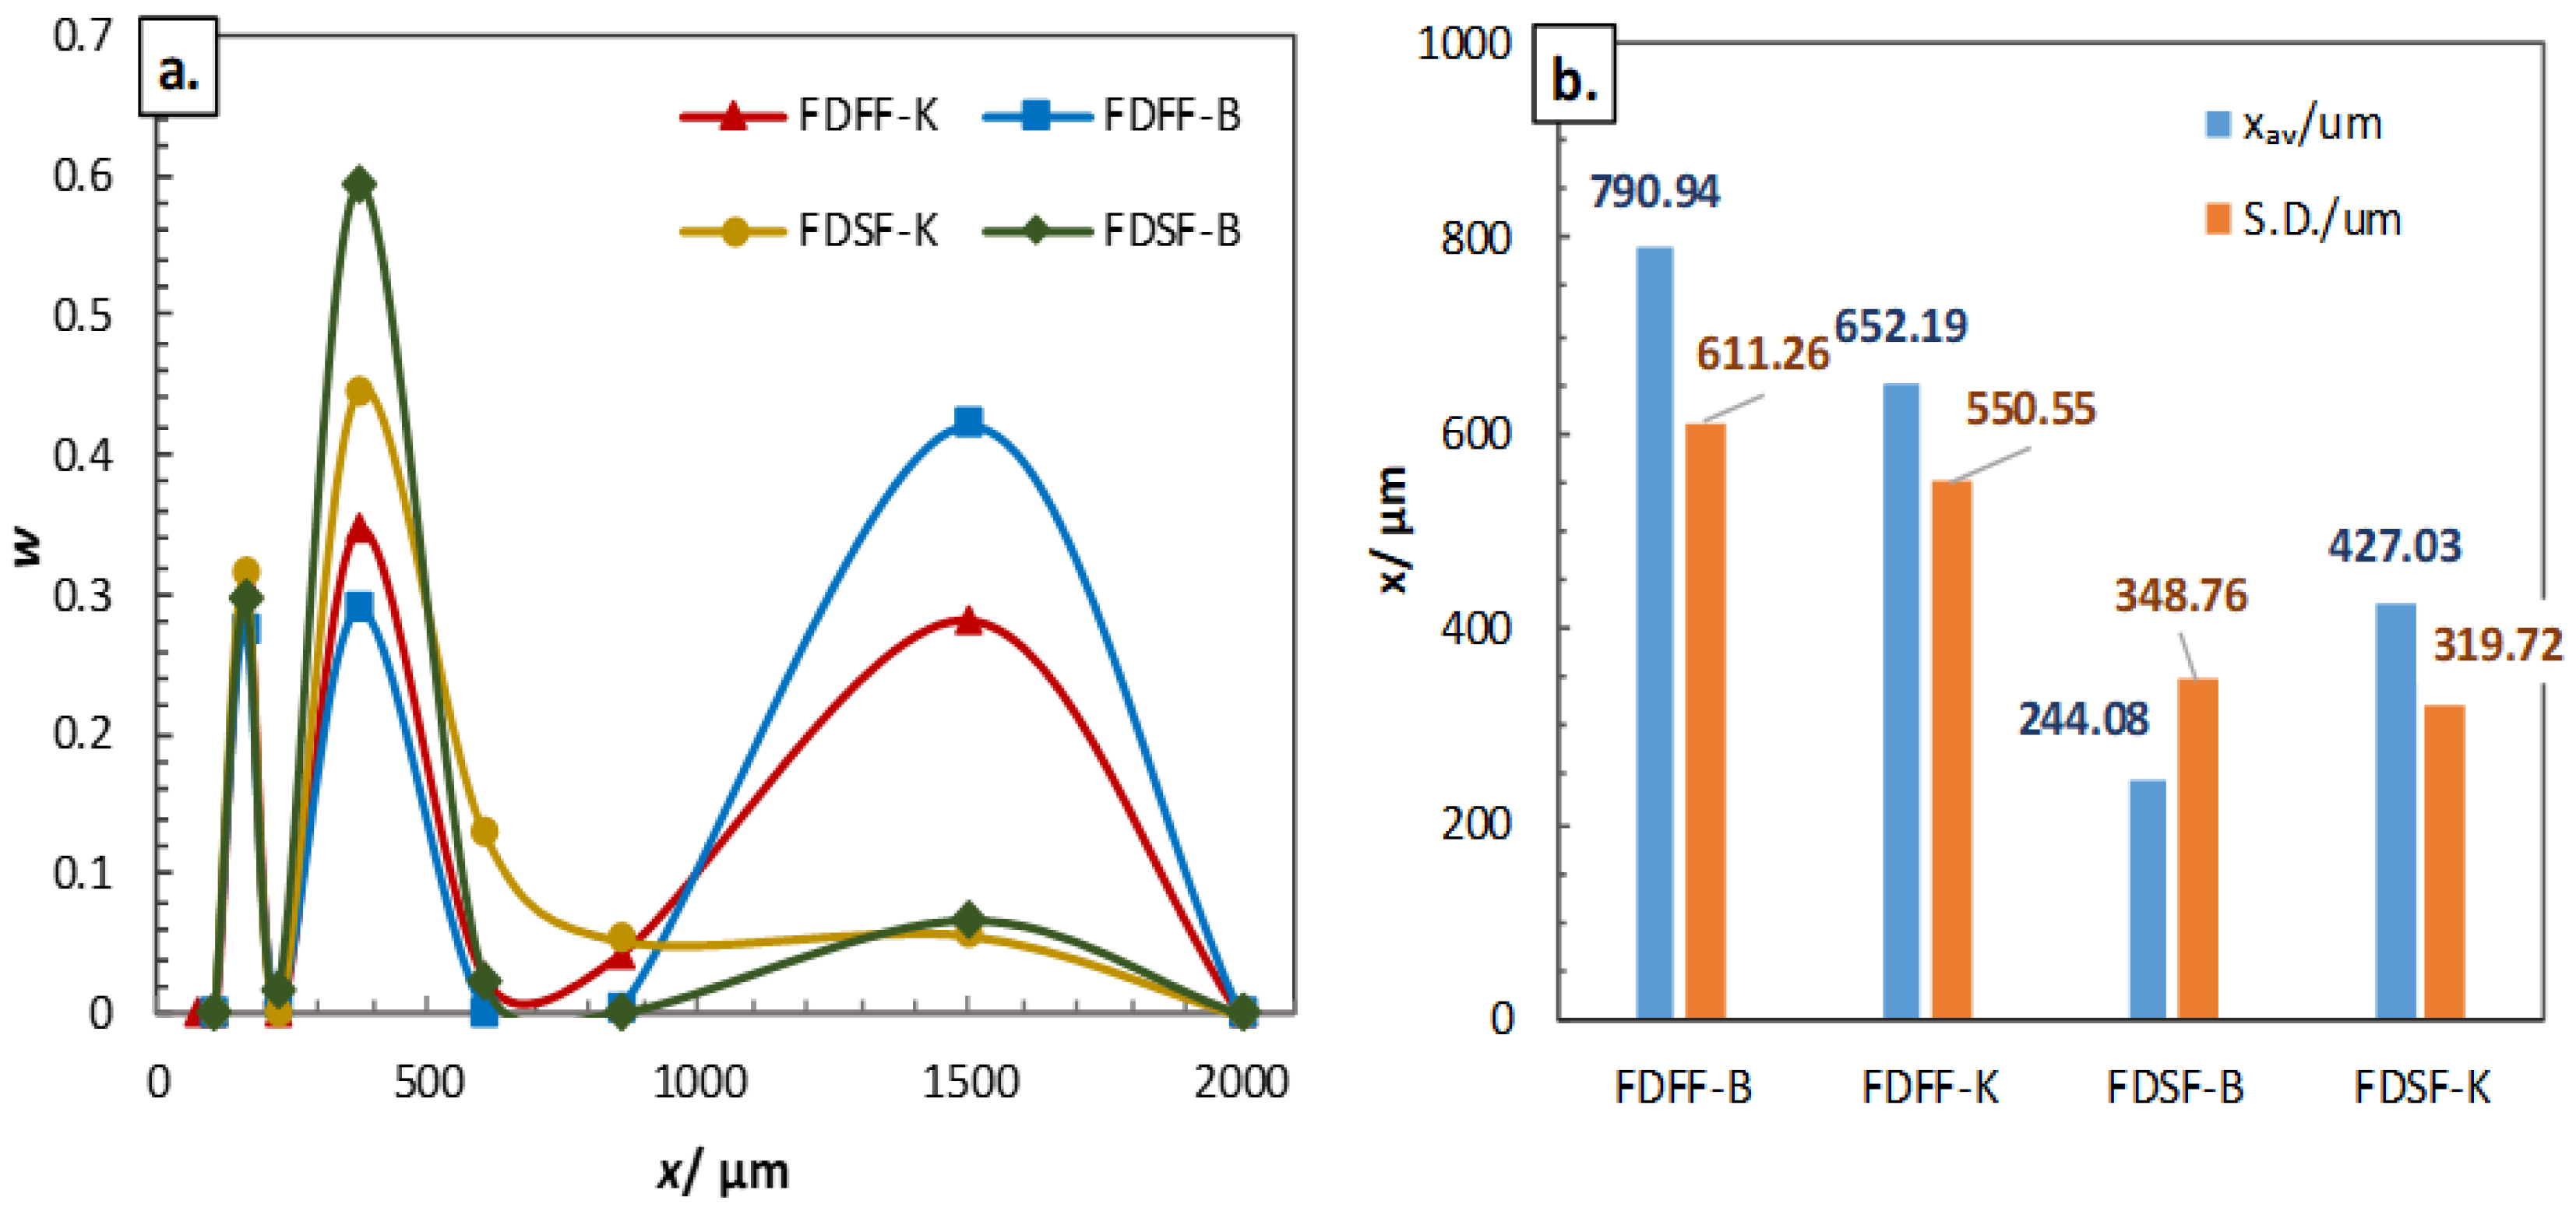
Particle size is a crucial factor influencing the physicochemical properties of the powder and enhances the extraction rate of bioactive compounds. The mass-based particle size distributions of the milled products, shown in Figure 3a, indicate that the mass distribution of particle sizes is trimodal for all four analyzed samples. However, in freeze-dried blueberry powder with slow pre-freezing obtained after knife milling (FDSF-K), the peak in the coarse particle region (x = 1500 µm) disappears. The first mode of the distribution function, corresponding to particle sizes of 163 µm, is located in the fine particle region and is almost identical for all four samples. In contrast, in the intermediate (around 375 µm) and coarse fractions, at mode sizes of x = 375 µm and x = 1500 µm, respectively, more pronounced differences are observed. A higher ratio of coarse particles indicates weaker comminution of the samples, which predominates in powders that were rapidly cooled prior to freeze drying and milling. This effect is more pronounced in the sample processed by ball milling. As the grinding of large particles was less efficient in these samples, their modes in the size range around 375 µm are lower. Conversely, the slowly frozen powders were more susceptible to comminution (both in the knife and ball mills), showing a more prominent share of particles in the intermediate fraction, with a higher proportion of these particles ground in the ball mill. Considering the distribution parameters, the average particle size, xav, and its standard deviation S.D. (Figure 3b), it is evident that the rapidly frozen samples had significantly larger particle sizes after milling. After ball milling, the rapidly frozen products exhibited particle sizes more than three times larger than those of the slowly cooled samples. In the knife mill, this ratio was smaller, amounting to 1.5 times. These results clearly demonstrate that the freezing process significantly influenced the structural properties of the material due to the kinetics of ice crystallization, which in turn affected the milling process. Based on the granulometric properties of the milled products, it is likely that flash freezing, due to less pronounced ice crystal growth, caused a denser structure in the freeze-dried product, which was less prone to milling compared to the sample that had been slowly frozen prior to drying. It should be emphasized that the coarse particle fractions for all four samples consist predominantly of skin. Milling of skin, which is less prone to milling, is more efficiently conducted in a knife mill, as it is better suited for comminution of fibrous materials. Although the particles obtained after pre-freezing are larger, and thus have a smaller external specific surface area, component extraction was enhanced due to the porosity of the freeze-dried powders. In particular, the wider pores facilitated solute transport from the particle interior to the surface during extraction.
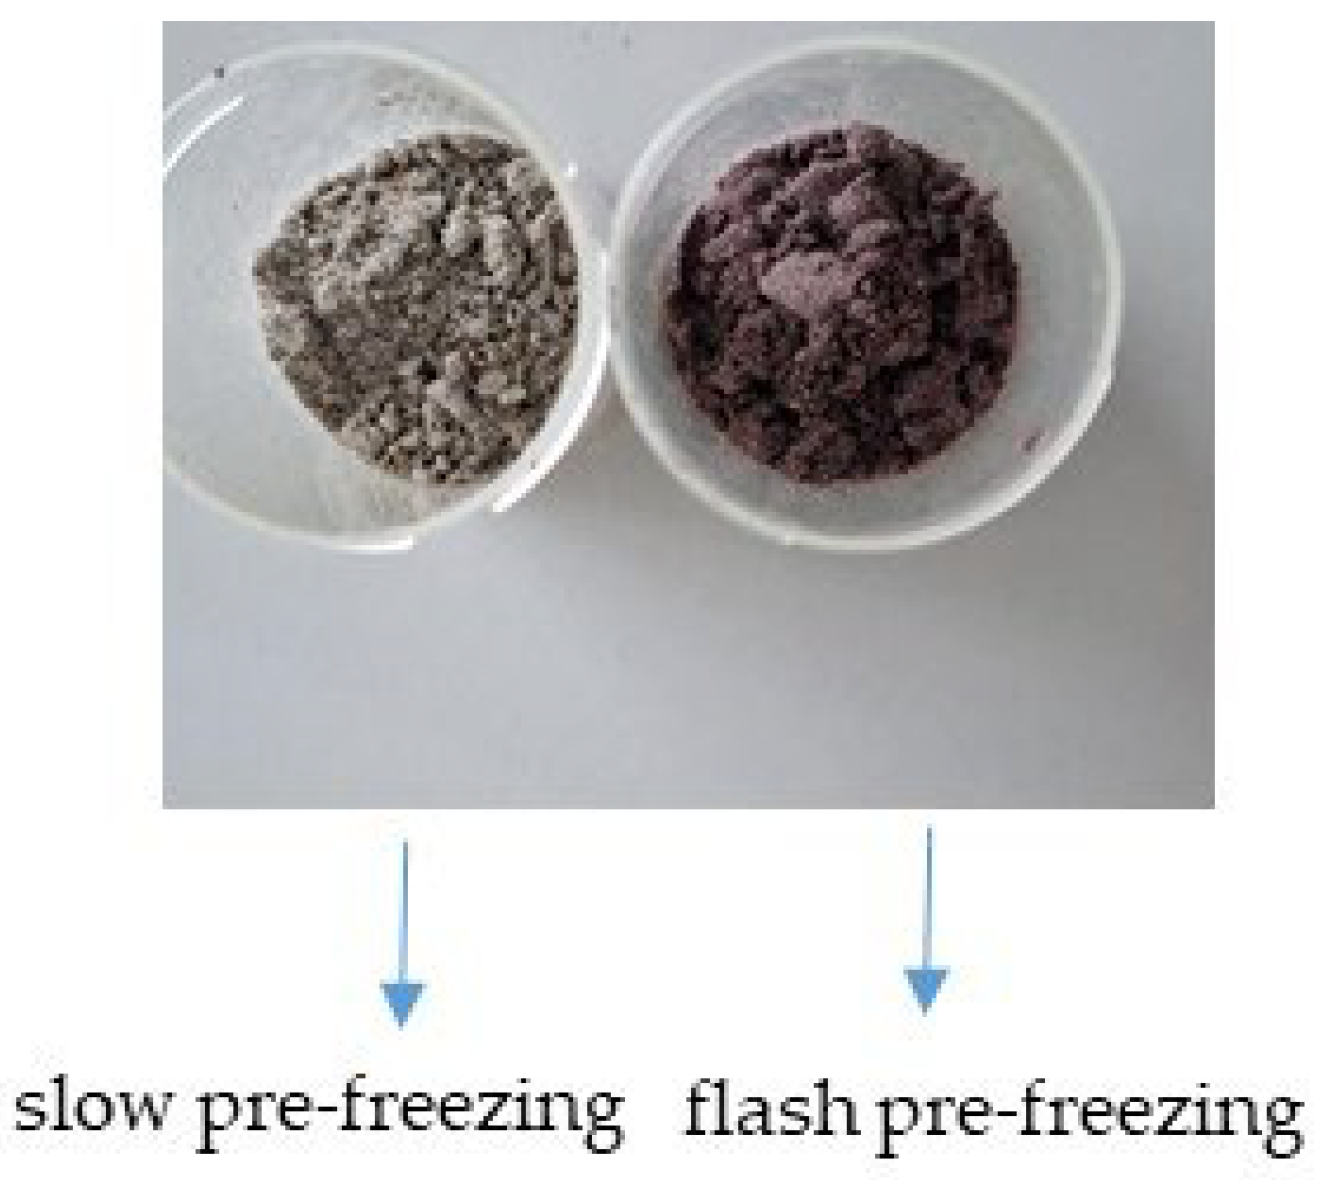
The color parameters of freeze-dried blueberries subjected to slow and flash pre-freezing, and milled with a knife and ball mill, are presented in Table 5. Freeze-dried blueberries with flash pre-freezing (FDFF) exhibited a notably darker color than those with slow pre-freezing (FDSF). Knife milling slightly increased the lightness of the sample, as a decrease in particle size led to a gradual increase in lightness (L*). Akcicek et al. [29] determined the initial color parameters (L*, a*, and b*) for fresh blueberries (L* = 35.31, a* = 11.38, b* = 3.51). As shown in Table 5, freeze drying with flash pre-freezing (FDFF) almost preserved the initial color parameters of blueberries, while freeze drying with slow pre-freezing (FDSF) increased the initial L value of blueberry. Akcicek et al. [29] also found that the L value of freeze-dried blueberries was significantly higher than that of the fresh sample, attributing this to an increased concentration of the white waxy layer on the outer part of the blueberry. The a* value is higher in freeze-dried blueberries with flash pre-freezing (FDFF), with no difference between knife and ball milling, compared to those with slow pre-freezing (FDSF). A low b* value is typical for the natural color of blueberries (characteristic blue-purple color). This color is preserved in freeze-dried blueberries with flash pre-freezing (FDFF), while in those with slow pre-freezing (FDSF), the b* value is significantly higher (Figure 4).
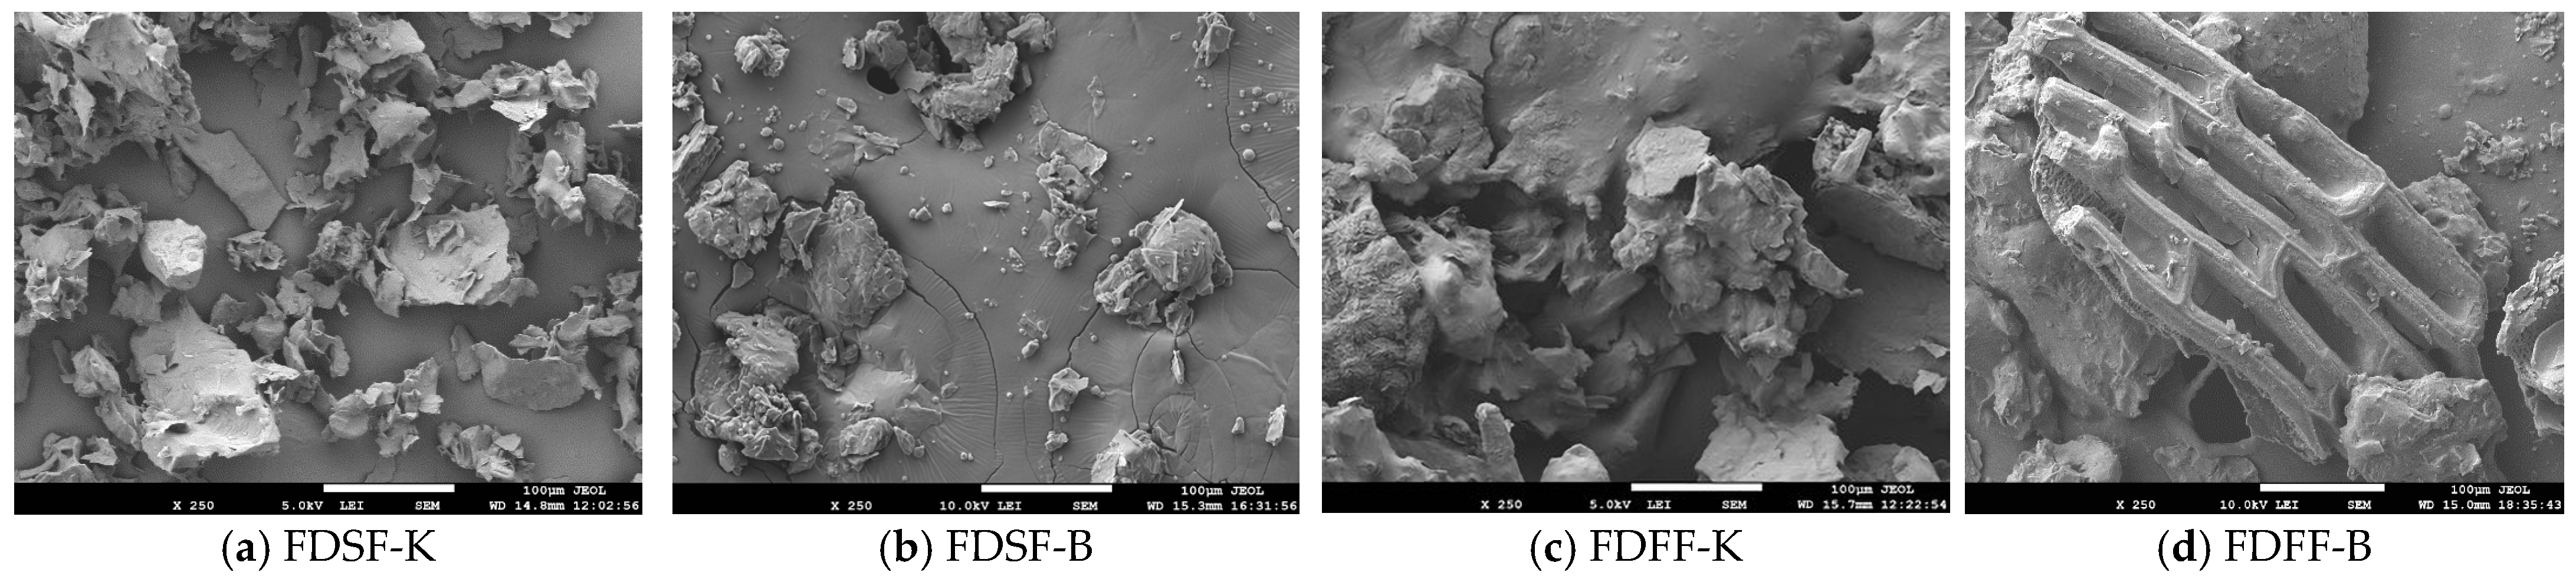
Figure 5 shows how processing methods, including freeze drying with slow or flash pre-freezing of blueberries and subsequent knife or ball milling, affect the surface microstructure of the samples. Morphological differences are noticeable, as expected. The surface microstructure of freeze-dried blueberry powder obtained by slow pre-freezing and subsequent knife milling (FDSF-K) is characterized by rough, sharp, fractured edges and a broad particle size distribution (as shown in Figure 3a). The microstructure of this powder consists of particles with a crumbly texture, meaning the surface area is not homogeneous but composed of particles of varying shapes and sizes (Figure 5a). The particle diameter lies in the interval of (56 ± 7) µm. The surface microstructure of freeze-dried blueberry powder obtained by slow pre-freezing and subsequent ball milling (FDSF-B) exhibits different properties: it does not have sharp edges, and the texture is smooth with visible particle clusters (Figure 5b). Furthermore, the particle diameter is several times smaller, in the range of (14 ± 3) µm. The surface microstructure of blueberry freeze-dried powder obtained by flash pre-freezing (FDFF-K) shows structural differences compared to FDSF-K (Figure 5a,c). The edges are smoother, and the whole surface of the particles is almost pasty, without defined shapes, while the average particle size is larger and less defined, falling within the (94 ± 25) µm range (Figure 5c). These differences could be attributed to the samples’ pre-treatment (slow and flash pre-freezing), which affected the morphological properties of the tested samples. The micrograph of blueberry powder obtained by ball milling of a sample previously pre-treated by flash freezing (FDFF-B) is characterized by a high proportion of coarse particles (Figure 3a), which mainly consist of partially ground blueberry skin (Figure 5d). The displayed section of skin, measuring 450 × 200 µm, has a honeycomb-like structure with rectangular pores. Their area ranges from (4040 ± 600) µm squared, while the dimensions of the pore walls are well-defined at (24 ± 1) µm. This indicates that ball milling under the applied conditions was less efficient in milling plant fibrous tissue, which is better preserved during flash pre-freezing.

4. Conclusions

Blueberries have high economic value due to their nutritional properties. They have a short shelf life, so drying is important for extending their shelf life. This study provides insight into the impact of different drying techniques (convection hot-air drying, vacuum drying and freeze drying with slow and flash pre-freezing) on the preservation of phenolic compounds in cultivated blueberries. Compared to other drying methods, freeze drying with flash pre-freezing caused the least degradation of phenolic compounds, resulting in a 26.78% loss of total phenolic content, a 29.52% loss of total flavonol glycosides, and a 27.71% loss of total anthocyanins compared to fresh fruit. These results are expected, as ice crystals generated by flash freezing cause less damage to fruit quality. Chlorogenic acid is identified as the dominant phenolic acid in blueberries. Due to its unstable structure, its degradation/transformation products increase significantly after drying. Milling freeze-dried blueberries with ball and knife mills produces powders whose extracts retain a high content of total phenolics (1316.83 mg GAE/100 g–1756.12 mg GAE/100 g) and total anthocyanins (376.00 mg/100 g–824.21 mg/100 g), while the content of flavonol glycosides decreases significantly. The concentration of chlorogenic acid degradation/transformation products in the extracts of freeze-dried blueberry powders was very high after both types of milling (77.88 mg/100 g–183.15 mg/100 g). Freeze drying with slow and flash pre-freezing and subsequent milling (knife mill and ball mill) altered the microstructure of blueberry powders and affected the extraction yield and composition of phenolic compounds. Milling flash-freezing pretreated samples produced powders less prone to comminution, resulting in an average particle size nearly three times larger in the ball mill and about 1.5 times larger in the knife mill. Clearly, flash freezing pretreatment led to the formation of small ice crystals within the samples, which helped maintain an intact microstructure of the blueberry fruit while retaining the most important bioactive compounds—anthocyanins.

Author Contributions

Conceptualization, T.B.; methodology, T.B., M.Ć., Z.Z. and I.B.; formal analysis, T.B., M.H., K.Č., Z.Z., Z.P., I.B., Z.M., D.S. and I.B.; investigation, T.B., M.Ć., I.B., I.Š., Z.P., Z.Z. and I.B.; resources, T.B., Z.Z.; data curation, M.Ć., T.B. and I.Š.; writing—review and editing, T.B., M.Ć. and Z.Z.; supervision, T.B. All authors have read and agreed to the published version of the manuscript.

Funding

This research received no external funding.

Institutional Review Board Statement

Not applicable.

Informed Consent Statement

Not applicable.

Data Availability Statement

The data presented in this study are available on request from the corresponding author.

Acknowledgments

This research was partially supported under the project “Functional integration of the University of Split, Faculty of Science/Faculty of Chemistry and Technology/Faculty of Maritime Studies, through the development of scientific research infrastructure in the building of the three faculties” (KK. 01.1.1.02.0018). The authors would like to thank Ante Bilušić from the Faculty of Science, University of Split for scanning of the surface microstructure of blueberry powders by scanning electron microscopy.

Conflicts of Interest

The authors declare no conflicts of interest.

References

  1. Pérez-Jiménez, J.; Neveu, V.; Vos, F.; Scalbert, A. A Systematic Analysis of the Content of 502 Polyhenols in 452 Foods and Beverages—An Application of the Phenol-Explorer Database. J. Agric. Food Chem. 2010, 58, 4959–4969. [Google Scholar] [CrossRef]
  2. Bell, D.J.; Rowland, L.J.; Smagula, J.M.; Drummond, F. Recent Advances in the Biology and Genetics of Lowbush Blueberry. In Maine Agricultural and Forest Experiment Station Technical Bulletin 203; The University of Maine: Orono, ME, USA, 2009; Available online: https://digitalcommons.library.umaine.edu/cgi/viewcontent.cgi?article=1008&context=aes_techbulletin (accessed on 15 September 2025).
  3. The Global Blueberry Market Is Going Through a Phase of Dynamic Growth, Although with Episodes of Adjustment. Tridge. 2025. Available online: https://www.tridge.com/news/the-global-blueberry-market-is-going-through-tdyopb (accessed on 15 September 2025).
  4. Araniti, F.; Baron, G.; Ferrario, G.; Pesenti, M.; Della Vedova, L.; Prinsi, B.; Sacchi, G.A.; Aldini, G.; Espen, L. Chemical Profiling and Antioxidant Potential of Berries from Six Blueberry Genotypes Harvested in the Italian Alps in 2020: A Comparative Biochemical Pilot Study. Agronomy 2025, 15, 262. [Google Scholar] [CrossRef]
  5. Li, R.; Gu, L. Review: Value-Added Products for Fresh Highbush Blueberries. UF IFAS Extension, FSHN 1505, 2015. Available online: https://www.researchgate.net/publication/282349356_Review_Value-Added_Products_for_Fresh_Highbush_Blueberries (accessed on 20 September 2025).
  6. Kalt, W.; Cassidy, A.; Howard, L.R.; Krikorian, R.; Stull, A.J.; Tremblay, F.; Zamora-Ros, R. Recent Research on the Health Benefits of Blueberries and Their Anthocyanins. Adv. Nutr. 2019, 11, 224–236. [Google Scholar] [CrossRef]
  7. Kader, F.; Rovel, B.; Girardin, M.; Metche, M. Fractionation and Identification of the Phenolic Compounds of Highbush Blueberries (Vaccinium corymbosum, L.). Food Chem. 1996, 55, 35–40. [Google Scholar] [CrossRef]
  8. Nicoletti, M.A.; Gularte, A.M.; Cardoso Elias, M.; Santos dos Santos, M.; Āvila, B.P.; Monks, J.L.F.; Peres, W. Blueberry Bioactive Properties and Their Benefits for Health: A Review. Int. J. New Technol. Res. 2015, 7, 51–57. Available online: https://www.ijntr.org/download_data/IJNTR01070027.pdf (accessed on 15 September 2025).
  9. Gibson, L.; Rupasinghe, H.P.V.; Forney, C.F.; Eaton, L. Characterization of Changes in Polyphenols, Antioxidant Capacity and Physico-Chemical Parameters during Lowbush Blueberry Fruit Ripening. Antioxidants 2013, 15, 216–229. [Google Scholar] [CrossRef] [PubMed]
  10. Ashique, S.; Mukherjee, T.; Mohanty, S.; Garg, A.; Mishra, N.; Kaushik, M.; Bhowmick, M.; Chattaraj, B.; Mohanto, S.; Srivastava, S.; et al. Blueberries in Focus: Exploring the Phytochemical Potential and Therapeutic Applications. J. Agric. Food Res. 2024, 18, 101300. [Google Scholar] [CrossRef]
  11. Stull, A.J.; Cassidy, A.; Djousse, L.; Johnson, S.A.; Krikorian, R.; Lampe, J.W.; Mukamal, K.J.; Nieman, D.C.; Porter Starr, K.N.; Rasmussen, H.; et al. The state of the science on the Health Benefits of Blueberries: A Perspective. Front. Nutr. 2024, 11, 1415737. [Google Scholar] [CrossRef] [PubMed]
  12. Uribe, E.; Vega-Galvez, A.; Pasten, A.; Ah-Hen, K.S.; Mejias, N.; Sepúlveda, L.; Poblete, J.; Gomez-Perez, L.S. Drying: A Practical Technology for Blueberries (Vaccinium corymbosum L.)—Processes and their Effects on Selected Health-Promoting Properties. Antioxidants 2024, 13, 1554. [Google Scholar] [CrossRef]
  13. Global Dried Blueberries Market Size, Share, and Trends Analysis Report—Industry Overview and Forecast to 2032. Data Bridge. 2025. Available online: https://www.databridgemarketresearch.com/reports/global-dried-blueberries-market (accessed on 15 September 2025).
  14. Muñoz-Fariña, O.; López-Casanova, V.; Garcia-Figueroa, O.; Roman-Benn, A.; Ah-Hen, K.; Bastias-Montes, J.M.; Quevedo-León, R.; Ravanal-Espinosa, M.C. Bioaccessibility of Phenolic Compounds in Fresh and Dehydrated Blueberries (Vaccinium corymbosum L.). Food Chem. Adv. 2023, 2, 100171. [Google Scholar] [CrossRef]
  15. Ngo, H.T.; Nakamizo, M.; Tojo, S.; Ban, T.; Chosa, T. Effect of Drying Methods on Some Main Nutrient of Blueberry. In Proceedings of the CIGR-AgEng Conference, Aarhus, Denmark, 26–29 June 2016; Available online: https://conferences.au.dk/uploads/tx_powermail/full_paper_cigr2016_tojo_hien_01.pdf (accessed on 11 September 2025).
  16. Zhang, L.; Zhang, C.; Wei, Z.; Huang, W.; Yan, Z.; Luo, Z.; Beta, T.; Xu, X. Effects of Four Drying Methods on the Quality, Antioxidant Activity and Anthocyanin Components of Blueberry Pomace. Food Prod. Process. Nutr. 2023, 5, 35. [Google Scholar] [CrossRef]
  17. Petrova, Z.; Slobodianiuk, K.; Grakov, O. Determining the Influence of Preparation of Blueberries (Vaccinium corymbosum L.) on the Total Duration of Drying. Technol. Equip. Food Prod. 2023, 11, 83–90. [Google Scholar] [CrossRef]
  18. Acosta-Piantini, E.; Villarán, M.C.; Martinez, A.; Lombraña, J.I. Examining the Effect of Freezing Temperatures on the Survival Rate of Micro-Encapsulated Probiotic Lactobacillus acidophilus LA5 Using the Flash Freeze-Drying (FFD) Strategy. Microorganisms 2024, 12, 506. [Google Scholar] [CrossRef]
  19. Grover, Y.; Negi, P.S. Recent Developments in Freezing of Fruits and Vegetables: Striving for Controlled Ice Nucleation and Crystalization with Enhanced Freezing Rates. J. Food Sci. 2023, 88, 4799–4826. [Google Scholar] [CrossRef]
  20. Ebrahimi, P.; Mihaylova, D.; Marangon, C.M.; Grigoletto, L.; Lante, A. Imapct of Sample Pretretament and Extraction Methods on the Bioactive Compounds of Sugar Beet (Beta vulgaris L.) Leaves. Molecules 2022, 28, 8110. [Google Scholar] [CrossRef]
  21. Umaña, M.; Calahorro, M.; Eim, V.; Rosselló, C.; Simal, S. Measurement of Microstructural Changes Promoted by Ultrasound Application on Plant Materials with Different Porosity. Ultrason. Sonochem. 2022, 88, 106087. [Google Scholar] [CrossRef]
  22. Bilušić, T.; Runtić, D.; Šola, I.; Benković, M.; Bilušić, A.; Ćosić, M.; Đorđević, D. The Effect of Grinding Techniques on the Microstructural Properties of Purslane (Portulaca oleracea L.) Powder, Its Total Phenolics Before and After In Vitro Simulated Gastrointestinal Digestion, and Its Antioxidant Capacity. Appl. Sci. 2025, 15, 7448. [Google Scholar] [CrossRef]
  23. Ćosić, M.; Čelan, A.; Pehnes, I.; Kuzmanić, N. Investigation of Crystal Growth of Borax in 648 Single and Dual Impeller Batch Cooling Crystallizer. Chem. Eng. Commun. 2019, 207, 847–860. [Google Scholar] [CrossRef]
  24. Elez Garofulić, I.; Dragović Uzelac, V.; Režek Jambrak, A.; Jukić, M. The Effect of Microwave Assisted Extraction on the Isolation of Anthocyanins and Phenolic Acids from Sour Cherry Marasca (Prunus cerasus var. Marasca). J. Food Eng. 2013, 117, 422–437. [Google Scholar] [CrossRef]
  25. Singleton, V.L.; Rossi, J.A. Colorimetry of Total Phenolics with Phosphomolybdic-Phospho629 tungstic Acid Reagents. Am. J. Enol. Vitic. 1965, 16, 144–158. [Google Scholar] [CrossRef]
  26. Zorić, Z.; Dragović-Uzelac, V.; Pedisić, S.; Kurtanjek, Ž.; Elez Garofulić, I. Kinetics of Anthocyanins, Phenolic Acids and Flavonoids Degradation During Heat Treatments of Freeze-Dried Sour Cherry Marasca Paste. Food Technol. Biotechnol. 2014, 45, 101–108. [Google Scholar]
  27. Seke, F.; Manhivi, V.E.; Shoko, T.; Slabbert, R.M.; Sultanbawa, Y.; Sivakumar, D. Effect of Freeze Drying and Simulated Gastrointestinal Digestion on Phenolic Metabolites and Antioxidant Property of the Natal Plum (Carissa macrocarpa). Foods 2021, 10, 1420. [Google Scholar] [CrossRef]
  28. Häkkinen, S.H.; Kärenlampi, S.O.; Mykkänen, H.M.; Törrönen, R.A. Influence of Domestic Processing and Storage on Flavonol Contents in Berries. J. Agric. Food Chem. 2000, 48, 2960–2965. [Google Scholar] [CrossRef]
  29. Akcicek, A.; Avci, E.; Tekin-Cakmak, Z.H.; Kasapoglu, M.Z.; Sagdic, O.; Karasu, S. Influence of Different Drying Techniques on the Draying Kinetics, Total Bioactive Compounds, Anthocyanin Profile, Color, and Microstructural Properties of Blueberry Fruit. ACS Omega 2023, 8, 41603–41611. [Google Scholar] [CrossRef]
  30. Shivembe, A.; Ojinnaka, D. Determination of Vitamin C and Total Phenolic of Fresh and Freeze Dried Blueberries and the Antioxidant Capacity of Their Extracts. Int. Food Nutr. Metab. 2017, 4, 1–5. [Google Scholar] [CrossRef]
  31. Narváez, S.C.; Hernández Carrión, M. Evaluation of Antioxidant Activity, Phenolic Content, Anthocyanins, and Flavonoids of Fresh and Dried “Biloxi” Blueberries. Vitae 2022, 29, 348980. [Google Scholar] [CrossRef]
  32. Lutz, M.; Hernández, H.; Henríquez, C. Phenolic Content and Antioxidant Capacity in Fresh and Dry Fruits and Vegetables Grown in Chile. CyTA-J. Food 2015, 13, 541–547. [Google Scholar] [CrossRef]
  33. Liu, Z.L.; Xie, L.; Zielinska, M.; Pan, Z.; Deng, L.Z.; Zhang, J.S.; Gao, L.; Wang, S.Y.; Zheng, Z.A.; Xiao, H.W. Improvement of Drying Efficiency and Quality Attributes of Blueberries using Innovative Far-Infrared Radiation Heating Assisted Pulsed Vacuum Drying (FIR-PVD). Innov. Food Sci. Emerg. Technol. 2022, 77, 102948. [Google Scholar] [CrossRef]
  34. Kang, J.; Jensen, G.S.; Thakali, K.M.; Wu, X. Phenolic Acids of the Two Major Blueberry Species in the US Market and Their Antioxidant and Anti-inflammatory Activities. Plant Foods Hum. Nutr. 2015, 70, 56–62. [Google Scholar] [CrossRef]
  35. Bayram, H.M.; Ozkan, K.; Ozturkcan, A.; Sagdic, O.; Gunes, E.; Karadag, A. Effect of Drying Methods on Free and Bound Phenolic Compounds, Antoxidant Capacities, and Bioaccessibility of Cornelian Cherry. Eur. Food Res. Technol. 2024, 250, 2461–2478. [Google Scholar] [CrossRef]
  36. Managa, M.G.; Sultanbawa, Y.; Sivakumar, D. Effects of Different Drying Methods on Untargeted Phenolic Metabolites, and Antioxidant Activity in Chinese Cabbage (Brassica rapa L. subsp. chinensis) and Nightshade (Solanum retroflexum Dun.). Molecules 2020, 25, 1326. [Google Scholar] [CrossRef]
  37. Hasegawa, S.; Johnson, R.M.; Gould, W.A. Effect of Cold Storage on Chlorogenic Acid Conten of Potatoes. J. Agric. Food Chem. 1966, 14, 165–169. [Google Scholar] [CrossRef]
  38. Mohapatra, P.; Ray, A.; Jena, S.; Nayak, S.; Mohanty, S. Influence of Various Drying Methods on Physicochemical Characteristics, Antioxidant Activity, and Bioactive Compounds in Centella asiatica L. Leaves: A Comparative Study. BioTechnologia 2022, 103, 235–247. [Google Scholar] [CrossRef]
  39. Liu, Y.; Hefni, M.E.; Witthöft, C.M. Characterization of Flavonoid Compounds in Common Swedish Berry Species. Foods 2020, 9, 358. [Google Scholar] [CrossRef]
  40. Lohachoompol, V.; Srzednicki, G.; Craske, J. The Change of Total Anthocyanins in Blueberries and Their Antioxidant Effect After Drying and Freezing. J. Biomed. Biotechnol. 2004, 2004, 248–252. [Google Scholar] [CrossRef]
  41. Nemzer, B.; Vargas, L.; Xia, X.; Sintara, M.; Feng, H. Phytochemical and Physical Properties of Blueberries, Tart Cherries, Strawberries, and Cranberries as Affected by Different Drying Methods. Food Chem. 2018, 262, 242–250. [Google Scholar] [CrossRef]
  42. Ochmian, I.; Figiel-Kroczyńska, M.; Lachowicz, S. The Quality of Freeze-dried and Rehydrated Blueberries Depending on Their Size and Preparation for Freeze-drying. Acta Univ. Cibiniensis Ser. E Food Technol. 2020, 24, 61–78. [Google Scholar] [CrossRef]
  43. Zhou, B.; Jin, Z.; Schwarz, P.B.; Li, Y. Effect of Grinding and Extraction Conditions on the Determination of Antioxidant Activity and Phenolic Acids in Barley. J. Food Meas. Charact. 2021, 15, 3823–3836. [Google Scholar] [CrossRef]
  44. Asmara, A.P.; Hernawan, H.; Nurhayati, N.; Sugara, T.H. Effect of High Energy Ball Milling on the Phenolic Extractability and Antioxidant Activity of Sargassum polycystum C.A. Agrdh. AIP Conf. Proc. 2024, 2957, 060038. [Google Scholar] [CrossRef]
  45. Levin, P.; Meunier, V.; Kessler, U.; Heinrich, S. Influence of Freezing Parameters on the Formation of Internal Porous Structure and Its Impact on Freeze-Drying Kinetics. Processes 2021, 9, 1273. [Google Scholar] [CrossRef]
  46. Cheng, L.; Wu, W.; An, K.; Xu, Y.; Yu, Y.; Wen, J.; Wu, J.; Zou, Y.; Liu, H.; Zhu, J.; et al. Advantages of Liquid Nitrogen Quick Freezing Combine Gradient Slow Thawing for Quality Preserving of Blueberry. Crystals 2020, 10, 368. [Google Scholar] [CrossRef]
  47. Ren, X.; Tang, T.; Xie, X.; Wang, W.; Tang, X.; Brennan, C.S.; Zhang, J.; Wang, Z. The Effects of Preparation and Cooking Processes on Vitamins and Antioxidant Capacity of Sour and Spicy Potato Silk. Int. J. Food Sci. Technol. 2020, 55, 3475–3483. [Google Scholar] [CrossRef]
  48. Samanta, A.; Das, G.; Das, S.K. Role of Flavonoids in Plants. Int. J. Pharm. Sci. Tech. 2011, 6, 12–35. [Google Scholar]
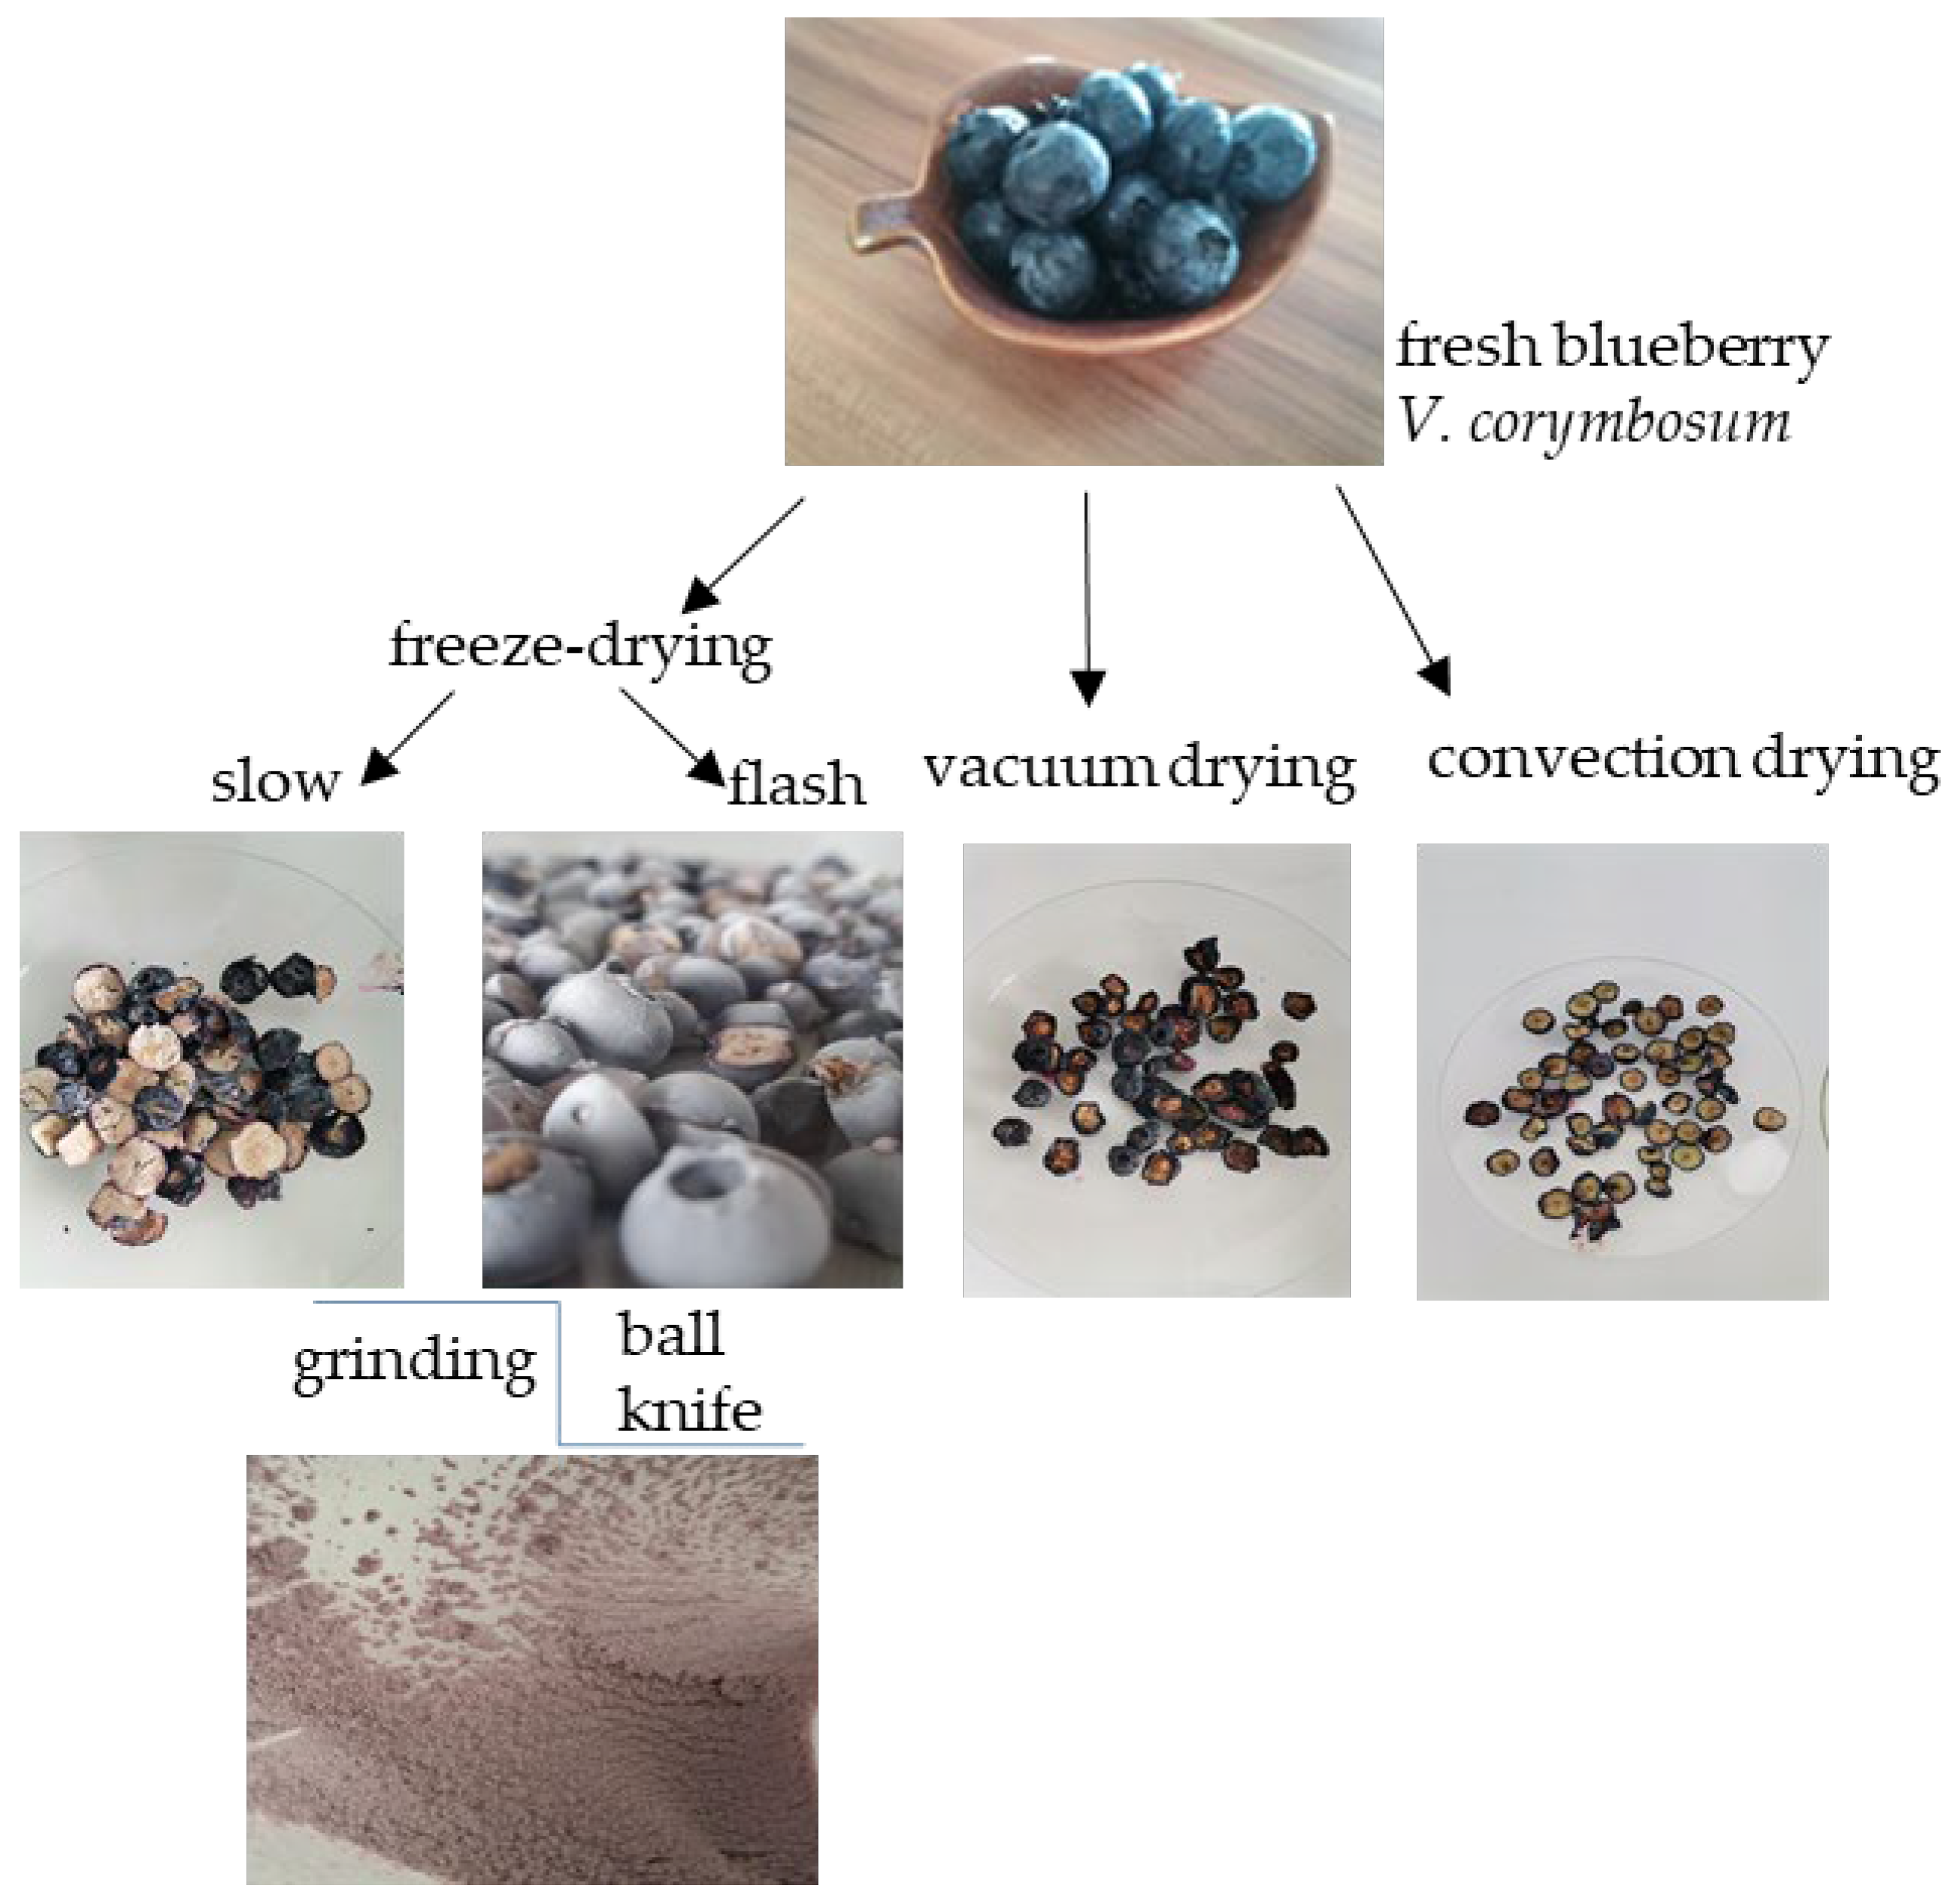
Figure 1. Scheme of dried blueberry preparation.
Appliedchem 06 00010 g001
Figure 2. (ad) The structure of the cell membrane of fresh and dried blueberries scanned by light microscopy. (a) Fresh blueberry, (b) convection hot-air drying, (c) vacuum drying, (d) freeze drying.
Appliedchem 06 00010 g002
Figure 3. Particle size distributions (a) and average particle sizes with standard deviations (b) of freeze-dried blueberry powders obtained after knife or ball milling. FDSF = freeze drying with slow pre-freezing; FDFF = freeze drying with flash pre-freezing; FDSF-K = FDSF + knife milling; FDSF-B = FDSF + ball milling; FDFF-K = FDFF + knife milling; FDFF-B = FDFF+ ball milling.
Appliedchem 06 00010 g003
Figure 4. The color of freeze-dried blueberry powder after slow and flash pre-freezing.
Appliedchem 06 00010 g004
Figure 5. (ad) The surface microstructure of freeze-dried (slow and flash pre-treatment) blueberry powders obtained by milling with knife and ball. FDSF = freeze drying with slow pre-freezing; FDFF = freeze drying with flash pre-freezing; FDSF-K = FDSF+ knife milling; FDSF-B = FDSF + ball milling; FDFF-K = FDFF + knife milling; FDFF-B = FDFF + ball milling; Scale bar represents 100 µm.
Appliedchem 06 00010 g005
Table 1. Total phenolic content of fresh and dried blueberries. Values are presented as average ± standard deviation of three technical replicates. Different letters indicate significant differences among the values (one-way ANOVA, Duncan’s test, p ≤ 0.05).
SamplesTotal Phenolic Content
(mg GAE/100 g)
FB1350.85 ± 8.44 a
FDSF725.23 ± 10.22 c
FDFF989.12 ± 10.22 b
VD621.45 ± 7.89 d
CD453.11 ± 9.22 e
FB = fresh blueberries, FDSF = freeze drying with slow pre-freezing (−80 °C), FDFF = freeze drying with flash pre-freezing (−196 °C), VD = vacuum drying, CD = convection drying.
Table 2. The composition of phenolic compounds in fresh and dried blueberries identified by the HPLC-DAD technique. Values are presented as average ± standard deviation of three technical replicates. Different letters indicate significant differences among the values (one-way ANOVA, Duncan’s test, p ≤ 0.05).
CompoundFBFDSFFDFFVDCD
(mg/100 g)
Chlorogenic acid and its transformation/degradation products0.81 ± 0.0451.75 ± 4.77 a56.97 ± 0.96 a21.84 ± 1.71 b7.93 ± 0.57 c
Flavonol-glycosides
Quercetin-glucoside45.57 ± 1.7830.51 ± 3.01 c35.00 ± 2.62 b13.08 ± 0.62 dn.d.
Quercetin-rutinoside6.05 ± 0.39n.dn.d.n.d.n.d.
Quercetin-arabinoside7.83 ± 0.636.29 ± 0.44 b6.86 ± 0.60 a2.74 ± 0.26 c0.88 ± 0.08 d
Kaempferol-glucoside3.83 ± 0.102.68 ± 0.33 d3.12 ± 0.33 b1.31 ± 0.15 e3.10 ± 0.25 c
Kaempferol-rutinoside2.91 ± 0.471.80 ± 0.24 b1.68 ± 0.23 c1.05 ± 0.08 e1.59 ± 0.15 d
Total flavonol glycosides66.20 ± 3.3641.28 ± 4.02 c46.66 ± 3.77 b18.16 ± 1.11 d5.57 ± 0.49 e
Delphinidin-3-galactoside40.54 ± 2.2122.85 ± 1.86 c29.30 ± 0.99 b15.94 ± 1.30 d7.72 ± 0.63 e
Delphinidin-3-glucoside12.08 ± 1.128.68 ± 1.15 b10.13 ± 1.18 a5.41 ± 0.61 c0.25 ± 0.07 d
Cyanidine-3-galactoside3.71 ± 0.282.19 ± 0.27 c2.85 ± 0.31 bn.d.1.31 ± 0.20 d
Delphinidin-3-arabinoside23.62 ± 1.9015.71 ± 1.75 c18.08 ± 0.96 b9.07 ± 1.31 d5.29 ± 0.60 e
Petunidin-3-galactoside19.68 ± 1.7110.08 ± 1.20 c13.47 ± 1.40 b6.83 ± 0.51 d4.42 ± 0.36 e
Petunidin-3-glucoside10.25 ± 0.816.52 ± 0,56 c7.23 ± 0.784.12 ± 0.23 d0.89 ± 0.12 e
Cyanidine-3-glucoside2.22 ± 0.27n.d.n.dn.d.n.d.
Peonidin-3-glucoside10.71 ± 1.244.28 ± 0.38 c8.10 ± 0.71 b2.34 ± 0.35 d1.30 ± 0.26 e
Malvidin-3-galactoside45.83 ± 2.9723.71 ± 1.88 c31.18 ± 1.06 b15.37 ± 1.42 d11.95 ± 1.15 e
Maldvidin-3-glucoside20.87 ± 1.8011.00 ± 0.81 c15.16 ± 1.66 b6.78 ± 0.59 d0.73 ± 0.10 e
Maldvidin-3-arabinoside28.72 ± 0.8417.03 ± 1.06 c22.27 ± 1.43 b10.37 ± 1.11 d7.36 ± 0.58 e
Total anthocyanins218.23 ±15.1122.04 ± 10.91 c157.77 ± 10.47 b76.22 ± 7.44 d41.20 ± 4.08 e
Results are expressed as mean value ± st.dev; n.d.—not detected. FB = fresh blueberries, FDSF = freeze drying with slow freezing (−80 °C), FDFF = freeze drying with flash freezing (−196 °C), VD = vacuum drying, CD = convection drying.
Table 3. Content of total phenolic in extracts of freeze-dried blueberry powders obtained after knife and ball milling. Values represent average ± standard deviation of three technical replicates. Different letters indicate a significant difference among the values (one-way ANOVA, Duncan’s test, p ≤ 0.05).
SamplesTotal Phenolic Content (mg GAE/100 g)
Unground FDSF725.23 ± 10.22 f
Unground FDFF989.12 ± 12.00 e
FDSF-K1316.83 ± 11.70 d
FDSF-B1484.83 ± 9.56 c
FDFF-K1623.07 ± 13.25 b
FDFF-B1756.12 ± 15.07 a
FDSF = freeze drying with slow pre-freezing; FDFF = freeze drying with flash pre-freezing; FDSF-K = FDSF + knife milling; FDSF-B = FDSF + ball milling; FDFF-K = FDFF + knife milling; FDFF-B = FDFF + ball milling.
Table 4. The composition of phenolic compounds in the extract from freeze-dried blueberry powder after knife and ball milling identified using the HPLC-DAD technique. Values represent average ± standard deviation of three technical replicates. Different letters indicate a significant difference among the values (one-way ANOVA, Duncan’s test, p ≤ 0.05).
CompoundFDSF-KFDSF-BFDFF-KFDFF-B
(mg/100 g)
Chlorogenic acid transformation/degradation products183.15 ± 4.40 a111.11 ± 4.04 b97.20 ± 3.01 c77.88 ± 2.27 d
Flavonol-glycosides
Quercetin-glucoside38.76 ± 2.67 a26.22 ± 2.11 c29.65 ± 2.03 b18.95 ± 1.95 d
Quercetin-rutinosiden.d.n.d.n.d.n.d.
Quercetin-arabinosiden.d.n.d.n.d.n.d.
Kaempferol-glucosiden.d.n.d.n.d.n.d.
Kaempferol-rutinoside10.80 ± 1.12 b16.82 ± 2.17 a16.81 ± 2.18 a13.85 ± 1.38 a
Total flavonol glycosides49.55 ± 3.79 a43.04 ± 4.28 c46.45 ± 4.21 b32.80 ± 3.33 d
Delphinidin-3-galactoside65.65 ± 2.55 c43.06 ± 2.07 d163.07 ± 4.74 a138.11 ± 1.72 b
Delphinidin-3-glucoside32.26 ± 1.15 a20.11 ± 0.74 bn.d.n.d.
Cyanidine-3-galactoside42.63 ± 2.02 c32.15 ± 3.00 d76.49 ± 4.01 a67.35 ± 3.21 b
Delphinidin-3-arabinoside23.19 ± 1.39 c13.89 ± 1.65 d95.85 ± 4.06 a86.21 ± 3.08 b
Petunidin-3-galactoside11.77 ± 1.26 a9.66 ± 1.20 b2.33 ± 0.33 c1.57 ± 0.21 d
Petunidin-3-glucoside13.12 ± 0.78 c10.45 ± 1.36 d31.06 ± 2.28 a25.99 ± 1.74 b
Cyanidine-3-glucoside65.41 ± 2.33 c44.68 ± 2.83 d193.21 ± 6.31 a169.40 ± 4.03 b
Peonidin-3-glucoside86.06 ± 3.55 a66.60 ± 3.79 b12.81 ± 1.24 cn.d.
Malvidin-3-galactoside149.52 ± 4.11 c103.91 ± 3.38 d249.39 ± 8.25 a212.60 ± 5.39 b
Maldvidin-3-glucoside39.33 ± 1.84 a3.76 ± 0.30 bn.d.n.d.
Maldvidin-3-arabinoside34.34 ± 1.67 a27.71 ± 2.79 bn.d.n.d.
Total anthocyanins563.29 ± 22.67 c376.0 ± 23.12 d824.21 ± 31.22 a701.2 ± 19.37 b
Results are expressed as mean value ± st.dev; n.d.—not detected. FDSF = freeze drying with slow pre-freezing; FDFF = freeze drying with flash pre-freezing; FDSF-K = FDSF + knife milling; FDSF-B = FDSF + ball milling; FDFF-K = FDFF + knife milling; FDFF-B = FDFF + ball milling.
Table 5. Color parameters of blueberry powders. Values represent average ± standard deviation of three technical replicates. Different letters indicate a significant difference among the values (one-way ANOVA, Duncan’s test, p ≤ 0.05).
Color Parameters
SamplesL*a*b*
FDSF-K55.28 ± 0.37 a2.63 ± 0.04 c9.52 ± 0.06 a
FDSF-B46.15 ± 0.72 b4.46 ± 0.11 b8.24 ± 0.11 b
FDFF-K28.67 ± 0.22 c6.76 ± 0.04 a1.83 ± 0.04 d
FDFF-B24.52 ± 0.13 d6.74 ± 0.04 a2.47 ± 0.06 c
FDSF = freeze drying with slow pre-freezing; FDFF = freeze drying with flash pre-freezing; FDSF-K = FDSF + knife milling; FDSF-B = FDSF + ball milling; FDFF-K = FDFF + knife milling; FDFF-B = FDFF + ball milling.
Disclaimer/Publisher’s Note: The statements, opinions and data contained in all publications are solely those of the individual author(s) and contributor(s) and not of MDPI and/or the editor(s). MDPI and/or the editor(s) disclaim responsibility for any injury to people or property resulting from any ideas, methods, instructions or products referred to in the content.