Article

Chemometric Analysis of ATR-FTIR Spectra for Extract Screening in Caulerpa spp.

by
Priscila Vázquez-García
1,
Héctor Arturo Peniche Pavía
1,*,
Julio Enrique Oney-Montalvo
2,
Rosa Yazmin Us-Camas
2,
William Santiago González-Gómez
3,
Luis Alberto Rosado-Espinosa
4 and
Emanuel Hernández-Núñez
2,*
1
Departamento de Recursos del Mar, Centro de Investigación y Estudios Avanzados del Instituto Politécnico Nacional, Unidad Mérida, Km 6 Carretera Antigua a Progreso, Cordemex, Mérida 97310, Yucatán, Mexico
2
Departamento de Posgrado e Investigación, Instituto Tecnológico Superior de Calkiní, Tecnológico Nacional de México, Av. Ah Canul S/N por Carretera Federal, Calkiní 24900, Campeche, Mexico
3
Departamento de Física Aplicada, Centro de Investigación y Estudios Avanzados del Instituto Politécnico Nacional, Unidad Mérida, Km 6 Carretera Antigua a Progreso, Cordemex, Mérida 97310, Yucatán, Mexico
4
Campus de Ciencias Biológicas Agropecuarias, Universidad Autónoma de Yucatán, Carretera Mérida-Xmatkuil Km. 15.5 Apdo., Plan de Ayala III, Itzimná, Mérida 97100, Yucatán, Mexico
*
Authors to whom correspondence should be addressed.
Phycology 2026, 6(2), 61; https://doi.org/10.3390/phycology6020061

Submission received: 7 May 2026 / Revised: 27 May 2026 / Accepted: 30 May 2026 / Published: 1 June 2026
(This article belongs to the Special Issue Development of Algal Biotechnology, Second Edition)

Abstract

This study investigated the use of Attenuated Total Reflectance Fourier Transform Infrared Spectroscopy (ATR-FTIR) as a cost-effective analytical approach for screening the bioactivity of green algal extracts. Samples of five Caulerpa species—C. ashmeadii, C. paspaloides, C. cupressoides, C. verticillata, and C. prolifera—were collected from Dzilam, Yucatán, Mexico, across seven seasonal campaigns. Sequential extraction was performed using solvents of increasing polarity: hexane, dichloromethane, acetone, and methanol. After solvent evaporation, extracts were analyzed via ATR-FTIR, and Total Phenolic Content (TPC) and Trolox Equivalent Antioxidant Capacity (TEAC) were quantified. Statistical analysis (PERMANOVA) revealed that the type of solvent accounted for most of the variance (61.6%), while species and collection date contributed minimally. Infrared (IR) band assignments highlighted functional groups associated with lipids, such as terpenes, and carbohydrates. K-means clustering enabled the subdivision of less polar extracts, notably grouping numerous samples from C. verticillata. Classification models comparing full-spectrum and IR band datasets showed that Partial Least Squares Discriminant Analysis (PLS-DA) with full-spectrum data achieved the best performance. TPC showed a positive correlation with absorption at 1730.8 cm−1, which is associated with ester-containing metabolites. Although ATR-FTIR effectively distinguished extraction solvents, it was less sensitive to subtle biological variation among Caulerpa. However, the method remains a practical tool for rapid screening, with spectral data supporting solvent-based classification. Reduction of salt content prior to extraction may minimize interference in both FTIR measurements and biological assays.

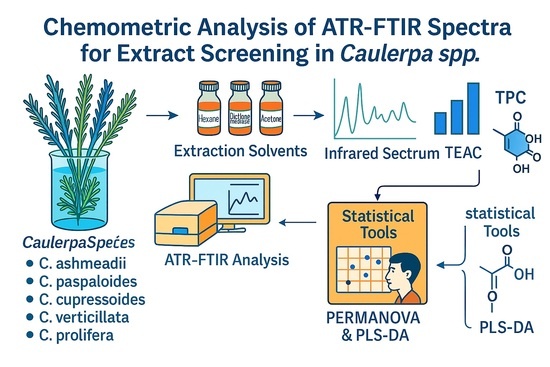
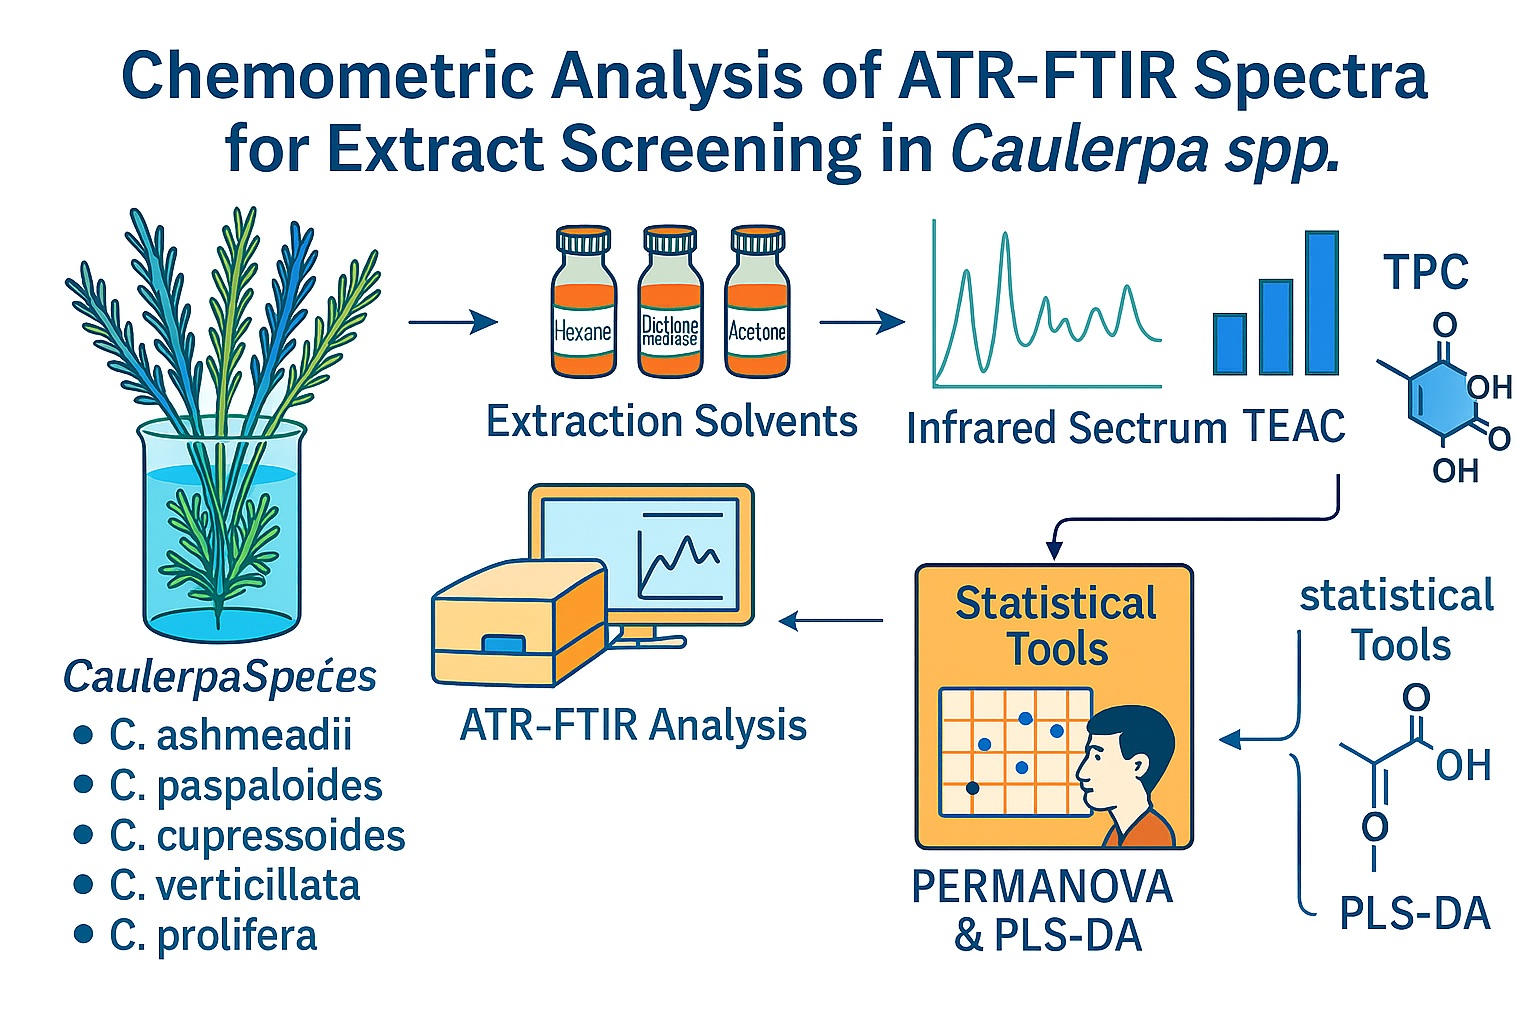
Graphical Abstract

1. Introduction

The search for bioactive compounds requires processing numerous extracts through biological assays and advanced instrumental chemical characterization. Instrumental techniques are essential to elucidate the chemical composition of extracts, enabling the identification of known compounds using spectroscopic data and structural characterization of novel metabolites; however, commonly used techniques such as nuclear magnetic resonance (NMR) and liquid chromatography–mass spectrometry (LC-MS) require expensive instrumentation and specialized consumables, including Ultra Performance Liquid Chromatography (UPLC)-grade solvents, deuterated solvents, and inert gases such as nitrogen and helium [1,2,3]. To evaluate the efficiency of ATR-FTIR as a screening tool for organic extracts, datasets derived from studies on algae of the genus Caulerpa were used. Five species were considered to assess genotype-related variation and to determine possible seasonal differences. Four extracts per sample were prepared via maceration using solvents of increasing polarity (hexane, dichloromethane, acetone, and methanol). Solvent polarity is a key factor determining the classes of extracted metabolites, with non-polar solvents favoring lipid recovery and polar solvents yielding carbohydrates, glycosides, and other polar compounds [4,5,6].
The genus Caulerpa (Chlorophyta) was selected due to the extensive body of literature reporting the biological activities of its species. Several species present along the Yucatán coast were collected, including C. ashmeadii, C. paspaloides, C. cupressoides, C. verticillata, and C. prolifera. The collected specimens were subsequently dried and ground into a fine powder prior to extraction [7,8,9].
Marine macroalgae have gained increasing scientific and industrial relevance in sectors such as industry, agriculture, fisheries, bioremediation, and pharmaceutical research. Additionally, seaweeds are widely consumed in Asian countries such as China, Japan, Malaysia, and Korea for their nutritional value and reported therapeutic properties, including antioxidant and anti-inflammatory effects [10,11,12].
The genus Caulerpa is widely distributed in tropical and subtropical regions, including Australia, the Mediterranean Sea, East and Southeast Asia, the Gulf of Mexico, and parts of South America [7,8,13,14]. In Mexico, Caulerpa species have been reported in both the Pacific Ocean and the Gulf of Mexico, with records in Baja California Sur, Sinaloa, Veracruz, Campeche, Yucatán, and Quintana Roo [15,16,17,18]. The proximate composition of dried Caulerpa species typically ranges from 50 to 70% carbohydrates, 10 to 18% proteins, 1 to 3% lipids, and 7 to 26% ash, including macroelements such as sodium, magnesium, calcium, and potassium, as well as trace elements such as iron, zinc, manganese, and copper. This composition varies depending on species and environmental conditions [8,19,20].
Organic extracts and isolated metabolites from Caulerpa spp. exhibit a wide range of biological activities, including anti-inflammatory, antioxidant, antidiabetic, antiproliferative, anticoagulant, and immunostimulatory effects, with C. racemosa being the most extensively studied species [13,21,22,23]. Some of the most well characterized secondary metabolites isolated from Caulerpa spp. include caulerpenyne, caulerpin, caulerpol, and trifarin, which belong primarily to the sesquiterpenoid, alkaloid, and diterpenoid chemical classes and are responsible for a broad spectrum of reported bioactivities [7,24].
FTIR spectroscopy provides qualitative information on functional groups and major metabolite classes in complex mixtures and is widely used for preliminary compositional analyses [25]. While ATR-FTIR chemometrics is well established for the analysis of solvent-derived extracts in higher plants [26,27], its applications in macroalgae have primarily focused on whole-biomass characterization [28,29]. Moreover, studies analyzing extracts typically rely on technical replicates, with limited consideration of biological variability [26,27,30].
Considering this gap, we propose that ATR-FTIR chemometrics can effectively resolve solvent-, species-, and season-dependent variation in Caulerpa extracts and facilitate the interpretation of their associated bioactivity data. In this context, we investigated chemical variation in ATR-FTIR spectra of Caulerpa extracts, aiming to develop a more cost-effective and practical approach for assessing chemical diversity, particularly when large numbers of extracts limit the feasibility of using high-end analytical instrumentation.

2. Materials and Methods

2.1. Sample Collection

Sample collection was conducted in February, April, June, August, October, and December 2022, as well as January 2023, covering a complete annual cycle to assess seasonal variation and species abundance. Vegetative material was collected along the shoreline of Dzilam de Bravo, Yucatán, Mexico (21°23′24.3″ N, 88°54′33.9″ W), at depths ranging from 0.5 to 1.5 m, within an area approximately 500 m in length and extending up to 50 m offshore.
Samples were collected directly from the benthic substrate by free diving, placed in polypropylene bags, and immediately transported to the laboratory under wet conditions while being maintained in an ice bath. Epiphytes, sand, and shell debris were manually removed. The material was initially washed with distilled water, then with deionized water, and finally with seawater to maintain osmotic balance. The cleaned material was air-dried at room temperature (RT) for 12 h and subsequently oven-dried at 45 °C until a constant weight was achieved. The dried samples were then ground to a fine powder using a domestic grinder and stored at RT in a dark and dry environment until further processing.
Additional specimens were collected for taxonomic identification, preserved in 10% formalin, and processed as herbarium vouchers. These specimens were deposited in the Herbarium of the Universidad Autónoma de Yucatán under the following accession numbers: Caulerpa ashmeadii (ID 01626–01629), Caulerpa prolifera (ID 01639–01648), Caulerpa paspaloides (ID 01630–01633), Caulerpa cupressoides (ID 01634–01636), and Caulerpa verticillata (ID 01637–01638).

2.2. Extract Obtention, Ash Content, and ATR-FTIR Analysis

Dried and finely ground algal biomass was extracted by sequential maceration with organic solvents of increasing polarity: hexane (ACS reagent, ≥95.0%, Sigma-Aldrich/Merck, Darmstadt, Germany), dichloromethane (≥99.8%, Sigma-Aldrich/Merck), acetone (HPLC grade, ≥99.9%, Fisher Chemical, Hampton, NH, USA), and methanol (LC-MS grade, ≥99.9%, Honeywell-Chromasolv/J.T. Baker, Morris Plains, NJ, USA). Extractions were performed in amber glass flasks to minimize photodegradation. The amount of dry algal material varied across sampling campaigns and species, as specified in Supplementary Table S1. A solvent-to-biomass ratio of 10:1 (v/w), calculated as ten times the dry mass of the algae material per step, for 72 h at room temperature with occasional manual agitation [5,6].
Organic fractions were obtained consecutively on the same biomass following an ascending polarity extraction scheme, beginning with hexane, followed by dichloromethane, then acetone, and finally methanol [31]. After each maceration step, the mixture was filtered to recover the liquid phase (supernatant), and the residual solid was briefly air-dried before proceeding with the next solvent. Each supernatant was concentrated under reduced pressure on a rotary evaporator at ≤45 °C to minimize thermal degradation of thermolabile constituents, and the resulting crude extracts were stored at 4 °C, protected from light, until analysis [3]. Yield was calculated as yield % = extract (g)/dry material (g) × 100. The ash content was determined in the hexane and methanolic extracts of January samples of C. cupressoides, C. paspaloides, and C. ashmeadii. The extract was incinerated in a Thermolyne™ (Thermo Scientific, Waltham, MA, USA) 1400 furnace using a manual ramp starting at 100 °C, increasing by 100 °C every 10 min up to 800 °C. The temperature was held isothermally at 800 °C for 10 min before the heating was shut off. Ash content in the extracts was calculated as ash (%) = ash (g)/extract (g) × 100. All weight measurements were carried out in an analytical balance CPA2250 (Sartorius™, Gottingen, Germany).
ATR-FTIR measurements were performed using a Nicolet™ iS5 FTIR spectrometer (Thermo Scientific, Waltham, MA, USA) equipped with an iD7 ATR accessory fitted with a ZnSe crystal and controlled with OMNIC™ Suite (9.6+) software. Each extract was analyzed in triplicate. Spectra were acquired from 500 to 4000 cm−1, with 32 scans per measurement, automatic background subtraction before each run, and a spectral resolution of 8 cm−1 (data spacing 0.964 cm−1) [29].

2.3. ATR-FTIR Data Preprocessing and Chemometric Analysis

ATR-FTIR spectra were imported into R (version 4.5.2) via RStudio 2026.04.0 and processed using an exploratory chemometric workflow implemented with the ChemoSpec package 6.3.1 [32,33,34]. Preprocessing comprised baseline correction and normalization, following the procedure reported by Peniche-Pavía et al. (2024) [29] with minor modifications [34]. The spectral window was restricted to 525–3700 cm−1 prior to feature extraction. Instead of equidistant binning, peak-based variable selection was applied to reduce collinearity and facilitate interpretation: peaks were detected using the detectSpecPeaks from the speaq R package, which implements wavelet-based peak detection and avoids the information loss associated with binning [35,36]. The most frequent peaks across all samples were retained, keeping only those separated by at least 30 cm−1, thereby reducing the data matrix from 3293 variables to 17 representative peaks. This final dataset is referred to here as the FTIR band dataset. Both the full-spectrum and FTIR datasets will be available as CSV files at the Zenodo link (https://doi.org/10.5281/zenodo.19867716, access date: 29 April 2026) upon publication. At this stage, a quality-control filter was implemented by repeating the drying step for samples whose spectra exhibited IR bands attributable to residual extraction solvents.

2.4. Chemometric Analysis

The chemometric analysis of the spectroscopic data was performed on the R environment [37] using the R packages of mixOmics for PCA scores and biplot graphics [38]. Normal distribution evaluation required the R car package [39]. Nonparametric univariate analysis and post hoc Dunn’s test were performed in R using FSA [40]. The production of boxplots with compact display letters also needed dplyr [38], multcompView [41], and ggplot2 [42]. The vegan R package was used to perform PERMANOVA and the beta dispersion test, while pairwise PERMANOVA was performed with the pairwiseAdonis R package [43,44]. R packages Nbclust were used to determine the optimal number of k-clusters, and factoextra to execute and plot the k-means algorithm [45,46]. The supervised classification model was implemented using the R caret package with repeated 10-fold cross-validation (10 repetitions) [47]. The chosen classifiers were commonly applied to metabolomics and spectral data: PLS-DA, SVM (linear, polynomial, and radial kernels), and Random Forest [48,49]. Data processing for all statistical analyses included centering and scaling. Hyperparameter optimization was performed within the caret training framework using repeated 10-fold cross-validation (3 repeats). For PLS-DA, the number of components was explicitly tuned using predefined grids, whereas for Random Forest and SVM models, hyperparameters were automatically optimized with a tuning length of 5; the number of trees in Random Forest was fixed at 500. Confusion matrix metrics were calculated using the caret and mltool R packages.

2.5. Total Phenolic Content

Total phenolic content (TPC) was determined spectrophotometrically and expressed as gallic acid equivalents (GAE) using the Folin–Ciocalteu assay, following the classical protocol with minor modifications to improve reproducibility [50,51]. Phenolic compounds were extracted from the samples using 80% (v/v) ethanol, a solvent widely recommended for efficient recovery of phenolics from plant and algal matrices [52]. The extracts were clarified by filtration or centrifugation to remove insoluble material. An aliquot of the extract (0.2 mL) was mixed with 1.0 mL of diluted Folin–Ciocalteu reagent and incubated at room temperature for 3–5 min. Subsequently, 0.8 mL of a 7.5% (w/v) sodium carbonate solution was added, and the reaction mixture was incubated in the dark at room temperature for 30–60 min to allow full color development [19,50]. Absorbance was measured at 760 nm using a UV–Vis spectrophotometer. Quantification was performed using a calibration curve constructed with gallic acid standard solutions of known concentrations. The total phenolic content was calculated from the calibration curve and expressed as milligrams of gallic acid equivalents per gram of sample (µg GAE. mg−1). All measurements were performed thrice. This approach remains widely used and has been validated in recent studies evaluating the antioxidant properties of plant and macroalgal extracts [19,52,53].

2.6. Antioxidant Capacity as Trolox Equivalents

Antioxidant capacity was determined spectrophotometrically and expressed as Trolox equivalent antioxidant capacity (TEAC) using the ABTS radical cation decolorization assay, following established procedures with minor modifications [53,54]. The ABTS radical cation (ABTS•+) was generated by reacting a 7 mM ABTS solution with 2.45 mM potassium persulfate in the dark for 12–16 h at room temperature, allowing complete radical formation. The ABTS•+ solution was subsequently diluted with ethanol until an absorbance of 0.70 ± 0.02 at 734 nm was achieved. For the assay, an aliquot of 200 µL of sample extract or Trolox standard was mixed with 2.8 mL of the diluted ABTS•+ solution and incubated at room temperature for 6–10 min to allow radical scavenging to occur. Absorbance was measured at 734 nm using a UV–Vis spectrophotometer. A calibration curve was constructed using Trolox solutions of known concentrations, and antioxidant capacity was calculated from this curve and expressed as micromoles of Trolox equivalents per gram of sample (µg TE. mg−1). All measurements were performed in triplicate, and reagent blanks were included to correct for background absorbance. The resulting TEAC values were used alongside total phenolic content (TPC) data to compare antioxidant potential among samples [55].

2.7. Analysis and Visualization of Antioxidant Data

Antioxidant activity data, including TPC and TEAC, were analyzed in R using the same packages described in previous sections. Before statistical analysis, variables were centered and scaled to ensure comparability across measurements. Differences among experimental groups (species, season, and extraction solvent) were evaluated using the Kruskal–Wallis test because normality assumptions were not consistently met. When significant differences were detected, pairwise comparisons were performed using Dunn’s test with Bonferroni correction to control multiple testing.
Results were visualized using boxplots with interquartile range (IQR) generated in ggplot2, incorporating compact letter displays (CLD) from a Dunn test to indicate statistically homogeneous groups. Statistical significance from the Kruskal–Wallis test was also annotated on each plot. To explore associations between antioxidant activity and FTIR spectral features, Spearman correlation analyses were conducted between bioactivity variables (TPC and TEAC) and selected IR bands. Correlation analysis and the correlogram were computed using Hmisc and corrplot [56,57]. Correlation matrices were visualized using hierarchical clustering, and p-values were indicated with asterisks (* for p < 0.05, ** for p < 0.01, and *** for p < 0.001).

3. Results and Discussion

3.1. Species Collected and Their Extraction Yield

A total of five Caulerpa species were found across all seven sampling dates. Supplementary Table S2 summarizes the species’ abundance at each site. C. prolifera and C. ashmeadii were the two most abundant species, whereas C. verticillata was found in nearly all collections but restricted to specific locations, typically near cold-water currents and in areas with harder substrates, including rocky or coral-associated zones [58]. Additionally, this species was the hardest to clean of macroscopic epibionts without causing damage to the specimens. In June 2022, C. paspaloides was found only as a few small individuals; it was not collected for extraction, and its presence was recorded only. C. mexicana and C. sertularoides were sporadically present, but in sufficient quantities to prepare a limited number of extracts. Consequently, the extraction process was carried out exclusively on species that were consistently present across sampling campaigns.
Extraction yields were estimated from April 2022 to January 2023 and are shown in Table 1. Yields below 0.4% are only marked as <0.4%. As can be seen, most of the hexane extracts fell between 1 and 3.5%, whereas methanolic extracts exhibited the highest yields, reflecting the well-established trend in which the three lower polarity extracts had lower yields than the methanolic extract [59].

3.2. Description of Main Features of the ATR-FTIR Spectra of the Caulerpa Extracts

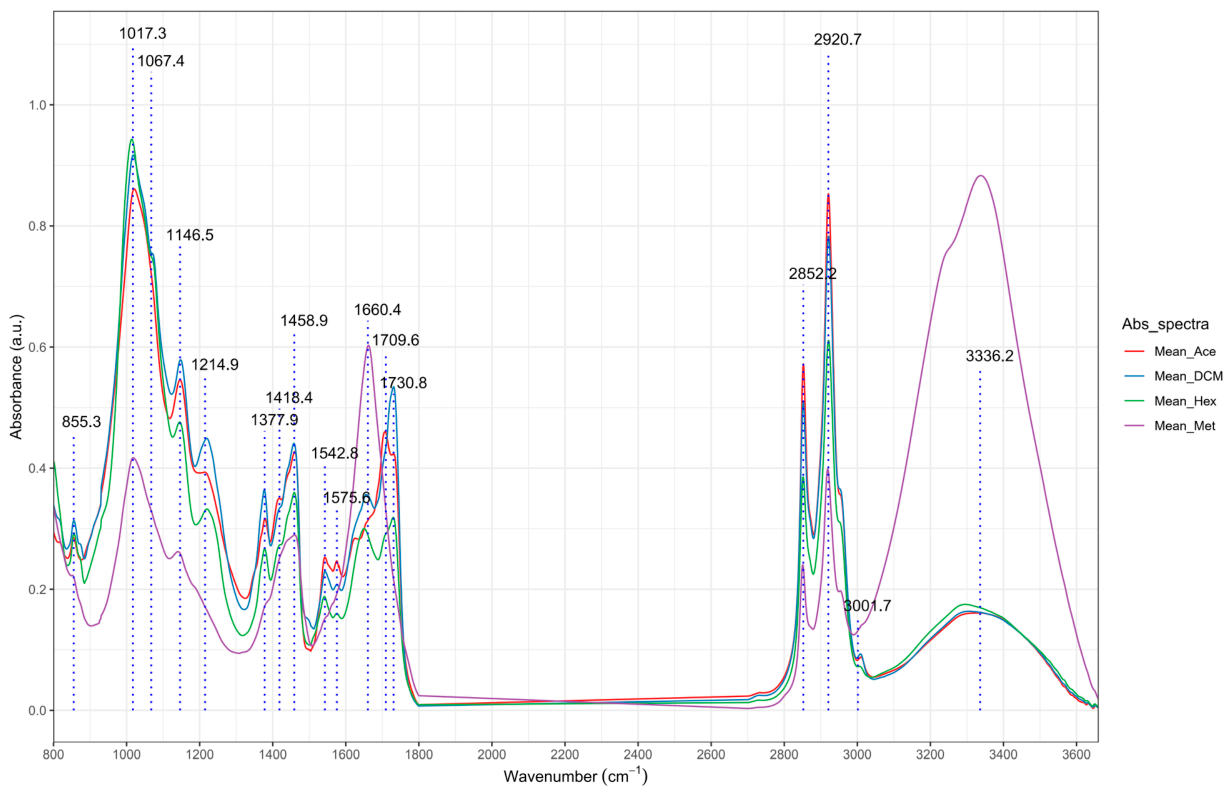
We initially examined the ATR-FTIR data for the Caulerpa extracts via spectral visualization grouped by extraction solvent, using the mean spectrum for each extract type (Figure 1). This figure also includes annotations of the main detected bands, which were subsequently used in the chemometric analyses. The IR spectra of the methanolic extracts were visually the most distinct when compared with the lower-polarity fractions, namely hexane, dichloromethane, and acetone. Additionally, visualization of the stacked spectra and outlier detection for the technical replicates are provided in Supplementary Figures S1 and S2.
A tentative assignment of chemical functionalities to the IR bands highlighted in Figure 1 is provided in Table 2. The IR bands with higher absorbance in extracts obtained with less polar solvents were mainly associated with characteristic stretching vibrations of methylene groups (-CH2), at 2852.2 and 2920.7 cm−1, which are particularly intense in molecules containing long aliphatic chains, such as fatty acids and other lipid molecules like terpenes [60,61]. These aliphatic chains also contribute to the pair of IR bands at 1377.8 and 1458.8 cm−1 due to bending vibrations of -CH2 groups [61]. Other IR bands expected to appear in lipids should be those arising from absorption of the bond at 1214.9 cm−1, which might originate from the C(=O)-O stretch in esters, and from the carbonyl groups at 1709.586 cm−1 (ketones) and 1730.799 cm−1 (esters). For instance, bioactive terpenes from the genus Caulerpa are often esterified but are also expected to arise from ubiquitous structural lipids [62,63]. The last IR bands that could arise from lipids are those of aromatic rings or double bonds: 1575.5 cm−1 (C=C) and 3001.5 cm−1 (C=C-H). In Caulerpa, these bands are expected to arise primarily from unsaturated fatty-acid esters, while bisindole alkaloids would contribute only marginally to the observed absorptions [63].
A pair of IR bands with strong absorbance is located in the 1000–1100 cm−1 region, 1017 and 1067 cm−1. This indicates a C-O bond and reflects the preponderance of carbohydrates in the fractions, which contain several hydroxyl groups. However, it does not rule out a contribution from oxygenated terpenes or other bioactive molecules. Previous proximate analyses of Caulerpa species have shown that carbohydrates constitute the largest proportion of the dry biomass (49–72%) in species such as C. lentillifera and C. racemosa, exceeding the levels of ash, protein, and lipids [64]. Therefore, the finding that some of these bands exhibited high absorption in the lower-polarity fractions suggests that, even if the solvent is inadequate for extracting Caulerpa carbohydrates, it still extracts them, albeit in low yields. It is interesting to note that some bands suggest the presence of sulfated polysaccharides, common in the Caulerpa genus, beginning with the band at 1146.4 cm−1 (C-O-C stretch vibration), which is commonly associated with the glycosidic bond in polysaccharides. Also, there are three IR bands whose presence may indicate the abundance of sulfated polysaccharides: the band at 855.2 cm−1 (vs of C-O-S), 1214.9 cm−1s of S=O), and 1418.4 cm−1 [65].
Table 2. Description of the main IR bands found in the Caulerpa extracts.
IR Band
( ν ~ , cm−1)
Highest Absorption in SolventFunctional-Group Vibration Assignment and Its Associated MetabolitesRef.
855.2751CH2Cl2Characteristic of sulfated polysaccharides (SP), νs of C-O-S[65]
1017.266HexaneAssociated with hydroxylated compounds, νs of C-O[60,66]
1067.406HexaneMay correspond to saccharide, νs of C-O in a ring[66]
1146.474CH2Cl2Consistent with Polysaccharide, νas of C-O-C[67]
1214.934CH2Cl2ν of C(=O)-O stretch, strong absorption in lipids. Also, SP (νs S=O in C-O-SO3) may contribute to the band.[65,66]
1377.890CH2Cl2δs CH3, common vibration of aliphatic backbone.[61,62]
1418.388AcetoneIndicative of Organic Acids (OAs), νs of COO and SP, νas S=O in C-O-SO3.[65,66]
1458.885CH2Cl2δas CH3, common vibration of aliphatic backbone.[61,62]
1542.774AcetoneConsistent with the Amide II band (δ N-H plus ν C-N)[68]
1575.558AcetoneAssociated with the C-C aromatic ring stretch.[66,69]
1660.410MethanolMay correspond to νs of carbonyl (C=O) moiety in amide (band I) and carboxyl (-COO) of OA. Also, consistent with the bending of H-O-H.[60,70]
1709.586Acetoneνs of the ketone carbonyl (C=O).[60,66]
1730.799CH2Cl2νs of the ester carbonyl (C=O).[60,66]
2852.203AcetoneRelated to the νs of aliphatic C-H (lipid marker).[60,66]
2920.663AcetoneRelated to the νas of aliphatic C-H (lipid marker).[60,66]
3001.659CH2Cl2Unsaturated stretching (ν of C=C-H). May indicate unsaturated fatty acids or their derivatives.[60,66]
3336.248Methanolν of O-H (OA, carbohydrates, glycosides, and residual H2O)[60,65]
Symbol: vs means symmetric stretch vibration; vas is for asymmetric stretch vibration; δs in-plane symmetric vibration (scissoring); δas in-plane symmetric vibration (rocking).
The previously discussed IR bands exhibit stronger absorption in the low-polarity fractions. Some IR bands that appear stronger in methanol are those associated with the amide functional group (1660 cm−1 and 1542 cm−1), which is found in peptides and proteins. Also, the IR broadband of the stretching O-H appears strong at 3336.2 cm−1. We observed that some methanol fractions were highly hygroscopic. Therefore, we expect some contribution from residual water to the absorption bands at 1660 cm−1 and 3336.2 cm−1.

3.3. Exploratory Chemometric Analysis

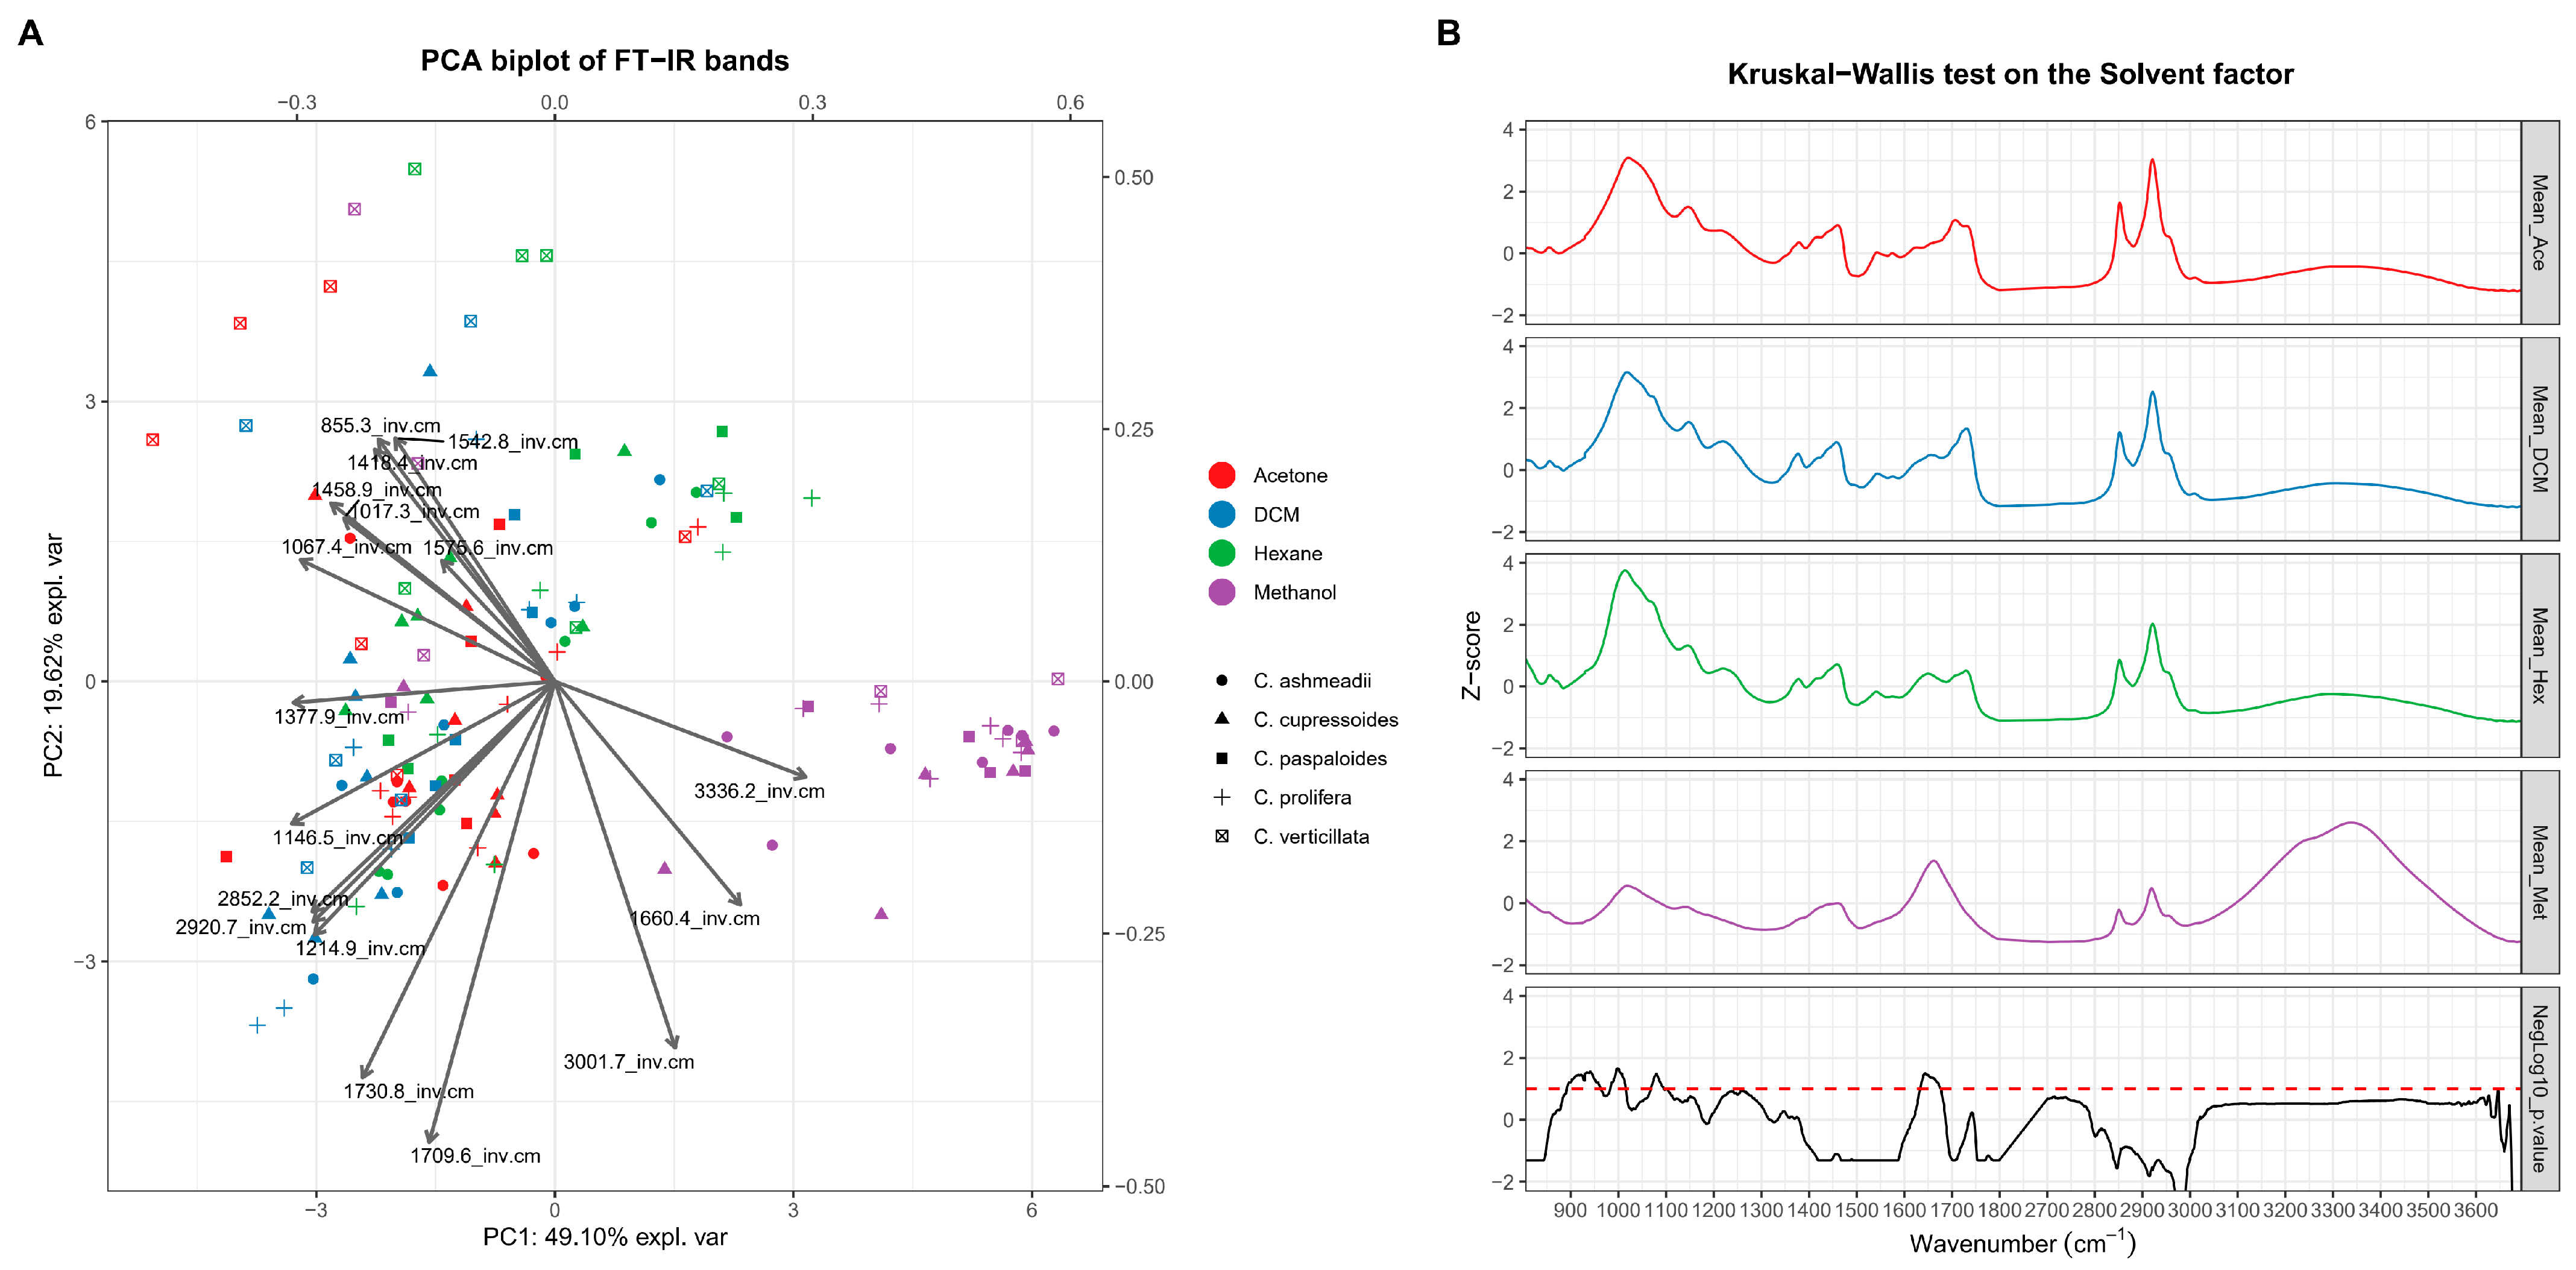
We implemented statistical tests to determine which bands, or spectral zones, drive the difference caused by the extraction solvents. In Figure 2A, the PCA biplot shows that the non-polar fractions are separated from the methanol group along the positive PC1 axis. This is clearly observed in the 3D plot of the PCA scores in Supplementary Figure S3. The magnitude of each vector reflects the contribution of the corresponding variable to the principal component; thus, longer vectors indicate greater influence on the spectral variation.
In PC1 (which explain 49.10% of the total variation), the IR bands at 1660.41 cm−1, 3001.5 cm−1, and 3336.2 cm−1 separate the methanolic fractions from the rest of the spectrum. Meaning that these bands have strong absorptions in the methanolic extracts. Also, the same plots highlight differences by species; in particular, the samples from C. verticillata behave chemically similarly among themselves, even across different solvents, with several samples (scores) on the positive side of the PC2 axis (which explains 19.62% of the total variation). In this case, the samples exhibit high absorption at 855.3 cm−1, 1418.4 cm−1, 1458.9 cm−1, 1542.8 cm−1, and 1576.6 cm−1. As we presented in Table 2, these bands correspond to the S-O bond, amide band II, C-C (double bonds), and C-H bending vibrations.
Then, an analysis of variance for each spectral point by solvent group was performed to identify which regions account for differences in spectral absorbance across extraction solvents, which are related to their chemical composition. After determining that the data were non-normally distributed (Supplementary Table S3), we carried out a Kruskal–Wallis test. Figure 2B plots the results of a Kruskal–Wallis test on the extracts based on the solvent factor. The lower plot section shows which sections of the IR spectral zone explain the difference in the solvent factor, and the statistical significance (lower p-value) appears as bands. The results indicate that the differences are significant at 941.1 cm−1, 998.9 cm−1, 1079.9 cm−1, and 1644 cm−1. These IR bands occur in regions of C-O bonds, except 1644 cm−1, where the strong νas of carboxylate (OO) happens [71]. This indicates that the non-polar fractions contain abundant complex carbohydrates, as they constitute a high percentage of the composition of Caulerpa species, while the lipid content in Caulerpa is low.
At this point, it was necessary to assess how the month of sample collection and species variation in the spectral data affect the results, a task that presents additional challenges. Furthermore, statistical confirmation was sought regarding the influence of the solvent fraction on variation in both datasets, as well as the impact of using either the full-spectrum or IR-band datasets on the classification of the extracts, considering the month of collection and species. The initial approach involved applying PERMANOVA (Table 3), which enables calculation of effect sizes for the three factors.
PERMANOVA analyses indicated that the solvent was the primary factor influencing variance in the FTIR profiles for both the full-spectrum and band-based datasets. In the full-spectrum dataset, the solvent accounted for 61.6% of the variance (F = 76.11, p-value = 0.0001), representing a very strong effect (>25%). In contrast, month (collection date) and species contributed substantially less, explaining 3.97% (F = 2.45, p-value = 0.0117) and 3.41% (F = 3.16, p-value = 0.0051) of the variance, respectively, which are considered weak effects (<5%).
In the FTIR band dataset, the solvent also remained the principal explanatory factor for chemical differences in the FTIR spectra, accounting for 42.8% of the variance (F = 36.10, p-value = 0.0001). Month and species explained 6.47% (F = 2.73, p-value = 0.0019) and 5.33% (F = 3.38, p-value = 0.0009), respectively, corresponding to moderate effects (5–10%). Therefore, in both datasets, the extraction solvent is the primary driver of variance, while species and month of collection contribute minimally to the total variation, indicating that ATR-FTIR is less sensitive to subtle biological differences among Caulerpa species.
Subsequently, a pairwise PERMANOVA analysis was performed on both the full-spectrum dataset and the selected IR bands to identify solvent pairs with similar chemical profiles (Supplementary Table S4). Both approaches produced highly consistent results. Only one comparison was not statistically significant in either dataset: acetone versus dichloromethane (R2 < 0.027, p-value > 0.152), indicating a similar chemical composition between these solvents.
In the full-spectrum dataset, all comparisons involving methanol exhibited statistically significant differences with large effect sizes, including methanol versus acetone (R2 = 0.630, p = 0.001), dichloromethane (R2 = 0.640, p = 0.001), and hexane (R2 = 0.601, p = 0.001), indicating a distinctly different chemical profile. In contrast, comparisons among the non-polar and moderately polar solvents yielded lower but still significant effect sizes, particularly dichloromethane versus hexane (R2 = 0.0937, p = 0.001) and acetone versus hexane (R2 = 0.0896, p = 0.005), suggesting moderate compositional differences.
A similar pattern was observed in the IR band dataset. Comparisons involving methanol remained statistically significant with strong effect sizes: methanol versus acetone (R2 = 0.470, p = 0.001), dichloromethane (R2 = 0.483, p = 0.001), and hexane (R2 = 0.403, p = 0.001). Comparisons between dichloromethane and hexane (R2 = 0.1014, p = 0.005) and between acetone and hexane (R2 = 0.1064, p = 0.001) demonstrated moderate but significant differences, consistent with the findings from the full-spectrum analysis.
Overall, these results indicate that methanol extracts a substantially different set of compounds compared to the other solvents. In contrast, acetone and dichloromethane yield highly similar chemical profiles, while hexane exhibits moderate differentiation from the other solvents.

3.4. Clustering and Classification Models on the Caulerpa Extracts

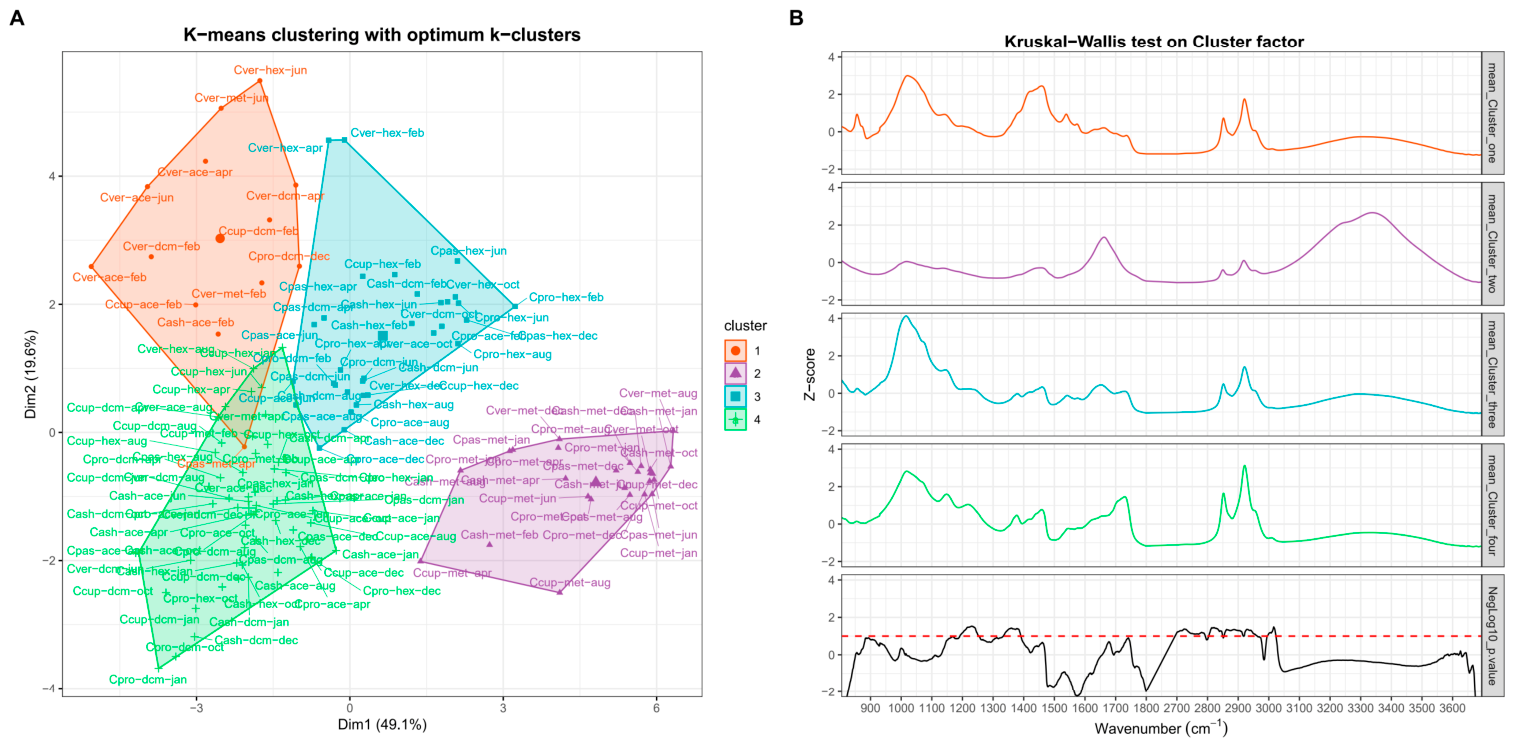
Our next approach was to perform unsupervised clustering on the IR band dataset to identify unexpected trends among the samples by grouping them by chemical similarity. We began by using hierarchical clustering analysis, which yielded two main clusters, consistent with the chemical information presented: one for methanolic extracts and another for non-polar extracts (see Supplementary Figure S4). Meanwhile, Figure 3A shows the results of the clustering using the k-means algorithm, with an optimal k = 4 determined after consensus on 30 indexes (Supplementary Figure S5).
The 26 members of Cluster 2 are methanolic extracts out of the 32 methanolic extracts; therefore, the mean FT-IR spectrum of the cluster in Figure 3B strongly resembles the methanol spectrum in Figure 2B. Most relevant is that Clusters 1, 3, and 4 show similarities in the chemical profile, as indicated by the FT-IR spectra, that do not correspond to the studied factors such as solvent, date of collection (month), or species, yet still reflect differences in chemical composition. The FT-IR spectra of the samples in Cluster 1 share characteristic features, with strong absorption bands in the 1350–1600 cm−1 range, particularly at 1458.8, 1542.8, and 1575.6 cm−1. These bands are the same as those we discussed earlier for C. verticillata, as expected, since 8 of the 13 members of the cluster are from such species. As we mentioned in Section 2, C. verticillata was the most difficult species to collect, due to its fragile structure and strong attachment to rocks or coral, which made sample handling similar to that of the other Caulerpa species, causing a chemical variation that we cannot rule out in this separation. Therefore, except for C. verticillata, differences among species are subtle in comparison to solvent-driven variation in ATR-FTIR data.
Cluster 3 has the strongest absorption for the IR band around 1000 to 1100 cm−1. Half of this cluster is integrated (16 out of 32) with the hexane fraction, and the other half with the same quantity of dichloromethane and acetone fractions. Finally, the samples of Cluster 4 share distinct features: strong absorption bands at the C-H stretching vibrations (2852.2 and 2920.7 cm−1) and the C=O stretching vibrations (1709.6 and 1730.8 cm−1); most of the samples in this cluster are from dichloromethane and acetone. Thus, a large percentage of dichloromethane and acetone extracts share similar chemical profiles, as expected, since both solvents have similar polarity. The negative log base 10 of the p-value from an analysis of variance in Figure 3B shows that the spectra zone around 1200 to 1250 and 1350 to 1400, and the C-H vibration bond in (2800 to 2950 cm−1) had the highest variation between the four kinds of spectra groups found by the k-means algorithm.
All the information presented so far indicates that the differences observed among the extracts are largely attributable to the presence of water in the methanolic samples. As described in the methodology, each extract was dried to obtain a solid residue, including the methanolic fractions. However, these residues proved highly hygroscopic, and, due to their marine origin, the resulting crystals consisted primarily of salts rather than sugars, unlike what is typically observed in terrestrial plant extracts [72]. We confirmed this hypothesis by quantifying the ash content of hexane, as a representative of the lower-polarity extracts, and methanol. It was found that hexane extracts had a mean ash content of 10.5 (±6.8 SD)%, while methanol extracts had a mean ash content of 55.1 (±19.4 SD)%. This proves that an additional step is necessary to remove most of the salt, as it can end up even in non-aqueous extracts. The ascending polarity extraction is designed to separate metabolites by polarity, with less-polar fractions (e.g., hexane) expected to be enriched in lipids, and more-polar fractions (e.g., methanol) in sugars, amino acids, and organic acids. We also anticipated that intermediate-polarity fractions, dichloromethane, and acetone might contain sesquiterpenes, compounds commonly associated with the Caulerpa genus, and their bioactivity [65]. The clustering analysis shows that Cluster 4 had higher absorption in the IR band associated with terpenes [61], and the cluster was mainly composed of dichloromethane and acetone extracts, in accordance with the extraction polarity.
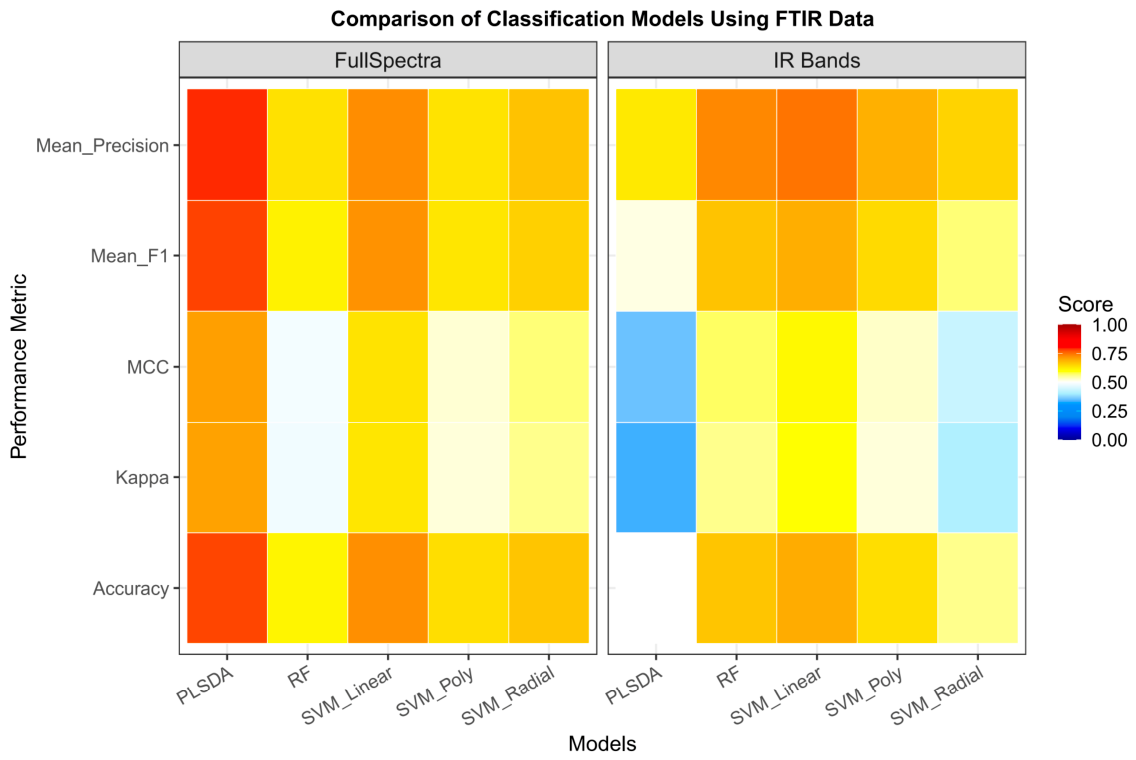
Considering that most of the variation in both datasets is due to the solvent factor, we included a final determination to examine whether the chemical information present in the FTIR spectra could be useful for classifying the extract by solvent used across the full-spectrum and the FT-IR band dataset. Five models commonly used in metabolomic studies and spectral data experiments were implemented: PLS-DA, Random Forest, and three Support Vector Machine kernels: linear, polynomial, and radial [48]. A summary of the most important metrics of the confusion matrix is visualized in Figure 4. Accuracy, Mean F1-score, and Mean Precision range from 0 to 1, whereas Cohen’s Kappa and Matthews Correlation Coefficient (MCC) may range from −1 to +1, where negative values indicate performance worse than chance. Furthermore, a complete set of metrics for each model is provided in Supplementary Table S5.
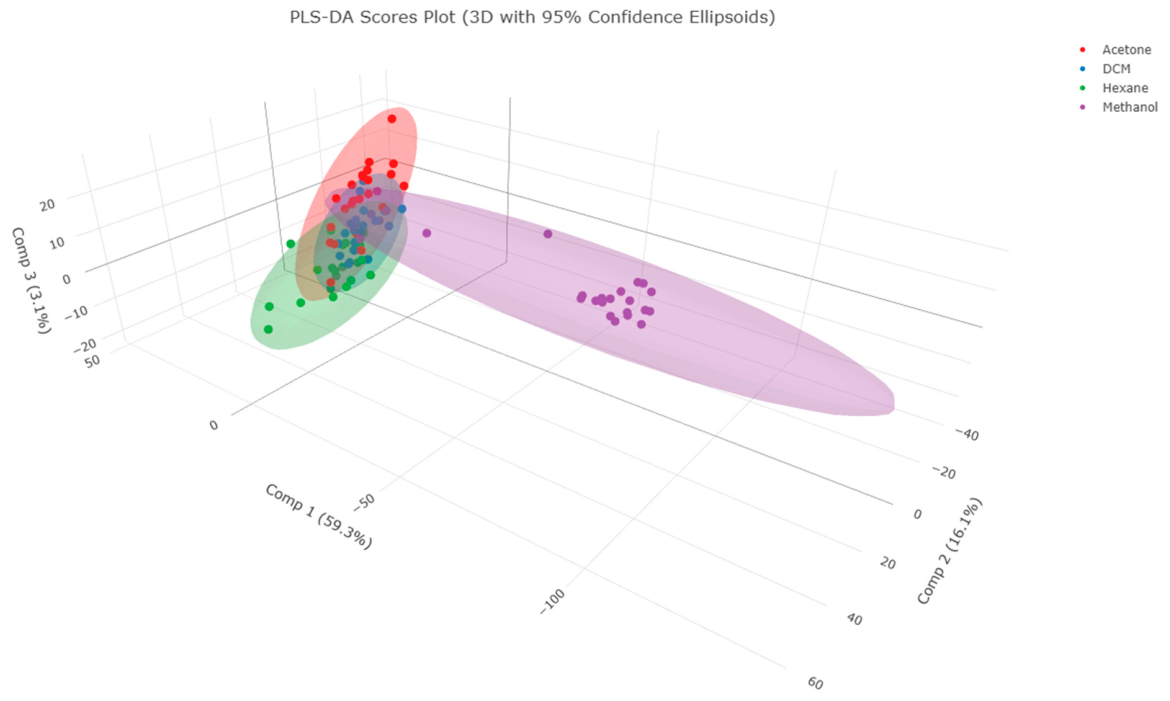
The best model, PLSDA for a full-spectrum dataset, resulted in the following confusion metrics: Accuracy of 0.7778, mean F1 score of 0.7792, mean precision of 0.7900, kappa of 0.7037, and MCC of 0.7066. These metric values indicate moderate performance, for instance, as measured by Cohen’s kappa. The PLS-DA model (κ = 0.7037) falls inside the moderate level (κ = 0.6–0.79) of agreement between the observed and predicted classes [73]. The Matthews Correlation Coefficient (MCC) is widely regarded as a robust metric for binary and multi-class classification because it summarizes the overall quality of predictions while considering all elements of the confusion matrix and class imbalance [74,75]. Therefore, it was prioritized as a key criterion for selecting the best-performing model. The models with the best confusion matrix metrics in second and first place were SVM linear and PLSDA using a full-spectrum dataset (Figure 5), while the SVM linear model using the IR band dataset was the third-best model.
Figure 5 shows the three-dimensional score plot of the PLS-DA model based on the first three latent components, which together account for 78.5% of the total X-variance. The ellipsoids represent the 95% confidence regions for each solvent class. Clear separation was observed mainly along Component 1 (59.3%), which discriminated methanol extracts from those of the lower-polarity solvents. Component 2 (16.1%) further improved the separation of hexane extracts from the intermediate-polarity solvents. Component 3 (3.1%) contributed to the distinction of acetone extracts. Overall, the score distribution indicates strong solvent-dependent chemical differences in the FTIR profiles.
It is important to note that this does not mean that this was the best model for each solvent. Surprisingly, the acetone extract was best predicted using the IR band approach rather than the full-spectrum data (Table 4), suggesting that IR band detection can improve the model’s predictive capacity for this type of extract. The complete results for each model’s predictive performance on the full-spectrum and IR-band datasets are in Supplementary Tables S6 and S7, respectively. Furthermore, the VIP analysis (Supplementary Figure S6) for the PLS-DA model of the full-spectrum dataset shows that the 20 most important original variables for classification were located in the spectral regions of 3686.3 to 3688.2 and 802.24 to 816.7 cm−1. It may not be a coincidence that both spectral regions fall within the extreme range of the ATR-FTIR spectrum, where baseline drift is difficult for algorithms to correct; thus, the approach using the IR band dataset is more robust to baseline drift. Given that the linear SVM model for the IR band dataset performed better at predicting that the extract was obtained with acetone than any model in the full-spectrum dataset.
After several tests on the ATR-FTIR data, we can confirm that this data can be used to predict the solvent used in the extraction process, with moderate performance (confusion matrix metrics around 0.7). However, the PERMANOVA pairwise comparison between acetone and dichloromethane showed no significant differences (p-value > 0.05) in both datasets. Furthermore, unsupervised clustering did not align with the design factors, indicating that the observed chemical similarity is real. The other design factors, such as species and date of collection, explained less variance (R2 < 0.1) than the solvent factor (R2 > 0.1).
This means that it is necessary to proceed with caution when exploring the chemical differences of extracts with an FTIR instrument. Several reasons may explain this outcome: (1) the chemical profiles of the extracts have become too similar due to the extraction methodology, which eliminates a degree of biological variance, for instance, the variance due to species from the chemical profile; (2) the inherent limitations of FTIR spectroscopy may prevent resolution of subtle differences compared to high-end instruments; and (3) residual effects of the solvent are hindering the potential of the FTIR spectral data to predict the origin of the samples based on their spectra, but at the same time enabling a certain capacity to predict the extraction solvent. Thus, our general recommendation is to experimentally eliminate most of the solvent or apply a filter in the preprocessing of the FTIR spectral data to remove most of the IR bands from such solvent.

3.5. Antioxidant and Total Phenolic Content Evaluation

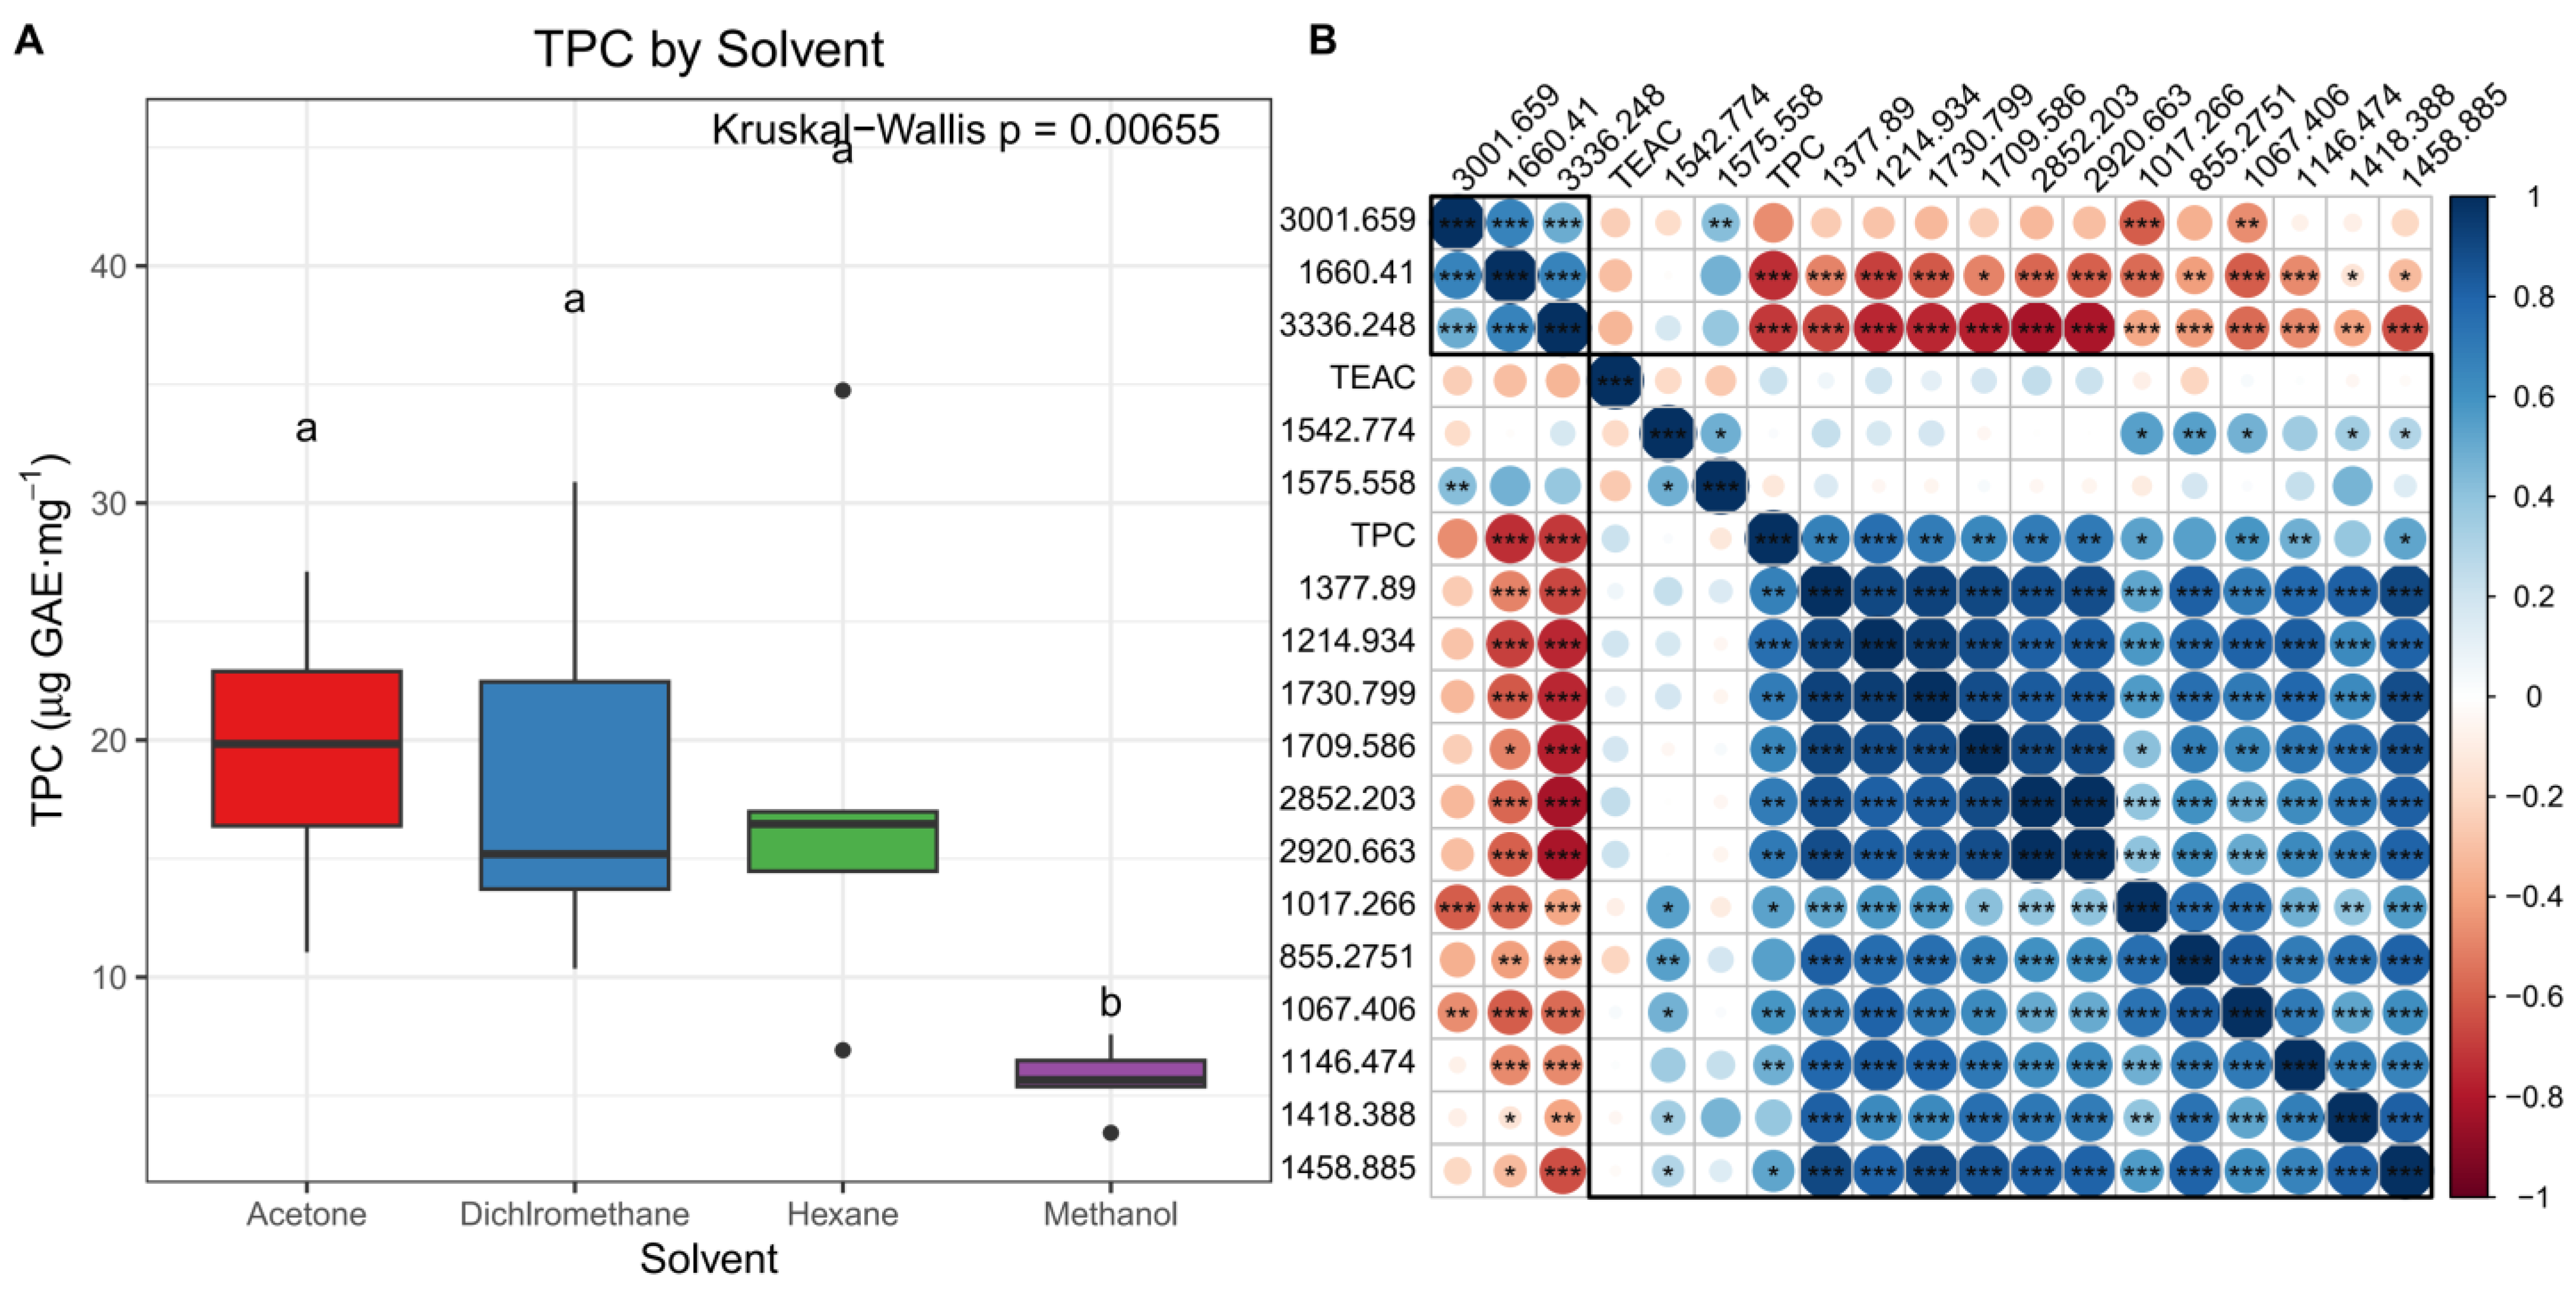
Table 5 shows the total phenolic content (TPC) measured as GAE by the Folin-Ciocalteu method and the TEAC by the ABTS method. These measurements were carried out only on a reduced set of extracts (22 out of 128) to identify trends across the samples, such as which samples would be better not to test because they have low TEAC or TPC, thereby saving time and resources. The Kruskal–Wallis test comparing TPCs based on solvent extraction yielded a significant result (p-value = 0.0065), with the post hoc Dunn test revealing that hexane, acetone, and dichloromethane are in the same group, while methanol is in its own group due to its lower TPC (Figure 6A). This agrees with the chemical profiling of the samples, in which most of the variance in the spectral data is attributable to the extraction solvent. The remaining comparisons (by species and season) did not yield statistically significant differences (p-value > 0.05), as shown in Supplementary Table S8. Furthermore, these comparisons were plotted and visualized as boxplots with compact display letters from the Dunn test in Supplementary Figures S7–S11.
In the TEAC analysis, the three comparisons (species, seasons, and solvent) showed no significant differences (p-values > 0.05). As we discussed before, the methanolic extract contained salts that impeded the expected high antioxidant activity and phenolic content observed in methanol extracts [55]. In our case, we exclude these methanolic extracts from further analysis of biological activity.
We continued the analysis of the antioxidant (TEAC) and Total Phenolic Content (TPC) and correlated them with the IR band dataset. Figure 6B illustrates how TPC, expressed as GAE, correlates with antioxidant activity across the IR peaks associated with the previously discussed C–H (1377.8, 2852.2, and 2920.6 cm−1), C–O (1017.2, 1067.4 cm−1, and 1214 cm−1), and C=O (1709.5 and 1730.8 cm−1) functional groups. A correlation plot visualizing the Spearman correlation values is in Supplementary Figure S12. Furthermore, the TPC showed a strong positive correlation (r > 0.7, p < 0.01) with several, whereas TEAC showed no significant correlation with the IR peak at 1730.8 cm−1, corresponding to the carbonyl band of acetate. Although phenolic compounds have been detected in Caulerpa species, they are usually not esterified, suggesting that extracts with higher phenolic content also contain more esterified compounds, mainly of lipid origin [63].
Applying correlation analysis to fast, affordable ATR-FTIR spectral data and biological activity data can be a promising approach to identify which regions or molecules are present in such extracts. That could be particularly useful for dereplication or quality control, as it would allow us to detect samples with residual solvent in their spectra. This is more important to consider when implementing in the context of biological activity testing of extracts rather than in a chemical purification workflow, as residual solvent could affect the biological assay results.

4. Conclusions

In this study, ATR-FTIR spectroscopy proved useful for rapid chemical screening. Although ATR-FTIR effectively distinguished extraction conditions, its ability to resolve subtle biological variation among Caulerpa species was comparatively limited. The chemometric analysis showed that ATR-FTIR spectra can, with moderate performance, predict the solvent of origin of the extract. In comparison, spectral variation due to factors such as month or species is minimal. The main obstacle was that methanolic extracts from Caulerpa exhibited high hygroscopicity and salt content, thereby attenuating organic absorption bands. Therefore, we recommend proceeding with caution when assessing the biological activities of methanolic extracts, as their composition may contain excessive amounts of inorganic salts.
We recommend washing with distilled water before the drying step to ensure low salt content in extracts or fractions. Meanwhile, the lower-polarity extracts displayed a similar IR band pattern; however, the hexane fractions were statistically distinct from the acetone and dichloromethane fractions. Unsupervised analysis also detected other unexpected differences: species extracts from C. verticillata clustered together. In contrast, extracts from other species shared a similar chemical profile, and the solvent was a determining factor in IR absorption.
Importantly, the strong correlation between antioxidant activity and IR bands, such as the 1730.8 cm−1, highlights the potential of ATR-FTIR to identify functional groups associated with bioactive metabolites. Because antioxidant compounds help reduce oxidative stress and support human health, the ability to link specific spectral features to antioxidant potential enhances the value of ATR-FTIR as a preliminary screening tool. However, resolving subtle biochemical differences among extracts will require high-resolution analytical techniques to complement FTIR-based characterization.

Supplementary Materials

The following supporting information can be downloaded at https://www.mdpi.com/article/10.3390/phycology6020061/s1. Figure S1: Visualization of the stacked spectra before averaging replicates; Figure S2: Outlier detection for the removal of atypical samples before averaging replicates; Figure S3: The 3D plot version of the PCA shows an enhanced separation of the methanol fraction group from the other solvent fractions; Figure S4: HCA in the IR band dataset showing two clear clusters based on the extraction solvent; Figure S5: Optimal number of clusters according to the consensus of the 30 indexes from the NbClust algorithm; Figure S6: VIPs for the PLS-DA model from the full-spectrum dataset; Figure S7: Boxplot for the TEAC by species with Dunn’s compact display letters; Figure S8: Boxplot for the TEAC by season with Dunn’s compact display letters; Figure S9: Boxplot for the TEAC by solvent with Dunn’s compact display letters; Figure S10: Boxplot for the TPC by species with Dunn’s compact display letters; Figure S11: Boxplot for the TPC by season with Dunn’s compact display letters; Figure S12: Plot for the correlation matrix of the Spearman correlation analysis; Table S1: Quantity of dry algae biomass used in each extraction; Table S2: Presence and abundance of Caulerpa in Dzilam de Bravo, Yucatan; Table S3: Results of the Levene and Shapiro-Wilk tests for the IR band dataset; Table S4: Pairwise PERMANOVA results for the full-spectrum and IR band datasets; Table S5: Confusion matrix metrics (CCM) for the Five model in both datasets; Table S6: CCM for each solvent for the five models of the full spectrum dataset; Table S7: CCM for each solvent for the five models of the IR band dataset; Table S8: Kruskal–Wallis and Dunn tests on the TEAC and TPC of Caulerpa extracts.

Author Contributions

Conceptualization, P.V.-G. and E.H.-N.; methodology, E.H.-N., H.A.P.P., J.E.O.-M., and L.A.R.-E.; software, H.A.P.P.; validation, H.A.P.P.; formal analysis, P.V.-G. and H.A.P.P.; investigation, P.V.-G. and H.A.P.P.; resources, L.A.R.-E., W.S.G.-G., and R.Y.U.-C.; data curation, P.V.-G. and H.A.P.P.; writing—original draft preparation, P.V.-G. and H.A.P.P.; writing—review and editing, H.A.P.P. and E.H.-N.; visualization, H.A.P.P.; supervision, L.A.R.-E., W.S.G.-G., and E.H.-N.; project administration, E.H.-N.; funding acquisition, E.H.-N. All authors have read and agreed to the published version of the manuscript.

Funding

This research received no external funding.

Institutional Review Board Statement

Not applicable.

Informed Consent Statement

Not applicable.

Data Availability Statement

The raw ATR-FTIR CSV files will be shared via Zenodo as CSV files at 10.5281/zenodo.19867716 after publication, along with the corresponding R script for preprocessing and processing the data. Further data can be made available on reasonable request.

Acknowledgments

Part of this work was developed in the facilities of the National Laboratory of Nano Biomaterials (LANNBIO) of CINVESTAV Unidad Mérida. H.A.P.P. is grateful for its SECIHTI Postdoctoral stay in Mexico fellowship (application #2840957).

Conflicts of Interest

The authors declare no conflicts of interest.

Abbreviations

The following abbreviations are used in this manuscript:
ATR-FTIRAttenuated Total Reflectance Fourier Transform Infrared Spectroscopy
CLDCompact Letter Display
CSVComma-Separated Values
DCMDichloromethane
DFDegrees of Freedom
FTIRFourier Transform Infrared Spectroscopy
GAEGallic Acid Equivalents
HCAHierarchical Cluster Analysis
IQRInterquartile Range
IRInfrared
LC-MSLiquid Chromatography–Mass Spectrometry
MCCMatthew Correlation Coefficient
NMRNuclear Magnetic Resonance
OAOrganic Acids
PCAPrincipal Component Analysis
PCPrincipal Component
PERMANOVAPermutational Multivariate Analysis of Variance
PLS-DAPartial Least Squares Discriminant Analysis
RFRandom Forest
RTRoom Temperature
SVMSupport Vector Machine
TETrolox Equivalents
TEACTrolox Equivalent Antioxidant Capacity
TPCTotal Phenolic Content
UPLCUltra-Performance Liquid Chromatography
SPSulfate Polysaccharide

References

  1. Claridge, T.D.W. High-Resolution NMR Techniques in Organic Chemistry, 3rd ed.; Elsevier: Amsterdam, The Netherlands, 2016; ISBN 9780080999937. [Google Scholar]
  2. Dettmer, K.; Aronov, P.A.; Hammock, B.D. Mass Spectrometry-Based Metabolomics. Mass Spectrom. Rev. 2007, 26, 51–78. [Google Scholar] [CrossRef]
  3. Wolfender, J.L.; Marti, G.; Thomas, A.; Bertrand, S. Current Approaches and Challenges for the Metabolite Profiling of Complex Natural Extracts. J. Chromatogr. A 2015, 1382, 136–164. [Google Scholar] [CrossRef]
  4. Harborne, J.B. Phytochemical Methods: A Guide to Modern Techniques of Plant Analysis; Chapman and Hall: London, UK, 1998; ISBN 9780412572609. [Google Scholar]
  5. Sarker, S.D.; Nahar, L. An Introduction to Natural Products Isolation. Methods Mol. Biol. 2012, 864, 1–25. [Google Scholar] [CrossRef]
  6. Dai, J.; Mumper, R.J. Plant Phenolics: Extraction, Analysis and Their Antioxidant and Anticancer Properties. Molecules 2010, 15, 7313–7352. [Google Scholar] [CrossRef]
  7. Kase, A.G.O.; Calumpong, H.; Rupidara, A. Secondary Metabolites of Some Varieties of Caulerpa Species. IOP Conf. Ser. Mater. Sci. Eng. 2020, 823, 012041. [Google Scholar] [CrossRef]
  8. Robledo, D.; Freile Pelegrín, Y. Chemical and Mineral Composition of Six Potentially Edible Seaweed Species of Yucatan. Bot. Mar. 1997, 40, 301–306. [Google Scholar] [CrossRef]
  9. Ortegón-Aznar, I.; Rosado-Espinosa, L.A.; Aguilar-Perera, A. Occurrence of the Introduced Alga Caulerpa Ollivieri Dostál, 1929 (Caulerpaceae, Chlorophyta) in the Southern Gulf of Mexico. Bioinvasions Rec. 2015, 4, 17–21. [Google Scholar] [CrossRef]
  10. Holdt, S.L.; Kraan, S. Bioactive Compounds in Seaweed: Functional Food Applications and Legislation. J. Appl. Phycol. 2011, 23, 543–597. [Google Scholar] [CrossRef]
  11. Hao, H.; Fu, M.; Yan, R.; He, B.; Li, M.; Liu, Q.; Cai, Y.; Zhang, X.; Huang, R. Chemical Composition and Immunostimulatory Properties of Green Alga Caulerpa Racemosa Var Peltata. Food Agric. Immunol. 2019, 30, 937–954. [Google Scholar] [CrossRef]
  12. Darah, I.; Tong, W.Y.; Nor-Afifah, S.; Nurul-Aili, Z.; Lim, S.H. Antimicrobial Effects of Caulerpa Sertularioides Extract on Foodborne Diarrhea-Caused Bacteria. Eur. Rev. Med. Pharmacol. Sci. 2014, 18, 171–178. [Google Scholar]
  13. Tanna, B.; Choudhary, B.; Mishra, A. Metabolite Profiling, Antioxidant, Scavenging and Anti-Proliferative Activities of Selected Tropical Green Seaweeds Reveal the Nutraceutical Potential of Caulerpa spp. Algal Res. 2018, 36, 96–105. [Google Scholar] [CrossRef]
  14. Wirawan, I.G.P.; Dewi, N.K.E.S.; Sasadara, M.M.V.; Sunyamurthi, I.G.N.A.; Jawi, I.M.; Wijaya, I.N.; Darmawati, I.A.P.; Suada, I.K.; Krisnandika, A.A.K. Phytochemical Analysis and Molecular Identification of Green Macroalgae Caulerpa Spp. from Bali, Indonesia. Molecules 2022, 27, 4879. [Google Scholar] [CrossRef]
  15. Domínguez, S.C.; Valdez, M.C.; Ramos, F.R.; Pérez-Gil, F.; Rodríguez, I.S. Algas Marinas de Baja California Sur, México: Valor Nutrimental. Arch. Latinoam. Nutr. 2002, 52, 400–405. [Google Scholar]
  16. Osuna-Ruiz, I.; Nieves-Soto, M.; Manzano-Sarabia, M.M.; Hernández-Garibay, E.; Lizardi-Mendoza, J.; Burgos-Hernández, A.; Hurtado-Oliva, M.Á. Gross Chemical Composition, Fatty Acids, Sterols, and Pigments in Tropical Seaweed Species off Sinaloa, Mexico. Cienc. Mar. 2019, 45, 101–120. [Google Scholar] [CrossRef]
  17. Espinoza-Avalos, J.; Aguilar-Rosas, L.E.; Aguilar-Rosas, R.; Gómez-Poot, J.M.; Raigoza-Figueras, R. Presencia de Caulerpaceae (Chlorophyta) En La Península de Yucatán, México. Bot. Sci. 2015, 93, 845–854. [Google Scholar] [CrossRef]
  18. Freile-Pelegŕn, Y.; Morales, J.L. Antibacterial Activity in Marine Algae from the Coast of Yucatan, Mexico. Bot. Mar. 2004, 47, 140–146. [Google Scholar] [CrossRef]
  19. Premarathna, A.D.; Tuvikene, R.; Fernando, P.H.P.; Adhikari, R.; Perera, M.C.N.; Ranahewa, T.H.; Howlader, M.M.; Wangchuk, P.; Jayasooriya, A.P.; Rajapakse, R.P.V.J. Comparative Analysis of Proximate Compositions, Mineral and Functional Chemical Groups of 15 Different Seaweed Species. Sci. Rep. 2022, 12, 19610. [Google Scholar] [CrossRef]
  20. Robledo, D.; Freile-Pelegrín, Y. Seasonal Variation in Photosynthesis and Biochemical Composition of Caulerpa spp. (Bryopsidales, Chlorophyta) from the Gulf of Mexico. Phycologia 2005, 44, 312–319. [Google Scholar] [CrossRef]
  21. Manandhar, B.; Kim, H.J.; Rhyu, D.Y. Caulerpa Okamurae Extract Attenuates Inflammatory Interaction, Regulates Glucose Metabolism and Increases Insulin Sensitivity in 3T3-L1 Adipocytes and RAW 264.7 Macrophages. J. Integr. Med. 2020, 18, 253–264. [Google Scholar] [CrossRef]
  22. Arenajo, A.R.; Ybañez, A.P.; Ababan, M.M.P.; Villajuan, C.E.; Lasam, M.R.M.; Young, C.P.; Reyes, J.L.A. The Potential Anticoagulant Property of Caulerpa Lentillifera Crude Extract. Int. J. Health Sci. 2017, 11, 29–32. [Google Scholar]
  23. Yang, P.; Liu, D.Q.; Liang, T.J.; Li, J.; Zhang, H.Y.; Liu, A.H.; Guo, Y.W.; Mao, S.C. Bioactive Constituents from the Green Alga Caulerpa Racemosa. Bioorg. Med. Chem. 2015, 23, 38–45. [Google Scholar] [CrossRef]
  24. Paul, V.J.; Littler, M.M.; Littler, D.S.; Fenical, W. Evidence for Chemical Defense in Tropical Green Alga Caulerpa Ashmeadii (Caulerpaceae: Chlorophyta): Isolation of New Bioactive Sesquiterpenoids. J. Chem. Ecol. 1987, 13, 1171–1185. [Google Scholar] [CrossRef]
  25. Siddique, I. Exploring Functional Groups and Molecular Structures: A Comprehensive Analysis Using FTIR Spectroscopy. SSRN Electron. J. 2024, 2024, 70–76. [Google Scholar] [CrossRef]
  26. Rafi, M.; Aziz, Z.; Purmasari, D.; Karomah, A.H. Combination of FTIR-Based Fingerprinting and Chemometrics Analysis for Discrimination of Tithonia Diversifolia Leaves Extracts and Correlation with α-Glucosidase Inhibitory Activity. Maj. Obat Tradis. 2025, 30, 44–52. [Google Scholar] [CrossRef]
  27. Rafi, M.; Tohib, D.A.; Saputra, A.; Aziz, Z.; Karomah, A.H. FTIR-Fingerprinting Spectra Combined with Chemometrics Analysis for Distinguishing Strobilanthes Phyllostachya Leaves Extracts and Correlation with Their Antioxidant Activity. Hayati 2025, 32, 1584–1591. [Google Scholar] [CrossRef]
  28. Derksen, G.C.H.; Blommaert, L.; Bastiaens, L.; Hasşerbetçi, C.; Fremouw, R.; van Groenigen, J.; Twijnstra, R.H.; Timmermans, K.R. ATR-FTIR Spectroscopy Combined with Multivariate Analysis as a Rapid Tool to Infer the Biochemical Composition of Ulva Laetevirens (Chlorophyta). Front. Mar. Sci. 2023, 10, 1154461. [Google Scholar] [CrossRef]
  29. Peniche-Pavía, H.A.; Tzuc-Naveda, J.D.; Rosado-Espinosa, L.A.; Collí-Dulá, R.C. FTIR-ATR Chemometric Analysis on Pelagic Sargassum Reveals Chemical Composition Changes Induced by Cold Sample Transportation and Sunlight Radiation. J. Appl. Phycol. 2024, 36, 1391–1405. [Google Scholar] [CrossRef]
  30. Serondo, H.U.; El Amri, H.; El Kazzouli, S.; El Brahmi, N. ATR-FTIR Spectroscopic Fingerprinting of Moroccan Cannabis Sativa L. Extracts Prepared by Ultrasound-Assisted Method: Chemometric Analysis and in Vitro Anti-Inflammatory Activities. Eur. Food Res. Technol. 2025, 251, 4787–4799. [Google Scholar] [CrossRef]
  31. Altemimi, A.; Lakhssassi, N.; Baharlouei, A.; Watson, D.G.; Lightfoot, D.A. Phytochemicals: Extraction, Isolation, and Identification of Bioactive Compounds from Plant Extracts. Plants 2017, 6, 42. [Google Scholar] [CrossRef]
  32. Posit Software. RStudio: Integrated Development Environment for R; Posit Software: Boston, MA, USA, 2026. [Google Scholar]
  33. The R Core Team. R: A Language and Environment for Statistical Computing, version 4.5.2; R Foundation for Statistical Computing: Vienna, Austria, 2025. Available online: https://www.R-project.org/ (accessed on 2 February 2026).
  34. Hanson, B.A. ChemoSpec: Exploratory Chemometrics for Spectroscopy. R Package Version 6.1.3. Available online: https://cran.r-project.org/web/packages/ChemoSpec/index.html (accessed on 2 February 2026). [CrossRef]
  35. Peniche-Pavía, H.A.; Rosado-Espinosa, L.A.; Collí-Dulá, R.C. Comparative 1H NMR Metabolomics Analysis of Fresh Pelagic Sargassum Reveals Biochemical Changes Caused by under Cryogenic and Non-Cryogenic Sample Transportations. Reg. Stud. Mar. Sci. 2025, 81, 103955. [Google Scholar] [CrossRef]
  36. Beirnaert, C.; Meysman, P.; Vu, T.N.; Hermans, N.; Apers, S.; Pieters, L.; Covaci, A.; Laukens, K. Speaq 2.0: A Complete Workflow for High-Throughput 1D NMR Spectra Processing and Quantification. PLoS Comput. Biol. 2018, 14, e1006018. [Google Scholar] [CrossRef]
  37. Wilson, A.; Norden, N. The R Project for Statistical Computing. Available online: https://developer.r-project.org/ (accessed on 2 February 2026).
  38. Wickham, H.; François, R.; Henry, L.; Müller, K.; Vaughan, D. A Grammar of Data Manipulation • Dplyr. Dplyr.Tidyverse. 2025. Available online: https://cran.r-project.org/web/packages/dplyr/index.html (accessed on 2 February 2026). [CrossRef]
  39. Fox, J.; Weisberg, S. An R Companion to Applied Regression; SAGE: Newcastle, UK, 2018; ISBN 9781544336466. [Google Scholar]
  40. Ogle, D.H.; Doll, J.C.; Wheeler, A.P.; Dinno, A. FSA: Simple Fisheries Stock Assessment Methods; CRAN: Contributed Packages 2015. Available online: https://cran.r-project.org/web/packages/FSA/index.html (accessed on 2 February 2026).
  41. Graves, S.; Piepho, H.-P.; Selzer, P.; Dorai-Raj, S. MultcompView: Visualizations of Paired Comparisons. R Package Version 0.1-8. 2023. Available online: https://cran.r-project.org/web/packages/multcompView/index.html (accessed on 2 February 2026). [CrossRef]
  42. Wickham, H. Ggplot2. Available online: http://link.springer.com/10.1007/978-3-319-24277-4 (accessed on 2 February 2026).
  43. Arbizu, P.M. PairwiseAdonis: Pairwise Multilevel Comparison Using Adonis. R Package Version 0.4.1. 2017. Available online: https://rdrr.io/github/gauravsk/ranacapa/man/pairwise_adonis.html (accessed on 2 February 2026).
  44. Oksanen, J.; Simpson, G.L.; Blanchet, F.G.; Kindt, R.; Legendre, P.; Minchin, P.R.; O’Hara, R.B.; Solymos, P.; Stevens, M.H.H.; Szoecs, E.; et al. Vegan: Community Ecology Package 2001. Available online: https://cran.r-project.org/web/packages/vegan/index.html (accessed on 2 February 2026).
  45. Kassambara, A.; Mundt, F. Factoextra: Extract and Visualize the Results of Multivariate Data Analyses. R Package Version 1.0.7. 2020. Available online: https://CRAN.R-project.org/package=factoextra (accessed on 2 February 2026).
  46. Charrad, M.; Ghazzali, N.; Boiteau, V.; Niknafs, A. NbClust: An R Package for Determining the Relevant Number of Clusters in a Data Set. J. Stat. Softw. 2014, 61, 1–36. [Google Scholar] [CrossRef]
  47. Kuhn, M. Building Predictive Models in R Using the Caret Package. J. Stat. Softw. 2008, 28, 1–26. [Google Scholar] [CrossRef]
  48. Pang, Z.; Lu, Y.; Zhou, G.; Hui, F.; Xu, L.; Viau, C.; Spigelman, A.F.; MacDonald, P.E.; Wishart, D.S.; Li, S.; et al. MetaboAnalyst 6.0: Towards a Unified Platform for Metabolomics Data Processing, Analysis and Interpretation. Nucleic Acids Res. 2024, 52, W398–W406. [Google Scholar] [CrossRef]
  49. Soler-Jiménez, L.C.; Peniche-Pavía, H.A.; Vázquez-Martínez, J.; Hernández-Nuñez, E.; Hernández-Mena, D.; Mancilla-Tapia, J.M.; Granja-Pérez, P.; Vidal-Martínez, V.M. Solid-Phase Microextraction of Sweat Components of Patients Positive for Sars-Cov-2 for Identification of Possible Biomarkers. Sci. Rep. 2025, 15, 35680. [Google Scholar] [CrossRef]
  50. Singleton, V.L.; Orthofer, R.; Lamuela-Raventós, R.M. Analysis of Total Phenols and Other Oxidation Substrates and Antioxidants by Means of Folin-Ciocalteu Reagent. Methods Enzymol. 1999, 299, 152–178. [Google Scholar] [CrossRef]
  51. Fadjare Frempong, T.; Owusu Boadi, N.; Badu, M. Optimization of Extraction Conditions for Polyphenols from the Stem Bark of Funtumia elastica (Funtum) Utilizing Response Surface Methodology. AAS Open Res. 2021, 4, 46. [Google Scholar] [CrossRef]
  52. Torres, P.; Osaki, S.; Silveira, E.; dos Santos, D.Y.A.C.; Chow, F. Comprehensive Evaluation of Folin-Ciocalteu Assay for Total Phenolic Quantification in Algae (Chlorophyta, Phaeophyceae, and Rhodophyta). Algal Res. 2024, 80, 103503. [Google Scholar] [CrossRef]
  53. Cruz-Hernández, M.; Cuervo-Osorio, V.D.; Cabal-Prieto, A.; Herrera, L.A.C.; Guerrero-Ortiz, C.A.; Uribe-Cuauhtzihua, F.; Hernandez-Arzaba, J.C.; Ramírez-Rivera, E.d.J.; Oney-Montalvo, J.E. Determination of the Antioxidant Activity of Capsaicinoids and Polyphenols Extracted from Wild Chili Pepper. Hortic. Bras. 2025, 43, e291946. [Google Scholar] [CrossRef]
  54. Re, R.; Pellegrini, N.; Proteggente, A.; Pannala, A.; Yang, M.; Rice-Evans, C. Antioxidant Activity Applying an Improved ABTS Radical Cation Decolorization Assay. Free Radic. Biol. Med. 1999, 26, 1231–1237. [Google Scholar] [CrossRef]
  55. Airanthi, M.K.W.A.; Hosokawa, M.; Miyashita, K. Comparative Antioxidant Activity of Edible Japanese Brown Seaweeds. J. Food Sci. 2011, 76, C104–C111. [Google Scholar] [CrossRef]
  56. Harrell, F.E., Jr.; Dupont, C. Harrell Miscellaneous. R Package “Hmisc”. Version 5.1-0. CRAN: Contributed Packages 2023, 1–487. Available online: https://cran.r-project.org/web/packages/Hmisc/index.html (accessed on 2 February 2026).
  57. Wei, A.T. Visualization of a Correlation Matrix: Package ‘Corrplot’. CRAN: Contributed Packages 2015. Available online: https://cran.r-project.org/web/packages/corrplot/index.html (accessed on 2 February 2026). [CrossRef]
  58. Pérez-Estrada, C.J.; Rodríguez-Estrella, R.; Palacios-Salgado, D.S.; Paz-García, D.A. Initial Spread of the Invasive Green Alga Caulerpa Verticillata over Coral Reef Communities in the Gulf of California. Coral Reefs 2013, 32, 865. [Google Scholar] [CrossRef][Green Version]
  59. Gazali, M.; Nurjanah; Zamani, N.P.; Zuriat; Suriani, M.; Alfitrah, R.; Syafitri, R.; Hanum, Z.; Zurba, N.; Febrina, C.D.; et al. Antioxidant Activity of Green Seaweed Caulerpa Racemosa (Försskal) J. Agardh from Balai Island Water, Aceh. IOP Conf. Ser. Earth Environ. Sci. 2022, 1033, 012052. [Google Scholar] [CrossRef]
  60. Shurvell, H.F. Spectra– Structure Correlations in the Mid- and Far-Infrared. In Handbook of Vibrational Spectroscopy; Chalmers, J.M., Ed.; Wiley: Hoboken, NJ, USA, 2001. [Google Scholar]
  61. Dumancas, G.G.; Carreto, N.; Generalao, O.; Ke, G.; Bello, G.; Lubguban, A.; Malaluan, R. Chemometrics for Quantitative Determination of Terpenes Using Attenuated Total Reflectance–Fourier Transform Infrared Spectroscopy: A Pedagogical Laboratory Exercise for Undergraduate Instrumental Analysis Students. J. Chem. Educ. 2023, 100, 3050–3060. [Google Scholar] [CrossRef]
  62. Handley, J.T.; Blackman, A.J. Monocyclic Diterpenes from the Marine Alga Caulerpa Trifaria (Chlorophyta). Aust. J. Chem. 2000, 53, 67–71. [Google Scholar] [CrossRef]
  63. Rushdi, M.I.; Abdel-Rahman, I.A.M.; Attia, E.Z.; Abdelraheem, W.M.; Saber, H.; Madkour, H.A.; Amin, E.; Hassan, H.M.; Abdelmohsen, U.R. A Review on the Diversity, Chemical and Pharmacological Potential of the Green Algae Genus Caulerpa. S. Afr. J. Bot. 2020, 132, 226–241. [Google Scholar] [CrossRef]
  64. Kasmiati, K.; Syahrul, S.; Badraeni, B.; Rahmi, M.H. Proximate and Mineral Compositions of the Green Seaweeds Caulerpa Lentilifera and Caulerpa Racemosa from South Sulawesi Coast, Indonesia. In Proceedings of the IOP Conference Series: Earth and Environmental Science; IOP Publishing: London, UK, 2022; Volume 1119, p. 012049. [Google Scholar]
  65. Tesvichian, S.; Sangtanoo, P.; Srimongkol, P.; Saisavoey, T.; Buakeaw, A.; Puthong, S.; Thitiprasert, S.; Mekboonsonglarp, W.; Liangsakul, J.; Sopon, A.; et al. Sulfated Polysaccharides from Caulerpa Lentillifera: Optimizing the Process of Extraction, Structural Characteristics, Antioxidant Capabilities, and Anti-Glycation Properties. Heliyon 2024, 10, e24444. [Google Scholar] [CrossRef]
  66. Silverstein, R.M.; Webster, F.X.; Kiemle, D.J.; Bryce, D.L. Infrared Spectroscopy. In Spectrometric Identification of Organic Compounds; Wiley: Hoboken, NJ, USA, 2007; pp. 71–125. ISBN 07/24/20142:4. [Google Scholar]
  67. Fréda Zamanileha, E.; Tantely Mitantsoa, J.; Frienduc Vaonalamihanta, P.; Rija Razafintsalama, A.; Arimalala Andrianony, F.; Hervé Ravelonandro, P. Various Approaches to Fourier-Transform Infrared Spectroscopy (FTIR) for Bioanalytical and Biotechnological Applications in Marine Algae. In Recent Advances in Infrared Spectroscopy and Its Applications in Biotechnology; IntechOpen: London, UK, 2024; Available online: https://www.intechopen.com/chapters/1197231 (accessed on 2 February 2026).
  68. Krimm, S.; Bandekar, J. Vibrational Spectroscopy and Conformation of Peptides, Polypeptides, and Proteins. In Advances in Protein Chemistry; Anfinsen, C.B., John, T.E., Frederic, M.R., Eds.; Academic Press: Cambridge, MA, USA, 1986; Volume 38, pp. 181–364. ISBN 9780120342389. [Google Scholar]
  69. Jin, Z.; Cui, W.; Zhang, F.; Wang, F.; Cheng, S.; Fu, Y.; Huang, A. Rapid Identification for the Pterocarpus Bracelet by Three-Step Infrared Spectrum Method. Molecules 2022, 27, 4793. [Google Scholar] [CrossRef]
  70. Jackson, M.; Choo, L.-P.; Watson, P.H.; Halliday, W.C.; Mantsch, H.H. Beware of Connective Tissue Proteins: Assignment and Implications of Collagen Absorptions in Infrared Spectra of Human Tissues. Biochim. Biophys. Acta (BBA)—Mol. Basis Dis. 1995, 1270, 1–6. [Google Scholar] [CrossRef]
  71. Ibrahim, M.; Nada, A.; Kamal, D.E. Density Functional Theory and FTIR Spectroscopic Study of Carboxyl Group. Indian J. Pure Appl. Phys. 2005, 43, 911–917. [Google Scholar]
  72. Abubakar, A.R.; Haque, M. Preparation of Medicinal Plants: Basic Extraction and Fractionation Procedures for Experimental Purposes. J. Pharm. Bioallied Sci. 2020, 12, 1–10. [Google Scholar] [CrossRef]
  73. McHugh, M.L. Lessons in Biostatistics Interrater Reliability: The Kappa Statistic. Biochem. Medica 2012, 22, 276–282. [Google Scholar] [CrossRef]
  74. Tamura, J.; Itaya, Y.; Hayashi, K.; Yamamoto, K. Statistical Inference of the Matthews Correlation Coefficient for Multiclass Classification. arXiv 2026, arXiv:2503.06450. [Google Scholar] [CrossRef]
  75. Chicco, D.; Tötsch, N.; Jurman, G. The Matthews Correlation Coefficient (Mcc) Is More Reliable than Balanced Accuracy, Bookmaker Informedness, and Markedness in Two-Class Confusion Matrix Evaluation. BioData Min. 2021, 14, 13. [Google Scholar] [CrossRef]
Figure 1. Absorbance variation among Caulerpa extracts based on the solvents used to extract them. The spectra are visualized using the mean absorbance of the solvent groups, with red corresponding to acetone extracts, blue to dichloromethane, green to hexane, and methanol to purple. The main IR bands detected are annotated. Methanol resulted in the most distinct of the four extracts.
Phycology 06 00061 g001
Figure 2. Principal component analysis biplot on the FT-IR band dataset and analysis of variance in the full-spectrum dataset. The solvents used for extraction have the following colors: acetone is red, dichloromethane is blue, hexane is green, and methanol is purple. In (A), the main IR bands and loadings appear as vectors, while the solvent appears as symbols according to the species. The Kruskal–Wallis results are plotted in the lower section of (B), using the negative log base10 of the p-value from the solvent factor.
Phycology 06 00061 g002
Figure 3. Unsupervised K-means clustering algorithm showing four clusters based on chemical similarity reflected in the IR spectra. The solvent used for extraction is the most critical factor driving variation in the data. In (A), orange Cluster 1 has most of its members as extracts of C. verticillata; purple Cluster 2 contains only methanolic extracts; blue Cluster 3 has a higher percentage of hexane extracts; and green Cluster is made mainly of dichloromethane and acetone extracts. In (B), the mean absorbance spectra of both clusters are plotted, and the first spectrum from the bottom is the negative log base 10 of the p-value from an analysis of variance. The spectra omit the 1800–2800 cm−1 due to limited information in that spectral region.
Phycology 06 00061 g003
Figure 4. Visual comparison between Confusion Metrics per Classification Models and the Dataset. Red tones indicate higher metric values, whereas blue tones indicate lower values. The evaluated metrics included Accuracy, Cohen’s Kappa, Matthews Correlation Coefficient (MCC), Mean F1-score, and Mean Precision. Among the full-spectrum models, PLS-DA and SVM with a linear kernel showed the first- and second-best overall performance, whereas SVM with a linear kernel achieved the best results on the IR band dataset.
Phycology 06 00061 g004
Figure 5. 3D score plot of the PLS-DA model in the training data from the full spectrum dataset.
Phycology 06 00061 g005
Figure 6. Boxplot showing the IQR of total phenolic content in the organic extracts, along with the correlation between the IR band and TPC and TEAC values. The TPC is expressed in gallic acid equivalents (µg GAE. mg−1), while the antioxidant activity is expressed in the Trolox equivalent (µg TE. mg−1). The boxplots in (A) show differences in total phenolic content across solvents, with methanol exhibiting the lowest TPC value among the fractions. (B) is the correlogram of the IR peaks, TPC, and TEAC. TPC values correlate with IR peaks corresponding to C–H, C–O, and C=O bonds. Different lowercase letters (a, b) in the boxplots indicate statistically significant differences between solvent extracts (p < 0.05), according to post hoc multiple comparison tests. Symbols denote levels of statistical significance in the correlations: * p < 0.05, ** p < 0.01, and *** p < 0.001.
Phycology 06 00061 g006
Table 1. Annual mean yields per solvent and species.
SpeciesSolvent FractionAnnual Mean Yield (±SD)
C. proliferaHexane2.72 ± 0.82
Dichloromethane3.51 ± 1.63
Acetone1.12 ± 0.39
Methanol13.13 ± 3.61
C. ashmeadiiHexane2.28 ± 0.93
Dichloromethane3.24 ± 1.91
Acetone0.77 ± 0.04
Methanol13.43 ± 9.74
C. cupressoidesHexane2.27 ± 1.16
Dichloromethane2.26 ± 1.24
Acetone2.12 ± 2.60
Methanol11.47 ± 5.66
C. paspaloidesHexane2.26 ± 0.75
Dichloromethane2.32 ± 0.26
Acetone0.75 ± 0.33
Methanol15.61 ± 4.10
C. verticillataHexane2.47 ± 1.05
Dichloromethane5.01 ± 2.88
Acetone1.65 ± 0.83
Methanol19.22 ± 9.89
Table 3. Results of the PERMANOVA test in the full-spectrum and IR Band datasets.
DatasetFactorDFSum of SquaresR2Fp-Value
Solvent34451.9350.616376.1080.0001
Full-spectrumMonth6286.8550.03972.4520.0117
Species4246.4980.03413.1610.0051
Residual1142222.8030.308
Solvent338.05710.427636.1030.0001
IR bandsMonth65.760410.06472.7320.0019
Species44.7460.05333.3770.0009
Residual12789.0011.000
Table 4. Confusion Matrix Metrics for the Best Model in each Dataset.
DatasetModelSolventSensitivitySpecificityF1MCC
Full-
spectrum
PLS-DAAcetone0.6670.8890.6670.556
DCM0.6670.9630.750.689
Hexane0.7780.8520.70.592
Methanol1111
IR BandsSVM
Linear
Acetone0.8890.7780.6960.592
DCM0.7780.8890.7370.645
Hexane0.5560.9260.6250.527
Methanol0.55610.7140.696
Note: solvents highlighted in bold had the best predictive performance.
Table 5. Results of the TEAC and TPC of selected Caulerpa extracts.
SpeciesSolventSeasonTEAC
(µg TE. mg−1)
TPC (µg GAE. mg−1)
C. ashmeadiiAcetoneDry3.3711.05
Rainy4.5916.38
Cold front9.7222.9
DCMDry3.2116.32
Rainy4.413.6
Cold front4.9430.89
HexaneDry3.6234.75
Rainy19.486.92
Cold front34.8316.46
MethanolDry2.046.66
Rainy3.155.38
Cold front1.35.4
C. proliferaAcetoneRainy3.2127.11
Cold front5.6219.84
DCMDry0.4914.06
Rainy0.6610.36
Cold front4.3124.51
HexaneDry2.2814.47
Cold front1.1416.98
MethanolDry7.057.59
Rainy1.945.94
Cold front6.013.43
Season classification depends on the month of collection: April is in the dry season; August is part of the rainy season; January is in the cold front season.
Disclaimer/Publisher’s Note: The statements, opinions and data contained in all publications are solely those of the individual author(s) and contributor(s) and not of MDPI and/or the editor(s). MDPI and/or the editor(s) disclaim responsibility for any injury to people or property resulting from any ideas, methods, instructions or products referred to in the content.