Article

Biophotolysis vs. Anaerobic Digestion—An Experimental Comparison of Two Pathways for Biohydrogen Production by Tetraselmis subcordiformis

by
Marcin Dębowski
1,*,
Marta Kisielewska
1,
Joanna Kazimierowicz
2 and
Marcin Zieliński
1
1
Department of Environment Engineering, Faculty of Geoengineering, University of Warmia and Mazury in Olsztyn, Str. Oczapowskiego 5, 10-719 Olsztyn, Poland
2
Department of Water Supply and Sewage Systems, Faculty of Civil Engineering and Environmental Sciences, Bialystok University of Technology, 15-351 Bialystok, Poland
*
Author to whom correspondence should be addressed.
Phycology 2025, 5(4), 74; https://doi.org/10.3390/phycology5040074
Submission received: 24 September 2025 / Revised: 10 November 2025 / Accepted: 13 November 2025 / Published: 13 November 2025

Abstract

Biohydrogen is considered to be one of the fuels of the future, so there is a justified need to find efficient and cost-effective technologies for its production. This study evaluated the efficiency of two biohydrogen production pathways, specifically biophotolysis and dark fermentation, using Tetraselmis subcordiformis biomass. Microalgae production was performed in three variants, where the separation criterion was the type of culture medium: a control sample (synthetic medium; V1–PCR), agricultural wastewater from hydroponic tomato cultivation (V2–SL-WW), and effluent from a microbial fuel cell (V3–MFC-WW). The highest increase in biomass of T. subcordiformis was obtained in V2–SL-WW—2730 ± 212 mg VS/L, which was also associated with the maximum chlorophyll a content (65.0 ± 5.1 mg Chl-a/L). In biophotolysis, the highest specific hydrogen yields were obtained in V1–PCR (55.3 ± 4.3 mL/g VS) and V2 (54.3 ± 3.7 mL/g VS). The total hydrogen production in these variants was 166 ± 13 mL (V1–PCR) and 163 ± 11 mL (V2–SL-WW), respectively. The average H2 production rate reached 4.70 ± 0.33 mL/h in V2–SL-WW, and the rate constant (k) was 0.030–0.031 h−1. In anaerobic fermentation, the highest total and specific H2 production was obtained in V1–PCR, 453 ± 31 mL and 45.3 ± 3.1 mL/g VS, respectively. The qualitative composition of the biogas confirmed a high hydrogen content: 61.4% (biophotolysis, V1) and 41.1% (dark fermentation, V2–SL-WW). The results obtained confirm that T. subcordiformis can be effectively cultivated on waste media and that the biohydrogen production maintains a high technological efficiency through both photolytic and fermentative mechanisms. The medium from hydroponic tomato cultivation (V2–SL-WW) proved to be particularly promising, as it combines high biomass productivity with a satisfactory biohydrogen production profile.

1. Introduction

Today’s energy transition challenges science and industry to develop clean, renewable, and efficient energy technologies. In this context, molecular hydrogen (H2) is considered one of the most promising energy vectors for the future [1], due to its high calorific value (142 MJ/kg), suitability for fuel cells, and zero CO2 emissions during combustion [2]. Moreover, H2 can serve as a storage medium for intermittent renewable electricity and as an energy carrier in off-grid areas [3]. The global push for decarbonisation, coupled with rising energy demand, has increased interest in so-called green H2—produced directly from renewable sources and environmentally friendly substrates [4]. One of the most developed methods is water electrolysis powered by photovoltaic or wind energy, where electricity splits water into oxygen and H2. Research efforts focus on improving the efficiency and durability of electrolysers, optimising materials, and scaling up prototypes [2]. Biological production methods are also gaining attention, including anaerobic digestion of organic waste (e.g., manure, food industry leachate) and biophotolysis by microalgae and cyanobacteria, which utilise solar energy to decompose water or organic matter [5,6,7]. Green hydrogen can additionally be generated in microbial fuel cells, where specialised bacterial consortia degrade organic compounds in wastewater, producing H2 as a by-product [8]. All these technologies integrate energy generation with pollutant recycling, aligning with the principles of a circular economy [9].
Furthermore, integrating H2 production with renewable energy sources, such as solar and wind power, provides significant sustainability and efficiency benefits. This approach enables the utilisation of surplus renewable energy, minimises waste, and improves the overall economics of the technology [9]. H2 also functions as an energy storage medium, helping to balance fluctuations in renewable energy supply and ensuring grid stability [10]. Additionally, it promotes energy self-sufficiency through the use of local renewable resources, supports decentralised energy systems, and fosters the development of innovative renewable energy and hydrogen technologies, aligning with long-term climate goals [11].
Among the available biological methods, biophotolysis and dark fermentation are of particular interest [12]. In biophotolysis, photosynthetic microorganisms utilise light energy to decompose water and produce H2, either through direct biophotolysis (green algae) or indirect biophotolysis (cyanobacteria) [4]. In direct biophotolysis, water molecules are split into oxygen and hydrogen ions during photosynthesis. These hydrogen ions are subsequently converted into H2 gas by the enzyme hydrogenase, which is sensitive to increasing oxygen concentrations [13]. However, under high light intensity, up to 90% of photons captured by the photosynthetic apparatus (chlorophyll and other pigments) are dissipated as heat or fluorescence rather than being used for photosynthesis, reducing the H2 production rate [14]. To address this limitation, strategies include controlling pigment composition to reduce chlorophyll content, engineering microalgal mutants, modifying hydrogenases for increased oxygen tolerance, or regulating the O2 concentration in the cultivation environment [4]. In indirect biophotolysis, H2 is produced by both hydrogenase and nitrogenase enzymes, with production rates comparable to hydrogenase-driven green algae systems [15]. Biophotolytic H2 production is considered an economical and sustainable approach, utilising water as a renewable resource and consuming CO2 as an air pollutant. Nevertheless, its main limitations include low production efficiency (2.5–13 mL/L·h), the need for extensive active surfaces to capture light, and the absence of waste recycling within the production cycle [16].
Dark fermentation is a biological method of H2 production in which microorganisms break down complex organic compounds into simpler molecules while simultaneously producing hydrogen. This process is characterised by relatively high efficiency (1000–1500 mL H2/L·h), technological simplicity, and the ability to utilise a wide range of organic wastes as feedstock [6]. The method produces gaseous H2 along with volatile fatty acids (acetic, propionic, butyric, and lactic acids), which, after separation, can be used for industrial purposes or as precursors in biomethanation for biogas production [17]. Two-stage anaerobic fermentation, where acidogenesis and methanogenesis occur in separate reactors, offers enhanced hydrogen and methane yields and a higher degree of waste biodegradation [18]. Theoretically, during acidogenesis, one-third of the carbon in glucose is converted into CO2 and H2, while the remaining two-thirds form volatile fatty acids [19]. Hydrogen formation is favoured by acetic and butyric acid production, with glucose conversion to acetic acid yielding the highest theoretical H2 output of 4 mol H2/mol glucose, and conversion to butyric acid yielding 2 mol H2/mol glucose [6]. In mixed bacterial cultures inhabiting anaerobic sludge, a typical butyric-to-acetic acid ratio of 3:2 results in an average theoretical H2 yield of 2.5 mol H2/mol glucose [17]. Biohydrogen production in dark fermentation is strongly influenced by operational parameters, such as hydraulic retention time (HRT), pH, and organic loading rate (OLR) [6]. Selecting suitable feedstock, considering both chemical composition and cost, remains a key challenge and a critical criterion for sustainable and economically viable biohydrogen production [20].
In this context, microalgae, particularly Tetraselmis subcordiformis, represent a highly promising organic substrate for biohydrogen production [21,22]. This species exhibits remarkable tolerance and resistance to harsh and fluctuating environmental conditions, including high salinity, variable pH, and the presence of toxic organic and nutrient compounds [23]. T. subcordiformis can grow both autotrophically and mixotrophically, and its biomass contains substantial amounts of carbohydrates and lipids, key compounds for fermentation and photoassimilation processes [24]. Importantly, microalgae can be cultivated on waste media, such as industrial or agricultural wastewater, which significantly reduces operating costs and enhances the overall sustainability of the technology [25]. However, comparative studies on the efficiency of different biohydrogen production pathways using T. subcordiformis, particularly under alternative growth media, remain limited. Understanding the influence of biomass quality, composition, and properties on the kinetics and efficiency of these biohydrogen production pathways is therefore essential.
The aim of this study was to conduct a comparative analysis of two biological hydrogen production processes, specifically biophotolysis and dark fermentation, using T. subcordiformis biomass, with microalgae cultivated in three different media: a synthetic medium (control), wastewater from hydroponic tomato cultivation, and effluent from an anaerobic microbial fuel cell chamber. The study evaluated the efficiency of nutrient removal, the growth rate, and final biomass yield of T. subcordiformis, the chemical composition of the microalgae, the overall biohydrogen production efficiency, and the key kinetic parameters of the analysed processes.

2. Materials and Methods

2.1. Organisation of the Experiment

The experimental work was divided into four research stages. Stage 1 (S1) focused on the cultivation of T. subcordiformis biomass. Stage 2 (S2) addressed the physicochemical characterisation of the obtained microalgal biomass. Stage 3 (S3) involved hydrogen production via biophotolysis, while Stage 4 (S4) examined hydrogen production from T. subcordiformis biomass under dark, anaerobic fermentation conditions. Each stage included experimental variants (V) defined by the type of culture medium used. Variant 1 (V1–PCR) employed a medium of pure chemical reagents (PCR) as the control. Variant 2 (V2–SL-WW) used wastewater from a soilless (hydroponic) tomato cultivation system (SL-WW) for operating the photobioreactors (PBRs). Variant 3 (V3–MFC-WW) assessed the potential of dairy wastewater from anaerobic fermentation in the anode chamber of a microbial fuel cell (MFC-WW). Upon completion of all experimental stages, a comparative analysis of technological performance was conducted to evaluate the application potential of each variant.

2.2. Materials

2.2.1. T. subcordiformis Biomass

The photoautotrophic microalgae strain T. subcordiformis (SAG 161-1a) used in the experiments was obtained from the Algae Culture Collection at the University of Göttingen, Germany, which is internationally referred to as SAG [26]. For the purpose of the experiment, the first phase focused on the propagation of the cells and the development of the population in order to obtain sufficient biomass for further experimental work. The first phase of algae cultivation was carried out in sterile glass tubes with a working volume of 50 mL (Biospace, Poznań, Poland). The biomass of T. subcordiformis was then transferred to 1.0 L glass bioreactors (Duran Bottle System, Mainz, Germany). All laboratory glassware used was previously pasteurised in an autoclave (Model 2840 EL-D, Tuttnauer, Hauppauge, NY, USA) at 121 °C for 15 min.

2.2.2. Pure Chemical Medium (V1—PCR)

As described by Guan et al. [27], the composition of the synthetic medium used in variant V1 included the following compounds (calculated as concentration in solution): NaNO3—100.00 mg/L, NaH2PO4—20.00 mg/L, H3BO3—33.60 mg/L, FeCl3—1.30 mg/L, MnCl2—0.36 mg/L, CuSO4—0.20 mg/L, ZnCl2—0.21 mg/L, CoCl2—0.20 mg/L, (NH4)4Mo7O24—0.09 mg/L and EDTA—45.00 mg/L. The medium was also enriched with vitamins: thiamine (VB1) at 1.00 μg/L and cobalamin (VB12) at 0.10 μg/L. The salinity of the medium was kept in the range of 30–33 ppt, while the pH was stabilised in the range of 8.00–8.20. The physicochemical parameters of the wastewater used in the study are listed in Table 1.

2.2.3. Wastewater from Soilless Tomato Cultivation (V2—SLW-W)

The wastewater was obtained from a specialised industrial tomato producer. The greenhouse covers an area of 15 hectares and is equipped with automated microclimate control systems, regulating sunlight, humidity, temperature, and irrigation. Fertiliser solutions were prepared using water from a dedicated underground well. Tomatoes were cultivated on mineral wool mats and fertilised with Fertilon NK and Fertilon MPK (Grupa Azoty SA, Tarnów, Poland). The basic physicochemical parameters of the wastewater are presented in Table 1.

2.2.4. Microbial Fuel Cell Wastewater Medium (V3—MFC-WW)

In Variant 3 (V3), effluent from the anaerobic anode chamber of a dual-chamber microbial fuel cell (MFC) with a working volume of 1.0 litre and complete mixing was used as the culture medium. The chamber was fed with synthetic dairy wastewater, and anaerobic microflora developed on the surface of a carbon fibre electrode (Inkarbo, Kraków, Poland). The process was conducted at a temperature range of 20–22 °C. A detailed description of the construction and operation of the MFC was provided in a previous publication by the authors [28]. The basic physicochemical properties of the wastewater subjected to initial biodegradation in the MFC anode chamber are summarised in Table 1.

2.2.5. Micronutrient Supplementation

To ensure adequate availability of micronutrients and trace elements for the cultures of T. subcordiformis in V2 and V3, the medium was supplemented with the commercial preparation MikroPlus (Intermag, Olkusz, Poland) at a rate of 0.1 mL/L. This preparation was used at the beginning of each culture cycle. The composition included: 22.3 g/L iron (Fe) as EDTA chelate; 9.5 g/L manganese (Mn-EDTA); 3.5 g/L zinc (Zn-EDTA); 1.2 g/L copper (Cu-EDTA); 0.6 g/L molybdenum in ammonium form; and 2.3 g/L boron as boric acid.

2.2.6. Composition of the Biohydrogen Production Medium

The medium used in the biohydrogen production stage (S3) was prepared on the basis of deionised water with the addition of appropriately selected inorganic salts in each of the test variants investigated. Its composition comprised the following components (in mg/L): 27.23 NaCl, 5.079 MgCl2, 1.123 CaCl2, 0.667 KCl, 0.196 NaHCO3, 0.098 H3BO3, 0.098 KBr, 0.024 SrCl2, 0.003 NaF and 0.002 CuCl2. The pH value of this medium was stabilised in the range of 7.90–8.00. The chemical composition was based on data from the literature and previous experience of the research team [29,30].

2.2.7. Anaerobic Sludge Inoculum

The anaerobic sludge inoculum used for dark hydrogen fermentation was obtained from a closed digester with a capacity of 7300 m3 at the wastewater treatment plant in Białystok, Poland (53.16903° N, 23.08705° E). Anaerobic digestion at this plant occurs under mesophilic conditions (37 ± 2 °C), with a hydraulic retention time (HRT) of 21 ± 1 days and an organic loading rate (OLR) of approximately 2.0 kg VS/m3·d. Prior to use as inoculum in the experimental anaerobic reactors, the sludge underwent thermal treatment (heat shock), in which the sample was heated to 100 °C and maintained at this temperature for 60 min. This procedure was intended to deactivate methanogenic archaea and selectively enrich microflora suited for the acidogenic (hydrogen-producing) stage of anaerobic fermentation [31,32]. The physicochemical characteristics of the anaerobic sludge inoculum used were as follows: total solids (TS) 3.9 ± 0.2%, volatile solids (VS): 60.1 ± 3.7% TS, mineral solids (MS): 39.9 ± 4.0% TS, total carbon (TC): 368 ± 36 mg/g TS, total organic carbon (TOC): 309 ± 20 mg/g TS, total nitrogen (TN): 33.0 ± 2.6 mg/g TS, C/N ratio: 9.6 ± 0.4, total phosphorus (TP): 2.3 ± 0.2 mg/g TS, pH value: 7.16 ± 0.11, protein: 20.6 ± 1.8% TS, fats: 2.2 ± 0.2% TS, sugar: 3.1 ± 0.8% TS.

2.3. Experimental Sites and Research Procedures

2.3.1. Photobioreactors for T. subcordiformis Biomass Cultivation

The T. subcordiformis was cultivated in 50 L photobioreactors (PBRs) (InterSonic, Olsztyn, Poland). Column-shaped PBRs with a vertical orientation were used for the experiments (Figure 1). The columns with a diameter of 20 cm were made of transparent acrylic glass and equipped with a gas inlet valve at the bottom of the reactor. A lid with integrated valves for the gas outlet and recirculation was fitted at the top. Mixing and CO2 supply in the PBR were achieved by injecting air enriched with 2% CO2 (v/v) at a flow rate of 500 L/h using Hailea V-10 pumps (Hailea Group, Chaozhou, China) (Figure 1). The PBR was illuminated with LEDs (Leddy Slim, Aquael, Warsaw, Poland). The light colour, expressed as colour temperature, was 8000 K (for blue and red LEDs) and 6500 K (for white LEDs). The irradiance was in the range of 500 ± 50 µmol/m2·s, i.e., in the range of photosynthetically active radiation (PAR), which was measured on the inner wall of the photobioreactor using an HD 2101.2 photoradiometer with a PAR sensor (Delta OHM, Caselle di Selvazzano, Italy). Illumination was provided with a 14 h light/10 h dark cycle (14/10 h), which provided sufficient time for energy accumulation during photosynthesis. The temperature in the reactors was controlled and kept in the range of 25 ± 2 °C. For all experimental variants, the initial concentration of T. subcordiformis biomass in the VT-PBR was 50 mg VS/L.

2.3.2. Respirometer for Measuring Biohydrogen Production

During H2 production based on biophotolysis (S3) [33] and dark fermentation (S4) [34], respirometric bioreactors with a working volume of 1.0 L (OxiTop®-IDS, WTW, Weilheim, Germany) were used. The bioreactors consisted of sealed tanks equipped with a measuring system that recorded the changes in the partial pressure of the gas generated in the chamber. Regardless of the experimental stage, the basis for calculating the amount of H2 produced was the ideal gas Equation (1):
n = (p·V)/(R·T)
where n is the number of moles of gas [mol], p is the gas pressure [Pa] recorded in respirometers depending on the variant, V is the volume of the gas phase [mL], R is the universal gas constant [8.314 J/mol K], and T is the temperature [°C].
Avogadro’s law was used to calculate the gas volume (H2), which assumes that under standard conditions, which are described by a temperature of 273 K and a pressure of 1013 hPa, one mole of gas occupies 22.4 L (2):
V = n·Vmol
where V is the volume of the gas [L], n is the number of moles of the gas [mol], and Vmol is the molar volume of the gas [22.4 L]. The volume was then converted into mL/g of the biomass used (fresh mass-FM, solids-TS, volatiles-VS). The H2 production rate (r) and rate constants (k) were calculated using an iterative non-linear regression method [35].

2.3.3. Biophotolysis-Based Hydrogen Production

In each of the tested experimental variants, the biomass of T. subcordiformis was transferred to respirometric bioreactors with a working volume of 1.0 L (OxiTop®-IDS, WTW, Weilheim, Germany) after gravity sedimentation. The biomass of T. subcordiformis was further incubated at 25 ± 1 °C. During the experiment, the contents of each reactor were stirred with magnetic stirrers at 60 rpm. The gas phase pressure was measured every 10 h, and the values obtained were converted to the volumetric hydrogen yield under standard conditions using the ideal gas law. The initial biomass concentration w was kept at 3.0 g VS/L. The total measurement time was 120 h, of which 30 h were in the dark phase and 90 h in the light phase. The lighting was provided by fluorescent lamps (Philips Lighting MASTER TL-D Super 80, Philips Lighting, Eindhoven, The Netherlands) with an output of 58 W and a colour temperature corresponding to daylight (6500 K).

2.3.4. Dark Anaerobic Fermentation—Hydrogen Production (S4)

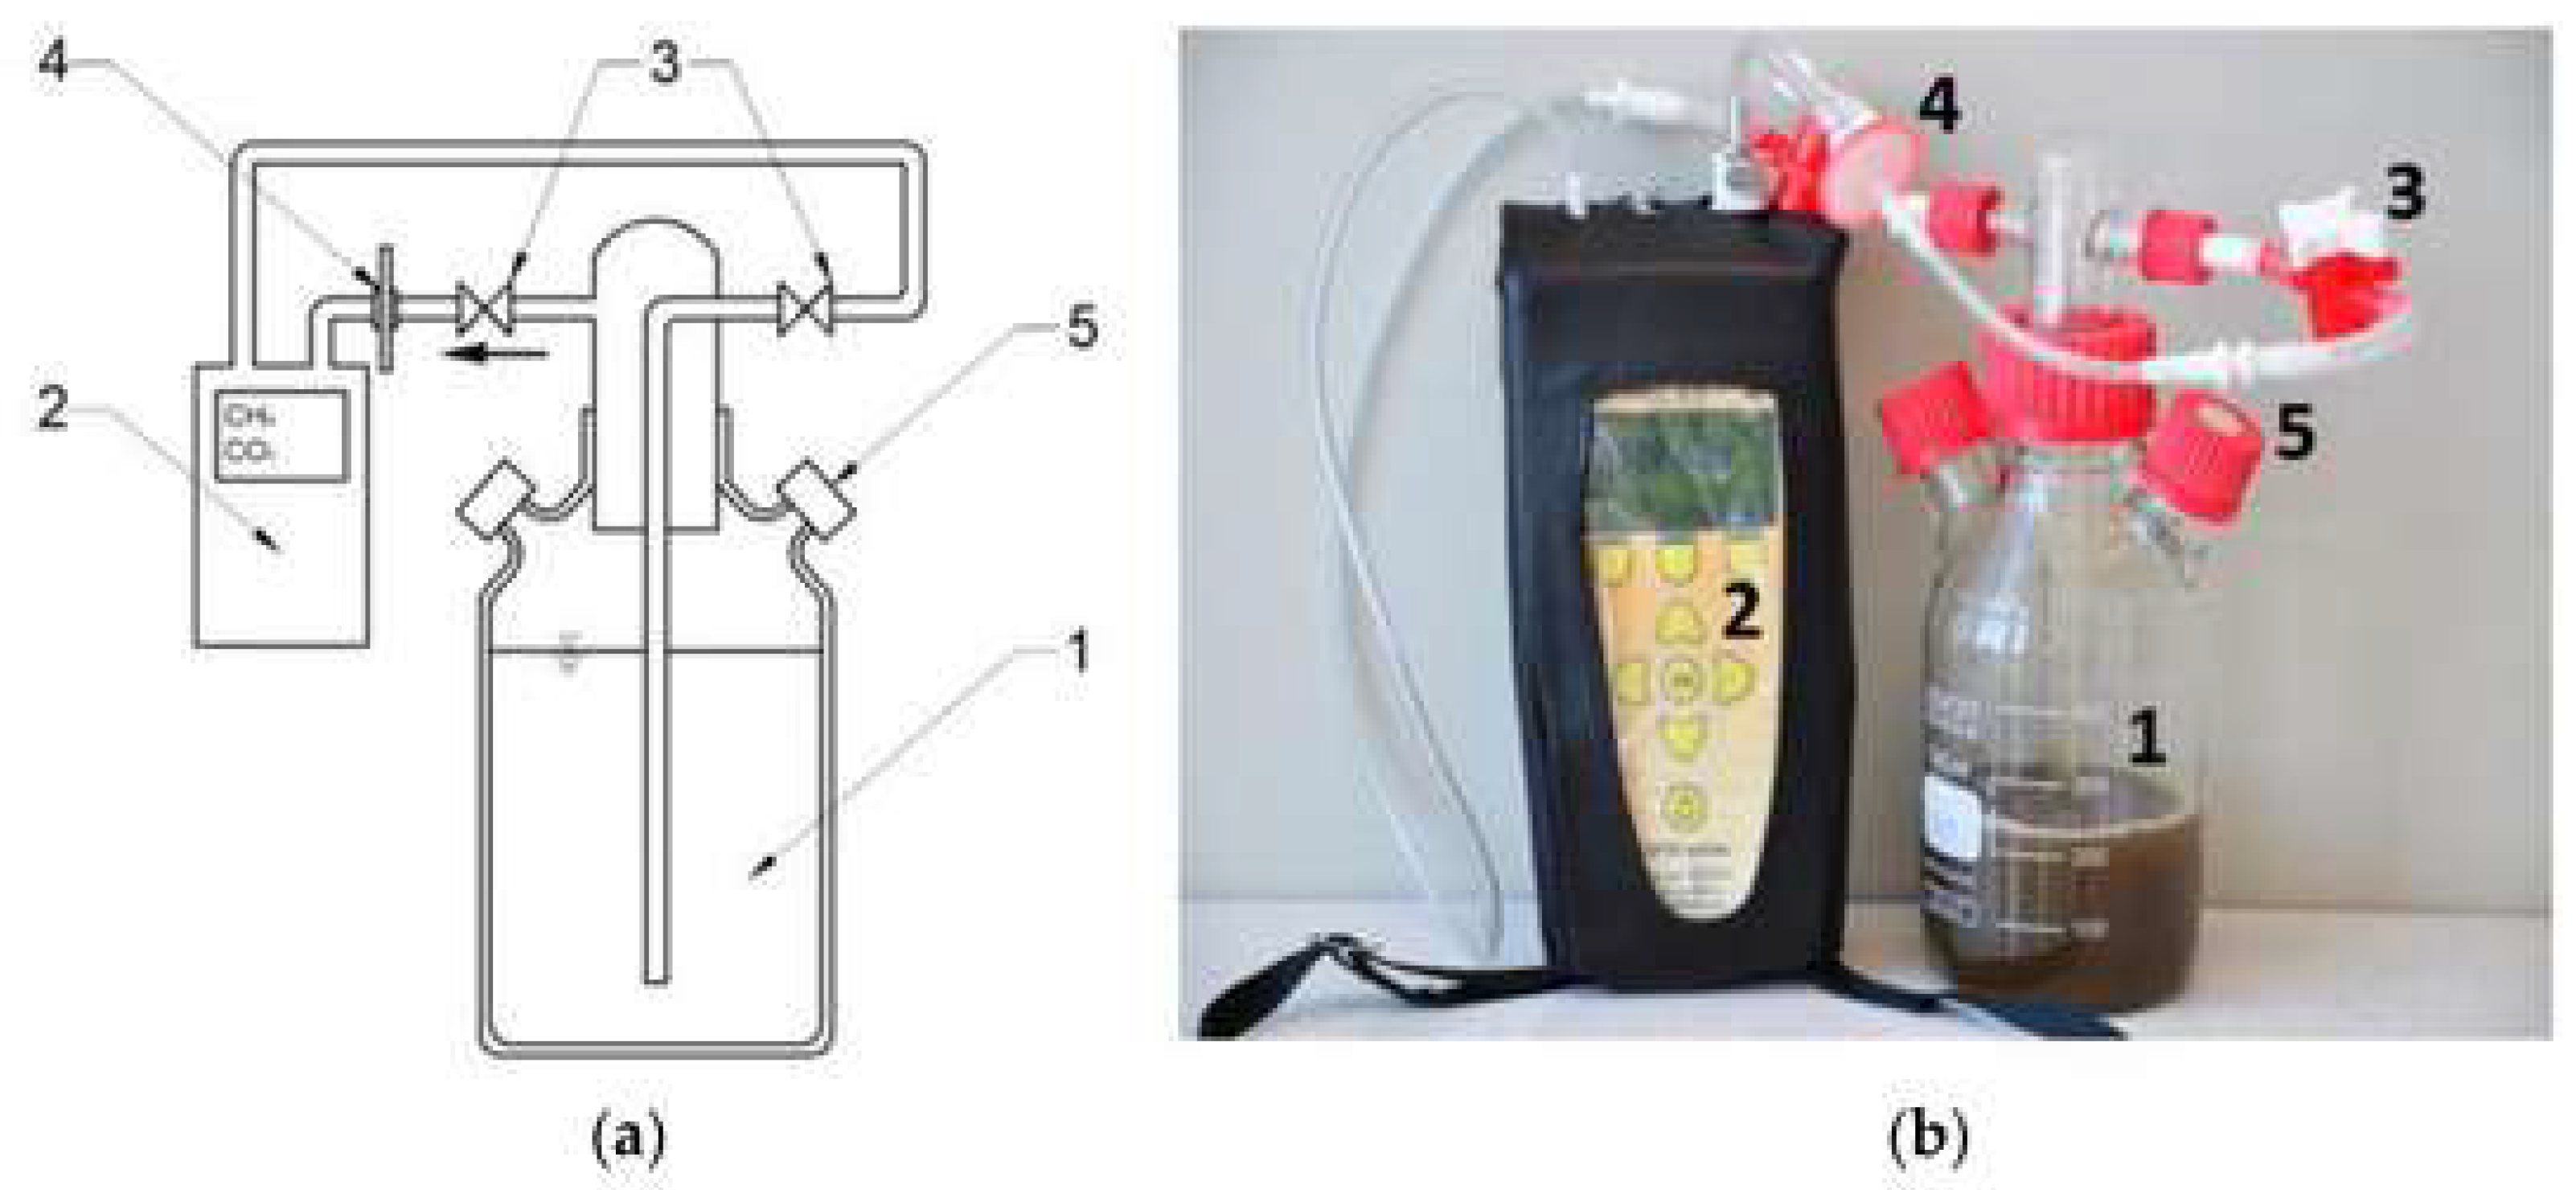
Hydrogen fermentation of T. subcordiformis biomass in each experimental scenario was conducted under mesophilic conditions (38 ± 0.5 °C). At the beginning of the experimental cycle, respirometers with an active volume of 200 mL were inoculated with the prepared anaerobic sludge. Microalgal biomass was then added to achieve an initial organic load of 10.0 g VS/L, and the samples were flushed with nitrogen to ensure anaerobic conditions. The hydraulic retention time of the anaerobic sludge and organic substrate mixture was 20 days. Measurements were considered complete when the difference between three consecutive daily biogas readings did not exceed 1%. The bioreactors were stirred at 60 rpm using magnetic stirrers. To enable simultaneous monitoring of biogas volume and qualitative composition, an additional set of bioreactors was employed (Figure 2). These bioreactors featured a closed system in which the produced biogas was recirculated into the fermentation chamber, allowing continuous measurement of biogas composition. The measurement system consisted of the fermentation chamber, pipe connections, valves, a biogas dryer, and an analyser. Additionally, the respirometers were equipped with rubber-sealed sampling ports to enable leak-proof collection for chromatographic analyses.

2.3.5. Methods of Analysis

Samples for the determination of volatile solids (VS) and chlorophyll a (chl-a) were taken at 48 h intervals. The VS analysis was performed gravimetrically by burning the biomass sample at 550 °C in a muffle furnace (model LAC L, Dąbrowica, Poland) and then weighing the remaining ash (DanLab AX423 analytical balance, Białystok, Poland). The chlorophyll a content was determined by fluorescence analysis using the Algae Online Analyser (bbe Moldaenke, Schwentinental, Germany). The taxonomy of the microalgae was determined microscopically using an MF 346 biological microscope equipped with an Optech 3MP digital camera (Eduko, Warsaw, Poland). The basic physico-chemical parameters of the culture medium were determined spectrophotometrically using a DR 5000 UV/VIS device (Hach Lange, Düsseldorf, Germany). Salinity was measured using a Marine Control Digital device (Aqua Medic, Janików, Poland), and pH values were determined using a 1000 L laboratory metre (VWR International, Radnor, PA, USA). The light intensity was measured with a HI 97500 Luxmeter (Hanna Instruments, Woonsocket, RI, USA). Dried biomass samples (105 °C, 24 h) were analysed for total carbon (TC), total organic carbon (TOC), and total nitrogen (TN) using a Flash 2000 elemental analyser (Thermo Scientific, Delft, The Netherlands). Protein content was calculated using a nitrogen to protein conversion factor of 6.25. The carbohydrate content was determined spectrophotometrically at 600 nm using the Anthron method with glucose as standard (DR 2800, Hach-Lange GmbH, Düsseldorf, Germany). The lipid content in the dried biomass was determined by Soxhlet extraction using hexane as solvent (Büchi, Flawil, Switzerland), and the results were expressed as a percentage of the dry weight. Prior to extraction, samples were sonicated for 30 s using a UP400S processor (Hielscher Ultrasonics, Teltow, Germany) at an amplitude of 100%. Gas samples (CO2, O2, H2) were collected from qualitative respirometers using gas-tight syringes and analysed chromatographically using an Agilent 7890 A GC (Agilent Technologies, Santa Clara, CA, USA). The hydrogen production rate (r) and reaction rate constants (k) were calculated using non-linear regression with an iterative algorithm.

2.3.6. Statistical Analysis

All experiments were performed in quadruplicate. Statistical data were processed in Statistica 13.3 (StatSoft Inc., Tulsa, OK, USA). Normality of data distribution was tested using the Shapiro–Wilk test, and differences between means were assessed using one-way analysis of variance (ANOVA). The homogeneity of variance was tested using the Levene test, and comparisons between the groups were carried out using the HSD test (Honest Significant Difference). A significance level of α = 0.05 was used for the statistical analyses.

3. Results and Discussion

3.1. Efficiency of Nutrient Utilisation

The analysis of the results demonstrated a significant impact of culture medium composition on the growth of T. subcordiformis and the efficiency of nutrient uptake. Variations in the initial concentrations of organic compounds (COD, BOD5) and nutrients (TN, TP, N-NH4+, P-PO43−) among the experimental treatments directly affected the dynamics of microalgal biomass production. In most cases, these differences were statistically significant (p ≤ 0.05). The results are presented in Table 2.
The initial COD concentration was 9.6 ± 1.0 mg/L (V1–PCR), 20.9 ± 4.7 mg O2/L (V2–SL-WW), and 246 ± 9.3 mg O2/L (V3–MFC-WW). At the end of the cultivation cycle, these values decreased to 7.7 ± 0.6 mg O2/L, 9.9 ± 0.4 mg O2/L, and 178 ± 4.3 mg O2/L, respectively, which corresponded to a removal efficiency of 19.8 ± 1.1% in V1–PCR, 52.3 ± 1.4% in V2–SL-WW, and 27.4 ± 1.1% in V3–MFC-WW (Table 2). Similar ratios were observed for biological oxygen demand (BOD5), which was initially 3.1 ± 0.3 mg O2/L (V1–PCR), 13.4 ± 2.2 mg O2/L (V2–SL-WW) and 167 ± 6.9 mg O2/L (V3–MFC-WW), and 2.6 ± 0.3 mg O2/L, 5.2 ± 0.2 mg O2/L and 110 ± 2.1 mg O2/L, respectively, after the cultivation process. The highest absolute utilisation of organic compounds by the growing population of T. subcordiformis was observed in V3–MFC-WW, while the highest removal efficiency of these substances was observed in V2–SL-WW, 61.2 ± 2.1% for BOD5 and 52.3 ± 1.4% for COD, respectively (Table 2). These results confirm that a moderate organic load provides optimal conditions for microalgal growth and mixotrophic activity [36]. In the study by Sorgatto et al. [37], COD and BOD removal efficiencies in Haematococcus lacustris (formerly Haematococcus pluvialis) mixotrophic culture were 60.80 ± 0.34% and 88.32 ± 0.69%, respectively, while in Ettlia oleoabundans (formerly Neochloris oleoabundans) culture, they reached 69.16 ± 0.60% and 90.56 ± 0.39%, indicating high efficiency in utilising organic carbon as an energy source and substrate for microalgal cell growth. Cultivation of Auxenochlorella pyrenoidosa (formerly Chlorella pyrenoidosa) in soybean processing wastewater achieved dissolved COD removal in the range of 70.3 ± 11.4–89.1 ± 0.6% [38]. The efficiency of COD removal from pork wastewater during mixotrophic growth of A. pyrenoidosa was 55.4% at an initial COD concentration of 1000 mg/L [39]. When a microalgal consortium was cultivated in dairy wastewater, with a Chlorella vulgaris to Tetraselmis chuii ratio of 3:1, COD removal efficiency exceeded 60% [40]. A high COD removal efficiency of 89.5 ± 3.68% from municipal wastewater was also reported by Goswami et al. [41] for Tetraselmis indica BDUG001 at an initial organic matter concentration of 46 mg/L. Comparison of Scenedesmus sp. DDVG I growth in mixotrophic and heterotrophic modes demonstrated higher COD removal efficiency (75.6%) in the mixotrophic culture [42].
The highest total nitrogen (TN) removal efficiency of 96.9 ± 1.0% was observed in V1–PCR, where the initial concentration decreased from 20.4 ± 1.3 mg/L to 0.61 ± 0.11 mg/L. V2–SL-WW exhibited a 61.4 ± 0.9% reduction in TN concentration, from 165.1 ± 22.3 mg/L to 63.7 ± 3.9 mg/L. In contrast, V3–MFC-WW achieved a TN utilisation efficiency of 43.4 ± 2.2% (Table 2). The high removal efficiency at low initial concentrations likely resulted from increased TN uptake by microalgae under nutrient-deficient conditions. This observation is supported by Hongyang et al. [38], who reported rapid nitrogen uptake and utilisation (88.8 ± 1.0%) in a mixotrophic C. pyrenoidosa culture. Considering the molecular formula of the algae (C106H263O110N16P) [43], the researchers calculated that, at a biomass production rate of 0.64 g/L·d, the expected average TN removal rate would be 40.32 mg/L·d. Experimentally, they obtained an average TN removal rate of 42.84 mg/L·d, reflecting the high nitrogen demand of microalgae during growth. However, decreased nitrogen fixation efficiency in nitrogen-rich environments may indicate regulatory mechanisms that protect cells from excessive accumulation. Microalgae preferentially assimilate nitrogen in the ammonium form rather than nitrate [44]. Nevertheless, excess ammonium can have a repressive effect, and ammonia tolerance varies among algal species, ranging from 25 μmol N-NH4+/L to 1000 μmol N-NH4+/L [45].
In the present study, the removal efficiency of N-NH4+, whose initial concentration ranged from 6.8 ± 1.2 mg/L (V1–PCR) to 134 ± 11.6 mg/L (V3–MFC-WW), was reflected in final values ranging from 0.12 ± 0.03 mg/L (V1–PCR) to 41.4 ± 1.9 mg/L (V3–MFC-WW). The highest N-NH4+ removal efficiency was observed in V1–PCR, reaching 98.4 ± 0.4% (Table 2). Similarly high ammonium and total nitrogen removal rates of 78.3% and 82.8%, respectively, were reported by Wang et al. [46] for C. vulgaris cultured in municipal wastewater. Liu et al. [47] achieved an N-NH4+ removal efficiency of 97.5% using a microalgal–bacterial consortium. Amit et al. [48] observed a 78.96% reduction in ammonium nitrogen in dairy wastewater using T. indica. The highest removal efficiency for total phosphorus (TP) and P-PO43− was also recorded in V1–PCR, reaching 96.8 ± 0.3% and 93.0 ± 0.2%, respectively, with final concentrations of 0.27 ± 0.09 mg TP/L and 0.51 ± 0.13 mg P-PO43−/L (Table 2). Significantly lower efficiencies (p ≤ 0.05) were obtained in V2–SL-WW and V3–MFC-WW, confirming enhanced nutrient uptake under resource-limited conditions. Microalgae have been shown to increase phosphorus uptake following a period of phosphorus deficiency when phosphorus is reintroduced into the medium or when cells are exposed to phosphorus-abundant conditions [49]. Phosphorus assimilation by microalgae is linked to biomass growth and the structure of cellular organic components, such as phospholipids, as well as phosphorus storage processes [50]. Phosphorus content in microalgal cells is typically around 1%; exceeding this value can enhance phosphorus removal and storage in the form of polyphosphate granules [51]. During the growth of T. suecica in fishery effluent-based medium, Michels et al. [52] achieved 99% phosphorus removal, with over 90% of dissolved PO43− removed within 7 days [53]. Amit et al. [54] reported a 60.93% phosphorus removal efficiency using T. indica to treat domestic wastewater containing approximately 9.57 mg/L phosphorus.

3.2. T. subcordiformis Biomass Growth

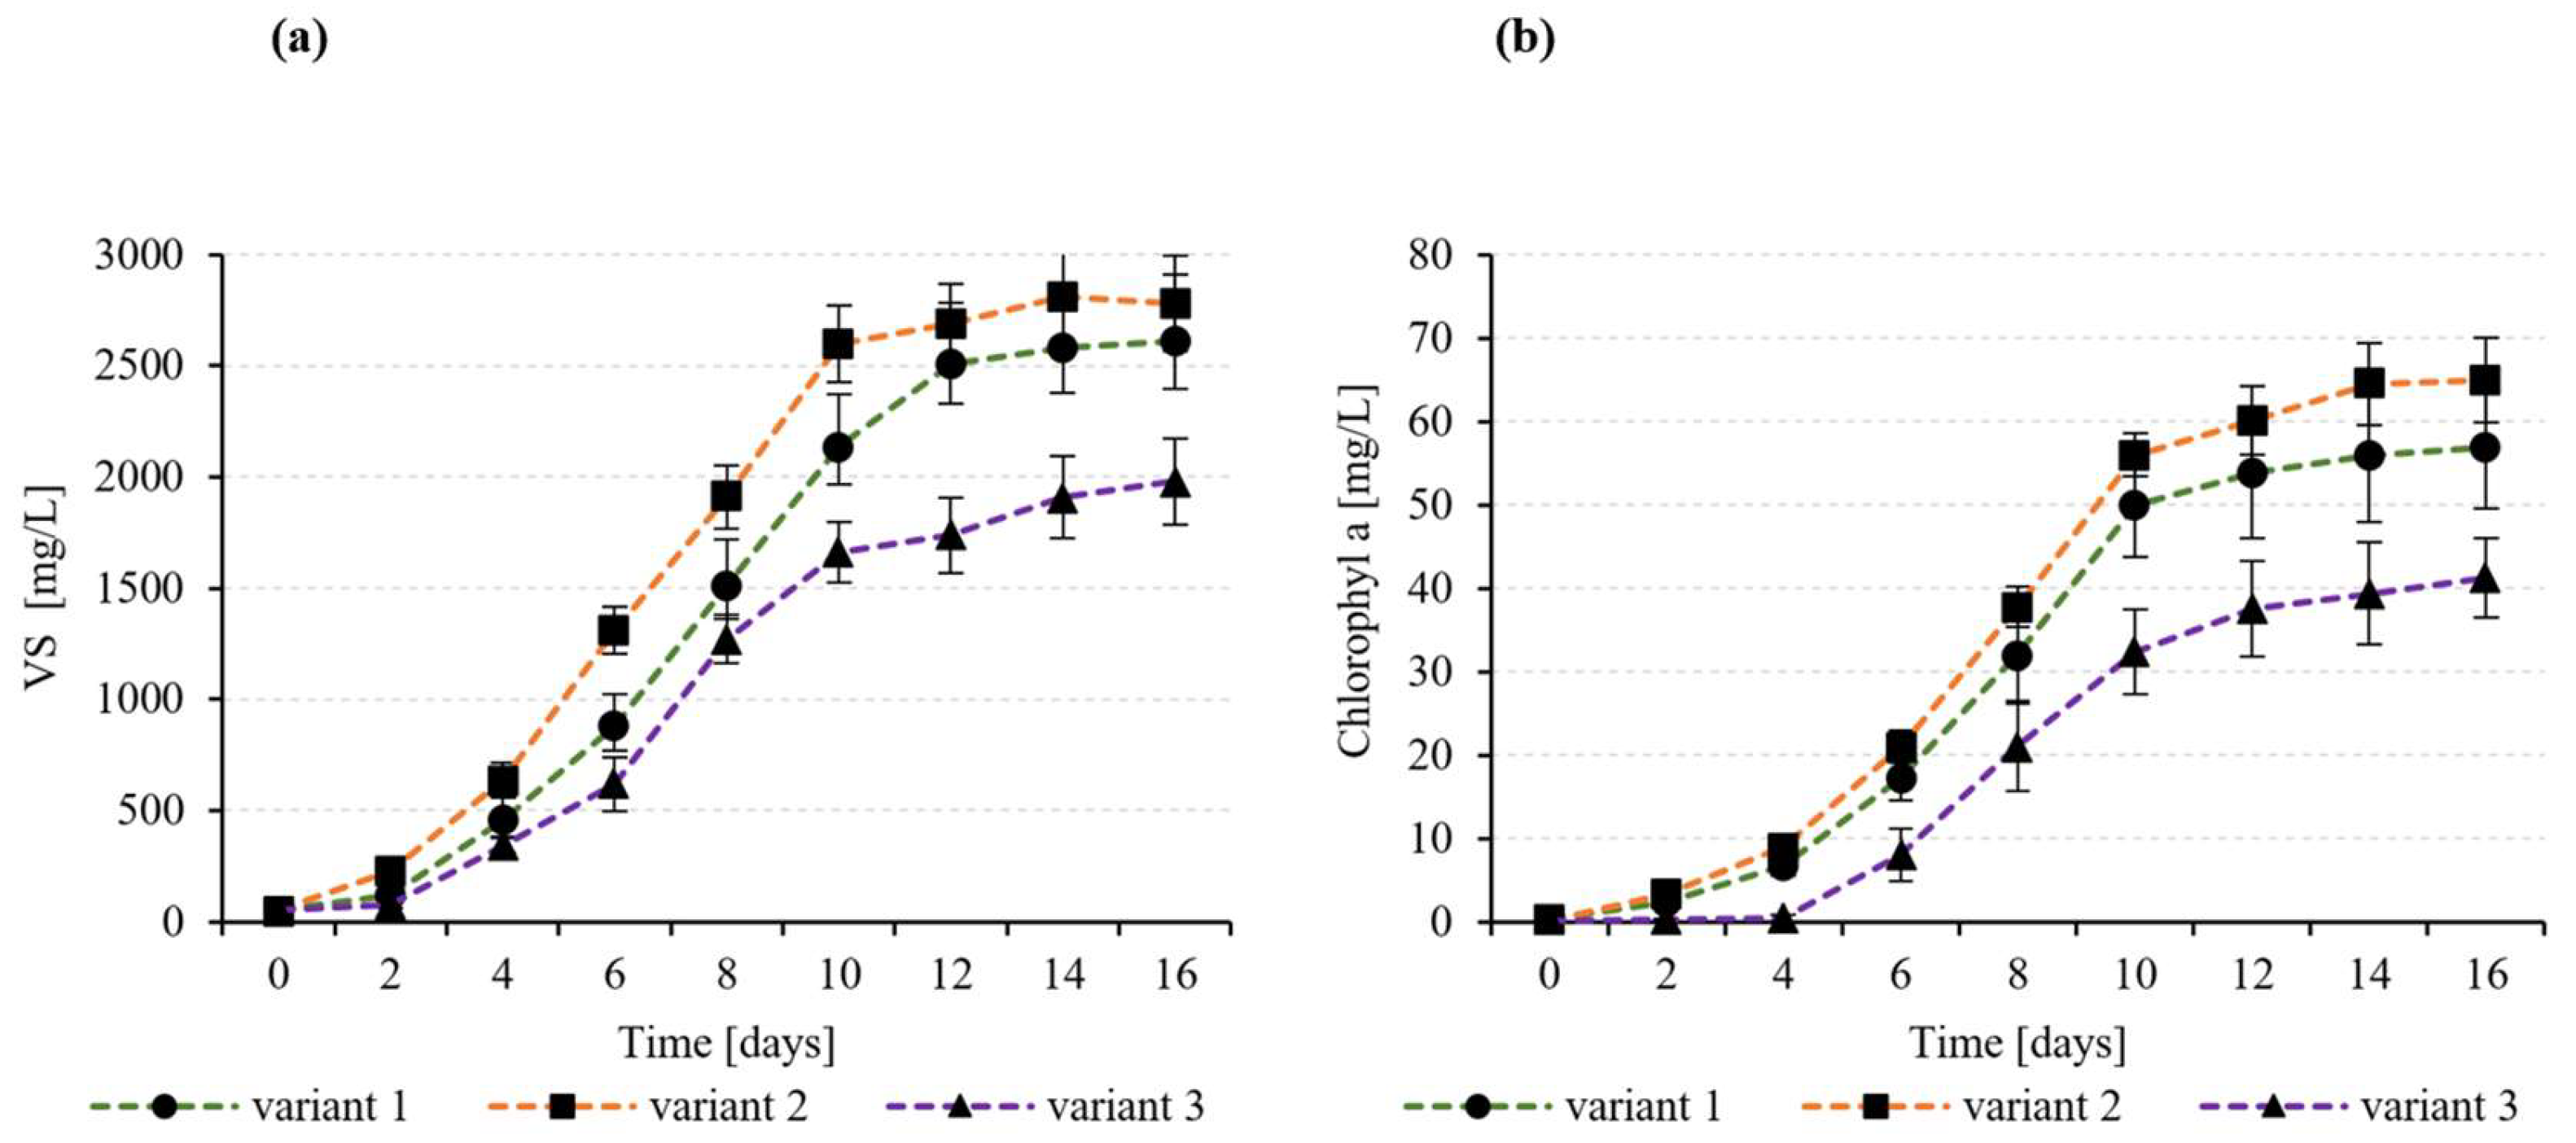
The highest final T. subcordiformis biomass concentration of 2730 ± 212 mg VS/L was achieved in V2–SL-WW (Table 3, Figure 3). This value was not significantly (p ≤ 0.05) higher than in V1–PCR, which achieved 2560 ± 301 mg VS/L. However, the biomass concentration of 1920 ± 191 mg VS/L in V3–MFC-WW was significantly (p ≤ 0.05) lower than the other technological variants tested.
A similar trend was observed for the final chlorophyll a content, which reached high values in V2–SL-WW and V1–PCR (65.0 ± 5.1 mg Chl-a/L and 56.9 ± 7.4 mg Chl-a/L, respectively) and was significantly lower (p ≤ 0.05) in V3–MFC-WW (41.2 ± 4.8 mg Chl-a/L) (Table 3, Figure 3). These differences suggest that conditions in V2–SL-WW were the most favourable for biomass growth, photosynthetic pigment synthesis, and overall metabolic activity of the microalgae. The results also indicate that nutrient deficiency in the culture medium can stress microalgae, leading to a decrease in chlorophyll a content in the biomass of T. suecica [55]. The decrease in chlorophyll content under nutrient stress is consistent with previous reports, where the quantum efficiency of photosystem II (Fv/Fm) was found to decrease under similar stress conditions [56].
The biomass growth rate during the logarithmic phase further supports this trend. The highest value, 296 ± 21 mg VS/L·d, was recorded in V2–SL-WW (Table 3). Significantly lower growth rates were observed in V1–PCR (239 ± 19 mg VS/L·d) and V3–MFC-WW (197 ± 17 mg VS/L·d) (Table 3). Notably, despite the comparable duration of the logarithmic phase across all variants (6 days), only V2–SL-WW exhibited significant maxima in both VS and chlorophyll a growth rates, with the latter increasing by 7.8 ± 0.6 mg Chl-a/L·d, exceeding the values of the other variants (Table 3). This pattern may indicate a synergy between nutrient availability and photosynthetic activity, which is critical for efficient biomass production. A decline in chlorophyll pigment content, known as chlorosis, is associated with nutrient deficiency [57]. In the experiments of Vítová et al. [58], microalgal cells ceased growth and division when the growth medium was completely nutrient-depleted, even though energy reserves were sufficient for reproduction.
Equally interesting are the data on the utilisation of nutrients for the biomass growth of T. subcordiformis. In V3–MFC-WW, despite the lowest overall productivity of the system, the highest utilisation of both TN with 54.6 ± 2.9 mg TN/g VS and N-NH4+ with 48.0 ± 1.7 mg N-NH4+/g VS was observed (Table 3). These values were significantly (p ≤ 0.05) higher than in V2–SL-WW, where TN utilisation was 37.1 ± 1.7 mg/g VS and N-NH4+—22.8 ± 1.4 mg/g VS (Table 3). The lowest values were found in V1–PCR with 7.7 ± 0.2 and 2.61 ± 0.3 mg/g VS, respectively (Table 3). This suggests that when nitrogen compound availability is very high (V3–MFC-WW), microalgae may accumulate nitrogen intensively within cells without a proportional increase in biomass growth, potentially due to chemical stress, detoxification mechanisms, or biosynthetic limitations in the presence of excess nitrogen. Literature data indicate that variations in biomass yield may result from changes in cell abundance and size [55]. In Chlorella cultures, lower biomass productivity under phosphorus-limited conditions was primarily due to reduced cell abundance, whereas under nitrogen-limited conditions, it was attributed to both lower cell abundance and smaller cell size. In Tetraselmis cultures, cell volume decreased in response to nitrogen–phosphorus stress, while cell abundance remained unchanged [55,59]. Nitrogen and phosphorus content in the culture medium are key factors influencing microalgal growth and biochemical composition [60]. Under conditions of high nitrogen availability, Dammak et al. [61] reported a 2.4-fold increase in Tetraselmis sp. biomass, from 408.57 mg/L·d to 572 mg/L·d, accompanied by high chlorophyll concentrations. They also found that nitrogen and phosphorus deficiency promoted starch accumulation in cells. The form of nitrogen compounds in the medium further affects Tetraselmis biomass productivity. Kim et al. [60] demonstrated that organic nitrogen stimulated the highest biomass production (2.23 g/L) compared to nitrate (1.45 g/L), while the lowest biomass production, coupled with high lipid accumulation, was observed when ammonia served as the nitrogen source.
A similar phenomenon was observed for phosphorus. The highest total phosphorus consumption per unit biomass occurred in V3–MFC-WW and was 6.2 ± 0.4 mg TP/g VS, P-PO43−, and 4.8 ± 0.3 mg P-PO43−/g VS (Table 3). These values were lower in V2–SL-WW and V1–PCR, indicating that increasing phosphorus content in the medium enhances its incorporation into biomass but, similar to nitrogen, does not necessarily promote more intensive growth. This suggests the existence of a metabolic utilisation threshold, above which further increases in nutrient availability do not translate into higher productivity and may even inhibit microalgal activity [62]. Dammak et al. [61] reported that the highest biomass concentration and productivity of Tetraselmis sp. were achieved under high metal and nitrogen concentrations combined with limited vitamin and phosphorus levels, while nitrogen deficiency inhibited algal growth. These findings support the hypothesis of Xin et al. [63] that microalgal biomass decreases with increasing extracellular phosphate concentration. Other studies have also demonstrated that elevated phosphate concentrations inhibit Chlorella growth [64].

3.3. Characterisation of the Biomass of T. subcordiformis

Analysis of the composition of the biomass of T. subcordiformis obtained in the experimental culture variants tested revealed moderate differences in the parameters crucial for the bioenergetic processes. V1–PCR, which had the most favourable conditions for the biosynthesis of organic compounds, was characterised by the highest volatile matter content of 89.3 ± 1.2% TS. This value was significantly (p ≤ 0.05) higher than in V2–SL-WW (87.4 ± 1.0% TS) and V3–MFC-WW (86.8 ± 1.3% TS) (Table 4). TC and TOC contents were also highest in V1–PCR with 495 ± 13 mg/g VS and 445 ± 10 mg/g VS, respectively, which is a favourable feature for both biological hydrogen production processes—photolytic and fermentative [65]. For the V2–SL-WW and V3–MFC-WW variants, the TOC values determined were 420 ± 20 mg/g VS and 410 ± 15 mg/g VS, respectively (Table 4).
The differences in total nitrogen (TN) content and C/N ratio suggest possible metabolic limitations in V2–SL-WW and V3–MFC-WW. In V1–PCR, the C/N ratio was 13.9 ± 0.5, whereas significantly lower values (p ≤ 0.05) were observed in V2–SL-WW and V3–MFC-WW, amounting to 11.8 ± 0.9 and 11.2 ± 0.9, respectively (Table 4). This could favour increased protein synthesis at the expense of simple energy metabolite production, thereby reducing hydrogenogenesis efficiency [66]. This is supported by the higher total protein content in V2–SL-WW (234 ± 14 mg/g VS) and V3–MFC-WW (228 ± 11 mg/g VS) compared to V1–PCR, which reached 198 ± 18 mg/g VS. The content of sugars and lipids, the main electron sources for dark fermentation, was highest in V1–PCR, reaching 220 ± 20 mg/g VS and 86.7 ± 3.6 mg/g VS, respectively (Table 4). The pH remained within a narrow range across all variants, from 7.74 ± 0.10 (V1–PCR) to 8.12 ± 0.11 (V2–SL-WW), suitable for both photosynthetic and fermentative microorganisms [67]. In recent years, cultivation of microalgae in media derived from different types of wastewater has attracted significant scientific interest due to the ability to achieve mixotrophic growth, as well as cost and sustainability advantages compared to conventional wastewater treatment systems [68]. Microalgae such as Chlorella sp., Scenedesmus sp., and Nannochloropsis sp. are commonly used for phytoremediation and biofuel production. Recently, Tetraselmis sp. has also gained attention due to its high tolerance to growth media and its efficiency in removing organic compounds from wastewater [54,69]. The biomass of Tetraselmis sp. contains numerous biologically active compounds, making it a sustainable feedstock for the production of biofuels and bioproducts that support a circular bioeconomy [70].

3.4. Biophotolysis-Based Hydrogen Production

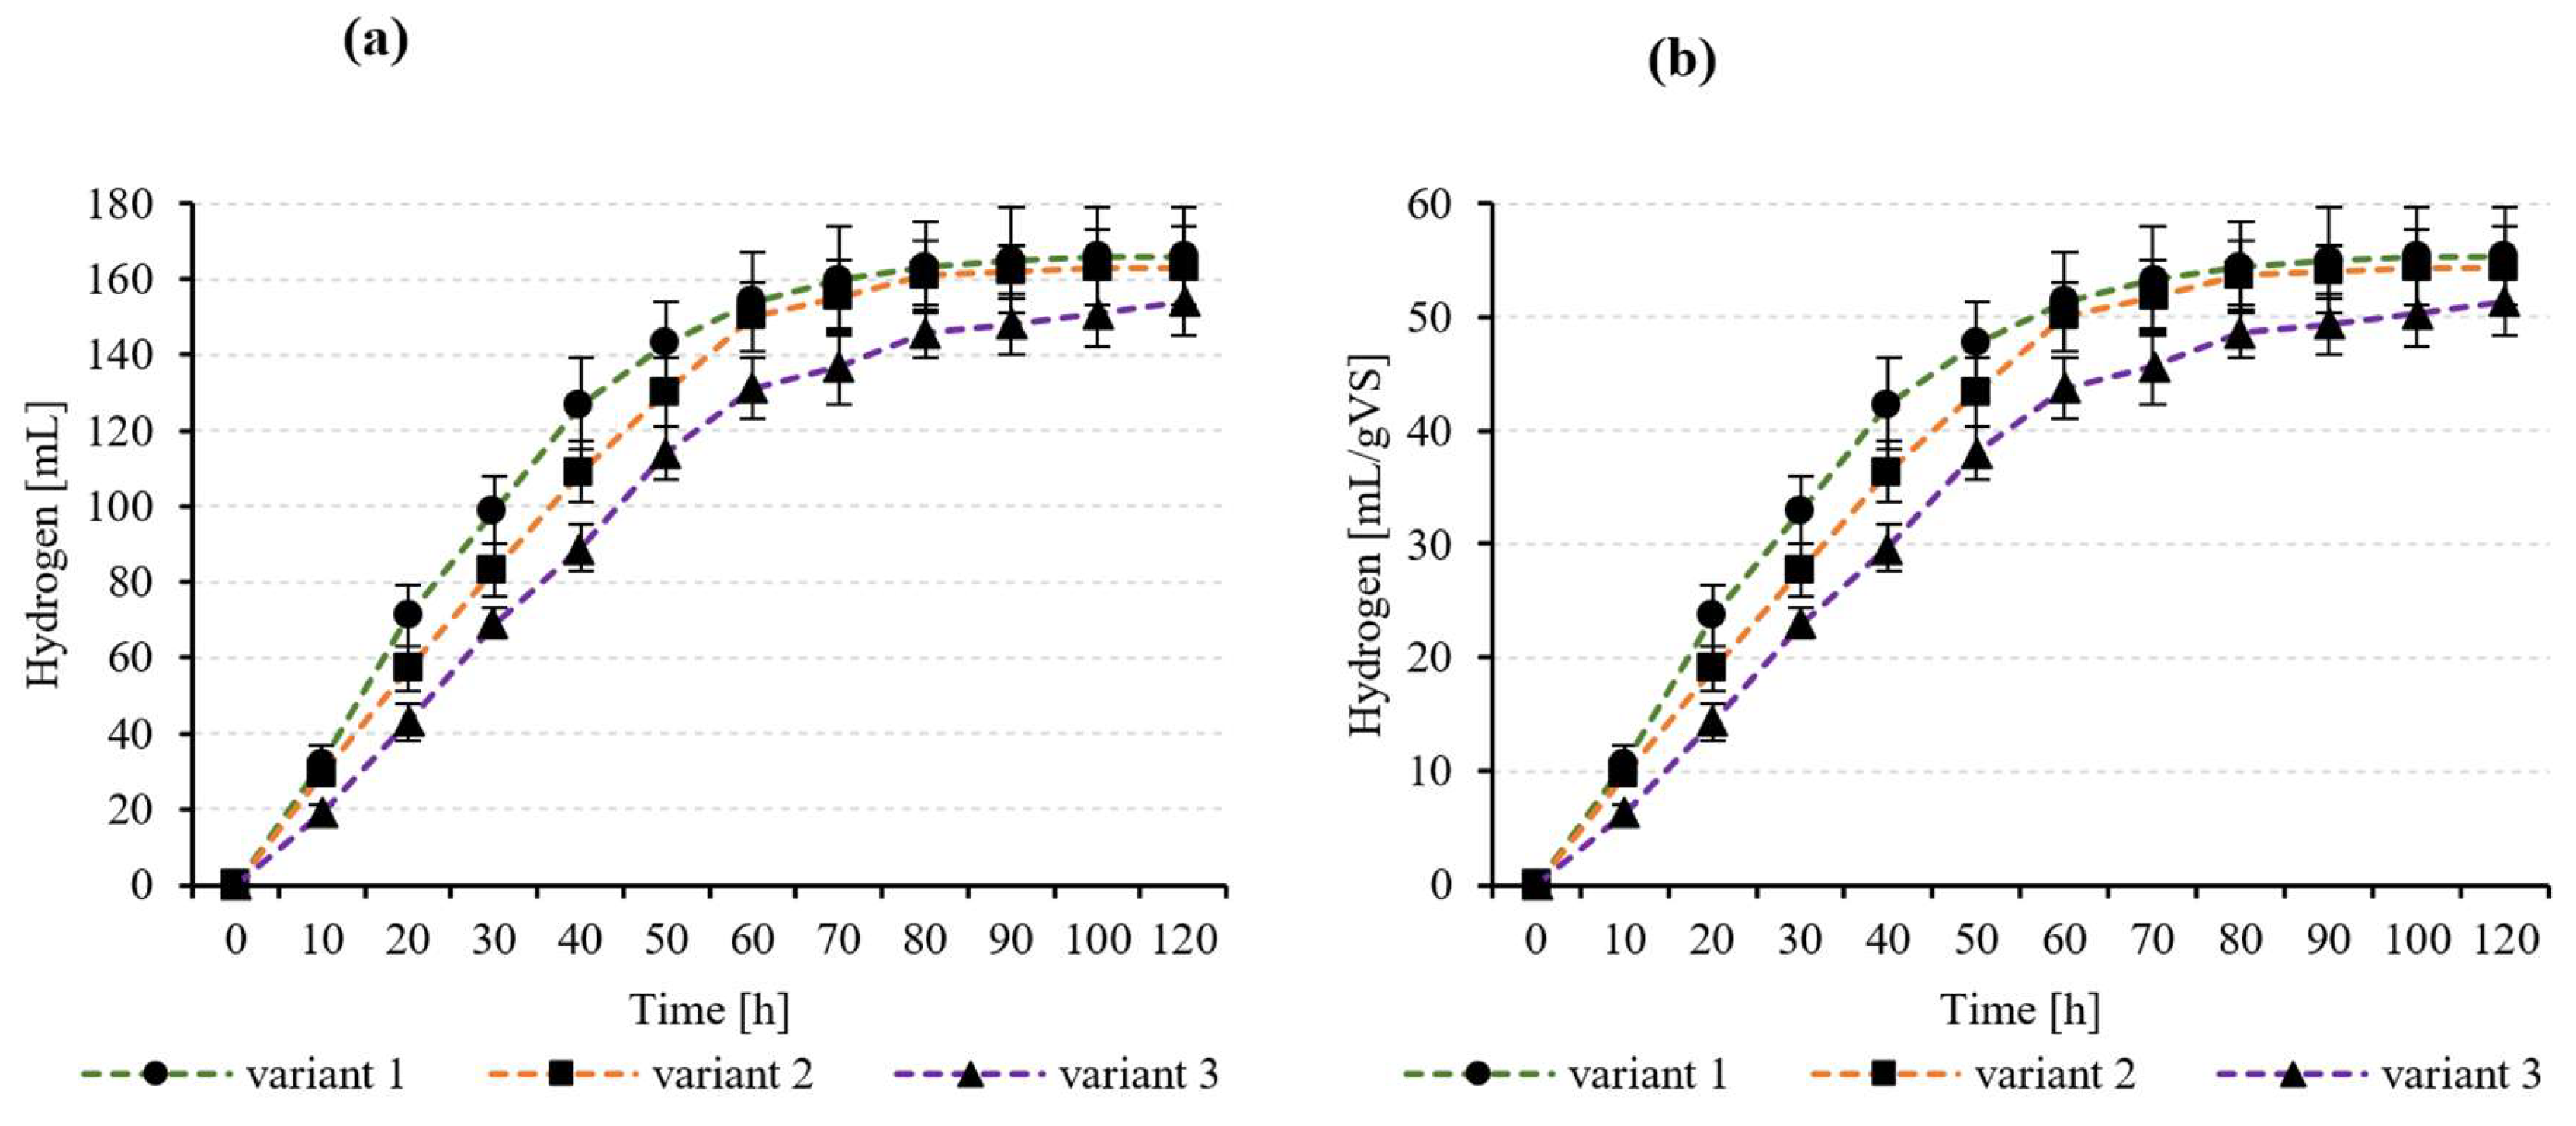
The total and specific H2 production per g VS T. subcordiformis was comparable in all three variants, and the observed differences were not statistically significant between V1–PCR and V2–SL-WW (p ≤ 0.05). The values obtained were 166 ± 13 mL and 55.3 ± 4.3 mL/g VS (V1–PCR) and 163 ± 11 mL and 54.3 ± 3.7 mL/g VS (V2–SL-WW), respectively (Table 5, Figure 4). A significantly lower H2 production efficiency was observed with the V3–MFC-WW. The total yield was 154 ± 9 mL, and the individual yield was 51.3 ± 2.2 mL/g VS of T. subscordiformis biomass (Table 5, Figure 4).
Significant (p ≤ 0.05) differences were also observed in the rate constant (k) for biophotolysis-based hydrogen production. V1–PCR and V2–SL-WW were characterised by similar values of this parameter, which were 0.031 ± 0.01 h−1 and 0.030 ± 0.02 h−1, respectively. For V3–MFC-WW, the value was 0.027 ± 0.01 h−1 (Table 5). Despite the differences in the initial metabolic dynamics of T. subcordiformis, the average H2 production rate during the experiment was comparable for all tested variants and was 4.69 ± 0.31 mL/h (V1–PCR), 4.70 ± 0.33 mL/h (V2–SL-WW), and 4.42 ± 0.29 mL/h (V3–MFC-WW) (Table 5).
The literature reports conflicting data on the efficiency of H2 production by T. subcordiformis via biophotolysis. Guo et al. [71] investigated the effects of different illumination regimes on biohydrogen production, achieving the highest H2 productivity of 126 ± 10 mL/L over 120 h under a 9 h light/6 h dark cycle. In other studies, the highest total H2 production reached 161 ± 8 mL, with an observed H2 production rate of 4.67 ± 0.23 mL/h in autotrophic T. subcordiformis cultured on a medium composed of soilless plant effluent and anaerobic fuel cell effluent [30]. Currently, biohydrogen yields from biophotolysis remain low, ranging from 0.015 to 1.084 mmol/L·h [72]. Nonetheless, elucidating the fundamental molecular mechanisms of biohydrogen production and genetically re-engineering these pathways to optimise yields could accelerate commercial implementation. The qualitative analysis of the biogas indicated a dominant hydrogen fraction, accounting for 61.4 ± 0.9% (V1–PCR), 60.9 ± 1.2% (V2–SL-WW), and 60.1 ± 0.7% (V3–MFC-WW) (Table 5). This composition demonstrates high process selectivity for H2, which is critical for its potential use as a carbon-free energy source [73]. These values are comparable to or exceed typical H2 contents in biogas produced via dark fermentation or photofermentation with purple bacteria [30]. CO2 concentrations ranged from 38.1% to 38.8% across all experimental variants, while oxygen levels were minimal (1.0–1.4%) (Table 5), indicating effective maintenance of anaerobic conditions and minimal air intrusion during incubation. Low oxygen levels are essential for the stability of O2-labile hydrogenases, whose activity is crucial for efficient biophotolysis [74].

3.5. Dark Fermentation-Based Hydrogen Production

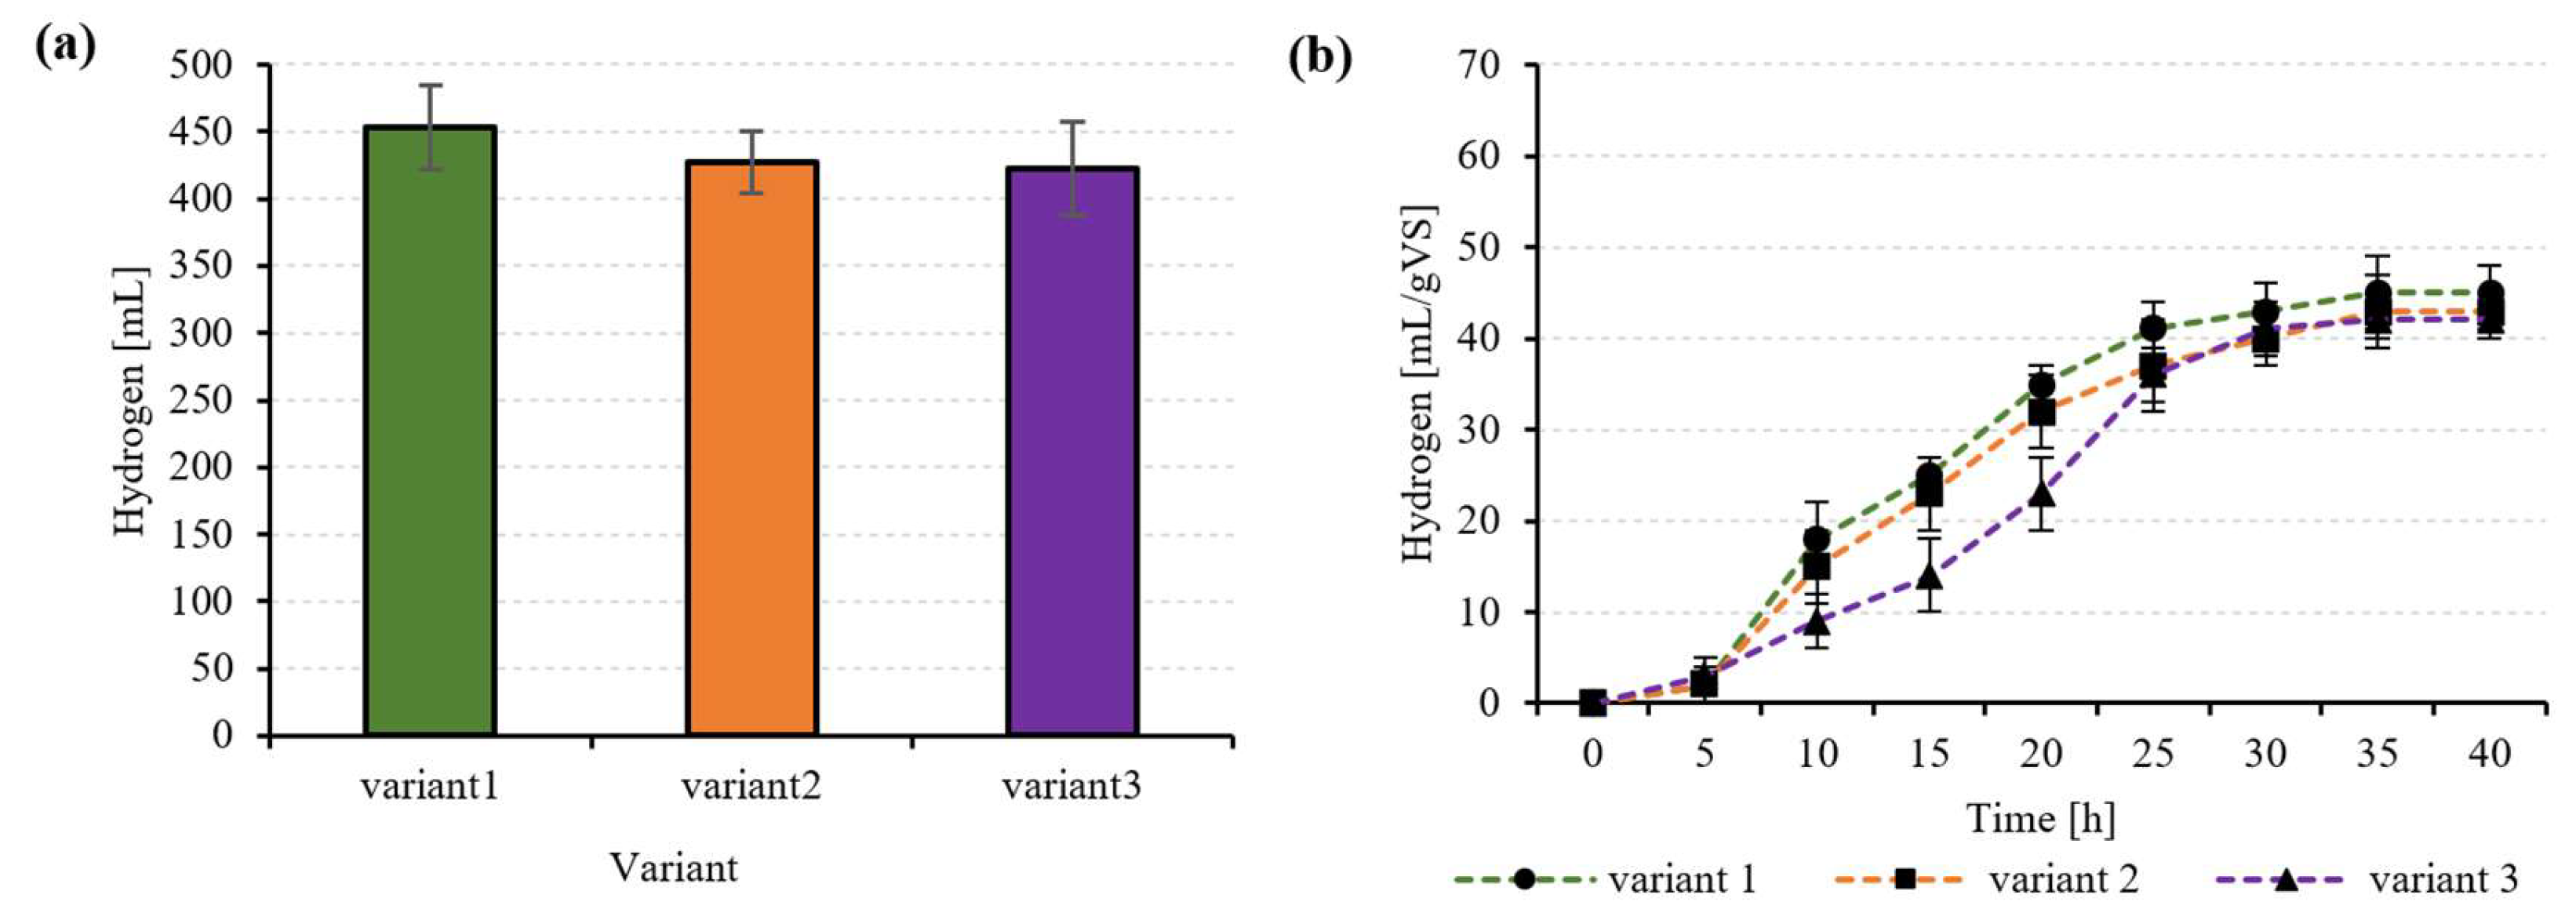
The highest mean cumulative H2 production yield during dark fermentation of T. subcordiformis biomass was achieved in the V1–PCR variant, which was 453 ± 31 mL (Table 6, Figure 5). Lower H2 yields were obtained in the V2–SL-WW and V3–MFC-WW variants, which reached 427 ± 23 mL and 422 ± 35 mL, respectively (Table 6, Figure 5). The observed differences between the variants were not statistically significant (p ≤ 0.05). The H2 production per unit in the subsequent experimental variants was 45.3 ± 3.1 mL/g VS (V1–PCR), 42.7 ± 2.3 mL/g VS (V2–SL-WW), and 42.2 ± 3.5 mL/g VS (V3–MFC-WW) (Table 6, Figure 5).
The analysis of the kinetic parameters shows that V1–PCR achieved the highest average H2 production rate (r) of 21.3 ± 1.7 mL/h and the highest reaction rate constant (k) of 0.14 ± 0.1 h−1 (Table 6). The variants V2–SL-WW and V3–MFC-WW showed lower values for both parameters (r, k), namely 19.9 ± 1.6 mL/h and 0.13 ± 0.1 h−1 (V2–SL-WW) and 18.1 ± 1.3 mL/h and 0.11 ± 0.1 h−1 (V3–MFC-WW), respectively (Table 6). The qualitative composition of the biogas showed a dominant CO2 content ranging from 52.6 ± 1.1% to 56.3 ± 1.4% (Table 6). The hydrogen content ranged from 38.5 ± 1.7% (V1–PCR) to 41.1 ± 0.9% (V2–SL-WW) (Table 6), which is typical for dark fermentation [75].
A review of the literature indicates that the efficiency of biohydrogen production via dark fermentation of organic biomass ranges from 0.46 to 24.97 mmol/g COD [76], and microalgal biomass represents a promising fermentation substrate [77]. Wang and Yin [78] reported biohydrogen yields from C. vulgaris ranging from 0.37 to 19 mL H2/g VS. Sharma et al. [79] achieved higher productivity from Chlorella sp. biomass, reaching 74.32 mL H2/g VS, while Nazarpour et al. [80] recorded a maximum yield of 66.32 mL H2/g VS using Arthrospira platensis. Other studies indicate that dark fermentation of A. platensis biomass can reach a maximum H2 production of 96 mL H2/g VS, highlighting its potential as a substrate [81]. Scientific evidence increasingly suggests that pre-treatment of microalgal biomass prior to dark fermentation enhances biohydrogen production efficiency [17]. For example, Liu et al. [82] reported a biohydrogen productivity of 474 mL/L from untreated C. vulgaris biomass, which increased to 1424 mL/L after pre-treatment. Fermentation of Chlorella biomass subjected to acid-thermal pretreatment resulted in an H2 yield of 54.0 mL/g VS, compared to 26.3 mL H2/g VS when only acid pretreatment was applied [83]. Prehydrolysis via simultaneous saccharification and fermentation further increased yields to 172 mL H2/g VS, with a productivity of 2.4 mL H2/g VS·h [84].
The advancement of research integrating microalgal cultivation and biomass processing with the management of diverse wastewater and organic waste streams for biohydrogen production holds promise for meeting growing energy demands while protecting the environment and supporting a circular bioeconomy.

4. Conclusions

The microalga T. subcordiformis exhibited high adaptability to a range of culture media, including effluents from hydroponic tomato cultivation and microbial fuel cell effluents, confirming its suitability as a robust bioresource for energy processes.
The highest biomass concentration (2730 ± 212 mg VS/L) and chlorophyll a content (65.0 ± 5.1 mg Chl-a/L) were observed in cultures grown in agricultural wastewater, reflecting favourable growth conditions and nutrient availability. H2 production via biophotolysis reached the highest specific yields of 55.3 ± 4.3 mL/g VS for the control sample and 54.3 ± 3.7 mL/g VS for biomass grown in agricultural wastewater, with total H2 production ranging from 163 to 166 mL. The high H2 fraction in the biogas (60–61%) confirms the effectiveness of this pathway. In contrast, anaerobic digestion of T. subcordiformis biomass resulted in higher total H2 yields (up to 453 ± 31 mL), but with lower H2 concentrations in the biogas (38–41%).
Specifically, in biophotolysis, the highest specific hydrogen production was observed for the control (55.3 ± 4.3 mL/g VS) and the biomass cultivated on agricultural wastewater (54.3 ± 3.7 mL/g VS). In dark fermentation, these values were 45.3 ± 3.1 mL/g VS and 42.7 ± 2.3 mL/g VS, respectively. Comparing the two biohydrogen production pathways, biophotolysis demonstrated 22–31% higher specific H2 production per g VS of biomass than anaerobic fermentation, indicating superior efficiency in converting hydrogen-containing substrates.
The soilless tomato culture medium emerged as the most promising option, balancing biomass productivity, substrate quality, and hydrogen production efficiency, meaning it represents a viable, cost-effective alternative to synthetic media at an industrial scale.

Author Contributions

Conceptualization, M.D. and M.Z.; methodology, M.D.; software, J.K.; validation, M.D. and M.Z.; formal analysis, J.K.; investigation, M.K.; resources, M.D.; data curation, J.K. and M.K.; writing—original draft preparation, M.D. and M.K.; writing—review and editing, M.D.; visualization, J.K.; supervision, M.Z.; project administration, J.K.; funding acquisition, M.Z. and J.K. All authors have read and agreed to the published version of the manuscript.

Funding

This research was financially supported by works WZ/WB-IIŚ/3/2025 of the Bialystok University of Technology and No. 29.610.023-110 of the University of Warmia and Mazury in Olsztyn, funded by the Ministry of Science and Higher Education.

Institutional Review Board Statement

Not applicable.

Informed Consent Statement

Not applicable.

Data Availability Statement

Data are contained within the article.

Conflicts of Interest

The authors declare no conflicts of interest.

References

  1. Caldeira, R.; Infante-Moro, A. Strategic hydrogen management: Driving a sustainable energy future. Front. Energy Res. 2025, 13, 1540396. [Google Scholar] [CrossRef] [Scilit]
  2. Franco, A. Green hydrogen and the energy transition: Hopes, challenges, and realistic opportunities. Hydrogen 2025, 6, 28. [Google Scholar] [CrossRef] [Scilit]
  3. Abdin, Z.; Zafaranloo, A.; Rafiee, A.; Mérida, W.; Lipiński, W.; Khalilpour, K.R. Hydrogen as an energy vector. Renew. Sustain. Energy Rev. 2020, 120, 109620. [Google Scholar] [CrossRef] [Scilit]
  4. Nikolaidis, P.; Poullikkas, A. A comparative overview of hydrogen production processes. Renew. Sustain. Energy Rev. 2017, 67, 597–611. [Google Scholar] [CrossRef] [Scilit]
  5. Malode, S.J.; Pandiaraj, S.; Alodhayb, A.; Shetti, N.P. Review on Sustainable Biohydrogen Production from Biomass: Recent Developments and Prospects toward a Promising Source. Energy Fuels 2025, 39, 7967–7989. [Google Scholar] [CrossRef] [Scilit]
  6. Albuquerque, M.M.; Sartor, G.D.B.; Martinez-Burgos, W.J.; Scapini, T.; Edwiges, T.; Soccol, C.R.; Medeiros, A.B.P. Biohydrogen produced via dark fermentation: A review. Methane 2024, 3, 500–532. [Google Scholar] [CrossRef] [Scilit]
  7. Arimbrathodi, S.P.; Javed, M.A.; Hamouda, M.A.; Hassan, A.A.; Ahmed, M.E. BioH2 production using microalgae: Highlights on recent advancements from a bibliometric analysis. Water 2023, 15, 185. [Google Scholar] [CrossRef] [Scilit]
  8. Jalili, P.; Ala, A.; Nazari, P.; Jalili, B.; Ganji, D.D. A comprehensive review of microbial fuel cells considering materials, methods, structures, and microorganisms. Heliyon 2024, 10, e25439. [Google Scholar] [CrossRef] [Scilit]
  9. Bhuiyan, M.M.H.; Siddique, Z. Hydrogen as an alternative fuel: A comprehensive review of challenges and opportunities in production, storage, and transportation. Int. J. Hydrogen Energy 2025, 102, 1026–1044. [Google Scholar] [CrossRef] [Scilit]
  10. Osman, A.I.; Chen, L.; Yang, M.; Msigwa, G.; Farghali, M.; Fawzy, S.; Rooney, D.W.; Yap, P.-S. Cost, environmental impact, and resilience of renewable energy under a changing climate: A review. Environ. Chem. Lett. 2023, 21, 741–764. [Google Scholar] [CrossRef] [Scilit]
  11. Zhang, L.; Jia, C.; Bai, F.; Wang, W.; An, S.; Zhao, K.; Li, Z.; Li, J.; Sun, H. A comprehensive review of the promising clean energy carrier: Hydrogen production, transportation, storage, and utilization (HPTSU) technologies. Fuel 2024, 355, 129455. [Google Scholar] [CrossRef] [Scilit]
  12. e Silva, G.O.R.; Carpanez, T.G.; Dos Santos, C.R.; Casella, G.S.; Moreira, V.R.; de Paula, E.C.; Amaral, M.C.S. Biohydrogen production from wastewater: Production technologies, environmental and economic aspects. J. Environ. Chem. Eng. 2024, 12, 114104. [Google Scholar] [CrossRef] [Scilit]
  13. Azizan, A.; Jalil, R. Biophotolysis process for biomass conversion to hydrogen. In Hydrogen Production from Renewable Resources and Wastes; Rahimpour, M.R., Makarem, M.A., Kiani, P., Eds.; CRC Press: Boca Raton, FL, USA, 2024; Taylor & Francis Group: Boca Raton, FL, USA, 2024; ISBN 9781003382270. [Google Scholar] [CrossRef] [Scilit]
  14. Hallenbeck, P.C.; Benemann, J.R. Biological hydrogen production: Fundamentals and limiting processes. Int. J. Hydrogen Energy 2002, 27, 1185–1193. [Google Scholar] [CrossRef] [Scilit]
  15. Ni, M.; Leung, D.Y.C.; Leung, M.K.H.; Sumathy, K. An overview of hydrogen production from biomass. Fuel Process. Technol. 2006, 87, 461–472. [Google Scholar] [CrossRef] [Scilit]
  16. Klimov, K.K.; Lyubomudrov, B.E. Optimization of Chlorella vulgaris beijer cultivation process for biohydrogen production. Int. J. Hydrogen Energy 2024, 57, 431–437. [Google Scholar] [CrossRef] [Scilit]
  17. Jain, R.; Panwar, N.L.; Jain, S.K.; Gupta, T.; Agarwal, C.; Meena, S.S. Bio-hydrogen production through dark fermentation: An overview. Biomass Convers. Biorefinery 2024, 14, 12699–12724. [Google Scholar] [CrossRef] [Scilit]
  18. Baldi, F.; Pecorini, I.; Iannelli, R. Comparison of single-stage and two-stage anaerobic co-digestion of food waste and activated sludge for hydrogen and methane production. Renew. Energy 2019, 143, 1755–1765. [Google Scholar] [CrossRef] [Scilit]
  19. Dahiya, S.; Chatterjee, S.; Sarkar, O.; Mohan, S.V. Renewable hydrogen production by dark-fermentation: Current status, challenges and perspectives. Bioresour. Technol. 2021, 124, 354. [Google Scholar] [CrossRef] [Scilit]
  20. Ahmad, A.; Rambabu, K.; Hasan, S.W.; Show, P.L.; Banat, F. Biohydrogen production through dark fermentation: Recent trends and advances in transition to a circular bioeconomy. Int. J. Hydrogen Energy 2024, 52, 335–357. [Google Scholar] [CrossRef] [Scilit]
  21. Dębowski, M.; Dudek, M.; Kazimierowicz, J.; Quattrocelli, P.; Rusanowska, P.; Barczak, Ł.; Nowicka, A.; Zieliński, M. Analysis of multi-biofuel production during cultivation of the green microalga Tetraselmis subscordiformis. Energies 2024, 17, 19961073. [Google Scholar] [CrossRef] [Scilit]
  22. Dammak, M.; Ben Hlima, H.; Fendri, I.; Smaoui, S.; Abdelkafi, S. Tetraselmis species for environmental sustainability: Biology, water bioremediation, and biofuel production. Environ. Sci. Pollut. Res. 2024, 31, 48864–48887. [Google Scholar] [CrossRef] [Scilit]
  23. Nezafatian, E.; Farhadian, O.; Daneshvar, E.; Bhatnagar, A. Investigating the effects of salinity and light stresses on primary and secondary metabolites of Tetraselmis tetrathele: Total phenolic compounds, fatty acid profile, and biodiesel properties. Biomass Bioenergy 2024, 181, 107050. [Google Scholar] [CrossRef] [Scilit]
  24. Udayantha, H.M.V.; Kim, S.H.; Chen, Y.; Long, J.; Bathige, S.D.N.K.; Park, K.I. Enhancing lipid accumulation in Tetraselmis sp.: Integrating nitrogen deprivation and glucose supplementation for biofuel production. Biotechnol. Biofuels Bioprod. 2025, 18, 57. [Google Scholar] [CrossRef] [Scilit] [PubMed]
  25. Hussain, S.B.; Usman Shah, S.M.; Nosheen, A.; Mumtaz, S. Sustainable biodiesel production via Chlorella vulgaris and Tetraselmis chuii in food-based brewery industrial wastewater. Waste Biomass Valorization 2024, 15, 4445–4455. [Google Scholar] [CrossRef] [Scilit]
  26. Culture Collection of Algae at the University of Göttingen, Germany. Available online: https://sagdb.uni-goettingen.de/detailedList.php?str_number=161-1a (accessed on 20 September 2025).
  27. Guan, Y.; Deng, M.; Yu, X.; Zhang, W. Two-stage photo-biological production of hydrogen by marine green alga Platymonas subcordiformis. Biochem. Eng. J. 2004, 19, 69–73. [Google Scholar] [CrossRef] [Scilit]
  28. Zieliński, M.; Rusanowska, P.; Dudek, M.; Starowicz, A.; Barczak, Ł.; Dębowski, M. Efficiency of Photosynthetic Microbial Fuel Cells (pMFC) Depending on the Type of Microorganisms Inhabiting the Cathode Chamber. Energies 2024, 17, 2296. [Google Scholar] [CrossRef] [Scilit]
  29. Dudek, M.; Dębowski, M.; Kazimierowicz, J.; Zieliński, M.; Quattrocelli, P.; Nowicka, A. The cultivation of biohydrogen-producing Tetraselmis subcordiformis microalgae as the third stage of dairy wastewater aerobic treatment system. Sustainability 2022, 14, 12085. [Google Scholar] [CrossRef] [Scilit]
  30. Dębowski, M.; Dudek, M.; Nowicka, A.; Quattrocelli, P.; Kazimierowicz, J.; Zieliński, M. Suitability of pre-digested dairy effluent for mixotrophic cultivation of the hydrogen-producing microalgae Tetraselmis subcordiformis. Environ. Technol. 2022, 45, 471–482. [Google Scholar] [CrossRef] [Scilit]
  31. Kazimierowicz, J.; Dębowski, M.; Zieliński, M. Biohythane production in hydrogen-oriented dark fermentation of aerobic granular sludge (AGS) pretreated with solidified carbon dioxide (SCO2). Int. J. Mol. Sci. 2023, 24, 4442. [Google Scholar] [CrossRef] [Scilit]
  32. Yang, G.; Wang, J. Improving mechanisms of biohydrogen production from grass using zero-valent iron nanoparticles. Bioresour. Technol. 2018, 266, 413–420. [Google Scholar] [CrossRef] [Scilit]
  33. Zieliński, M.; Barczak, Ł.; Rusanowska, P.; Kazimierowicz, J.; Dębowski, M. Comparison of Biohydrogen Production by Tetraselmis subcordiformis During Cultivation Using Soil-Less Agricultural Wastewater and Effluent from Microbial Fuel Cells. Energies 2024, 17, 5287. [Google Scholar] [CrossRef] [Scilit]

  34. Zieliński, M.; Dębowski, M.; Kazimierowicz, J.; Nowicka, A.; Dudek, M. Application of Hydrodynamic Cavitation in the Disintegration of Aerobic Granular Sludge—Evaluation of Pretreatment Time on Biomass Properties, Anaerobic Digestion Efficiency and Energy Balance. Energies 2024, 17, 335. [Google Scholar] [CrossRef] [Scilit]
  35. Dudek, M.; Nowicka, A.; Zieliński, M.; Kazimierowicz, J.; Dębowski, M. The effect of biomass separation method on the efficiency of hydrogen production by Platymonas subcordiformis. Int. J. Energy Environ. Eng. 2023, 14, 167–177. [Google Scholar] [CrossRef] [Scilit]
  36. Nirmalakhandan, N.; Selvaratnam, T.; Henkanatte-Gedera, S.M.; Tchinda, D.; Abeysiriwardana-Arachchige, I.S.A.; Delanka-Pedige, H.M.K.; Munasinghe-Arachchige, S.P.; Zhang, Y.; Holguin, F.O.; Lammers, P.J. Algal wastewater treatment: Photoautotrophic vs. mixotrophic processes. Algal Res. 2019, 41, 101569. [Google Scholar] [CrossRef] [Scilit]
  37. Sorgatto, V.G.; Soccol, C.R.; Molina-Aulestia, D.T.; de Carvalho, M.A.; de Melo Pereira, G.V.; de Carvalho, J.C. Mixotrophic cultivation of microalgae in cassava processing wastewater for simultaneous treatment and production of lipid-rich biomass. Fuels 2021, 2, 521–532. [Google Scholar] [CrossRef] [Scilit]
  38. Su, H.; Zhang, Y.; Zhang, C.; Zhou, X.; Li, J. Cultivation of Chlorella pyrenoidosa in soybean processing wastewater. Bioresour. Technol. 2011, 102, 9884–9890. [Google Scholar] [CrossRef] [Scilit]
  39. Wang, H.Y.; Xiong, H.R.; Hui, Z.L.; Zeng, X.B. Mixotrophic cultivation of Chlorella pyrenoidosa with diluted primary piggery wastewater to produce lipids. Bioresour. Technol. 2012, 119, 173–179. [Google Scholar] [CrossRef] [Scilit]
  40. Mahdavi, S.; Tavakoli, O. Utilizing co-cultivation of Tetraselmis chuii and Chlorella vulgaris to improve high-value biomass yield in dairy wastewater treatment. J. Water Process Eng. 2025, 73, 107572. [Google Scholar] [CrossRef] [Scilit]
  41. Goswami, R.K.; Agrawal, K.; Mehariya, S.; Rajagopal, R.; Karthikeyan, O.P.; Verma, P. Development of economical and sustainable cultivation system for biomass production and simultaneous treatment of municipal wastewater using Tetraselmis indica BDUG001. Environ. Technol. 2023, 44, 1–21. [Google Scholar] [CrossRef] [Scilit]
  42. Devi, N.D.; Sun, X.; Ding, L.; Goud, V.V.; Hu, B. Mixotrophic growth regime of novel strain Scenedesmus sp. DDVG I in municipal wastewater for concomitant bioremediation and valorization of biomass. J. Clean. Prod. 2022, 365, 132834. [Google Scholar] [CrossRef] [Scilit]
  43. Venkatachalam, C.D.; Ravichandran, S.R.; Sengottian, M. Lignocellulosic and algal biomass for bio-crude production using hydrothermal liquefaction: Conversion techniques, mechanism and process conditions—A review. Environ. Eng. Res. 2022, 27, 137–153. [Google Scholar] [CrossRef] [Scilit]
  44. Jia, H.; Yuan, Q. Removal of nitrogen from wastewater using microalgae and microalgae–bacteria consortia. Cogent Environ. Sci. 2016, 2, 1275089. [Google Scholar] [CrossRef] [Scilit]
  45. Collos, Y.; Berges, J. Nitrogen metabolism in phytoplankton. In Marine Ecology; Duarte, C.M., Helgueras, A.L., Eds.; Eolss Publishers Co., Ltd.: Oxford, UK, 2002; pp. 262–280. Available online: https://www.eolss.net/sample-chapters/c09/E2-27-03-03.pdf (accessed on 20 September 2025).
  46. Wang, L.; Min, M.; Li, Y.; Chen, P.; Chen, Y.; Liu, Y.; Wang, Y.; Ruan, R. Cultivation of green algae Chlorella sp. in different wastewaters from municipal wastewater treatment plant. Appl. Biochem. Biotechnol. 2010, 162, 1174–1186. [Google Scholar] [CrossRef] [Scilit] [PubMed]
  47. Liu, Z.; Geng, Y.; Zhang, Y.; Cui, D.; Yang, L.; Xiong, Z.; Pavlostathis, S.G.; Shao, P.; Luo, X. Microalgae–bacteria tandem-type ponds simultaneously removing ammonia nitrogen and phosphorus towards municipal wastewater advanced treatment. Environ. Res. 2022, 214, 114076. [Google Scholar] [CrossRef] [Scilit] [PubMed]
  48. Amit, G.; Ghosh, U.K.; Gautam, R.; Jaiswal, A.; Pandey, S. Phycoremediation of dairy wastewater and biodiesel production using marine microalgae Tetraselmis indica. In Advances in Functional and Smart Materials: Select Proceedings of ICFMMP 2021; Prakash, C., Singh, S., Krolczyk, G., Eds.; Springer Science and Business Media Deutschland GmbH: Singapore, 2022; pp. 35–42. ISBN 9789811941467. [Google Scholar] [CrossRef] [Scilit]
  49. Wu, Q.; Guo, L.; Wang, Y.; Zhao, Y.; Jin, C.; Gao, M.; She, Z. Phosphorus uptake, distribution and transformation with Chlorella vulgaris under different trophic modes. Chemosphere 2021, 285, 131366. [Google Scholar] [CrossRef] [Scilit]
  50. Schmidt, J.J.; Gagnon, G.A.; Jamieson, R.C. Microalgae growth and phosphorus uptake in wastewater under simulated cold region conditions. Ecol. Eng. 2016, 95, 588–593. [Google Scholar] [CrossRef] [Scilit]
  51. Bossa, R.; Di Colandrea, M.; Salbitani, G.; Carfagna, S. Phosphorous Utilization in Microalgae: Physiological Aspects and Applied Implications. Plants 2024, 13, 2127. [Google Scholar] [CrossRef] [Scilit]
  52. Michels, M.H.A.; Vaskoska, M.; Vermuë, M.H.; Wijffels, R.H. Growth of Tetraselmis suecica in a tubular photobioreactor on wastewater from a fish farm. Water Res. 2014, 65C, 290–296. [Google Scholar] [CrossRef] [Scilit]
  53. Goswami, R.K.; Agrawal, K.; Mehariya, S.; Verma, P. Current perspective on wastewater treatment using photobioreactor for Tetraselmis sp.: An emerging and foreseeable sustainable approach. Environ. Sci. Pollut. Res. 2022, 29, 61905–61937. [Google Scholar] [CrossRef] [Scilit]
  54. Amit, C.R.; Ghosh, U.K.; Nayak, J.K. Phycoremediation potential of marine microalga Tetraselmis indica on secondary treated domestic sewage for nutrient removal and biodiesel production. Environ. Sci. Pollut. Res. 2017, 24, 20868–20875. [Google Scholar] [CrossRef] [Scilit]
  55. Goiris, K.; Van Colen, W.; Wilches, I.; León-Tamariz, F.; De Cooman, L.; Muylaert, K. Impact of nutrient stress on antioxidant production in three species of microalgae. Algal Res. 2015, 7, 51–57. [Google Scholar] [CrossRef] [Scilit]
  56. Lippemeier, S.; Hintze, R.; Vanselow, K.; Hartig, P.; Colijn, F. In-line recording of PAM fluorescence of phytoplankton cultures as a new tool for studying effects of fluctuating nutrient supply on photosynthesis. Eur. J. Phycol. 2001, 36, 89–100. [Google Scholar] [CrossRef]
  57. Zachleder, V.; Brányiková, I. Starch overproduction by means of algae. In Algal Biorefineries; Bajpai, R., Prokop, A., Zappi, M., Eds.; Springer: Dordrecht, The Netherlands; Heidelberg, Germany; London, UK; New York, NY, USA, 2014; Volume 1, pp. 217–240. [Google Scholar] [CrossRef] [Scilit]
  58. Vítová, M.; Bisová, K.; Kawano, S.; Zachleder, V. Accumulation of energy reserves in algae: From cell cycles to biotechnological applications. Biotechnol. Adv. 2015, 33, 1204–1218. [Google Scholar] [CrossRef] [Scilit]
  59. Fabregas, J.; Herrero, C.; Cabezas, B.; Abalde, J. Mass culture and biochemical variability of the marine microalga Tetraselmis suecica Kylin (Butch) with high nutrient concentrations. Aquaculture 1985, 49, 231–244. [Google Scholar] [CrossRef] [Scilit]
  60. Kim, G.; Mujtaba, G.; Lee, K. Effects of nitrogen sources on cell growth and biochemical composition of marine chlorophyte Tetraselmis sp. for lipid production. Algae 2016, 31, 257–266. [Google Scholar] [CrossRef] [Scilit]
  61. Dammak, M.; Hadrich, B.; Miladi, R.; Barkallah, M.; Hentati, F.; Hachicha, R.; Laroche, C.; Michaud, P.; Fendri, I.; Abdelkafi, S. Effects of nutritional conditions on growth and biochemical composition of Tetraselmis sp. Lipids Health Dis. 2017, 16, 41. [Google Scholar] [CrossRef] [Scilit] [PubMed]
  62. Grossman, A.R.; Aksoy, M. Algae in a phosphorus-limited landscape. Annu. Plant Rev. 2015, 48, 337–374. [Google Scholar] [CrossRef] [Scilit]
  63. Li, X.; Hu, H.-y.; Gan, K.; Sun, Y.x. Effect of different nitrogen and phosphorus concentrations on the growth, nutrient, and lipid accumulation of a freshwater microalga Scenedesmus sp. Bioresour. Technol. 2010, 101, 5494–5500. [Google Scholar] [CrossRef] [Scilit] [PubMed]
  64. Liang, K.; Zhang, Q.; Gu, M.; Cong, W. Effect of phosphorus on lipid accumulation in freshwater microalga Chlorella sp. J. Appl. Phycol. 2013, 25, 311–318. [Google Scholar] [CrossRef] [Scilit]
  65. Nagarajan, D.; Lee, D.J.; Kondo, A.; Chang, J.S. Recent insights into biohydrogen production by microalgae—From biophotolysis to dark fermentation. Bioresour. Technol. 2017, 227, 373–387. [Google Scholar] [CrossRef] [Scilit]
  66. Ghimire, A.; Frunzo, L.; Pirozzi, F.; Trably, E.; Escudie, R.; Lens, P.N.L.; Esposito, G. A review on dark fermentative biohydrogen production from organic biomass: Process parameters and use of by-products. Appl. Energy 2015, 144, 73–95. [Google Scholar] [CrossRef] [Scilit]
  67. Pathy, A.; Nageshwari, K.; Ramaraj, R.; Maniam, G.P.; Govindan, N.; Balasubramanian, P. Biohydrogen production using algae: Potentiality, economics and challenges. Bioresour. Technol. 2022, 360, 127514. [Google Scholar] [CrossRef] [Scilit] [PubMed]
  68. Mohsenpour, S.F.; Hennige, S.; Willoughby, N.; Adeloye, A.; Gutierrez, T. Integrating micro-algae into wastewater treatment: A review. Sci. Total Environ. 2021, 752, 142168. [Google Scholar] [CrossRef] [Scilit] [PubMed]
  69. Bhardwaj, N.; Agrawal, K.; Verma, P. Algal biofuels: An economic and effective alternative of fossil fuels. In Microbial Strategies for Techno-Economic Biofuel Production; Srivastava, N., Srivastava, M., Mishra, P.K., Gupta, V.K., Eds.; Springer: Singapore, 2020; pp. 207–227. [Google Scholar] [CrossRef] [Scilit]
  70. Mehariya, S.; Goswami, R.K.; Karthikeysan, O.P.; Verma, P. Microalgae for high-value products: A way towards green nutraceutical and pharmaceutical compounds. Chemosphere 2021, 280, 130553. [Google Scholar] [CrossRef] [Scilit]
  71. Guo, Z.; Li, Y.; Guo, H. Effect of light/dark regimens on hydrogen production by Tetraselmis subcordiformis coupled with an alkaline fuel cell system. Appl. Biochem. Biotechnol. 2017, 183, 1295–1303. [Google Scholar] [CrossRef] [Scilit]

  72. Parakh, S.K.; Tian, Z.; Wong, J.Z.E.; Tong, Y.W. From microalgae to bioenergy: Recent advances in biochemical conversion processes. Fermentation 2023, 9, 529. [Google Scholar] [CrossRef] [Scilit]
  73. Mathushika, J.; Gomes, C. Development of microalgae-based biofuels as a viable green energy source: Challenges and future perspectives. Biointerface Res. Appl. Chem. 2022, 12, 3849–3882. [Google Scholar] [CrossRef] [Scilit]
  74. Goswami, R.K.; Mehariya, S.; Obulisamy, P.K.; Verma, P. Advanced microalgae-based renewable biohydrogen production systems: A review. Bioresour. Technol. 2021, 320, 124301. [Google Scholar] [CrossRef] [Scilit]
  75. Moussa, R.N.; Moussa, N.; Dionisi, D. Hydrogen production from biomass and organic waste using dark fermentation: An analysis of literature data on the effect of operating parameters on process performance. Processes 2022, 10, 156. [Google Scholar] [CrossRef] [Scilit]
  76. Tapia-Venegas, E.; Ramirez-Morales, J.E.; Silva-Illanes, F.; Toledo-Alarcón, J.; Paillet, F.; Escudie, R.; Lay, C.H.; Chu, C.Y.; Leu, H.J.; Marone, A.; et al. Biohydrogen production by dark fermentation: Scaling-up and technologies integration for a sustainable system. Rev. Environ. Sci. Biotechnol. 2015, 14, 761–785. [Google Scholar] [CrossRef] [Scilit]
  77. Babich, O.; Ivanova, S.; Michaud, P.; Budenkova, E.; Kashirskikh, E.; Anokhova, V.; Sukhikh, S. Fermentation of micro- and macroalgae as a way to produce value-added products. Biotechnol. Rep. 2024, 41, e00827. [Google Scholar] [CrossRef] [Scilit] [PubMed]
  78. Wang, J.; Yin, Y. Fermentative hydrogen production using pretreated microalgal biomass as feedstock. Microb. Cell Fact. 2018, 17, 22. [Google Scholar] [CrossRef] [Scilit] [PubMed]
  79. Sharma, P.; Sivaramakrishnaiah, M.; Deepanraj, B.; Saravanan, R.; Reddy, M.V. A novel optimization approach for biohydrogen production using algal biomass. Int. J. Hydrogen Energy 2024, 52, 94–103. [Google Scholar] [CrossRef] [Scilit]
  80. Nazarpour, M.; Taghizadeh-Alisaraei, A.; Asghari, A.; Abbaszadeh-Mayvan, A.; Tatari, A. Optimization of biohydrogen production from microalgae by response surface methodology (RSM). Energy 2022, 253, 124059. [Google Scholar] [CrossRef] [Scilit]
  81. Ding, L.; Cheng, J.; Lu, H.; Yue, L.; Zhou, J.; Cen, K. Three-stage gaseous biofuel production combining dark hydrogen, photo hydrogen, and methane fermentation using wet Arthrospira platensis cultivated under high CO2 and sodium stress. Energy Convers. Manag. 2017, 148, 394–404. [Google Scholar] [CrossRef] [Scilit]
  82. Liu, C.H.; Chang, C.Y.; Cheng, C.L.; Lee, D.J.; Chang, J.S. Fermentative hydrogen production by Clostridium butyricum CGS5 using carbohydrate-rich microalgal biomass as feedstock. Int. J. Hydrogen Energy 2012, 37, 15458–15464. [Google Scholar] [CrossRef] [Scilit]
  83. Giang, T.T.; Lunprom, S.; Liao, Q.; Reungsang, A.; Salakkam, A. Improvement of hydrogen production from Chlorella sp. biomass by acid-thermal pretreatment. PeerJ 2019, 7, e6637. [Google Scholar] [CrossRef] [Scilit]
  84. Giang, T.T.; Lunprom, S.; Liao, Q.; Reungsang, A.; Salakkam, A. Enhancing hydrogen production from Chlorella sp. biomass by pre-hydrolysis with simultaneous saccharification and fermentation (PSSF). Energies 2019, 12, 908. [Google Scholar] [CrossRef] [Scilit]
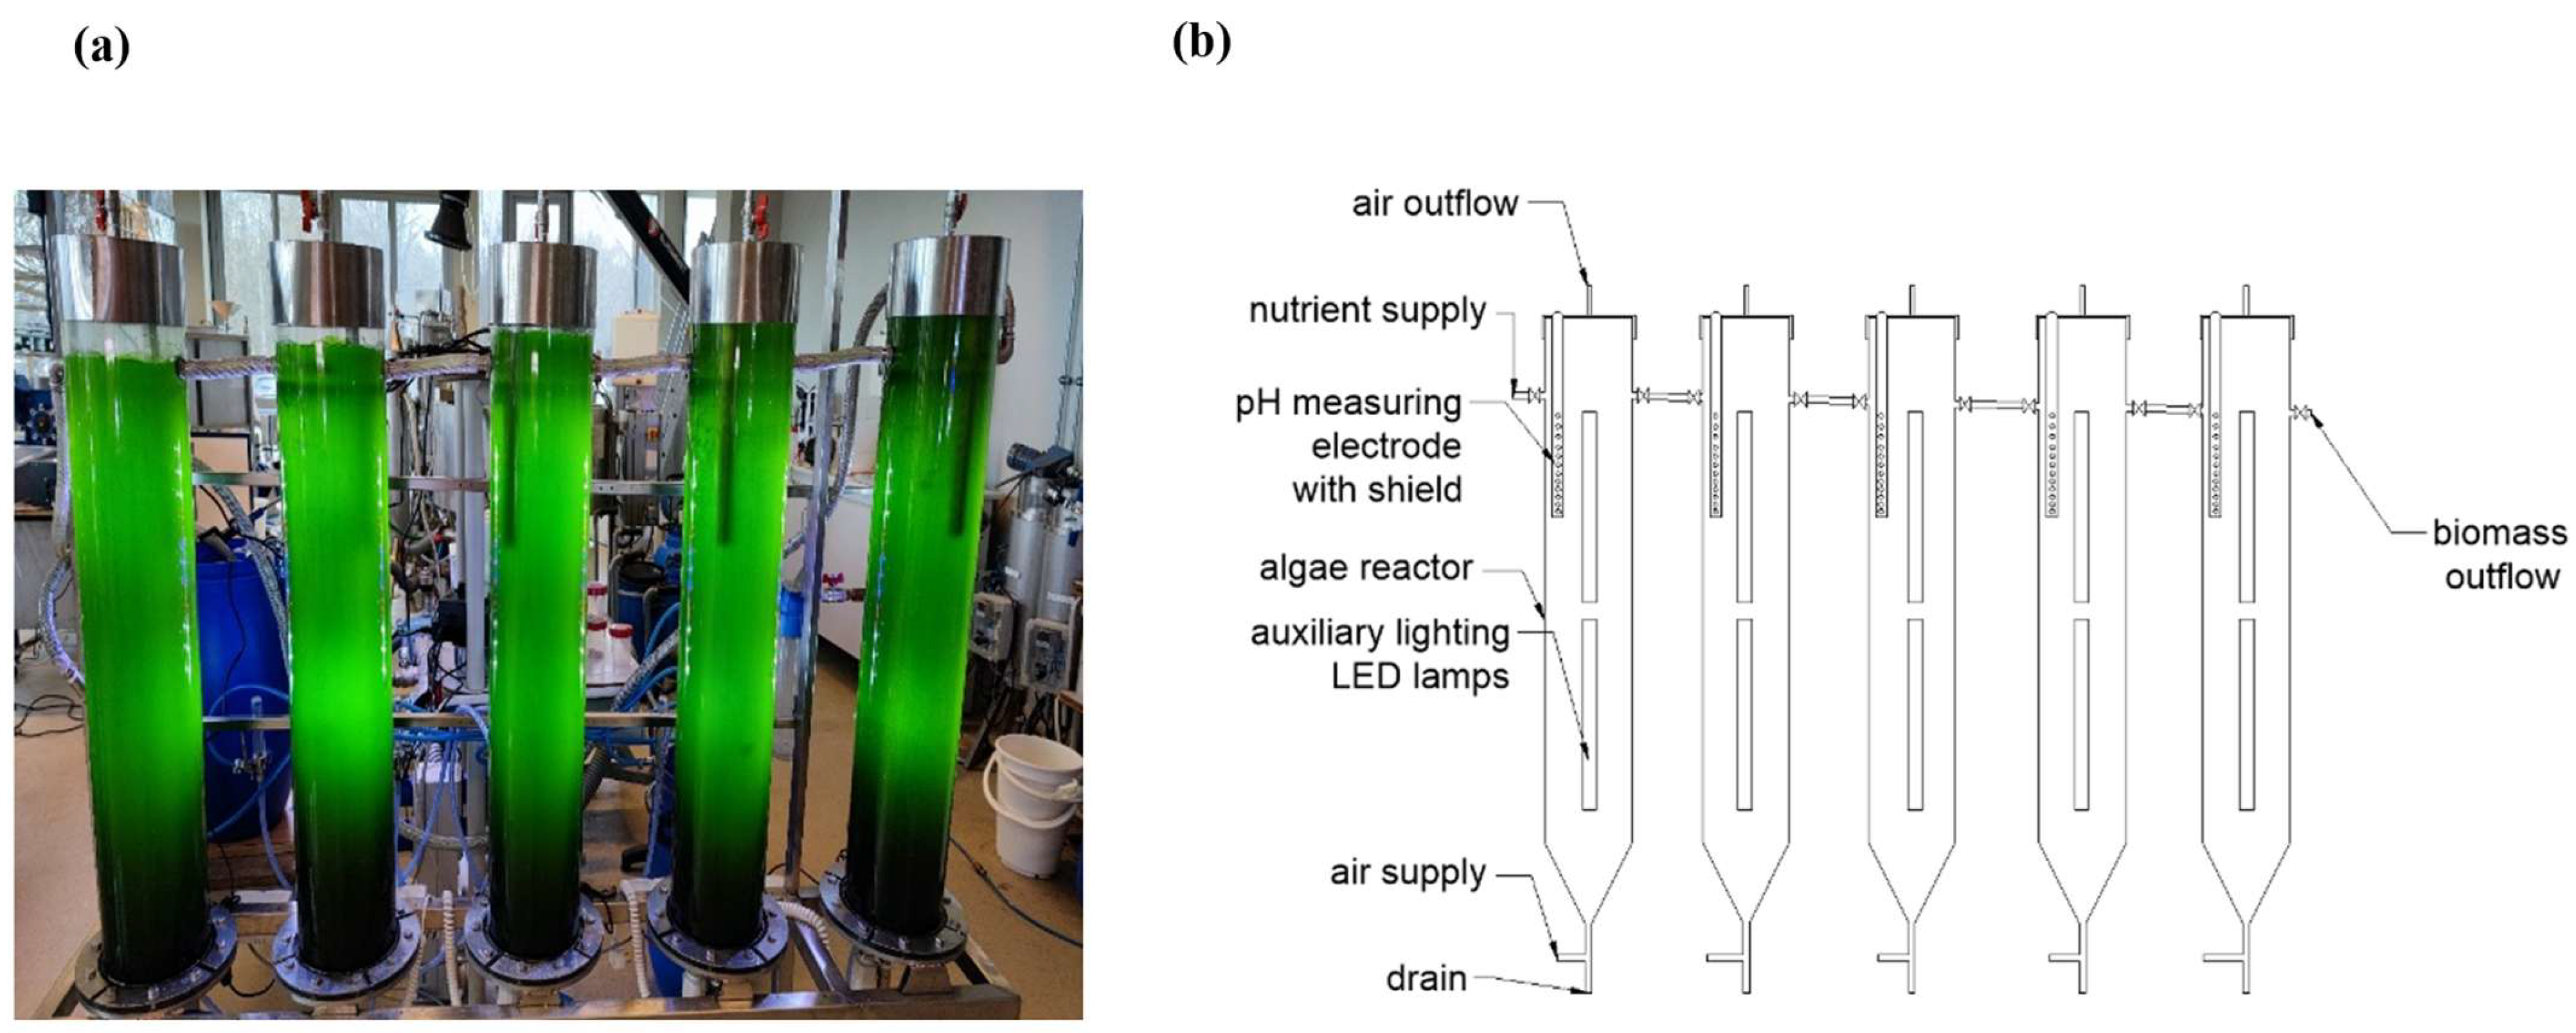
Figure 1. Photobioreactors for the cultivation of T. subcordiformis biomass (a) photo (b) diagram with explanations of the most important construction elements.
Phycology 05 00074 g001
Figure 2. Schematic diagram (a) and photo (b) of a model of a respirometric fermentation chamber with a system for analysing biogas quality (1—fermentation chamber, 2—biogas composition analyser, 3—biogas flow shut-off valves, 4—biogas dryer, 5—sealed connection for sampling for chromatographic analyses).
Phycology 05 00074 g002
Figure 3. Biomass growth of T. subcordiformis as a function of the experimental variant, expressed as changes in the concentration of volatile solids (a) and chlorophyll a (b).
Phycology 05 00074 g003
Figure 4. Total (a) and individual (b) efficiency of biophotolysis-based H2 production by T. subcordiformis in the different experimental variants.
Phycology 05 00074 g004
Figure 5. Overall efficiency (a) and individual efficiency (b) of H2 production by dark fermentation with T. subcordiformis in different experimental variants.
Phycology 05 00074 g005
Table 1. Composition of the culture media used in the following experimental variants.
IndicatorUnitV1—PCRV2—SL-WWV3—MFC-WW
pH7.18 ± 0.107.91 ± 0.137.22 ± 0.09
Total solids (TS)mg TS/L9.3 ± 1.611.1 ± 1.717.6 ± 9.2
CODmg O2/L9.6 ± 1.020.9 ± 4.7246 ± 9.3
BOD5mg O2/L3.1 ± 0.313.4 ± 2.2167 ± 6.9
Total nitrogen (TN)mg N/L20.4 ± 1.3165.1 ± 22.3243 ± 11.1
NH4+mg N-NH4/L6.8 ± 1.274.3 ± 10.8134 ± 11.6
N-NO3mg N-NO3/L9.5 ± 0.963.5 ± 6.81.6 ± 0.2
N-NO2mg N-NO2/L1.4 ± 0.53.0 ± 2.52.3 ± 0.5
Total phosphorus (TP)mg P/L8.4 ± 1.038.6 ± 3.730.7 ± 6.9
P-PO43−mg P-PO4/L8.0 ± 1.036.1 ± 4.027.4 ± 6.2
Table 2. Initial and final concentrations and efficiency of removal of major nutrients from the culture medium by T. subcordiformis as a function of experimental treatment.
IndicatorVariant
V1–PCRV2–SL-WWV3–MFC-WW
Initial Concentration
[mg/L]
Final Concentration
[mg/L]
Efficiency
[%]
Initial Concentration
[mg/L]
Final Concentration
[mg/L]
Efficiency
[%]
Initial Concentration
[mg/L]
Final Concentration
[mg/L]
Efficiency
[%]
COD9.6 ± 1.07.7 ± 0.619.8 ± 1.120.9 ± 4.79.9 ± 0.452.3 ± 1.4246 ± 9.3178 ± 4.327.4 ± 1.1
BOD53.1 ± 0.32.6 ± 0.317.4 ± 0.913.4 ± 2.25.2 ± 0.261.2 ± 2.1167 ± 6.9110 ± 2.133.9 ± 1.7
TN20.4 ± 1.30.61 ± 0.1196.9 ± 1.0165.1 ± 22.363.7 ± 3.961.4 ± 0.9243 ± 11.1137 ± 3.643.4 ± 2.2
N-NH4+6.8 ± 1.20.12 ± 0.0398.4 ± 0.474.3 ± 10.811.9 ± 1.783.9 ± 1.4134 ± 11.641.4 ± 1.969.1 ± 1.8
TP8.4 ± 1.00.27 ± 0.0996.8 ± 0.338.6 ± 3.724.6 ± 1.336.2 ± 2.630.7 ± 6.918.7 ± 1.339.2 ± 0.9
P-PO43−8.0 ± 1.00.51 ± 0.1393.6 ± 0.236.1 ± 4.025.4 ± 2.129.7 ± 2.427.4 ± 6.217.9 ± 1.534.8 ± 1.6
Table 3. Indicators characterising the T. subcordiformis microalgae biomass production process.
IndicatorJednostkaV1–PCRV2–SL-WWV3–MFC-WW
Final biomass concentrationmg VS/L2560 ± 3012730 ± 2121920 ± 191
Final biomass concentrationmg Chl-a/L56.9 ± 7.465.0 ± 5.141.2 ± 4.8
VS linear growth phasedni1088
VS growth rate in the logarithmic growth phasemg VS/L·d239 ± 19296 ± 21197 ± 17
Chl-a logarithmic growth phasedni666
Chl-a growth rate in the logarithmic growth phasemg Chl-a/L·d7.2 ± 0.87.8 ± 0.65.3 ± 0.5
TN utilisation rate for biomass growthmg TN/g VS7.7 ± 0.237.1 ± 1.754.6 ± 2.9
N-NH4 utilisation rate for biomass growthmg N-NH4/g VS2.61 ± 0.322.8 ± 1.448.0 ± 1.7
TP utilisation rate for biomass growthmg TP/g VS3.2 ± 0.15.1 ± 0.26.2 ± 0.4
P-PO4 utilisation rate for biomass growthmg P-PO4/g VS2.9 ± 0.23.9 ± 0.24.8 ± 0.3
Table 4. Characteristics of the biomass of T. subcordiformis depending on the experimental cultivation variant.
ParameterUnitVariant
V1–PCRV2–SL-WWV3–MFC-WW
Volatile solids (VS)% TS89.3 ± 1.287.4 ± 1.086.8 ± 1.3
Mineral solids (MS)% TS10.7 ± 1.012.6 ± 1.013.2 ± 1.1
Total carbon (TC)mg/g VS495 ± 13470 ± 24450 ± 29
Total organic carbon (TOC)mg/g VS445 ± 10420 ± 20410 ± 15
Total nitrogen (TN)mg/g VS32.0 ± 1.835.1 ± 1.436.5 ± 2.5
C/N13.9 ± 0.511.8 ± 0.911.2 ± 0.9
Total phosphorus (TP)mg/g VS15.7 ± 2.016.5 ± 1.615.5 ± 1.9
pH7.74 ± 0.108.12 ± 0.117.95 ± 0.08
Proteinmg/g VS198 ± 18234 ± 14228 ± 11
Saccharidesmg/g VS220 ± 20200 ± 12212 ± 17
Lipidsmg/g VS86.7 ± 3.681.0 ± 4.278.6 ± 6.5
Table 5. Basic kinetic parameters of H2 production by biophotolysis of T. subcordiformis and the qualitative composition of the resulting biogas.
ParameterUnitVariant
V1–PCRV2–SL-WWV3–MFC-WW
Total H2 productionmL166 ± 13163 ± 11154 ± 9
H2 production rate constant (k)1/h0.031 ± 0.020.030 ± 0.010.027 ± 0.01
H2 production rate (r)mL/h4.69 ± 0.314.70 ± 0.334.42 ± 0.29
Unique H2 productionmL/g VS55.3 ± 4.354.3 ± 3.751.3 ± 3.0
Biogas compositionUnitV1–PCRV2–SL-WWV3–MFC-WW
H2%61.4 ± 0.960.9 ± 1.260.1 ± 0.7
CO2%38.2 ± 1.038.1 ± 1.338.8 ± 0.9
O2%1.4 ± 0.21.0 ± 0.81.1 ± 0.3
Table 6. Basic kinetic parameters of H2 production during dark fermentation of T. subcordiformis biomass and the qualitative composition of the resulting biogas.
ParameterUnitVariant
V1–PCRV2–SL-WWV3–MFC-WW
Total H2 productionmL453 ± 31427 ± 23422 ± 35
H2 production rate constant (k)1/h0.14 ± 0.10.13 ± 0.10.11 ± 0.2
H2 production rate (r)mL/h21.3 ± 1.719.9 ± 1.618.1 ± 1.3
Unique H2 productionmL/g VS45.3 ± 3.142.7 ± 2.342.2 ± 3.5
Biogas compositionUnitV1–PCRV2–SL-WWV3–MFC-WW
H2%38.5 ± 1.741.1 ± 0,940.4 ± 1.0
CO2%56.3 ± 1.452.6 ± 1.153.7 ± 1.3
Rest%5.2 ± 0.86.3 ± 0.45.9 ± 0.7
Disclaimer/Publisher’s Note: The statements, opinions and data contained in all publications are solely those of the individual author(s) and contributor(s) and not of MDPI and/or the editor(s). MDPI and/or the editor(s) disclaim responsibility for any injury to people or property resulting from any ideas, methods, instructions or products referred to in the content.