Article

Associations of Physical Activity with Body Composition, Functional Fitness, and Isokinetic Strength in Older Adults


1
Research Center for Active Living and Wellbeing (LiveWell), Instituto Politecnico de Braganca, 5300-253 Braganca, Portugal
2
Faculty of Physical Activity and Sports Sciences, Institute of Biomedicine (IBIOMED), Universidad de León, 24007 Leon, Spain
3
Department of Sports, Instituto Politecnico de Braganca, 5300-253 Braganca, Portugal
4
Department of Physical Education, Federal University of Vicosa, Vicosa 36570-000, MG, Brazil
5
Department of Sports Sciences, Polytechnic of Guarda, 6300-559 Guarda, Portugal
6
Department of Sports Sciences, Polytechnic of Cávado and Ave, 4750-810 Guimarães, Portugal
7
SPRINT—Sport Physical Activity and Health Research & Inovation Center, 6300-559 Guarda, Portugal
8
Department of Sports, Higher Institute of Educational Sciences of the Douro, 4560-708 Penafiel, Portugal
9
Centro Interdisciplinar em Ciências da Saúde (CICS), Instituto Superior de Saúde (ISAVE), Rua Castelo de Al-Mourol nº 13, 4720-155 Amares, Portugal
10
Centro de Investigação em Reabilitação (CIR), Escola Superior de Saúde, Instituto Politécnico do Porto, Rua Doutor António Bernardino de Almeida 400, 4200-072 Porto, Portugal
*
Authors to whom correspondence should be addressed.
J. Ageing Longev. 2026, 6(3), 52; https://doi.org/10.3390/jal6030052
Submission received: 15 May 2026 / Revised: 23 June 2026 / Accepted: 24 June 2026 / Published: 1 July 2026

Abstract

(1) Introduction: Physical activity is considered a key factor in maintaining functional health during aging; however, its relationship with objective measures of physical performance remains unclear. (2) Methods: A cross-sectional study was conducted with 63 community-dwelling older adults (70.4 ± 6.6 years; 35.7 ± 6.5% body fat). Physical activity was assessed using the International Physical Activity Questionnaire (IPAQ), and participants were classified into activity levels. Body composition was evaluated using bioelectrical impedance analysis. Functional fitness was assessed through standardized tests, including lower-limb strength, Timed Up and Go (TUG), and the 2 min step test (2MST). Isokinetic strength of the knee extensors and flexors was measured at 60°/s and 180°/s. Non-parametric tests, Spearman correlations, and linear regression analyses were performed; (3) Results: No significant differences were observed between IPAQ categories for body fat percentage, TUG performance, lower-limb strength, or aerobic capacity (all p > 0.05). Correlations between MET values and physical or functional variables were weak (ρ ranging from −0.07 to 0.18). (4) Conclusions: Self-reported physical activity was not associated with objective measures of physical function in older adults. These findings highlight the importance of incorporating objective assessments of physical performance when evaluating functional health in this population.

1. Introduction

Aging is associated with progressive declines in physiological function, including reductions in muscle mass, strength, and functional capacity, alongside unfavorable changes in body composition [1,2,3]. These alterations contribute to increased vulnerability, reduced independence, and a higher risk of adverse health outcomes such as falls, disability, and chronic diseases [4,5,6,7]. Consequently, preserving functional fitness and musculoskeletal health has become a central goal in promoting healthy aging [8,9].
Physical activity is widely recognized as a key modifiable factor in mitigating age-related decline [10]. Regular engagement in moderate-to-vigorous physical activity has been associated with improved muscle strength, aerobic capacity, body composition, and overall quality of life in older adults [11,12]. Conversely, sedentary behavior has been linked to functional impairments and increased cardiometabolic risk [13,14]. Despite these well-established benefits, a substantial proportion of the older population fails to meet recommended physical activity levels [15], highlighting the need for a better understanding of its relationship with health-related outcomes in this group.
The International Physical Activity Questionnaire (IPAQ) is commonly used to classify physical activity levels in epidemiological studies due to its feasibility and applicability in large populations [16,17]. However, the extent to which IPAQ-based classifications reflect objective measures of physical fitness and body composition remains unclear, particularly in older adults. While some studies report positive associations between physical activity levels and functional performance [11,18,19], the ability of self-reported measures to accurately capture objective aspects of physical function in older adults remains unclear [20].
In this context, the integration of multiple domains—including body composition assessed by bioelectrical impedance analysis, functional fitness tests, and isokinetic dynamometry—provides a more comprehensive evaluation of physical health. Isokinetic strength assessment, in particular, offers precise quantification of muscle performance and asymmetries, which are relevant for mobility and fall risk. However, few studies have simultaneously examined these domains in relation to physical activity levels in older adults.
Therefore, the present study was designed as an exploratory cross-sectional investigation aimed at examining the relationships between physical activity levels, body composition, functional fitness, and isokinetic strength in community-dwelling older adults. Given the exploratory nature of the study and the limited evidence regarding the extent to which self-reported physical activity reflects objective indicators of physical health in older populations, the findings should be interpreted as hypothesis-generating rather than confirmatory. We hypothesized that higher levels of physical activity would be associated with better functional performance, more favorable body composition, and greater muscle strength. Given the widespread use of self-reported physical activity questionnaires in aging research and the limited evidence regarding their ability to accurately reflect objective indicators of physical health, further investigation is warranted. A better understanding of these relationships may help determine whether self-reported measures are sufficient to identify functional and physiological differences among community-dwelling older adults and may inform the selection of more appropriate assessment strategies in both research and clinical settings.

2. Materials and Methods

2.1. Study Design and Participants

This cross-sectional study was conducted with community-dwelling older adults recruited through convenience sampling from community-based programs in the Bragança region. The target population consisted of independently living older adults who regularly participated in local community programs.
Participants were eligible if they were aged ≥60 years and able to perform the physical assessments independently. Individuals with acute musculoskeletal injuries, neurological disorders affecting mobility, or contraindications to exercise testing were excluded. A total of 63 participants (54 women and 9 men) met the eligibility criteria and completed all assessments.
All participants were informed about the study procedures and provided written informed consent prior to participation. The study was conducted in accordance with the Declaration of Helsinki and approved by the local Ethics Committee of the Instituto Politécnico de Bragança (approval number: 501020).

2.2. Data Collection Procedures

Data collection was carried out in a controlled laboratory setting and included the following domains: anthropometry and body composition, physical activity level, functional fitness, quality of life, and isokinetic strength. All assessments were conducted by trained researchers following standardized protocols.

2.3. Anthropometry and Body Composition

Body composition was assessed using bioelectrical impedance analysis (BIA) with a segmental body composition analyzer (Tanita BC-545, Tanita Corporation, Tokyo, Japan). Measurements included body weight (kg), skeletal muscle mass (kg), body fat percentage (%), visceral fat (%), total body water (%), and estimated basal metabolic rate.
Participants were assessed barefoot and wearing light clothing, following standard pre-assessment guidelines [21], including avoidance of food intake, alcohol, and vigorous physical activity prior to testing.

2.4. Physical Activity Assessment

Physical activity levels were assessed using the short version of the International Physical Activity Questionnaire Short Form (IPAQ-SF) [22]. The IPAQ-SF has demonstrated acceptable reliability and validity for assessing physical activity in adult and older populations and is widely used in epidemiological research due to its feasibility and ease of administration [17,19]. Participants were classified according to the standardized IPAQ scoring protocol [19,20], which categorizes individuals as sedentary, irregularly active, active, or highly active based on weekly frequency, duration, and intensity of reported physical activity. This classification is widely used to distinguish different levels of physical activity in population-based studies [23].
Additionally, average daily sitting time was calculated in hours/day.

2.5. Functional Fitness Assessment

Functional fitness was assessed using the Senior Fitness Test battery proposed by Rikli and Jones [24]:
The following components were evaluated:
-
Lower-limb strength: assessed using the 30 s chair stand test (number of repetitions).
-
Functional mobility: assessed using the Timed Up and Go (TUG) test (seconds).
-
Aerobic capacity: assessed using the 2 min step test (2MST), recording the number of steps completed.
All tests were conducted according to standardized procedures described by Rikli and Jones, with participants receiving verbal encouragement to ensure maximal performance.

2.6. Quality of Life Assessment

Quality of life was assessed using the World Health Organization Quality of Life questionnaire–brief version (WHOQOL-BREF) [25]:
-
Physical,
-
Psychological,
-
Social relationships,
-
Environment.
Scores were calculated according to standard WHO guidelines, with higher scores indicating better perceived quality of life.

2.7. Isokinetic Strength Assessment

Isokinetic muscle strength of the knee extensors and flexors was assessed using an isokinetic dynamometer (HUMAC NORM Isokinetic Dynamometer System, CSMi Solutions, Stoughton, MA, USA). Prior to testing, participants received standardized instructions regarding the testing procedures and were familiarized with the equipment [26].
Participants were positioned in a seated posture according to the manufacturer’s recommendations, with the trunk, pelvis, and thigh stabilized using straps to minimize compensatory movements [26]. The axis of rotation of the dynamometer was aligned with the lateral femoral condyle of the tested limb to ensure accurate joint positioning throughout the assessment.
Concentric knee extension and flexion contractions were performed at angular velocities of 60°/s and 180°/s, representing strength- and power-oriented testing conditions, respectively. Both lower limbs were evaluated separately, and participants were instructed to exert maximal effort during each repetition while receiving standardized verbal encouragement from the evaluators.
The primary outcomes recorded were peak torque (Nm) and work per repetition (J). For statistical analyses, mean peak torque values were calculated as the average of both limbs. Bilateral asymmetry (%) was determined by calculating the difference between limbs relative to the stronger limb.

2.8. Statistical Analysis

All statistical analyses were performed using R software (2024.09.0+375; Posit Software, PBC, Boston, MA, USA). Data normality was assessed using the Shapiro–Wilk test [27].
Descriptive statistics are presented as mean ± standard deviation for continuous variables and frequencies (%) for categorical variables.
Between-group comparisons according to IPAQ classification were performed using the Kruskal–Wallis test due to non-normal data distribution [28]. When appropriate, Dunn’s post hoc test with Bonferroni correction was applied [29]. Effect sizes were calculated using eta-squared (η2) [30]. Sex-based comparisons were performed using the Mann–Whitney U test due to the non-normal distribution of the data and the independent nature of the groups.
Associations between variables were analyzed using Spearman’s rank correlation coefficient (ρ) [31].
Linear regression analyses were conducted to examine predictors of functional mobility (TUG), including body composition, strength, and demographic variables [32]. Statistical significance was set at p < 0.05.

3. Results

3.1. Participant Characteristics

A total of 63 participants were included in the study. Descriptive characteristics stratified by sex are presented in Table 1. No significant differences were observed between males and females for age, body fat percentage, lower-limb strength, functional mobility (TUG), aerobic capacity, or quality of life domains (all p > 0.05). As no significant sex differences were observed for the primary study variables, subsequent analyses examining IPAQ categories were conducted using the pooled sample.

3.2. Distribution of Physical Activity Levels

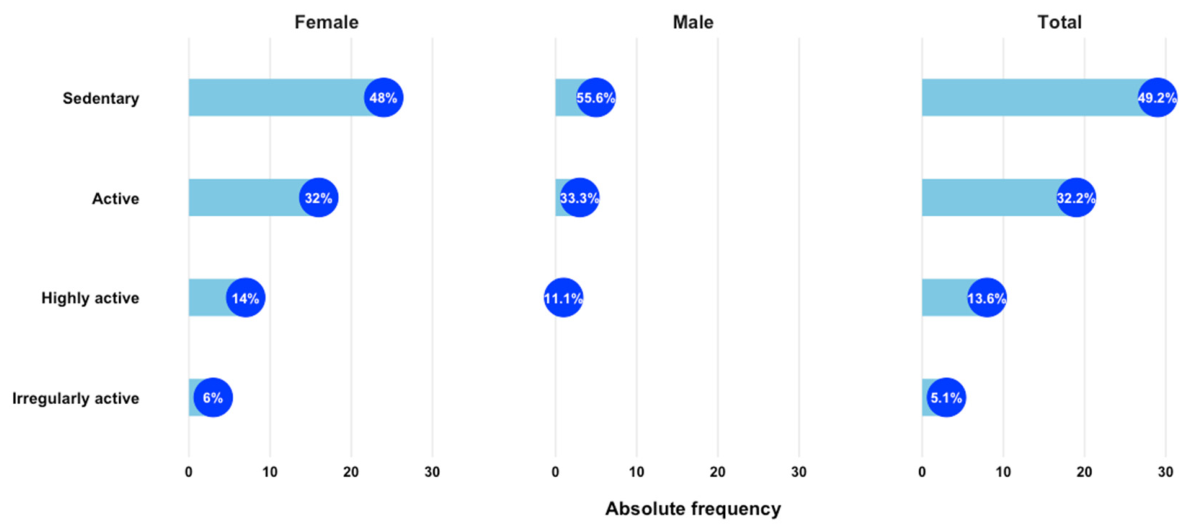
The distribution of physical activity levels according to IPAQ classification is presented in Figure 1. More than half of the participants were classified as sedentary (54.5%), followed by active (28.8%), highly active (12.1%), and irregularly active (4.5%).
No significant association was observed between IPAQ classification and sex (χ2 = 0.68, p = 0.878), although caution is warranted due to low expected frequencies in some categories.

3.3. Functional and Physiological Comparisons Across IPAQ Groups

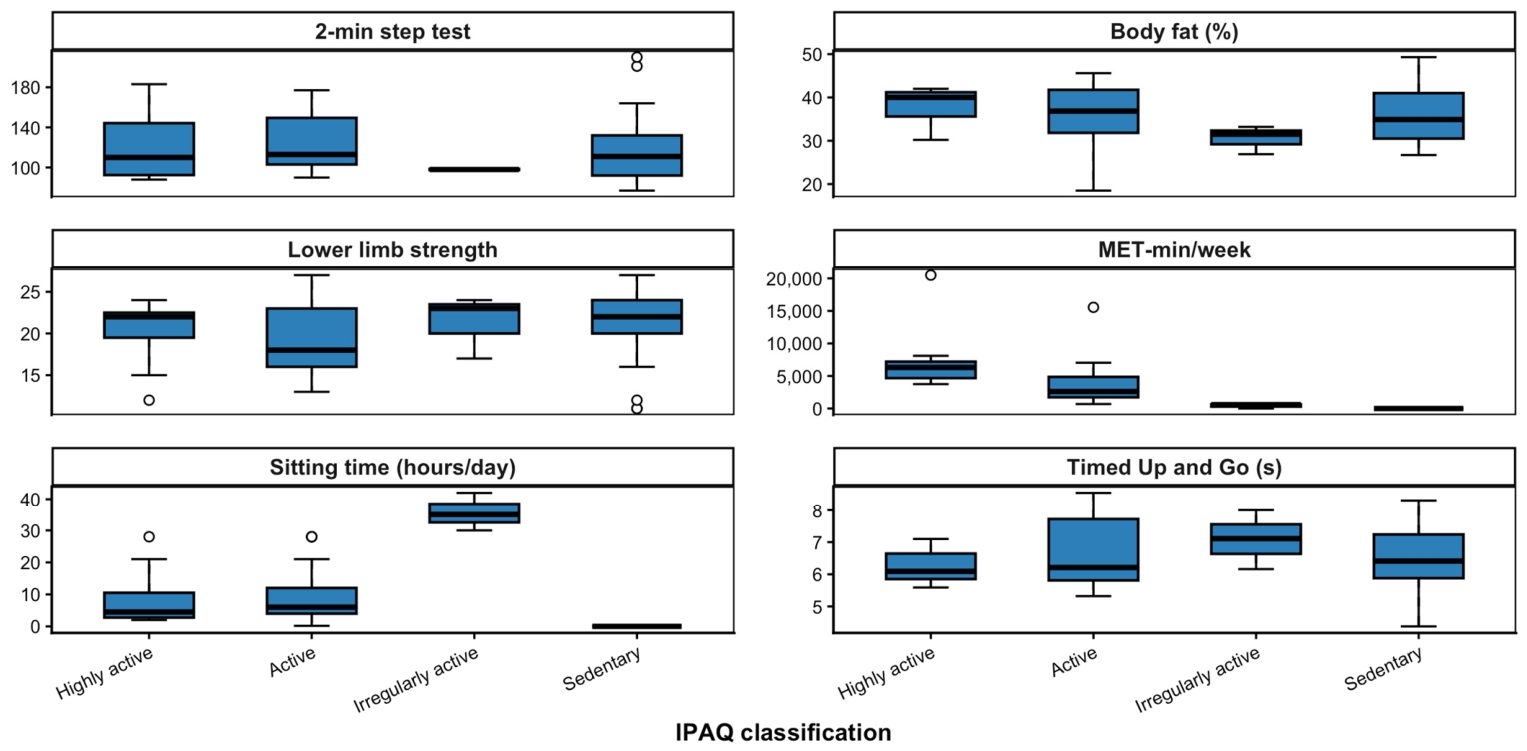
Comparisons of functional fitness, body composition, and physical activity variables across IPAQ categories are presented in Figure 2. No significant differences were observed between groups for lower-limb strength, functional mobility (TUG), body fat percentage, or aerobic capacity (all p > 0.05).
Effect sizes were trivial, indicating minimal practical differences between IPAQ categories. Post hoc analyses (Dunn’s test with Bonferroni correction) confirmed the absence of significant pairwise differences between groups (all adjusted p > 0.05).

3.4. Distribution of MET and Sitting Time

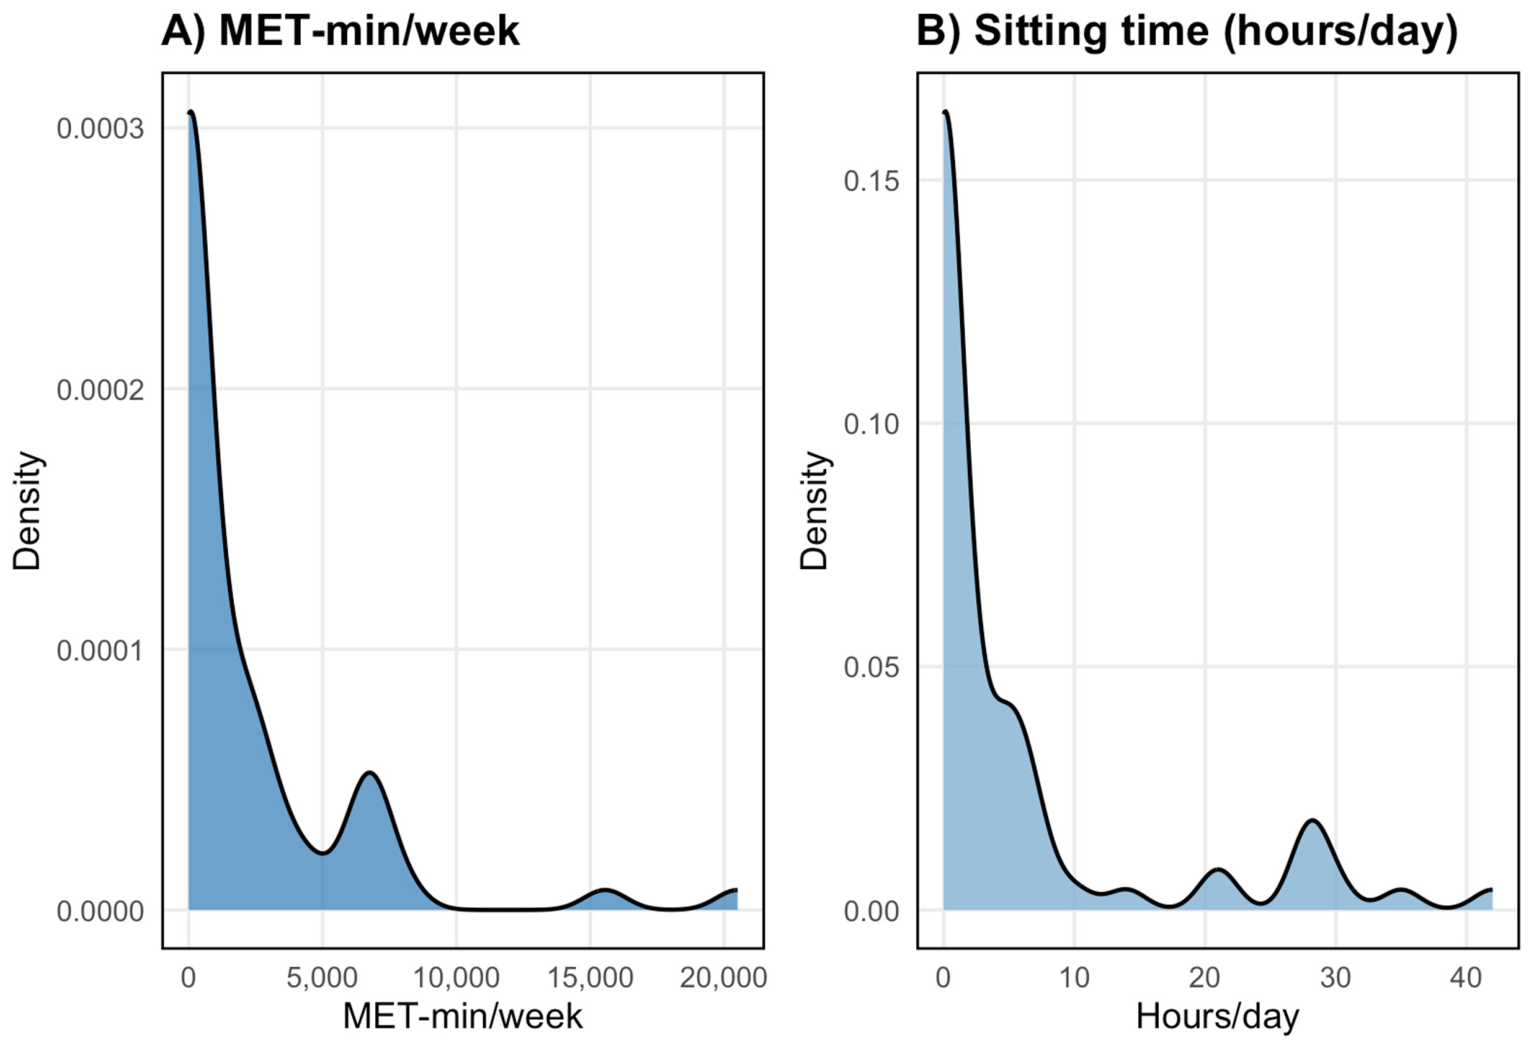
The distribution of total physical activity (MET-min/week) and sitting time is illustrated in Figure 3. MET values showed a highly skewed distribution, with a large proportion of participants reporting very low or zero activity levels, consistent with the high prevalence of sedentary classification.

3.5. Correlation Analysis

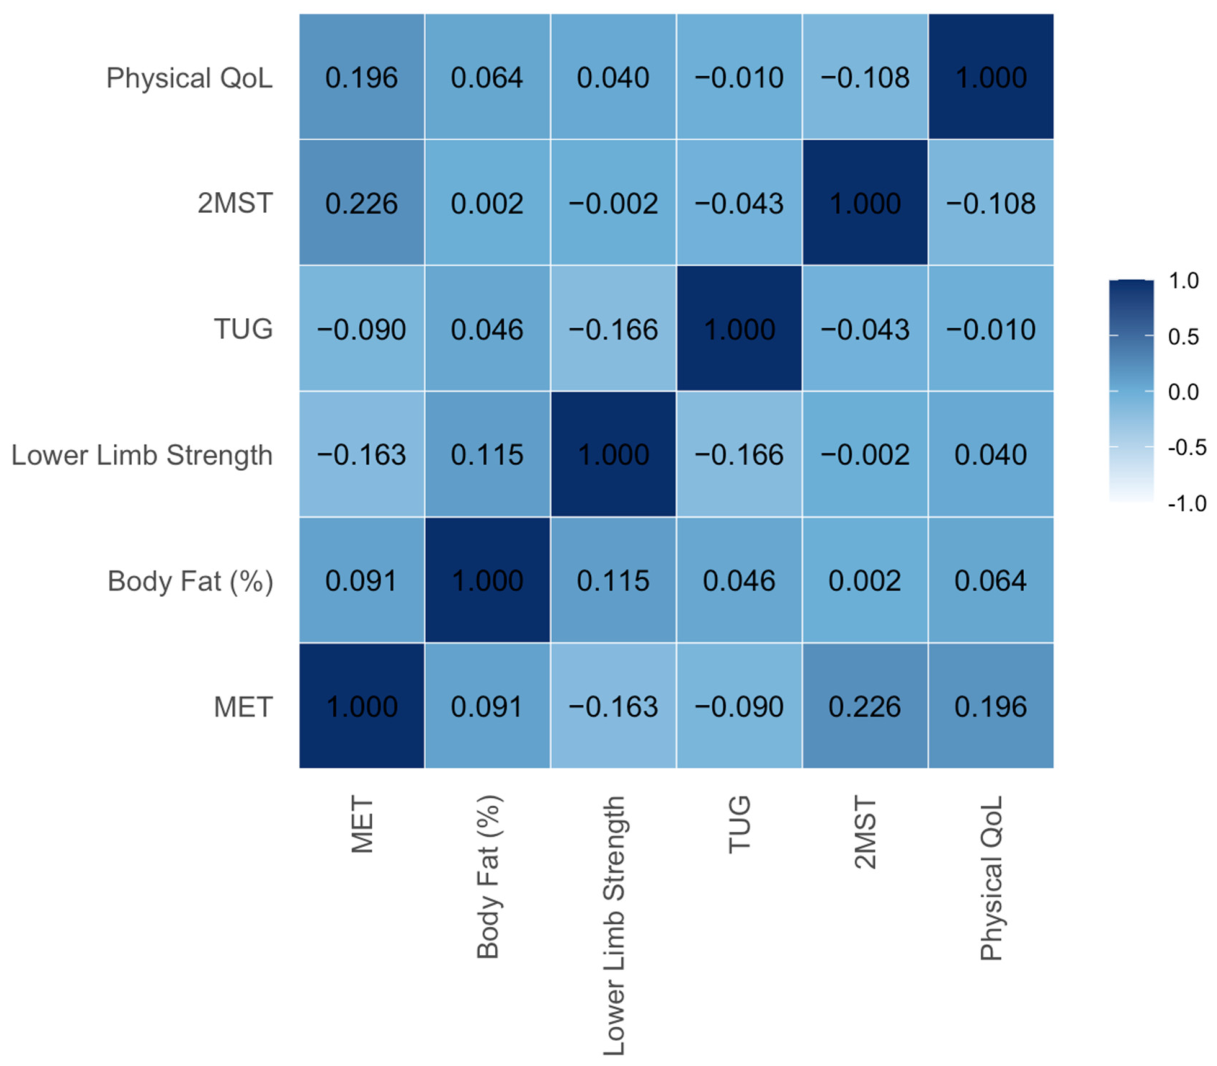
The correlation matrix between key variables is presented in Figure 4. Spearman correlation analysis revealed weak and non-significant associations between physical activity, body composition, and functional fitness variables.
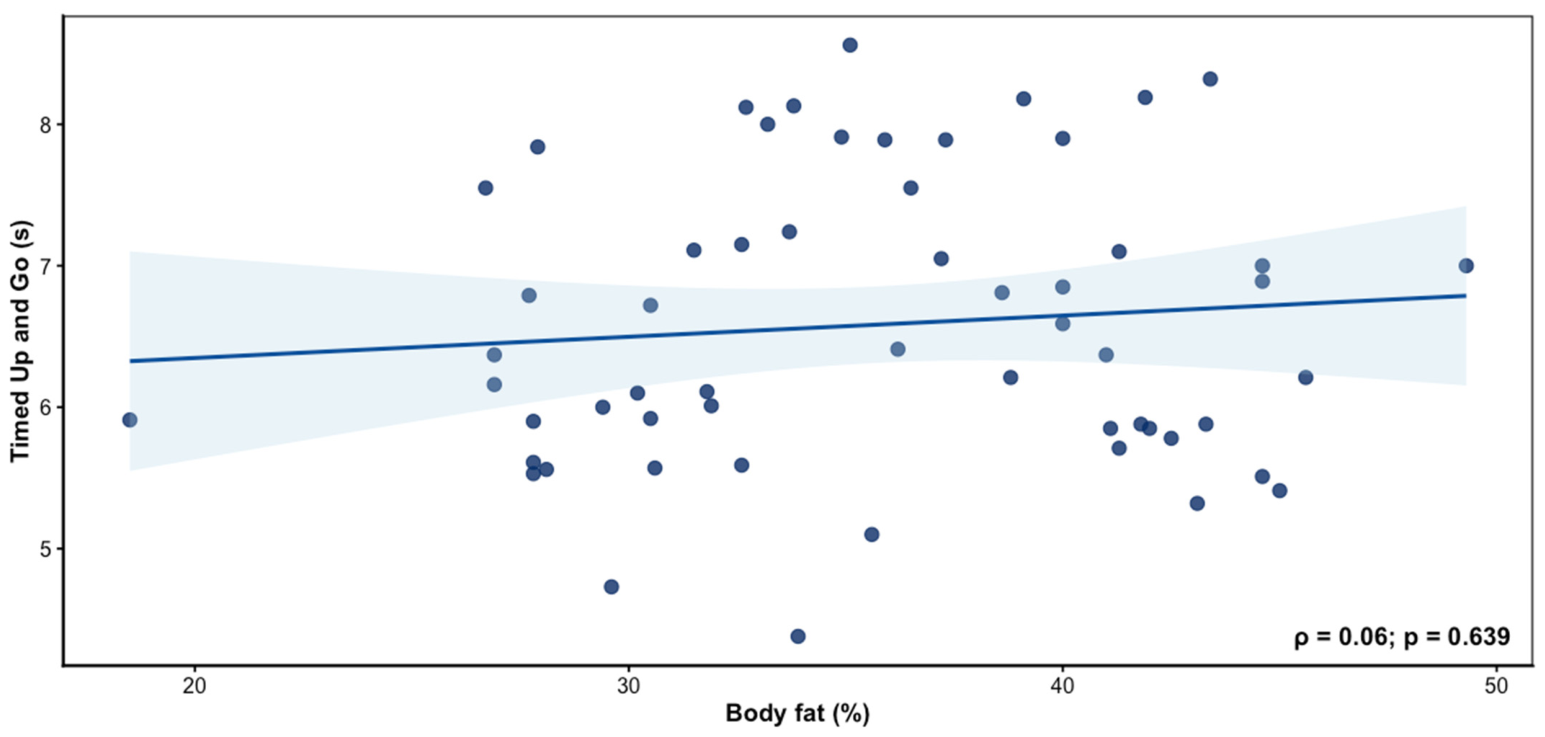
Specifically, no significant relationships were observed between body fat and TUG (ρ = 0.06, p = 0.639), lower-limb strength and TUG (ρ = −0.18, p = 0.166), MET and lower-limb strength (ρ = −0.17, p = 0.198), or aerobic capacity and TUG (ρ = −0.07, p = 0.610).
Overall, these findings suggest limited interaction between physical activity, body composition, and functional performance in this sample.

3.6. Body Fat and Functional Mobility

The relationship between body fat percentage and functional mobility is shown in Figure 5. Linear regression analysis indicated that body fat percentage was not a significant predictor of TUG performance (β = 0.015, p = 0.480), explaining less than 1% of the variance (R2 = 0.009).

3.7. Knee Extensor Asymmetry

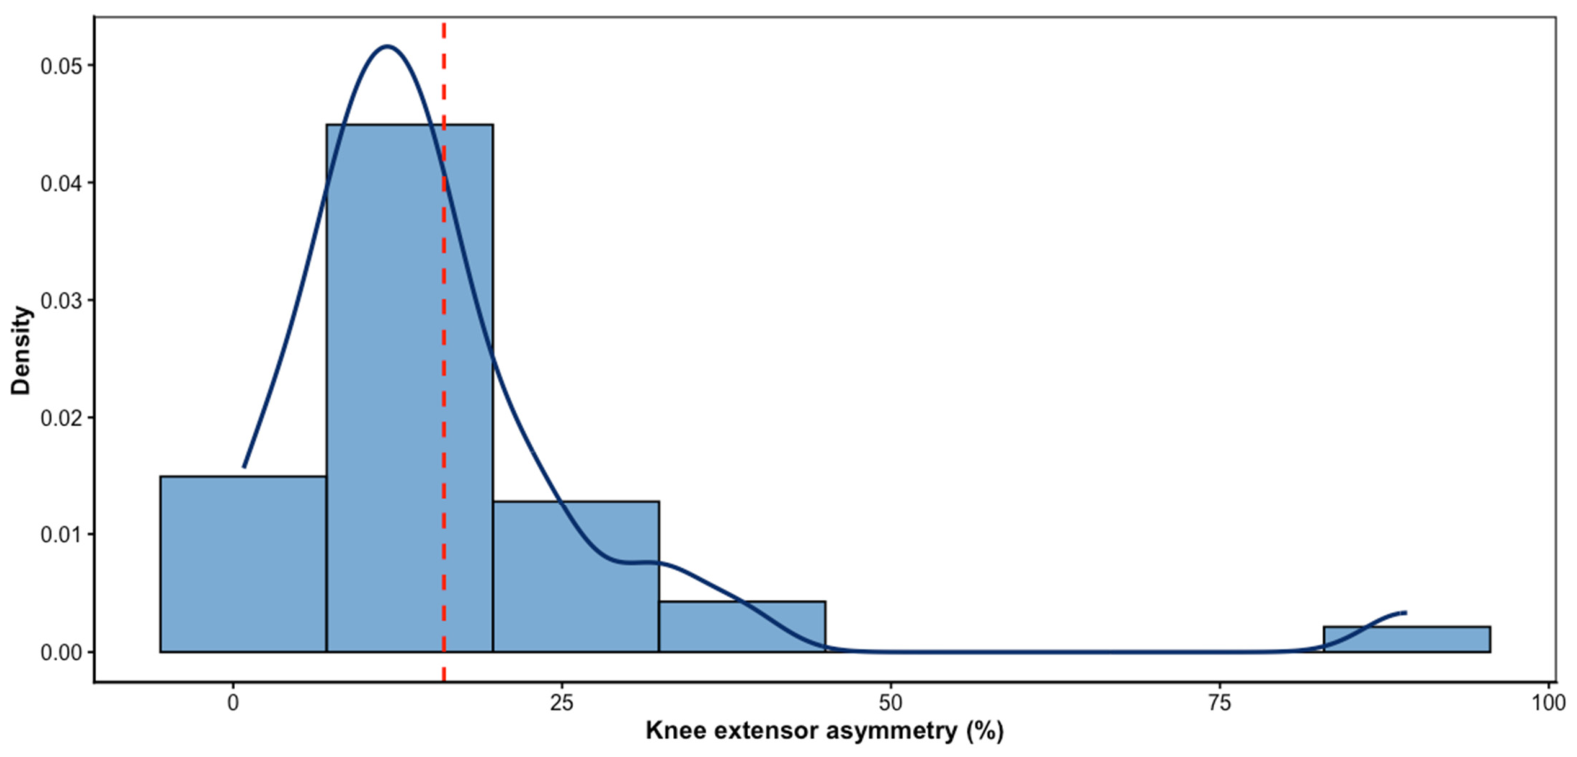
The distribution of knee extensor asymmetry is presented in Figure 6. Asymmetry values showed moderate variability, with most participants clustering around lower asymmetry levels, but with some higher values indicating potential muscular imbalance. The distribution was slightly right-skewed.

3.8. Isokinetic Strength and Functional Mobility

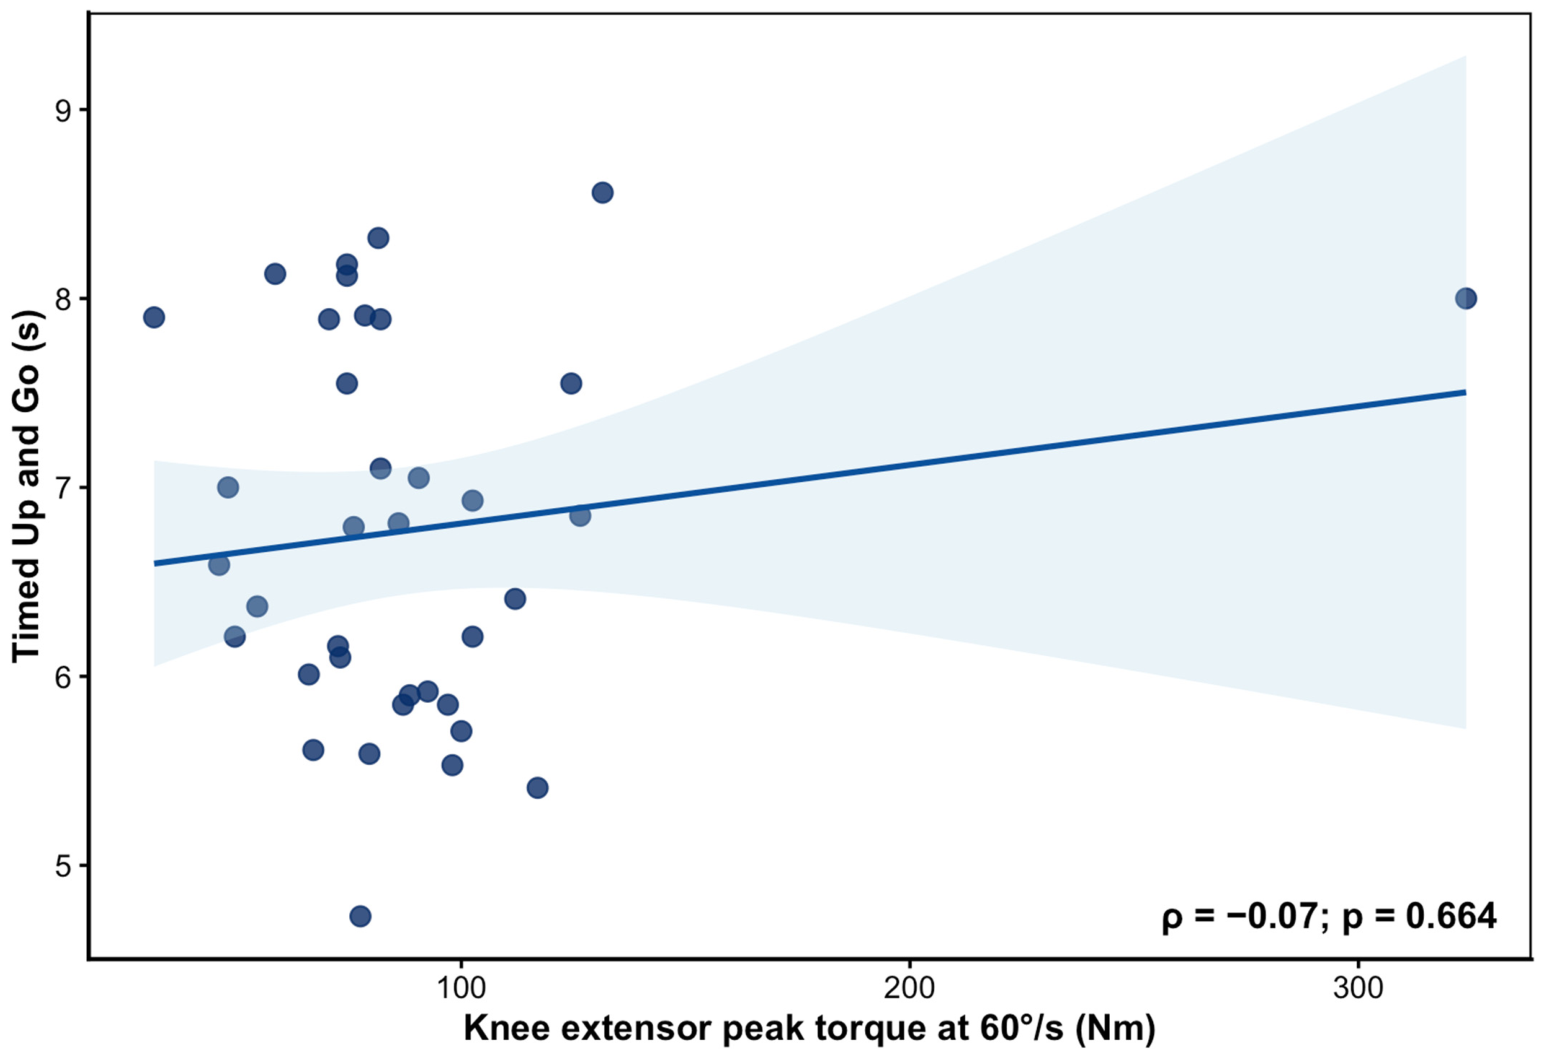
The association between isokinetic peak torque and functional mobility is presented in Figure 7. No significant relationship was observed between knee extensor peak torque at 60°/s and TUG performance (ρ = −0.07, p = 0.664).
Linear regression analysis confirmed the absence of a significant association (β = −0.041, p = 0.180), with the model explaining only 3.1% of the variance (R2 = 0.031).

3.9. Multivariate Model

A multiple linear regression model including body fat percentage, lower-limb strength, age, and sex did not identify any significant predictors of TUG performance (model p = 0.646). The model explained only 4.6% of the variance (R2 = 0.046), indicating limited explanatory power of these variables for functional mobility in this sample.

4. Discussion

The present study investigated the relationship between physical activity levels, body composition, functional fitness, and isokinetic strength in older adults. The main findings demonstrated that IPAQ classification was not associated with significant differences in body composition, lower-limb strength, aerobic capacity, or functional mobility. In addition, correlation and regression analyses revealed weak associations between physical activity, adiposity, muscle strength, and TUG performance, suggesting limited explanatory capacity of these variables for functional mobility in this sample.
One of the main findings was the absence of significant differences between IPAQ categories for lower-limb strength, functional mobility assessed by TUG, body fat percentage, and aerobic capacity measured by the 2 min step test. Additionally, effect sizes were trivial, reinforcing the limited discriminatory capacity of self-reported physical activity classification in this cohort. Although physically active individuals are generally expected to present superior functional performance and healthier body composition profiles, the present findings suggest that IPAQ classification alone may have limited sensitivity to detect physiological and neuromuscular differences in relatively homogeneous older adults [33].
These findings are partially supported by previous investigations reporting limitations in the validity of self-reported physical activity instruments. Arumugam et al. observed weak associations between IPAQ-SF and accelerometer-derived physical activity measures, with correlations ranging from ρ = 0.2 to ρ = 0.4 depending on activity intensity. Moreover, sitting time showed no significant correlation with objective measurements, indicating discrepancies between perceived and objectively measured activity behavior [34]. Such limitations may partially explain the weak associations identified in the present study [34]. Furthermore, the predominance of sedentary and insufficiently active participants may have reduced variability in physical activity exposure, limiting the ability to detect meaningful differences between groups. Together, these findings suggest that self-reported physical activity classifications may have limited sensitivity to distinguish physiological and functional differences in relatively homogeneous older populations.
Similarly, linear regression analysis demonstrated very low explanatory power of body fat percentage for TUG performance, explaining less than 1% of the variance. These findings differ from longitudinal evidence reported by Mikkola et al., who demonstrated that greater adiposity measures were significantly associated with poorer physical performance over a 10-year follow-up in older adults [35]. Similarly, Ortega-Alonso et al. reported inverse correlations between body fat percentage and mobility performance in older women [36].
The discrepancy between those studies and the present findings may be explained by methodological and sample-related differences. Unlike longitudinal cohorts with large sample sizes and objective mobility outcomes, the current study used a cross-sectional design with relatively homogeneous community-dwelling older adults. Additionally, TUG performance is influenced by multiple factors beyond adiposity alone, including balance control, motor coordination, neuromuscular efficiency, and cognitive processing [37]. Therefore, isolated body composition measures may have limited ability to explain functional mobility variability in relatively functional older populations.
Similarly, the relationship between lower-limb strength and TUG performance demonstrated low explanatory capacity in the present sample. These findings contrast with studies reporting significant associations between muscle strength and mobility outcomes in older adults. Yeh et al., analyzing more than 20,000 older adults in Taiwan, demonstrated that higher lower-limb strength quartiles were strongly associated with better dynamic balance performance [38]. Likewise, Moura et al. reported that peak torque and muscular power of knee extensors significantly explained mobility and dynamic balance among inactive older women [39].
The limited associations observed in the present study may be related to differences in assessment methods and participant characteristics. While previous investigations frequently evaluated frailer or more heterogeneous populations, the current sample consisted predominantly of relatively independent community-dwelling older adults with limited variability in functional performance. Furthermore, the chair stand test used to estimate lower-limb strength may not fully capture neuromuscular qualities such as power production, explosive strength, or rate of force development, which may be more directly associated with mobility performance [40].
The isokinetic and asymmetry findings further reinforce the multifactorial nature of functional mobility in older adults. Neither knee extensor peak torque nor asymmetry measures demonstrated meaningful associations with TUG performance in the present sample. Although previous investigations have reported associations between muscle strength asymmetry, balance deficits, and mobility impairment in older populations [35,37], functional tasks such as TUG depend on integrated neuromuscular responses involving coordination, balance control, anticipatory postural adjustments, and rapid transitions between movement phases [34]. Therefore, isolated laboratory-based strength measures may have limited ability to explain mobility performance in relatively functional community-dwelling older adults.
This study has several limitations that should be considered. First, the cross-sectional design precludes causal inferences. Second, the use of self-reported physical activity may have introduced reporting bias and limited the sensitivity of activity classification. Self-reported measures such as the IPAQ are susceptible to recall bias and social desirability bias, which may result in overestimation of physical activity levels. Consequently, the questionnaire may not accurately reflect actual movement behaviors, potentially attenuating associations with objective measures of body composition, strength, and functional performance. Third, missing data across some variables, the relatively small sample size and the unequal distribution across IPAQ categories may have reduced statistical power and limited the ability to detect subtle associations. Additionally, the marked imbalance between female and male participants may have further reduced the statistical power of sex-based comparisons and limited the ability to detect potentially meaningful differences between sexes. Furthermore, the unequal distribution across IPAQ categories, particularly the small number of participants classified as irregularly active and highly active, may have reduced statistical power and limited the detection of meaningful between-group differences.
Therefore, the absence of significant findings should be interpreted cautiously and not necessarily as evidence of no relationship. Moreover, as an exploratory cross-sectional study, the primary purpose was to identify potential patterns and associations rather than to provide definitive evidence regarding the relationships between physical activity, body composition, and functional performance. Consequently, the findings should be interpreted as preliminary and require confirmation in larger and longitudinal studies. Future studies should prioritize longitudinal designs and objective measures of physical activity, such as accelerometry, to better understand the relationship between activity patterns and functional performance in older adults. Additionally, incorporating more sensitive neuromuscular and functional assessments may help clarify the multifactorial mechanisms underlying mobility performance in aging populations.

5. Conclusions

Physical activity levels assessed by the IPAQ were not significantly associated with functional fitness, body composition, or muscle strength in older adults. In contrast, objective measures such as isokinetic strength showed a greater contribution to functional mobility. These findings suggest that muscle strength may be a more relevant determinant of functional performance than self-reported physical activity in this population. As an exploratory cross-sectional study, these results should be interpreted with caution and considered hypothesis-generating rather than confirmatory. Future studies should incorporate objective measures and longitudinal designs to better understand these relationships. Overall, these exploratory findings suggest that self-reported physical activity may have limited sensitivity to distinguish objective functional and physiological differences in community-dwelling older adults.

Author Contributions

Conceptualization, A.S., P.F., T.P. and A.M.M.; methodology, A.S., S.C., J.M. and A.M.M.; software, A.S.; validation, A.S., P.F. and A.M.M.; formal analysis, A.S. and P.F.; investigation, A.S., S.C. and J.M.; resources, A.M.M., J.E.T. and P.F.; data curation, A.S.; writing—original draft preparation, A.S.; writing—review and editing, S.C., J.M., L.B.L., J.E.T., P.F., J.L. and A.M.M.; visualization, A.S. and P.F.; supervision, P.F. and A.M.M.; project administration, A.M.M.; funding acquisition, A.M.M., P.F. and J.E.T. All authors have read and agreed to the published version of the manuscript.

Funding

This work was supported by national funds (FCT—Portuguese Foundation for Science and Technology) under the project UID/06157/2025.

Institutional Review Board Statement

The study was conducted in accordance with the Declaration of Helsinki and approved by the Ethics Committee of the Instituto Politécnico de Bragança (protocol code 501020) 25 October 2024.

Informed Consent Statement

Informed consent was obtained from all subjects involved in the study.

Data Availability Statement

The data presented in this study are available from the corresponding author upon reasonable request. The data are not publicly available due to privacy and ethical restrictions involving participant information.

Conflicts of Interest

The authors declare no conflicts of interest.

References

  1. Wilkinson, D.J.; Piasecki, M.; Atherton, P.J. The age-related loss of skeletal muscle mass and function: Measurement and physiology of muscle fibre atrophy and muscle fibre loss in humans. Ageing Res. Rev. 2018, 47, 123–132. [Google Scholar] [CrossRef] [PubMed]
  2. Orioli, L.; Thissen, J.-P.; Loumaye, A. Changes in body composition, muscle function, and muscle insulin sensitivity induced by obesity and bariatric surgery: Implications for sarcopenic obesity. Clin. Nutr. 2026, 56, 106547. [Google Scholar] [CrossRef] [PubMed]
  3. Trombetti, A.; Reid, K.F.; Hars, M.; Herrmann, F.R.; Pasha, E.; Phillips, E.M.; Fielding, R.A. Age-associated declines in muscle mass, strength, power, and physical performance: Impact on fear of falling and quality of life. Osteoporos. Int. 2016, 27, 463–471. [Google Scholar] [CrossRef] [PubMed]
  4. Bordbar, S.; Ahmadinejad, P.; Bahmaei, J.; Vejdani, M.; Yusefi, A.R. Examining the severity of disability and vulnerability among older adults and its impact on elder abuse: A cross-sectional study. Sci. Rep. 2025, 15, 16999. [Google Scholar] [CrossRef] [PubMed]
  5. Bimou, C.; Harel, M.; Laubarie-Mouret, C.; Cardinaud, N.; Charenton-Blavignac, M.; Toumi, N.; Trimouillas, J.; Gayot, C.; Boyer, S.; Hebert, R.; et al. Patterns and predictive factors of loss of the independence trajectory among community-dwelling older adults. BMC Geriatr. 2021, 21, 142. [Google Scholar] [CrossRef] [PubMed]
  6. Jaul, E.; Barron, J. Age-Related Diseases and Clinical and Public Health Implications for the 85 Years Old and Over Population. Front. Public Health 2017, 5, 335. [Google Scholar] [CrossRef] [PubMed]
  7. Xu, Q.; Ou, X.; Li, J. The risk of falls among the aging population: A systematic review and meta-analysis. Front. Public Health 2022, 10, 902599. [Google Scholar] [CrossRef] [PubMed]
  8. Chen, C.; Freire, C.; Fu, Z.; Teixeira, I.; Adegas, M.; Gomes, R.; Rabaçal, R.; Silva, S.; Malheiro, A.; Leite, L.B.; et al. Impact of physical exercise interventions on functional fitness in older adults. Front. Med. 2026, 12, 1732129. [Google Scholar] [CrossRef] [PubMed]
  9. Qiu, Y.; Fernández-García, B.; Lehmann, H.I.; Li, G.; Kroemer, G.; López-Otín, C.; Xiao, J. Exercise attenuates the hallmarks of aging: Novel perspectives. J. Sport Health Sci. 2026, 15, 101108. [Google Scholar] [CrossRef] [PubMed]
  10. Daskalopoulou, C.; Stubbs, B.; Kralj, C.; Koukounari, A.; Prince, M.; Prina, A.M. Physical activity and healthy ageing: A systematic review and meta-analysis of longitudinal cohort studies. Ageing Res. Rev. 2017, 38, 6–17. [Google Scholar] [CrossRef] [PubMed]
  11. Albrecht, B.M.; Stalling, I.; Recke, C.; Doerwald, F.; Bammann, K. Associations between older adults’ physical fitness level and their engagement in different types of physical activity: Cross-sectional results from the OUTDOOR ACTIVE study. BMJ Open 2023, 13, e068105. [Google Scholar] [CrossRef] [PubMed]
  12. Li, X.; Wang, P.; Jiang, Y.; Yang, Y.; Wang, F.; Yan, F.; Li, M.; Peng, W.; Wang, Y. Physical activity and health-related quality of life in older adults: Depression as a mediator. BMC Geriatr. 2024, 24, 26. [Google Scholar] [CrossRef] [PubMed]
  13. Franssen, W.M.A.; Nieste, I.; Verboven, K.; Eijnde, B.O. Sedentary behaviour and cardiometabolic health: Integrating the potential underlying molecular health aspects. Metabolism 2025, 170, 156320. [Google Scholar] [CrossRef] [PubMed]
  14. Madden, K.M.; Feldman, B.; Chase, J. Sedentary Time and Metabolic Risk in Extremely Active Older Adults. Diabetes Care 2021, 44, 194–200. [Google Scholar] [CrossRef] [PubMed]
  15. Strain, T.; Flaxman, S.; Guthold, R.; Semenova, E.; Cowan, M.; Riley, L.M.; Bull, F.C.; Stevens, G.A.; Raheem, R.A.; Agoudavi, K.; et al. National, regional, and global trends in insufficient physical activity among adults from 2000 to 2022: A pooled analysis of 507 population-based surveys with 5·7 million participants. Lancet Glob. Health 2024, 12, e1232–e1243. [Google Scholar] [CrossRef] [PubMed]
  16. Hagströmer, M.; Oja, P.; Sjöström, M. The International Physical Activity Questionnaire (IPAQ): A study of concurrent and construct validity. Public Health Nutr. 2006, 9, 755–762. [Google Scholar] [CrossRef] [PubMed]
  17. Sember, V.; Meh, K.; Sorić, M.; Starc, G.; Rocha, P.; Jurak, G. Validity and Reliability of International Physical Activity Questionnaires for Adults across EU Countries: Systematic Review and Meta Analysis. Int. J. Environ. Res. Public Health 2020, 17, 7161. [Google Scholar] [CrossRef] [PubMed]
  18. Martínez-Hernández, B.M.; Rosas-Carrasco, O.; López-Teros, M.; González-Rocha, A.; Muñoz-Aguirre, P.; Palazuelos-González, R.; Ortíz-Rodríguez, A.; Luna-López, A.; Denova-Gutiérrez, E. Association between physical activity and physical and functional performance in non-institutionalized Mexican older adults: A cohort study. BMC Geriatr. 2022, 22, 388. [Google Scholar] [CrossRef] [PubMed]
  19. Cheng, I.-F.; Kuo, L.-C.; Tsai, Y.-J.; Su, F.-C. The Comparisons of Physical Functional Performances between Older Adults with and without Regular Physical Activity in Two Different Living Settings. Int. J. Environ. Res. Public Health 2021, 18, 3561. [Google Scholar] [CrossRef] [PubMed]
  20. Husu, P.; Vähä-Ypyä, H.; Tokola, K.; Sievänen, H.; Rocha, P.; Vasankari, T. Reliability and Validity of Self-Reported Questionnaires Assessing Physical Activity and Sedentary Behavior in Finland. Int. J. Environ. Res. Public Health 2024, 21, 686. [Google Scholar] [CrossRef] [PubMed]
  21. Sossou, I.; Oliveira, C.; Encarnação, I.; Oliveira, R.; Cerqueira, M.; Moreira, O. Body composition assessment via bioelectrical impedance analysis: Standardized vs. unstandardized pre-assessment protocol. Nutr. Clin. Métabolisme 2026, 40, 103045. [Google Scholar] [CrossRef]
  22. Lee, P.H.; Macfarlane, D.J.; Lam, T.H.; Stewart, S.M. Validity of the International Physical Activity Questionnaire Short Form (IPAQ-SF): A systematic review. Int. J. Behav. Nutr. Phys. Act. 2011, 8, 115. [Google Scholar] [CrossRef] [PubMed]
  23. Wolin, K.Y.; Heil, D.P.; Askew, S.; Matthews, C.E.; Bennett, G.G. Validation of the International Physical Activity Questionnaire-Short Among Blacks. J. Phys. Act. Health 2008, 5, 746–760. [Google Scholar] [CrossRef] [PubMed]
  24. Rikli, R.; Jones, J. Development and validation of a functional fitness test for a community-residing adults. J. Aging Phys. Act. 1999, 7, 129–161. [Google Scholar] [CrossRef]
  25. The WHOQOL Group. Development of the World Health Organization WHOQOL-BREF quality of life assessment. Psychol. Med. 1998, 28, 551–558. [Google Scholar] [CrossRef] [PubMed]
  26. Liu, K.; Yin, L.; Zhang, Y.; Liu, G.; Fang, P.; Ma, Y.; Huang, L. Normative isokinetic knee strength values and prediction models in non-athletic Chinese adults. Front. Bioeng. Biotechnol. 2025, 13, 1573267. [Google Scholar] [CrossRef] [PubMed]
  27. Mishra, P.; Pandey, C.M.; Singh, U.; Gupta, A.; Sahu, C.; Keshri, A. Descriptive Statistics and Normality Tests for Statistical Data. Ann. Card. Anaesth. 2019, 22, 67–72. [Google Scholar] [CrossRef] [PubMed]
  28. Chan, Y.; Walmsley, R.P. Learning and understanding the Kruskal-Wallis one-way analysis-of-variance-by-ranks test for differences among three or more independent groups. Phys. Ther. 1997, 77, 1755–1762. [Google Scholar] [CrossRef] [PubMed]
  29. Mason, L.; Otero, M.; Andrews, A. Cochran’s Q Test of Stimulus Overselectivity within the Verbal Repertoire of Children with Autism. Perspect. Behav. Sci. 2021, 45, 101–121. [Google Scholar] [CrossRef] [PubMed]
  30. Lakens, D. Calculating and reporting effect sizes to facilitate cumulative science: A practical primer for t-tests and ANOVAs. Front. Psychol. 2013, 4, 863. [Google Scholar] [CrossRef] [PubMed]
  31. Schober, P.; Boer, C.; Schwarte, L.A. Correlation Coefficients: Appropriate Use and Interpretation. Anesth. Analg. 2018, 126, 1763. [Google Scholar] [CrossRef] [PubMed]
  32. Roustaei, N. Application and interpretation of linear-regression analysis. Med. Hypothesis Discov. Innov. Ophthalmol. 2024, 13, 151–159. [Google Scholar] [CrossRef] [PubMed]
  33. Alkhamis, B.A.; Reddy, R.S.; Alshahrani, M.S.; Al Salim, Z.; Alyazedi, F.M.; Elshiwi, A.M.; Koura, G.M.; Sangadala, D.R.; Mukherjee, D.; Al Adal, S.Y.; et al. Association between physical activity levels and functional recovery, quality of life, and psychological well-being in patients undergoing physiotherapy for musculoskeletal disorders: A cross-sectional study. PLoS ONE 2026, 21, e0341335. [Google Scholar] [CrossRef] [PubMed]
  34. Arumugam, A.; Alsaafin, N.; Shalash, R.J.; Qadah, R.M.; Al-Sharman, A.; Moustafa, I.M.; Shousha, T.M.; Kumaran, S.D.; Migliorini, F.; Maffulli, N. Concurrent validity between self-reported International Physical Activity Questionnaire Short Form and Fibion accelerometer data among young adults in the UAE. Eur. J. Med. Res. 2024, 29, 426. [Google Scholar] [CrossRef] [PubMed]
  35. Mikkola, T.M.; von Bonsdorff, M.B.; Salonen, M.K.; Simonen, M.; Pohjolainen, P.; Osmond, C.; Perälä, M.-M.; Rantanen, T.; Kajantie, E.; Eriksson, J.G. Body composition as a predictor of physical performance in older age: A ten-year follow-up of the Helsinki Birth Cohort Study. Arch. Gerontol. Geriatr. 2018, 77, 163–168. [Google Scholar] [CrossRef] [PubMed]
  36. Ortega-Alonso, A.; Sipilä, S.; Kujala, U.M.; Kaprio, J.; Rantanen, T. Body fat and mobility are explained by common genetic and environmental influences in older women. Obesity 2008, 16, 1616–1621. [Google Scholar] [CrossRef] [PubMed]
  37. Benavent-Caballer, V.; Sendín, A.; Lison, J.; Rosado-Calatayud, P.; Amer-Cuenca, J.; Coloma, S.; Ortí, E. Physical factors underlying the Timed “Up and Go” test in older adults. Geriatr. Nurs. 2015, 37, 122–127. [Google Scholar] [CrossRef] [PubMed]
  38. Yeh, P.-C.; Syu, D.-K.; Ho, C.-C.; Lee, T.-S. Associations of lower-limb muscle strength performance with static and dynamic balance control among older adults in Taiwan. Front. Public Health 2024, 12, 1226239. [Google Scholar] [CrossRef] [PubMed]
  39. Moura, T.G.d.; Nagata, C.d.A.; Garcia, P.A. The influence of isokinetic peak torque and muscular power on the functional performance of active and inactive community-dwelling elderly: A cross-sectional study. Braz. J. Phys. Ther. 2020, 24, 256–263. [Google Scholar] [CrossRef] [PubMed]
  40. Zhu, R.T.-L.; Zuo, J.J.-J.; Li, K.-J.; Lam, F.M.H.; Wong, A.Y.L.; Yang, L.; Bai, X.; Wong, M.S.; Kwok, T.; Zheng, Y.-P.; et al. Association of lower-limb strength with different fall histories or prospective falls in community-dwelling older people: A systematic review and meta-analysis. BMC Geriatr. 2025, 25, 83. [Google Scholar] [CrossRef] [PubMed]
Figure 1. Absolute and relative distribution of physical activity levels based on IPAQ classification across sex and the total sample.
Jal 06 00052 g001
Figure 2. Distribution of functional fitness, body composition, and physical activity indicators according to IPAQ classification.
Jal 06 00052 g002
Figure 3. Density distribution of weekly energy expenditure (MET-min/week) and daily sitting time (hours/day) in the study sample.
Jal 06 00052 g003
Figure 4. Spearman correlation matrix of physical activity, body composition, functional fitness, and quality of life variables.
Jal 06 00052 g004
Figure 5. Association between body fat percentage and functional mobility (Timed Up and Go test).
Jal 06 00052 g005
Figure 6. Distribution of knee extensor asymmetry (%) in older adults. The red dashed vertical line indicates the mean knee extensor asymmetry.
Jal 06 00052 g006
Figure 7. Association between knee extensor peak torque at 60°/s and functional mobility (Timed Up and Go test).
Jal 06 00052 g007
Table 1. Descriptive characteristics of the study participants according to sex.
CharacteristicOverall
N = 59 1
Female
N = 50 1
Male
N = 9 1
p-Value 2
Age (years)70.4 ± 6.670.6 ± 5.969.4 ± 10.0>0.9
% Body Fat35.7 ± 6.535.6 ± 6.636.2 ± 5.8>0.9
Lower-Limb Strength (reps.)20.5 ± 4.320.3 ± 4.521.1 ± 3.60.7
TUG (sec.)6.58 ± 1.006.59 ± 1.016.52 ± 0.98>0.9
2MST (reps.)120 ± 32123 ± 33108 ± 220.3
Physical Domain4.00 ± 0.573.98 ± 0.584.16 ± 0.530.3
1 Mean ± SD; 2 Mann–Whitney U test.
Disclaimer/Publisher’s Note: The statements, opinions and data contained in all publications are solely those of the individual author(s) and contributor(s) and not of MDPI and/or the editor(s). MDPI and/or the editor(s) disclaim responsibility for any injury to people or property resulting from any ideas, methods, instructions or products referred to in the content.