Article

Quantitative and Qualitative Characterization of Food Waste for Circular Economy Strategies in the Restaurant Sector of Riobamba, Ecuador: A Case Study Approach

by
Angélica Saeteros-Hernández
1,*,
Francisco Chalen-Moreano
1,
Ronald Zurita-Gallegos
1,
Pedro Badillo-Arévalo
1,
Mayra Granizo-Villacres
2,
Carlos Cevallos-Hermida
2 and
Diego Viteri-Nuñez
2
1
Faculty of Public Health, Escuela Superior Politécnica de Chimborazo, Km 1 ½ Panamericana Sur, Riobamba 060155, Ecuador
2
Independent Researcher, Riobamba 060155, Ecuador
*
Author to whom correspondence should be addressed.
Biomass 2025, 5(2), 18; https://doi.org/10.3390/biomass5020018
Submission received: 6 February 2025 / Revised: 10 March 2025 / Accepted: 18 March 2025 / Published: 25 March 2025

Abstract

:
The aim of this study is the quantitative and qualitative characterization of food waste from the restaurant sector in Riobamba, Ecuador as part of circular economy efforts. A weekly analysis of waste generation data collected from 13 participating restaurants showed that the average daily food waste generated was 18.48 kg/restaurant/day. The highest percentage (55%) was produced by organic waste, which was primarily composed of waste from vegetables. Plastics represented most of the recyclable waste (21%), and 24% of the waste was disposable. With a low dry matter content of 24.33 ± 5.12% and an average moisture level of 75.68 ± 5.12%, the high organic content indicates its potential for value-adding through biological recycling processes like anaerobic digestion and composting. Fruit and vegetable waste had high moisture levels (80.3 ± 2.54% and 81.2 ± 2.75%, respectively), which made them perfect for composting and biogas production. However, the moisture and dry matter contents differed greatly amongst the waste categories. The increased dry matter concentration of animal protein waste (54.5 ± 4.30%) indicated that it may be converted into products with added value, such as animal meal and oils. Plant protein waste needs to be processed quickly to avoid spoiling because of its extraordinarily high moisture content (95.7 ± 3.20%) and low dry matter (4.3 ± 3.20%). The findings underscore the necessity for focused measures, such as composting, anaerobic digestion, and enhanced recycling, to optimize resource recovery and mitigate environmental consequences.

1. Introduction

Food waste (FW) represents a significant global challenge, impacting social, economic, and environmental spheres [1]. FW or food loss (FL) is measured only for products which are directed toward human consumption, excluding feed and parts of products which are not edible. Per definition, FW and FL are the masses of food lost or wasted in the part of food chains leading to “edible products going to human consumption”. Therefore, food which was originally meant for human consumption but which, through fortuity, ends up out of the human food chain is considered FW or FL, even if it is then directed toward a non-food use [2]. The definition of FW includes byproducts and discarded materials from various sources, including households, canteens, hotels, restaurants, catering services, and food-related industries. This encompasses both consumable and non-consumable portions of food discarded at different stages of the food supply chain (FSC). These discarded items can be salvaged for secondary use or completely wasted [3].
FW also refers to reduction in the amount or quality of food brought about by the choices and activities of retailers, food service providers, and consumers, primarily during the final consumer stage of the food supply chain (FSC) [4]. In contrast, food loss (FL) is the reduction in the amount or quality of food due to the actions of food suppliers, excluding retailers, food service providers, and consumers [4]. FL can occur throughout various stages, including processing, delivery, marketing, final utilization, and post-consumption [5,6]. Similarly, FW can arise during production, packing, handling, distribution, and food preparation, whether before, during, or after the cooking process [7]. Inedible or undesirable components such as skins, stems, and foliage frequently contribute to food waste.
The distinction between food waste and food loss is critical. While food waste generally refers to food discarded at the consumer or retail level, “food loss” describes food which is unintentionally reduced in quality or quantity earlier in the food supply chain, often due to spoilage, spillage, or other forms of mishandling during production, storage, or transportation [3,8,9]. This complexity underscores the need for targeted strategies to address inefficiencies at different points in the supply chain as FW has become a global issue, with an increase of over 50% in recent years [10].
Globally, more than 1.3 billion tons of food are discarded annually, accounting for over one third of global production [8]. This wastage occurs throughout the entire food supply chain, with approximately 14% lost between the harvest and commercialization stages [8]. and an estimated 17% wasted during the retail and consumer stages [9,11]. All of these indicators point to inefficiencies within the food chain, requiring solutions to improve efficiency, safety, quality, and sustainability [12].
Zero hunger, Sustainable Development Goal (SDG) 2, remains one of the most pressing global challenges. This goal encompasses multiple targets, including ensuring food security, improving nutrition, increasing smallholder incomes, and promoting sustainable agricultural practices [13,14]. Reducing FW contributes to this effort, since it not only helps fight hunger but also promotes sustainable business practices and lessens environmental problems. To achieve these interrelated aims, experts stress that profound changes in food systems are necessary, including both supply-side interventions like organic farming [14] and demand-side adjustments like changes in consumption patterns [15]. Coordinated actions, such as new investments, efficient market systems, and national, regional, and international support for the SDG agenda, will be necessary for progress [15,16].
Minimizing food waste plays a crucial role in attaining the Sustainable Development Goals (SDGs), particularly for these objectives. Tackling food waste not only contributes to the fight against hunger but also encourages sustainable economic, production, and consumption practices.
Food consumption and waste generation are expected to rise as the global population increases [17,18]. FW is becoming an emerging problem, acting as a potential contaminant of water and land, as well as a significant source of greenhouse gas (GHG) emissions [19]. Minimizing food waste is, therefore, a widespread goal [12]. The issue of food loss and waste has garnered increasing environmental, social, and economic interest [20].
According to “The State of Food Security and Nutrition in the World” report, 721–811 million people would go hungry by 2024, with 98% of them residing in developing nations [21]. Paradoxically, it is also estimated that more than one third of the total produced food is either lost, discarded, or not consumed [22], with some studies suggesting this figure could be as high as 50% [23].
With an average of 132 kg of food lost annually per person across households, food services, and retail sectors, the worldwide scope of food waste was astounding in 2022. This amounts to more than 1052 million tons of food waste worldwide. Households alone provided 79 kg per person, which is much more than the average adult human. At the consumer level, this waste represents 19% of the food available, not including the additional 13% lost earlier in the supply chain, from post-harvest to just before the retail stage [24].
In Ecuador, the issue of food waste is similarly pressing. Nationally, approximately 13,400 tons of solid waste are generated daily, with per capita production of 0.6 kg/inhab/day [25]. However, only 3.7% of this waste is recovered through recycling and composting, while the remainder is disposed of in landfills, controlled dumps, or open-air sites [26]. Municipalities also confront major waste management challenges, with 18.2% turning to open-air dumping, 31.4% depending on emergency cells, and 50.5% employing sanitary landfills [27].
According to early research, Riobamba’s per capita solid waste production was 0.71 kg/inhab/day, which is marginally more than the 0.6 kg/inhab/day national average [19]. With organic elements making up about 60% of the garbage, the composition of this waste shows the notable dominance of these materials. After that, recyclable items made up 22% of the waste stream, while throwaway rubbish made up 18% of it [28].
In Ecuador, national and local rules which support sustainability and lessen environmental effects are increasingly directing the management of solid waste and food waste. A comprehensive framework for reducing waste output, promoting recycling, and cultivating sustainable production and consumption patterns is advocated for at the national level by the Circular Economy Law, which was created in 2021 [29]. This regulation supports international initiatives to move toward a circular economy by highlighting the value of resource recovery and garbage valuation as ways to lessen reliance on landfills and cut greenhouse gas emissions.
Specific rules for waste separation, recycling, and disposal inside the city are outlined by the Ordenanza Municipal de Gestión Integral de Residuos Sólidos at the local level. In order to guarantee the processing of organic, recyclable, and disposable garbage, this regulation requires that homes, businesses, and institutions establish source separation plans and work with municipal waste management services [30]. The municipality hopes to decrease the amount of waste dumped in landfills and encourage the recovery of valuable items like paper, plastics, and organic matter by implementing these rules.
In the hospitality sector, particularly in restaurants, hospitals, cafeterias, and catering services, there is a notable scarcity of comprehensive data on FW. However, some authors emphasized the significance of this issue, defining hospitality FW as discarded food throughout the food chain from logistics and storage processes (due to transportation damages, expired expiration dates, or quality losses) through cooking stages (including both edible and non-edible products, such as peels or bones) and to food left unconsumed on plates or leftover from catering services [19]. In the European Union, data suggest that FW in the hospitality sector, combined with other waste types, is typically collected by municipal or charter services and accounts for approximately 30–60% of solid urban residue [31].
When considered alongside the fact that over 160 kg of food per capita is discarded annually from agricultural production to distribution and retail, it becomes clear that FW is a critical global issue. Latin America sees the highest waste rate at 200 kg per capita, while South and Southeast Asia have the lowest rate at 100 kg per capita [20]. These disparities emphasize the need to address food waste comprehensively, focusing on both the supply chain and consumer behavior to create a more sustainable food system worldwide [32], as well as developing more robust tracking mechanisms and targeted strategies to better understand and manage FW in this sector.
This sobering statistic highlights the persistent challenge of food insecurity faced by millions worldwide. Concurrently, the global food system grapples with the paradox of abundance and scarcity, as approximately one third of produced food goes to waste or remains underutilized, amounting to approximately 1.3 billion tons of food [33]. The mismanagement of these food wastes poses significant environmental threats, particularly when disposed of in landfills. Landfills, the predominant disposal method for food waste, contribute significantly to environmental degradation through the generation of leachates and the emission of greenhouse gases, notably methane, during the decomposition process [34].
FW, as a significant component of organic residues, poses a substantial threat by contaminating water and land while also contributing to greenhouse gas emissions [19]. Moreover, food production itself has a major impact on environmental emissions, climate change, and land use [35].
Despite its environmental impact, the lack of comprehensive data and insights into food waste, specifically regarding its quantities, causes, and characteristics, presents a significant obstacle to the design and implementation of effective reduction and prevention interventions [36].
This phenomenon makes already-existing environmental problems worse and emphasizes how urgently comprehensive initiatives to address food waste and its related humanitarian and environmental consequences are needed. Furthermore, the growing scarcity of suitable landfill sites in urban areas amplifies the urgency of implementing sustainable waste management practices to mitigate the adverse impacts of food waste disposal. Understanding these factors is crucial for developing strategies which mitigate the environmental harm caused by FW.
This study aims to quantitatively and qualitatively characterize FW in the restaurant sector of Riobamba, Ecuador to generate data which support circular economy strategies. By analyzing the weight and composition of FW, as well as classifying different waste types, this research provides a comprehensive understanding of waste generation throughout various stages of production and consumption. The results demonstrate the need for more environmental awareness among restaurant owners, staff, and patrons and show considerable financial losses because of the widespread dumping of FW in landfills.

2. Materials and Methods

2.1. Site Study

Riobamba is in the center of Ecuador between the Amazon and the coast, driving its economic growth mostly through trade and agriculture. However, tourism has gained relevance, as seen by the rise in establishments devoted to food and beverage sales.
The Food and Beverage Tourism Regulations, as stipulated by the Ministry of Tourism and its Ministerial Agreement No. 53, define restaurants as places which prepare and sell food. Depending on their category, they may also provide alcoholic and non-alcoholic beverages as well as extra services like cafeterias and self-service. Five-fork ranges are used to classify tourist food and beverage facilities, with five representing the highest category and one the lowest, based on a score system which assesses adherence to ministerial regulations. The majority of the 85 tourist restaurants in Riobamba which are registered, according to the tourism register, serve fast food that is influenced by regional cuisine and local ingredients.

2.2. Methods

2.2.1. Sample

To ensure a representative sample of the restaurant sector in Riobamba, we collaborated with the Ministry of Tourism, which provided access to a registry of 85 registered tourist restaurants in the city.
Of these, 13 restaurants were selected based on the following inclusion criteria: (1) located within the municipal boundaries of Riobamba; (2) engaged in the preparation and service of food to customers; (3) provided consent to participate in the observational study and granted access to their premises for data collection purposes; and (4) demonstrated willingness to accept a student from the local gastronomy school as part of their internship cycle, allowing for hands-on instruction and experiential learning in restaurant operations. This corresponds to a participation rate of 15.3% of the total registered restaurants.

2.2.2. Quantification of Food Waste

For the amount of FW produced in Riobamba, Ecuador’s restaurant industry was determined through cooperation with participating restaurants to make it easier for students to find information on the waste products from their kitchens. To ensure accurate measurement and classification of waste, a structured form was used to record the weights of organic, recyclable, and disposable waste components. This form is provided in the Supplementary Material. Samples were systematically collected based on specific sampling criteria meticulously designed to ensure both representativeness and variability of the tests conducted. The study encompassed 13 restaurants from different categories, including those primarily serving fast food as well as establishments offering daily seasonal menus and menu-based dishes.
This study’s methodology is in line with the Standard Test Method for Determination of the Composition of Unprocessed Municipal Solid Waste, which suggests that sampling be conducted over a period of 5–7 days [37]. A 7-day sampling interval is also stressed in the Food and Agriculture Organization’s (FAO) standards for characterizing urban solid waste to guarantee representative results [8,19,38,39].
The methodology, which includes physical separation of the residues, their classification, and their weight, was used to measure the composition of the residues [40]. This technique allows one to determine the amount of food that has gone bad as well as its quality based on the type of food.
The waste was carefully divided into three categories: organic, recyclable, and disposable. The collection period went on for seven days to record a wide range of FW weights.
A qualitative sub-classification system was created based on the waste content and characteristics to properly investigate the composition of the waste produced by Riobamba’s restaurants. The purpose of this classification was to ascertain the relative importance of various waste categories and their possible uses in the context of a circular economy.
Organic waste was divided into four sub-groups based on its profiles to determine the weights of each category. These groupings were (1) animal protein, including waste from meat, fish, and animal-derived byproducts like bones, skins, and viscera; (2) vegetable waste, including leftovers from leaves, stems, peels, and other parts of vegetables which are not edible; (3) fruit waste, including peels, pulps, seeds, and other remnants of fruit; and (4) vegetable protein, primarily consisting of grains, legumes, and their derivatives, along with peels, bran, bread, dough, and other flour-based products.
A similar qualitative sub-classification was developed for recyclable waste, separating it into four groups: (1) plastic, including packaging materials, bottles, containers, and other plastic items; (2) glass, consisting of bottles, jars, and other glass-based materials; (3) aluminum, including cans, foils, and other aluminum-based items; and (4) cardboard, consisting of boxes, cartons, and other paper-based packaging materials.
Disposable waste was not further sub-classified due to its limited potential for recovery or reuse. Non-recyclable and non-compostable materials are the main items in this category. Most often, these items end up in landfills or are burned.

2.2.3. Characterization

The four subgroups of the organic portion of the food waste were characterized, and their composition and appropriateness were assessed by analyzing their dry matter, moisture, fat, pH level, conductivity, ash, real density, and bulk density.
(a)
Dry Matter and Moisture Determination
In accordance with the technical guidelines set forth for this process, the oven drying method was used to determine the dry matter and moisture content at a constant temperature of 105 °C. The drying process was conducted using a universal digital oven, manufactured by Memmert in Schwabach, Germany, which was factory-calibrated for precision. Each sample was weighed before drying (starting weight) and then baked in the oven for the required amount of time until the weight remained constant, signifying that all of the moisture had evaporated. The samples were weighed once more (final weight) after drying using the same balance.
The following calculation was used to obtain the percentage of dry matter:
D r y   m a t t e r % = F i n a l   w e i g h t S t a r t i n g   w e i g h t × 100
The following formula was used to calculate the percentage of moisture:
H % = w e i g h t   o f   o v e n   d r i e d   s a m p l e w e t   s a m p l e   w e i g h t w e t   s a m p l e   w e i g h t × 100
(b)
Determination of Fat Content
Hexane was used as the solvent in the SOXTHERM SOX414 device, manufactured by Gerhardt in Volgograd, Germany to measure the fat content. The analysis was conducted at a constant temperature of 65 °C, ensuring efficient extraction of lipids. The dry fat content was determined by measuring the weight difference following the total elimination of hexane after the extraction process.
(c)
Determination of pH
The pH of each sample was assessed using a multiparameter potentiometer HI2020-01), manufactured by Hanna in Limena, Italy, which had been calibrated with a standard pH 7 buffer prior to measurement. To guarantee precision and consistency, measurements were carried out in a controlled setting. On a dimensionless scale from 0 to 14, the pH values—which stand for the negative logarithm of the hydrogen ion concentration—were noted.
(d)
Conductivity
A Hanna HI2020-01 multiparameter conductometer was used to measure the samples’ electrical conductivity. To guarantee accuracy, the gadget was initially calibrated using standard solutions with established conductivity. Each sample was immersed in a conductivity cell with two electrodes, and the current flow was measured by applying a tiny alternating current (AC) voltage. The device automatically adjusted for the temperature when recording conductivity readings, which were then expressed in microsiemens per centimeter (µS/cm). To avoid cross-contamination and guarantee accurate findings, the electrodes were cleaned with pure water in between tests.
(e)
Ash Determination
The ash content of the samples was determined using a muffle furnace MC5-12, manufactured by Biobase in Wolfenbüttel, Germany. The samples were heated to 550 °C until complete combustion was achieved, ensuring the removal of all organic material. After cooling, the residual ash was subjected to gravimetric analysis by weighing the remaining inorganic material on a precision balance. The ash content was expressed as a percentage of the original sample weight (% ash).
(f)
Real Density
The absolute density of the samples was determined using a Pyrex pycnometer with a capacity of 5 mL, manufactured by Pyrex in Châteauroux, France, which consisted of a lidded glass container and a capillary tube. The measurement process involved determining the mass of water displaced by the sample. The absolute density was calculated using the following formula:
A b s o l u t e   d e n s i t y = s a m p l e   m a s s d i s p l a c e d   w a t e r   v o l u m e
(g)
Bulk Density
The bulk density was determined using a 50 mL graduated cylinder, manufactured by Isolab in Wertheim, Germany. The empty cylinder (m_probe) was weighed to determine its mass. A known mass of the sample was then added to the cylinder, and the total weight (m_probe + sample) was recorded. The base of the cylinder was tapped approximately 20 times to compact the sample and achieve a stable volume. The occupied volume (V_bulk) was then measured as the apparent volume of the compacted sample. The bulk density was calculated using the following formula:
B u l k   d e n s i t y = m p r o b e + s a m p l e m ( p r o b e ) V   b u l k
(h)
Fiber Content
The fiber content was determined using the Weende method (also known as the proximate analysis method). Samples were subjected to sequential digestion with acid (1.25% H2SO4) and alkali (1.25% NaOH) solutions to remove non-fibrous components. The residue was dried, weighed, and incinerated to determine the crude fiber content:
F i b e r % = W e i g h t   o f   r e s i d u e   a f t e r   I n c i n e r a t i o n I n i t i a l   S a m p l e   W e i g h t × 100

3. Results

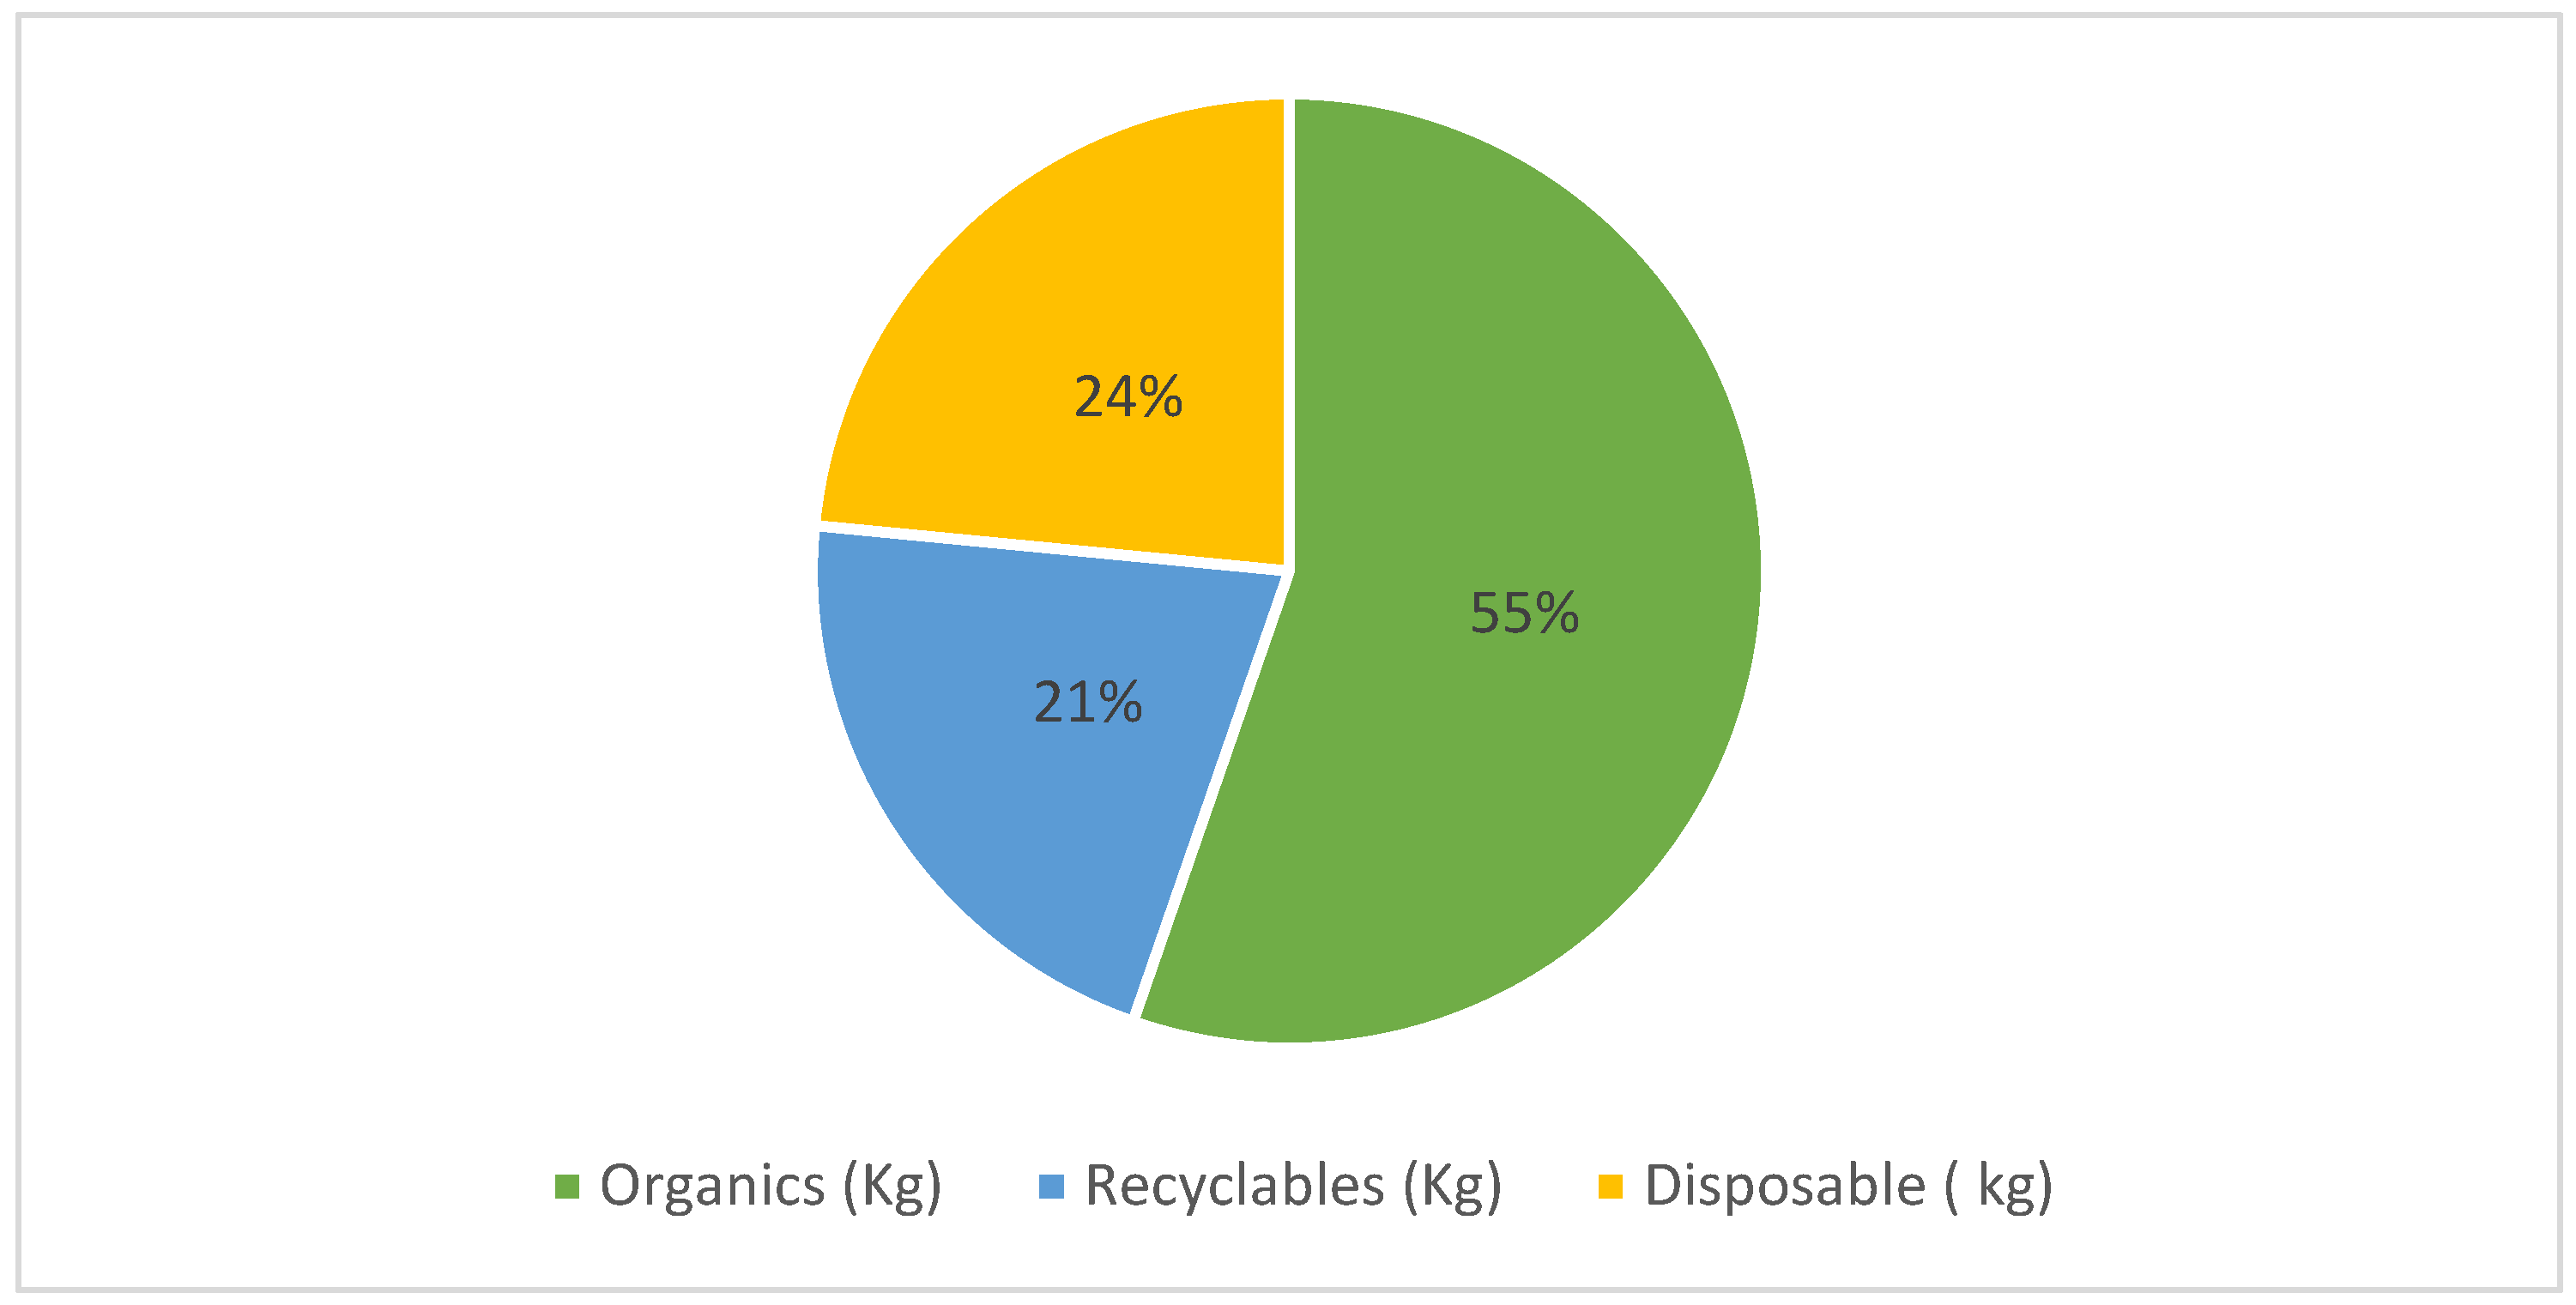
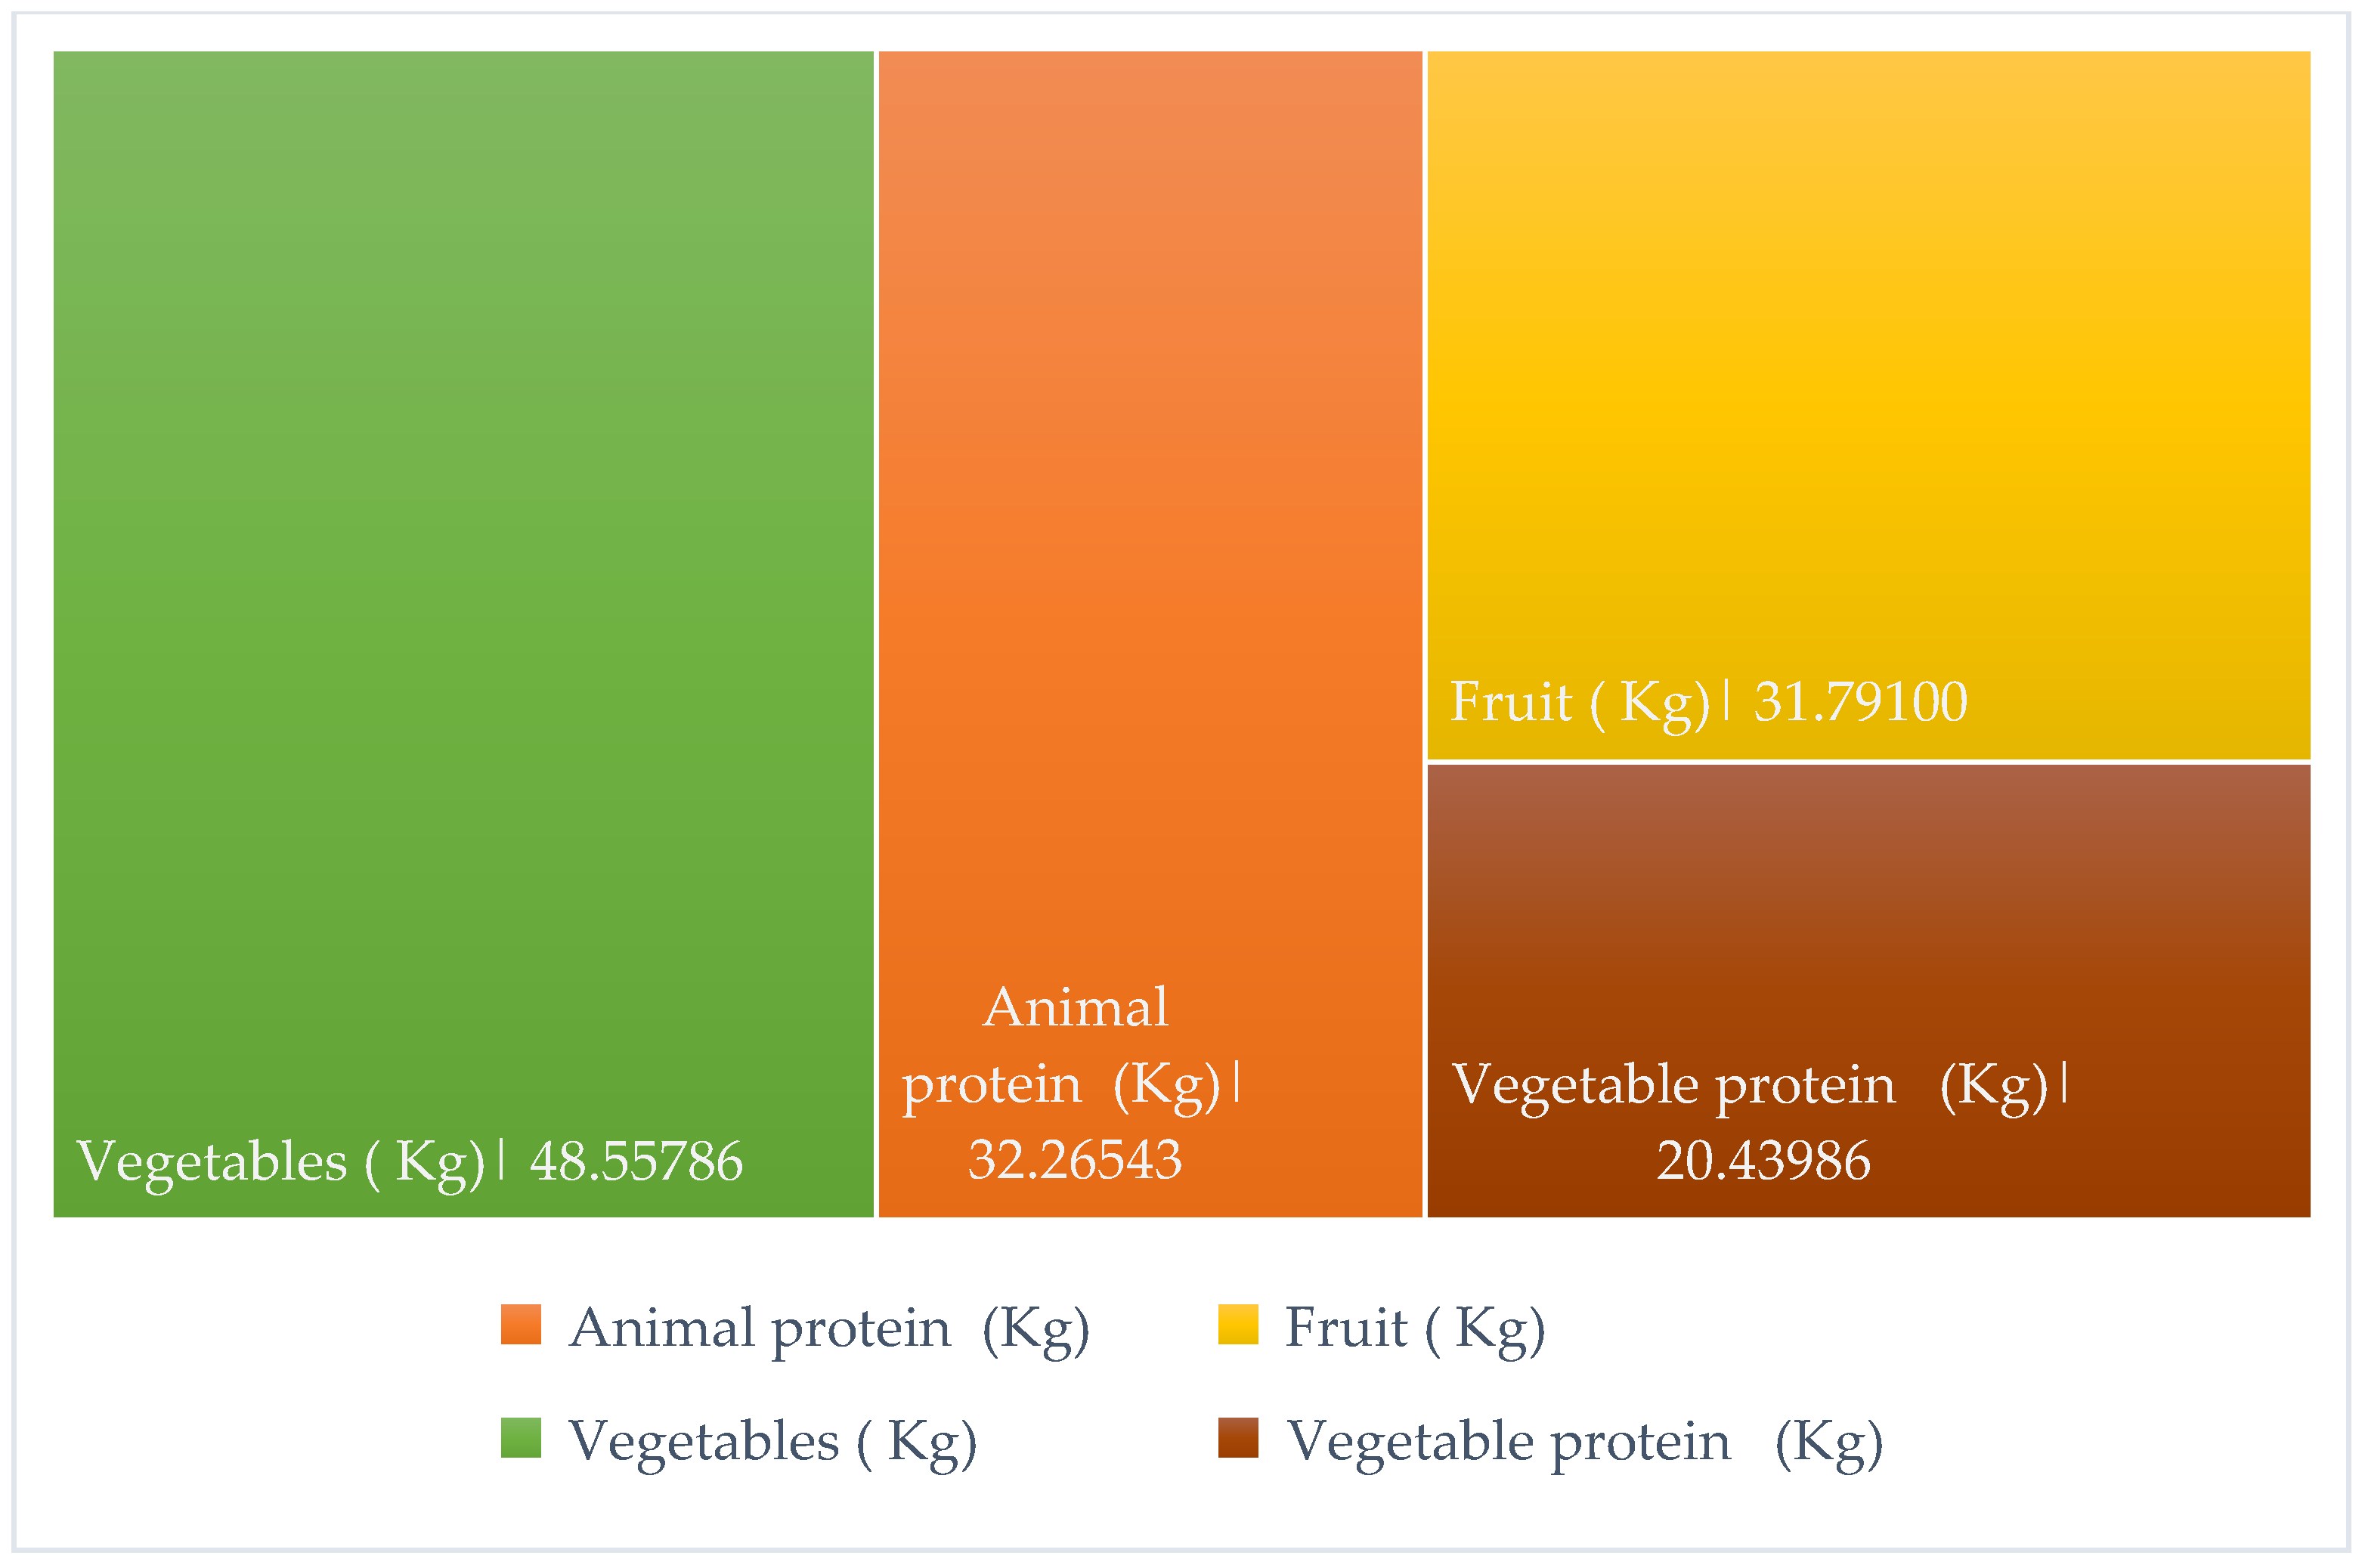
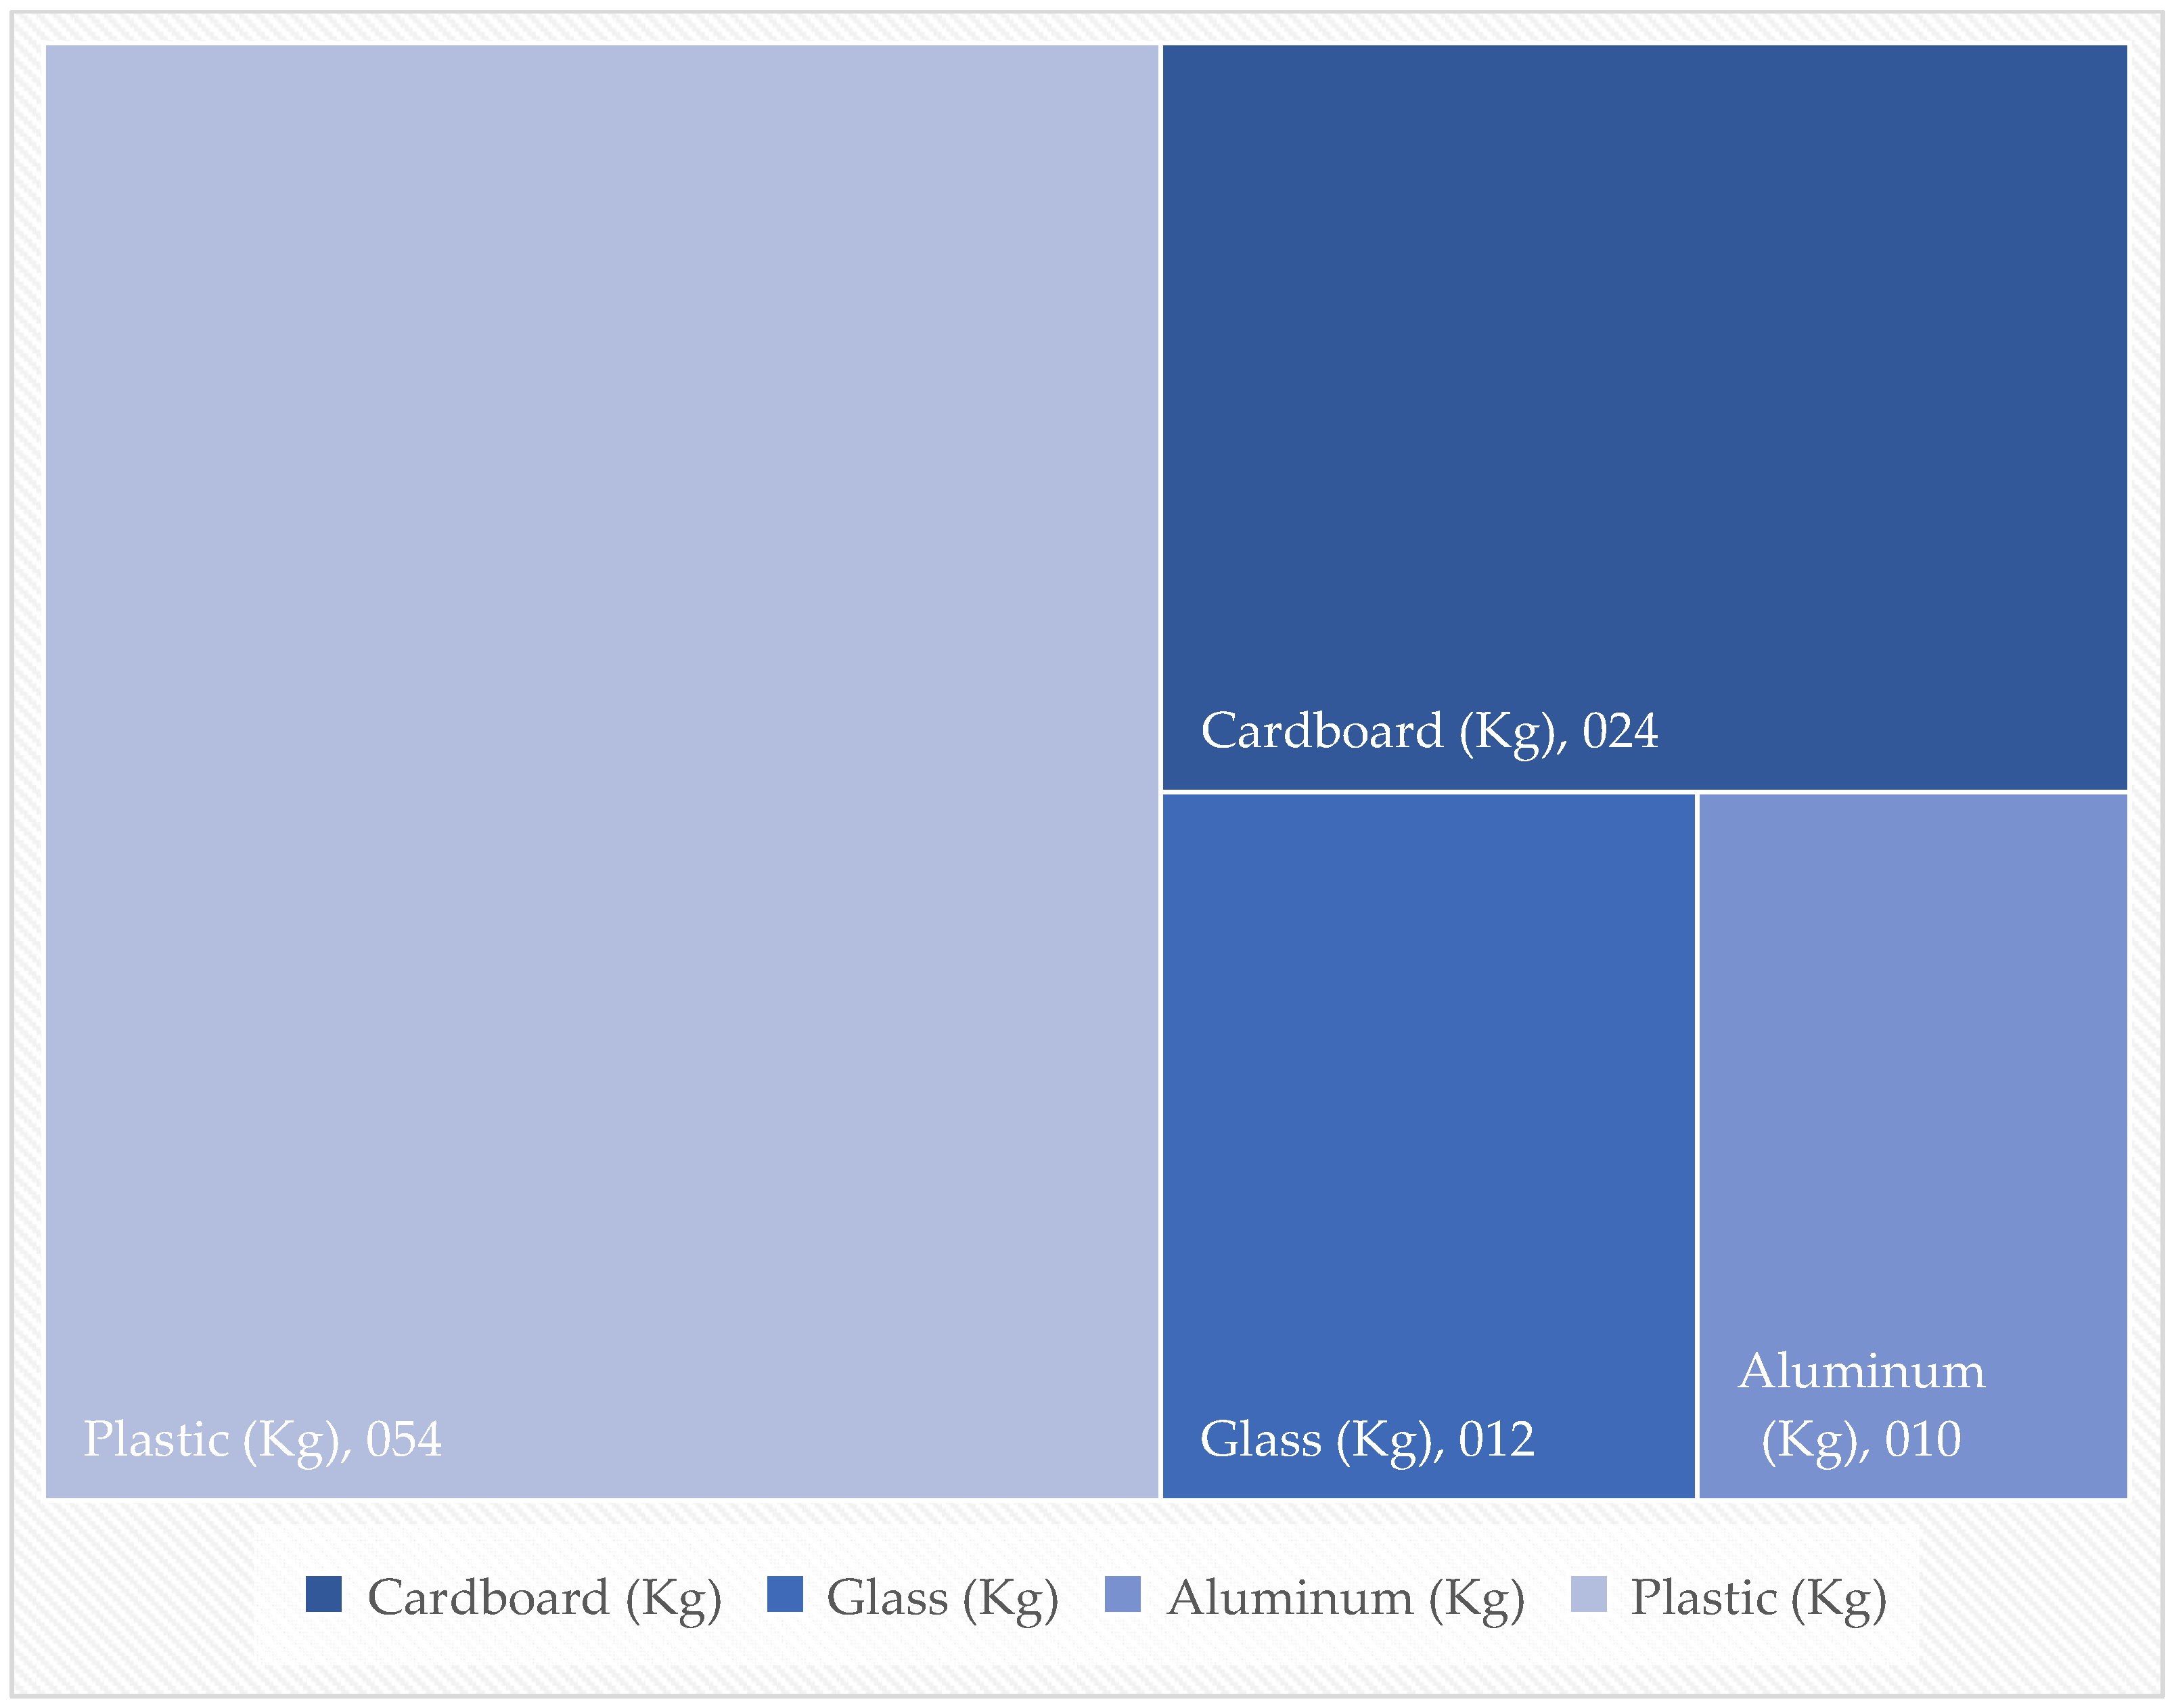
3.1. Quantitative Characterization Data

Quantifying FW generation is a critical step in developing effective management strategies aiming to minimize and recover these materials. Table 1 presents the total weight of FW generated over a period of seven days—from Monday to Sunday—by 13 restaurants located in Riobamba. Understanding the quantity of FW produced not only informs decision making for FW reduction efforts but also encourages communities to shift their perspectives and actions toward more sustainable waste practices. However, significant challenges exist when attempting to accurately quantify FW, including inconsistencies in measurement methods, limited governmental involvement, and data gaps in waste reporting [6].
Table 2 presents a statistical analysis of food waste generation in Riobamba’s restaurant sector, showing significant variation among waste categories and days of the week. Organic waste constituted the largest portion, with a mean daily generation of 132.9 kg (SD = 39.6), ranging from 81.3 kg to 209.3 kg. This high fluctuation suggests that factors such as seasonal ingredient availability, menu composition, and customer demand influence waste generation patterns. Recyclable waste exhibited a more stable trend, with an average of 50.94 kg/day (SD = 10.07), indicating a relatively consistent contribution of packaging materials to the waste stream. Similarly, disposable waste followed a comparable pattern, averaging 56.43 kg/day (SD = 14.03), with values ranging from 44.78 kg to 83.61 kg.
The overall daily waste generation averaged 240.3 kg (SD = 50.3), with significant fluctuation by week. Restaurants produced the most trash on weekends and Mondays, with the total food waste (FW) ranging from 173.43 kg on Friday (lowest) to 323.98 kg on Monday (highest). This peak can be allocated to increased client traffic, raw material preparation procedures, and greater consumption levels on certain days. The high standard deviation in total waste highlights the significant role of restaurant activity levels, consumer behavior, and operational processes in determining waste output.
Table 3 provides a breakdown of the average daily waste generation per restaurant over a seven-day period. Across all 13 restaurants, the total waste generated was 1681.94 kg, with an average of 129.38 kg/day per restaurant. The waste generation per capita (per restaurant) averaged 18.48 kg/day, with notable variability across the week. For instance, Day 1 (Monday) had the highest average generation at 24.92 kg/restaurant, while Day 5 (Friday) had the lowest at 13.34 kg/restaurant.
Figure 1 shows the composition of total waste, and the data indicate that in the hospitality sector, 55% of waste is organic, 21% is recyclable, and 24% is disposable waste.
Figure 2 illustrates the organic structure of FW, which is divided into four groups: vegetables, animal protein, fruits, and vegetable protein.
Vegetables had the highest weight in this subdivision, accounting for 48.56% of the total. This high percentage may be linked to local culinary and agricultural practices, where components such as peels, stems, and roots are frequently discarded. Additionally, the region’s strong agricultural economy results in high availability of fresh produce sold in its raw form, increasing the volume of vegetable-based waste. Studies indicated that significant waste is generated at multiple stages, including cultivation, marketing, and processing [12].
Animal proteins represented the second-largest category, making up 32.27% of the total food waste. This waste primarily stems from the processing of meat, fish, and shellfish, along with post-consumer waste such as bones and skins. In Riobamba, it is common for some of this waste to be repurposed as animal feed, particularly for small-scale pig farming. The practice of converting food waste into livestock feed is recognized as an effective strategy for reducing waste while supporting circular economy initiatives [41].
Fruits and vegetable proteins contributed 31.79 kg and 20.44 kg, respectively, to the total waste. The lower proportion of vegetable protein waste suggests that plant-based protein sources, such as legumes and grains, are more efficiently utilized in local cuisine. Encouraging the use of edible vegetable components and adopting sustainable food waste management practices could further minimize waste in this category.
The recyclable waste distribution in Riobamba’s restaurant industry is shown in Figure 3, where plastics make up the majority (53.56%), followed by cardboard (23.87%), glass (12.49%), and aluminum (10.07%). Waste composition has changed over time, with increases in plastics and decreases in fine fractions [42]. Plastics, widely used in food packaging due to their affordability and versatility, are essential to food processing [43]. However, their prevalence in waste streams raises environmental concerns, requiring cooperation between government, industry, and science to develop sustainable alternatives [44].
On the other hand, cardboard waste accounts for 23.87% of recyclable waste and is particularly significant because it is frequently used in takeout and restaurant delivery packaging. Although highly recyclable, contamination from food residues reduces its recovery potential. In the US, approximately 56% of the 110 million tons of paper and cardboard waste was landfilled, leading to significant economic losses [45]. Plastics and paper or cardboard have notable potential for recycling, with financial revenues from these materials being widely analyzed [46].
Glass waste, primarily from beverage and condiment bottles, constitutes 12.49% of the recyclable waste. Despite being 100% recyclable and indefinitely reusable, only 45% of glass in India is recycled, emphasizing the need for better waste management strategies [47]. The glass recycling process, involving sorting, cullet preparation, and remanufacturing, can be highly efficient if properly managed. Additionally, innovations such as deposit return schemes, extended producer responsibility programs, and renewable energy integration can enhance sustainable glass production [48].
Finally, aluminum waste accounts for 10.07% of recyclable materials, primarily from cans and foils used in food preparation. While aluminum is one of the most valuable recyclable materials, its relatively low share in Riobamba suggests limited awareness or infrastructure for proper recycling. Glass recycling conserves natural resources and reduces landfill usage [47]. Expanding local recycling initiatives could enhance waste recovery and contribute to circular economy efforts.

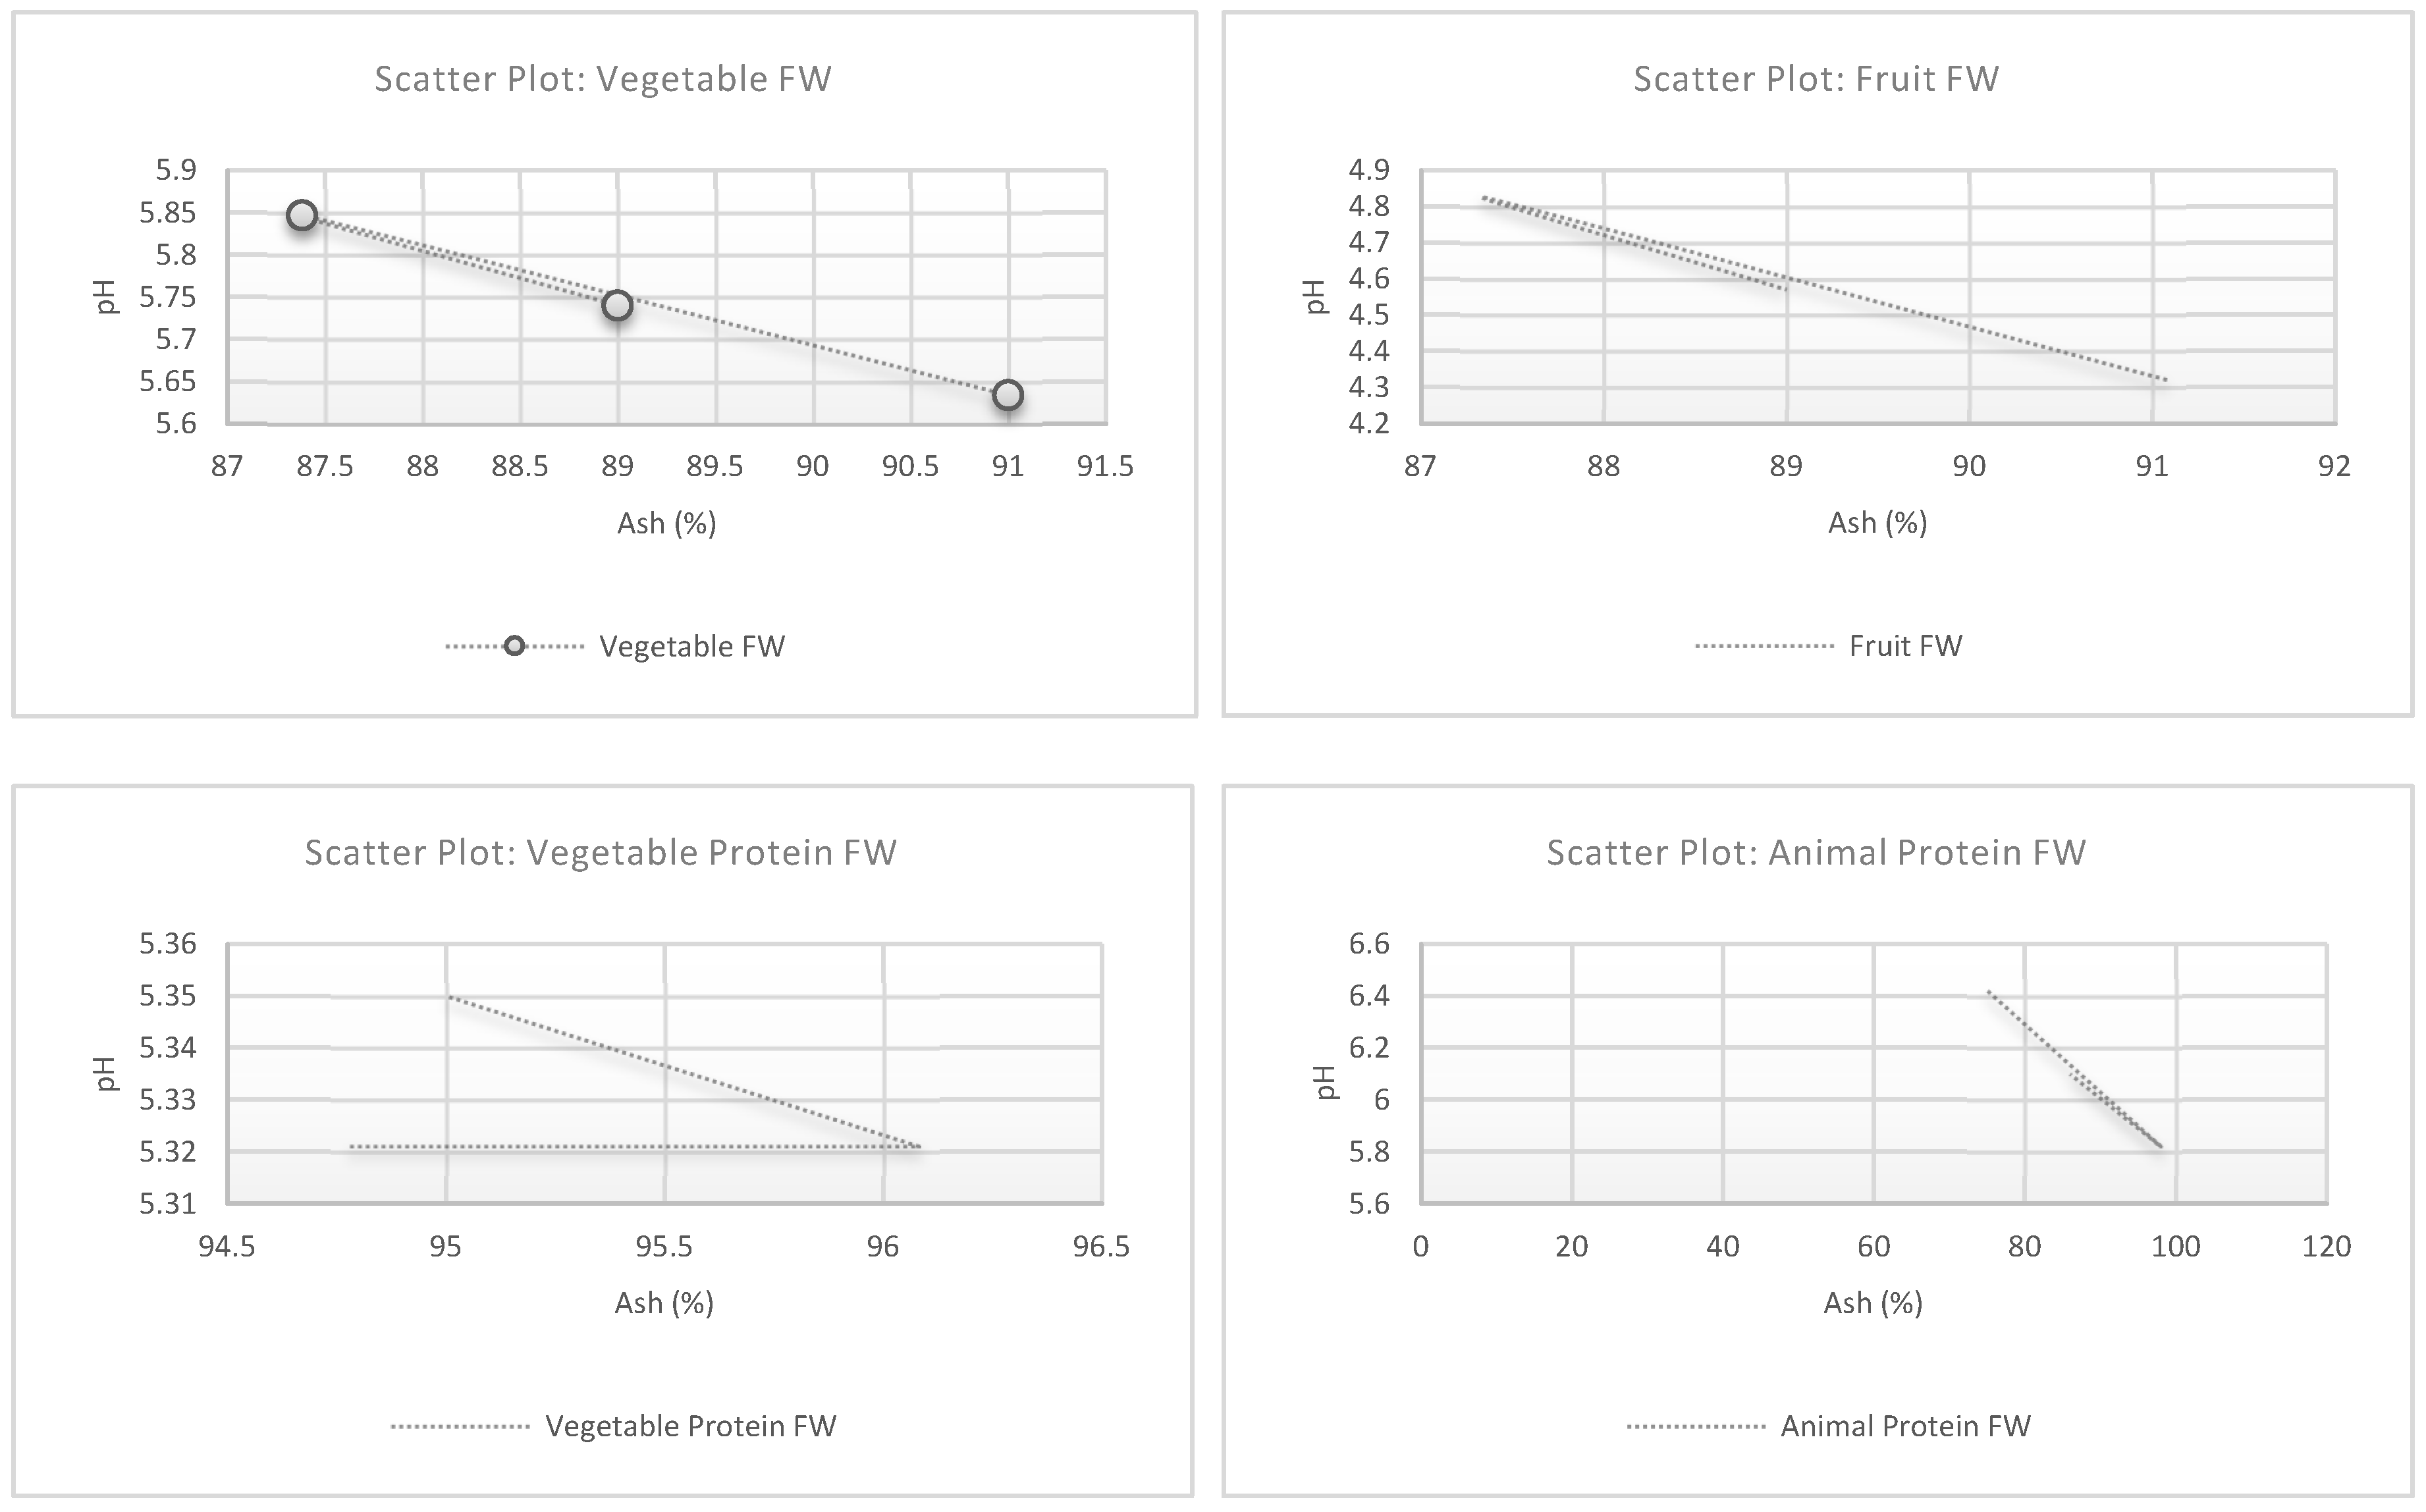
3.2. Qualitative Characterization Data

Considering there is currently no globally acknowledged methodology for the recovery and valorization of FW, the circular economy idea provides a flexible framework for investigating various options and adapting methodologies to specific waste characteristics. These techniques should include a full description of the available feedstocks, including chemical composition, biodegradability, and waste statistical variability [19]. A thorough description of the waste is required to determine the most appropriate recovery routes.
To achieve adequate waste recovery within the framework of the circular economy, it is necessary to conduct a prior characterization of the raw material, which includes determining the proportion of different types of foodstuffs present in the samples, as these determine their chemical composition [49]. The amount of waste components, such as fruits, vegetables, meats, or processed items, has a direct impact on the recovery pathways available. For example, wastes high in organic matter may be more suited for composting, whereas those high in proteins or lipids may be used to produce biofuels or food supplements [50].
Table 4 shows that the average dry matter content of food waste from Riobamba restaurants was 24.33%, whereas the average moisture content was 75.68%, as shown in Table 3. These numbers suggest that the waste contained a high water content, which is typical of fresh organic waste like fruits and vegetables. This high moisture level (over 75%) indicates that the trash is particularly perishable, necessitating effective management to prevent rapid breakdown. The low average dry matter (24.33%) indicates that, while the total weight of the waste is significant, the amount of solid material which can be recovered is rather small.
However, the non-homogeneous composition emphasizes the significance of categorizing waste types to optimize recovery efforts. In this regard, the category analysis emphasizes the significance of separating organic waste before treatment. Fruit and vegetable waste with little dry matter (19.7 ± 0.6% and 18.8 ± 0.5% respectively) are excellent for composting due to their high water contents. On the other hand, animal protein waste, which contains 54.5 ± 0.7% dry matter, has great potential for protein extraction and energy byproducts. Vegetable protein waste, on the other hand, with only 4.3 ± 0.4% dry matter and 95.7 ± 0.4% moisture, requires treatment due to its rapid disintegration and low solid density, making it more suitable for biodigesters.
Table 5 presents the physicochemical analysis of FW from the restaurant sector in Riobamba, revealing significant variations in the composition and characteristics of the various waste categories. Animal protein waste exhibited the highest fat content (17.65% ± 0.50), reflecting its meat-based composition, while vegetable waste had the lowest fat content (3.77% ± 0.10). The ash content was notably higher in plant-based wastes, specifically vegetable (91.00% ± 0.50) and fruit waste (91.08% ± 0.45), compared with animal protein waste (75.06% ± 0.80), indicating its potential for composting and soil enrichment. The pH values showed substantial differences, with fruit waste being the most acidic (4.32 ± 0.10), likely due to the organic acid content, while animal protein waste had the highest pH (6.42 ± 0.12), being closer to neutral. Conductivity measurements showed higher values in vegetable waste (7.62 ± 0.15 mS/cm) and vegetable protein (7.56 ± 0.18 mS/cm), suggesting a greater concentration of soluble salts, which can influence microbial activity in composting processes. The real density measurements indicated that fruit waste had the lowest real density (0.273 ± 0.020 g/mL), likely due to its higher water content, while vegetable waste had the highest real density (0.353 ± 0.015 g/mL). The bulk density values were relatively similar across the categories, with fruit waste being slightly less dense (0.314 ± 0.025 g/mL). The fiber content was highest in fruit waste (14.49% ± 0.25), followed by vegetable protein waste (11.79% ± 0.30) and vegetable waste (3.55% ± 0.10), while animal protein waste had the lowest fiber content (0.97% ± 0.08). The results indicate the necessity for targeted waste management strategies, including composting for mineral-rich plant waste and anaerobic digestion for fatty animal waste, to enhance resource recovery and advance circular economy principles within the restaurant sector.
Figure 4 shows the correlation between ash (%) and pH exhibiting considerable variation among the food waste types, indicating disparities in the composition and decomposition processes. Vegetable and fruit waste revealed significant negative associations, highlighting the influence of minerals and organic acids on acidification. In contrast, vegetable protein waste showed limited influence from ash on pH levels, while animal protein waste demonstrated a moderate negative correlation driven by both minerals and protein breakdown.

4. Discussion

This study provides a quantitative and qualitative analysis of FW generation in Riobamba’s restaurant industry, estimating an average daily production of 18.48 kg per restaurant. This significant amount demonstrates inefficiencies in food consumption and waste management practices. Organic waste was the most prevalent group, accounting for 55% of total trash and consisting primarily of vegetable residues (48.56%) and animal protein waste (32.27%). The large amount of organic waste suggests that it can be valorized through composting, anaerobic digestion, and other circular economy initiatives.
Plastics (53.56%) were the most prevalent component, followed by cardboard (23.87%), glass (12.49%), and aluminum (10.07%), accounting for 21% of recyclable materials. Disposable garbage accounted for 24%, highlighting limitations in waste sorting and recovery operations.
The physicochemical study of organic waste showed a high moisture content (75.68%) and low dry matter, limiting its potential for valorization. The high moisture level encourages biological treatment procedures such as anaerobic digestion and composting, which promote microbial activity and decomposition [51]. Anaerobic digestion is especially important since it may generate biogas, a renewable energy source, while creating digestate for agricultural purposes [52,53]. Composting is another sustainable approach which converts organic waste into nutrient-rich fertilizers for use in agricultural and urban green spaces [19].
FW valorization through biotechnological and industrial applications creates prospects for circular economy integration. Studies have shown that bioactive substances such as vitamins, fibers, and antioxidants can be extracted from vegetable and fruit leftovers for use in functional foods [54]. Furthermore, FW can be used as a raw material for bioplastic manufacture, edible coatings, and bioenergy generation, helping to reduce waste and promote sustainability [55]. Animal protein waste, characterized by mild negative correlations between ash and pH levels, can be effectively treated through rendering to produce animal meals and fats for various industries, thus lowering environmental loads [56].
Despite the potential of these valorization strategies, their implementation in Riobamba confronts challenges such as limited infrastructure for advanced processing. These factors could affect the consistency and feasibility of certain waste processing methods, necessitating adaptive management strategies. Nevertheless, integrating these pathways into local waste management practices can create economic opportunities, reduce environmental impacts, and support the transition to a circular economy in the restaurant sector.
Beyond food waste, plastic waste management remains a critical challenge due to its environmental persistence and increasing consumption rates [57]. While the three Rs—reduce, reuse, and recycle—have been widely pushed as a core paradigm for sustainable waste management [58], recycling rates remain low, ranging from 5% to 25% in developed countries [59]. Landfilling remains a prevalent yet undesirable disposal method due to its long-term environmental and health risks [60]. Alternative valorization strategies such as pyrolysis and liquefaction can convert plastic waste into valuable byproducts, though these processes require significant energy inputs, limiting their large-scale feasibility [61].
Plastic waste continues to contribute to widespread pollution, with microplastics posing a serious threat to ecosystems and human health. Depolymerization, which breaks down polymers into monomers for reuse, has been highlighted as a critical method for achieving large yields of usable products while producing low waste [62]. However, its application is limited due to economic and infrastructure constraints. Addressing the growing worldwide plastic manufacturing and disposal difficulties will necessitate a combination of regulatory incentives, technological advancements, and a shift toward sustainable material alternatives.
While food waste valorization presents promising solutions for resource recovery and environmental sustainability, large-scale implementation faces significant challenges related to techno-economic viability, feedstock security, and industrial scalability [63,64]. Additionally, integrating sustainable packaging solutions is crucial to addressing emerging concerns related to plastic waste in the food industry. Recent studies highlighted the risks associated with plasticizers, bisphenols, and phthalates, emphasizing the need for biodegradable alternatives [65]. Achieving a circular food system requires a holistic approach which includes optimizing valorization processes, ensuring feedstock security, and incorporating sustainable packaging innovations.
One limitation of this study is the sample size of 13 restaurants, which, while representing 15.3% of the total registered tourist restaurants in Riobamba, may not fully capture the diversity of the entire sector. The limited number of participants could introduce biases, as different restaurant types, operational scales, and customer flows may generate varying amounts and compositions of food waste. Additionally, the seven-day waste characterization period, though based on validated methodologies, may not account for seasonal variations or long-term trends in waste generation. Future research with a larger sample size and extended monitoring periods would enhance the robustness and applicability of the findings. However, this study provides a foundational understanding of food waste generation and valorization opportunities in Riobamba’s restaurant sector, serving as a basis for future circular economy initiatives and policy developments.

5. Conclusions

FW in the restaurant sector is a local problem with worldwide consequences, having a severe influence on the environment, society, and economy. Effective waste management is critical to mitigating these effects. Yet, much of the available literature focuses on wealthy countries, with little study in understudied locations such as Ecuador. In this backdrop, this study intends to help close the gap by investigating food waste management in Riobamba, Ecuador.
The data show that FW is significant, with organic waste—particularly from vegetables, animal proteins, and fruits—constituting most wasted resources. The study also discovered specific patterns of waste output, with higher amounts produced on weekends. This increase could be attributed to a greater influx of customers and the manufacturing of large volumes of food, highlighting a critical domain where restaurants can improve their operations to reduce food waste.
This study’s conclusions have substantial consequences for culinary education and public policy. First, restaurant managers in Riobamba should recognize the importance of investing in staff training as a key strategy to reduce food waste. This approach not only contributes to operational efficiency and waste reduction but also enhances the environmental and economic competitiveness of local restaurants. Therefore, restaurant owners should prioritize staff training as a strategic area for development, as it has the potential to generate significant impacts, such as the implementation of sustainable culinary practices and more efficient waste management systems in the restaurant sector.
The findings underscore the necessity for more governmental engagement in fostering sustainable practices within the hospitality sector. Public authorities should support waste reduction initiatives and classification at the source and offer financial incentives to encourage restaurants to adopt circular economy principles.
Although this study provides useful information, it is vital to recognize its limitations. The research was conducted in a specific region of Ecuador, and thus the findings may not be fully generalizable to other countries or regions with different cultural, political, and economic contexts. As a result, future research should broaden this study by investigating food waste management strategies in different cities and regions, particularly those with varying degrees of economic growth and training resources.

Supplementary Materials

The following supporting information can be downloaded at: https://www.mdpi.com/article/10.3390/biomass5020018/s1. The supplementary material includes a standardized form used for weighing and categorizing different types of food waste generated in the hospitality sector. This form was utilized during data collection to ensure consistency and accuracy in waste quantification.

Author Contributions

The authors contributed collaboratively to this research article as follows. A.S.-H. led the conceptualization, methodology, supervision, and writing of the original draft; F.C.-M. and C.C.-H. contributed to validation; R.Z.-G. was responsible for the formal analysis; P.B.-A. and D.V.-N. were responsible for the writing (review and editing); and M.G.-V. handled the project administration and data curation. All authors provided input during the writing (review and editing) phase. All authors have read and agreed to the published version of the manuscript.

Funding

This research was funded by Escuela Superior Politécnica de Chimborazo (ESPOCH) under the research project IDIPI310.

Institutional Review Board Statement

Not applicable.

Informed Consent Statement

Not applicable.

Data Availability Statement

All data and materials were used in accordance with the guidelines of the journal as listed in the reference section. This study was conducted in accordance with ethical principles, and no specific ethical concerns were identified. Readers can access the datasets generated during the current study.

Acknowledgments

The authors would like to thank Mayra Granizo Villacres for her essential contributions to the project’s administration, which included planning, implementation, and the management and coordination of research activities.

Conflicts of Interest

The authors declare no conflicts of interest.

References

  1. Sadiku, M.N.; Ashaolu, T.J.; Musa, S.M. Global Food Waste: A Primer. Int. J. Trend Sci. Res. Dev. 2019, 4, 170–173. Available online: https://www.ijtsrd.com/papers/ijtsrd29485.pdf (accessed on 11 November 2024).
  2. FAO. Global Food Losses and Food Waste: Extent, Causes and Prevention; FAO: Rome, Italy, 2011; Available online: https://www.fao.org/4/mb060e/mb060e00.htm (accessed on 11 November 2024).
  3. Kavitha, S.; Kannah, R.Y.; Kumar, G.; Gunasekaran, M.; Banu, J.R. Introduction: Sources and characterization of food waste and food industry wastes. In Food Waste to Valuable Resources; Elsevier: Amsterdam, The Netherlands, 2020; pp. 1–13. [Google Scholar]
  4. SOFA. SOFA 2019—The State of Food and Agriculture in the World. 2019. Available online: https://openknowledge.fao.org/server/api/core/bitstreams/11f9288f-dc78-4171-8d02-92235b8d7dc7/content (accessed on 11 November 2024).
  5. FAO. Definitional Framework of Food Loss. Available online: https://openknowledge.fao.org/server/api/core/bitstreams/5931921f-7f68-4169-b731-31d06f5b4835/content (accessed on 4 December 2024).
  6. Parfitt, J.; Barthel, M.; Macnaughton, S. Food waste within food supply chains: Quantification and potential for change to 2050. Philos. Trans. R. Soc. B Biol. Sci. 2010, 365, 3065–3081. [Google Scholar] [CrossRef] [PubMed]
  7. Service, B.I. Guidelines on the Preparation of Food Waste Prevention Programmes. 2011. Available online: https://circabc.europa.eu/ui/group/636f928d-2669-41d3-83db-093e90ca93a2/library/41ae71d2-bb2d-4cbc-854e-981ad840dbf3 (accessed on 5 March 2025).
  8. FAO. Background: Technical Platform on the Measurement and Reduction of Food Loss and Waste. 2019. Available online: https://www.fao.org/platform-food-loss-waste/en/ (accessed on 16 November 2024).
  9. FAO. State of Food and Agriculture 2019. In Moving Forward on Food Loss and Waste Reduction; Policy Support and Governance, Food and Agriculture Organization of the United Nations: Rome, Italy, 2019; Available online: https://www.fao.org/policy-support/tools-and-publications/resources-details/en/c/1242090/ (accessed on 16 November 2024).
  10. Hall, K.D.; Guo, J.; Dore, M.; Chow, C.C. The Progressive Increase of Food Waste in America and Its Environmental Impact. PLoS ONE 2009, 4, e7940. [Google Scholar] [CrossRef] [PubMed]
  11. UNEP. UNEP Food Waste Index Report 2021. 2021. Available online: http://www.unep.org/resources/report/unep-food-waste-index-report-2021 (accessed on 5 March 2025).
  12. ‘Aqilah, N.M.N.; Rovina, K.; Felicia, W.X.L.; Vonnie, J.M. A Review on the Potential Bioactive Components in Fruits and Vegetable Wastes as Value-Added Products in the Food Industry. Molecules 2023, 28, 2631. [Google Scholar] [CrossRef]
  13. United-Nations. Objetivos de Desarrollo Sostenible. 2024. Available online: https://www.un.org/sustainabledevelopment/es/hunger/ (accessed on 11 June 2024).
  14. Batra, V.; Kumar, A.; Soti, N. Achieving Zero Hunger under Sustainable Development Goals Concerning Organic Agriculture. Curr. Agric. Res. J. 2024, 12, 219–230. [Google Scholar]
  15. Valin, H.; Hertel, T.; Bodirsky, B.; Hasegawa, T.; Stehfest, E. Achieving Zero Hunger by 2030 A Review of Quantitative Assessments of Synergies and Tradeoffs amongst the UN Sustainable Development Goals; Center for Development Research (ZEF) in Cooperation with the Scientific Group for the UN Food System Summit 2021: Bonn, Germany, 2021. [Google Scholar]
  16. Kennedy, E.; Jafari, A.; Stamoulis, K.; Callens, K. Tackling Zero Hunger: A View from Experts. Med. Res. Arch. 2021, 9, 3. [Google Scholar]
  17. Tamasiga, P.; Miri, T.; Onyeaka, H.; Hart, A. Food Waste and Circular Economy: Challenges and Opportunities. Sustainability 2022, 14, 9896. [Google Scholar] [CrossRef]
  18. Zara, G.; Fan, G. Microbial biotransformation of natural flavor compounds. Front. Microbiol. 2023, 14, 1243194. [Google Scholar] [CrossRef]
  19. Carmona-Cabello, M.; García, I.; Sáez-Bastante, J.; Pinzi, S.; Koutinas, A.; Dorado, M. Food waste from restaurant sector–Characterization for biorefinery approach. Bioresour. Technol. 2020, 301, 122779. [Google Scholar]
  20. Amicarelli, V.; Bux, C.; Lagioia, G. How to measure food loss and waste? A material flow analysis application. Br. Food J. 2020, 123, 67–85. [Google Scholar]
  21. FAO; IFAD; UNICEF; WFP; WHO. The State of Food Security and Nutrition in the World 2024—Financing to End Hunger, Food Insecurity and Malnutrition in All Its Forms; FAO: Rome, Italy, 2024. [Google Scholar]
  22. Gustavsson, J.; Cederberg, C.; Sonesson, U.; Van Otterdijk, R.; Meybeck, A. Global Food Losses and Food Waste; FAO: Rome, Italy, 2011. [Google Scholar]
  23. Lundqvist, J.; De Fraiture, C.; Molden, D. Saving Water: From Field to Fork: Curbing Losses and Wastage in the Food Chain; Stockholm International Water Institute: Stockholm, Sweden, 2008. [Google Scholar]
  24. UNEP. Food Waste Index Report 2024. Think Eat Save: Tracking Progress to Halve Global Food Waste. 2024. Available online: https://www.unep.org/resources/publication/food-waste-index-report-2024 (accessed on 5 March 2025).
  25. Solíz Torres, M.F.; Durango Cordero, J.S.; Solano Peláez, J.L.; Yépez Fuentes, M.A. Cartografía de los Residuos Sólidos en Ecuador, 2020; Universidad Andina Simón Bolívar, Sede Ecuador/INEC/VLIR-UOS/GAIA: Quito, Ecuador, 2020. [Google Scholar]
  26. Gautam, S.; Bundela, P.; Pandey, A.; Jain, R.; Deo, P.; Khare, S.; Awasthi, M.; Surendra Sarsaiya, S.S. Biodegradation and recycling of urban solid waste. Am. J. Environ. Sci. 2009, 5, 653–656. [Google Scholar] [CrossRef]
  27. INEC. Estadisticas de Información Ambiental Económica en Gobiernos Autónomos Descentralizados Municipales. 2021. Available online: https://www.ecuadorencifras.gob.ec/documentos/web-inec/Encuestas_Ambientales/Municipios_2021/Residuo_solidos_2021/Presentaci%C3%B3n%20residuos%202021%20v07JA_CGTP%20 (accessed on 25 February 2025).
  28. Saeteros, A.; Morillo, B.; Cárdenas, Y.; Tapia, E.; Robalino, J. Characteristics of Riobamba’s household solid waste generation and the benefits of source separation. J. Namib. Stud. 2023, 33, 3539–3554. [Google Scholar]
  29. Nacional, A. Ley Orgánica de Economía Circular Inclusiva; Ecuador, R.D., Ed.; Registro Oficial Suplemento 488; 2021; p. 23. Available online: https://procuraduria.utpl.edu.ec/NormativaExterna/LEY%20ORG%C3%81NICA%20DE%20ECONOM%C3%8DA%20CIRCULAR%20INCLUSIVA.pdf (accessed on 16 March 2025).
  30. Riobamba, E.C.M.D.C. La Ordenanza Que Regula la Gestión Integral de Residuos Sólidos en el Cantón Riobamba. ORDENANZA No. 009-2019. 2019. Available online: https://www.gadmriobamba.gob.ec/index.php/la-municipalidad/concejo-cantonal/ordenanzas/2019 (accessed on 16 March 2025).
  31. Kaur, G.; Luo, L.; Chen, G.; Wong, J.W.C. Integrated food waste and sewage treatment—A better approach than conventional food waste-sludge co-digestion for higher energy recovery via anaerobic digestion. Bioresour. Technol. 2019, 289, 121698. [Google Scholar] [CrossRef]
  32. Fiore, M.; Pellegrini, G.; Sala, P.L.; Conte, A.; Liu, B. Attitude toward food waste reduction: The case of Italian consumers. Int. J. Glob. Small Bus. 2017, 9, 185–201. [Google Scholar] [CrossRef]
  33. Kamaruddin, M.A.; Jantira, N.N.; Alrozi, R. Food waste quantification and characterization as a measure towards effective food waste management in university. IOP Conf. Ser. Mater. Sci. Eng. 2020, 743, 012041. [Google Scholar] [CrossRef]
  34. Adhikari, B.K.; Barrington, S.; Martinez, J.; King, S. Characterization of food waste and bulking agents for composting. Waste Manag. 2008, 28, 795–804. [Google Scholar] [CrossRef]
  35. Poore, J.; Nemecek, T. Reducing food’s environmental impacts through producers and consumers. Science 2018, 360, 987–992. [Google Scholar] [CrossRef]
  36. Jayathilake, N.; Aheeyar, M.; Wickramasinghe, N.; Bucatariu, C.; Drechsel, P. Case Studies on Food Waste Quantification, Characterization, and Identification of Prevention and Reduction Options in Colombo, Sri Lanka; FAO and IWMI: Rome, Italy, 2023. [Google Scholar] [CrossRef]
  37. ASTMD5231-92; Standard Test Method for Determination of the Composition of Unprocessed Municipal Solid Waste. ASTM International: West Conshohocken, PA, USA, 2016; p. 6.
  38. Hidalgo Crespo, J.A.; Soto, M.; Amaya-Rivas, J.L.; Borja-Mora, L.; Robles-Iglesias, R.; Banguera Arroyo, L.A. Towards a Circular Economy for Restaurant Waste in Guayaquil: Characterization and Energy Generation Potential. In Proceedings of the 9th International Conference on Energy and Environment Research, Porto, Portugal, 17–19 March 2023; Springer: Cham, Switzerland, 2023; pp. 537–545. [Google Scholar]
  39. Abd Alqader, A.; Hamad, J. Municipal solid waste composition determination supporting the integrated solid waste management in Gaza strip. Int. J. Environ. Sci. Dev. 2012, 3, 172. [Google Scholar] [CrossRef]
  40. Lebersorger, S.; Schneider, F. Discussion on the methodology for determining food waste in household waste composition studies. Waste Manag. 2011, 31, 1924–1933. [Google Scholar] [CrossRef]
  41. Bareille, N.; Gésan-Guiziou, G.; Foucras, G.; Coudurier, B.; Randriamampita, B.; Peyraud, J.-L.; Agabriel, J.; Redlingshofer, B. Les pertes alimentaires en filière laitière. Innov. Agron. 2015, 48, 143–160. [Google Scholar]
  42. den Boer, E.; Jędrczak, A.; Kowalski, Z.; Kulczycka, J.; Szpadt, R. A review of municipal solid waste composition and quantities in Poland. Waste Manag. 2010, 30, 369–377. [Google Scholar] [CrossRef] [PubMed]
  43. Duncan, T.V. Applications of nanotechnology in food packaging and food safety: Barrier materials, antimicrobials and sensors. J. Colloid Interface Sci. 2011, 363, 1–24. [Google Scholar] [CrossRef] [PubMed]
  44. Sarfraz, J.; Gulin-Sarfraz, T.; Nilsen-Nygaard, J.; Pettersen, M.K. Nanocomposites for food packaging applications: An overview. Nanomaterials 2020, 11, 10. [Google Scholar] [CrossRef] [PubMed]
  45. Milbrandt, A.; Zuboy, J.; Coney, K.; Badgett, A. Paper and cardboard waste in the United States: Geographic, market, and energy assessment. Waste Manag. Bull. 2024, 2, 21–28. [Google Scholar] [CrossRef]
  46. Saidan, M.N.; Drais, A.A.; Al-Manaseer, E. Solid waste composition analysis and recycling evaluation: Zaatari Syrian Refugees Camp, Jordan. Waste Manag. 2017, 61, 58–66. [Google Scholar] [CrossRef]
  47. Padmalatha, D.; Shresta, P. Impact of Recycling in a Glass Industry: A Project Management Study. Int. J. Soc. Sci. Res. 2016, 1, 50–61. [Google Scholar]
  48. Baek, C.R.; Kimg, H.D.; Jang, Y.-C. Exploring glass recycling: Trends, technologies, and future trajectories. Environ. Eng. Res. 2025, 30, 60–75. [Google Scholar] [CrossRef]
  49. Berman, H.; Shwom, R.; Cuite, C. Becoming FEW Conscious: A Conceptual Typology of Household Behavior Change Interventions Targeting the Food-Energy-Water (FEW) Nexus. Sustainability 2019, 11, 5034. [Google Scholar] [CrossRef]
  50. Knezevic, B.; Kurnoga, N.; Anic, I.-D. Typology of university students regarding attitudes towards food waste. Br. Food J. 2019, 121, 2578–2591. [Google Scholar] [CrossRef]
  51. Lin, L.; Xu, F.; Ge, X.; Li, Y. Biological treatment of organic materials for energy and nutrients production—Anaerobic digestion and composting. Adv. Bioenergy 2019, 4, 121–181. [Google Scholar]
  52. Mata-Alvarez, J.; Dosta, J.; Romero-Güiza, M.; Fonoll, X.; Peces, M.; Astals, S. A critical review on anaerobic co-digestion achievements between 2010 and 2013. Renew. Sustain. Energy Rev. 2014, 36, 412–427. [Google Scholar]
  53. Yang, L.; Ge, X.; Wan, C.; Yu, F.; Li, Y. Progress and perspectives in converting biogas to transportation fuels. Renew. Sustain. Energy Rev. 2014, 40, 1133–1152. [Google Scholar]
  54. Lucera, A.; Costa, C.; Marinelli, V.; Saccotelli, M.A.; Del Nobile, M.A.; Conte, A. Fruit and Vegetable By-Products to Fortify Spreadable Cheese. Antioxidants 2018, 7, 61. [Google Scholar] [CrossRef] [PubMed]
  55. Ardolino, F.; Parrillo, F.; Arena, U. Biowaste-to-biomethane or biowaste-to-energy? An LCA study on anaerobic digestion of organic waste. J. Clean. Prod. 2018, 174, 462–476. [Google Scholar]
  56. Salas-Millán, J.-Á.; Aznar, A.; Conesa, E.; Conesa-Bueno, A.; Aguayo, E. Functional food obtained from fermentation of broccoli by-products (stalk): Metagenomics profile and glucosinolate and phenolic compounds characterization by LC-ESI-QqQ-MS/MS. LWT 2022, 169, 113915. [Google Scholar] [CrossRef]
  57. Aneja, S.; Kalakoti, S.; Parihar, D. Urgent Need of Plastic Waste Management: A Review. Res. Rev. Int. J. Multidiscip. 2024, 9, 114–124. [Google Scholar]
  58. Naik, B.; Kumar, V.; Rizwanuddin, S.; Chauhan, M.; Gupta, A.K.; Rustagi, S.; Kumar, V.; Gupta, S. Agro-industrial waste: A cost-effective and eco-friendly substrate to produce amylase. Food Prod. Process. Nutr. 2023, 5, 30. [Google Scholar] [CrossRef]
  59. Siddiqui, J.; Pandey, G. A review of plastic waste management strategies. Int. Res. J. Environ. Sci. 2013, 2, 84–88. [Google Scholar]
  60. Osazee, I.T. Landfill in a sustainable waste disposal. Eur. J. Environ. Earth Sci. 2021, 2, 67–74. [Google Scholar]
  61. Shareefdeen, Z.; ElGazar, A.T. Management of Plastic Wastes through Recent Advanced Pyrolysis Processes. Appl. Sci. 2024, 14, 6156. [Google Scholar] [CrossRef]
  62. Knauer, K.; Higginson, C.; Liang, Y.; Lee, M. Circular plastics technologies: Depolymerization of polymers into parent monomers. Phys. Sci. Rev. 2024, 9, 2499–2524. [Google Scholar]
  63. Caldeira, C.; Vlysidis, A.; Fiore, G.; De Laurentiis, V.; Vignali, G.; Sala, S. Sustainability of food waste biorefinery: A review on valorisation pathways, techno-economic constraints, and environmental assessment. Bioresour. Technol. 2020, 312, 123575. [Google Scholar]
  64. Taherzadeh, M.J.; Wong, J.W.; Nelles, M.; He, P. Special issue on bioconversion of food wastes. Bioresour. Technol. 2018, 248, 1. [Google Scholar]
  65. Panou, A.; Karabagias, I.K. Migration and safety aspects of plastic food packaging materials: Need for reconsideration? Coatings 2024, 14, 168. [Google Scholar] [CrossRef]
Figure 1. Percentage of waste generated.
Biomass 05 00018 g001
Figure 2. Organic structure of food waste.
Biomass 05 00018 g002
Figure 3. Recycle structure of food waste.
Biomass 05 00018 g003
Figure 4. Correlation between ash content and pH in different food waste components.
Biomass 05 00018 g004
Table 1. Weight of food waste generated.
WeightOrganics (Kg)Recyclables (Kg)Disposable (Kg)Total Waste (Kg)
W1 (Monday)209.2662.2052.52323.98
W2 (Tuesday)140.0545.9852.36238.39
W3 (Wenesday)141.2841.8648.89232.03
W4 (Thrusday)123.5356.7766.85247.16
W5 (Friday)81.3447.3144.78173.43
W6 (Saturday)107.1838.4545.97191.60
W7 (Sunday)127.7464.0183.61275.36
Data collection and analysis.
Table 2. Descriptive Statistics of Food Waste Components.
VariableNN*Mean (kg)Standard ErrorStd. Dev.Min (kg)Median (kg)Max (kg)
Organics (kg)70132.914.939.681.3127.7209.3
Recyclables (kg)7050.943.8010.0738.4547.3164.01
Disposable (kg)7056.435.3014.0344.7852.3683.61
Total Waste (kg)70240.319.050.3173.4238.4324.0
Data collection and analysis.
Table 3. Waste generation per capita.
WeightTotal Wase (Kg)Average
DAY 1323.9824.92
DAY 2238.3918.34
DAY 3232.0317.85
DAY 4247.1619.01
DAY 5173.4313.34
DAY 6191.6014.74
DAY 7275.3621.18
TOTAL1681.94129.38
Waste generation er capita18.48
Data collection and analysis.
Table 4. Dry matter and moisture content.
SampleInitial Weight (g)Final Weight (g)Dry Matter (%)Moisture (%)
Vegetable FW156229418.8 ± 0.5%81.2 ± 0.5%
Fruit FW146128819.7 ± 0.6%80.3 ± 0.6%
Vegetable Protein FW13,4345794.3 ± 0.4%95.7 ± 0.4%
Animal Protein FW40422054.5 ± 0.7%45.5 ± 0.7%
Average--24.3 ± 0.8%75.7 ± 0.8%
Data collection and analysis.
Table 5. Food waste characterization.
ParameterVegetable FW Fruit FW Vegetable Protein FW Animal Protein FW
Fat (%)3.77 ± 0.107.56 ± 0.209.92 ± 0.2517.65 ± 0.50
pH5.63 ± 0.054.32 ± 0.105.32 ± 0.086.42 ± 0.12
Conductivity (mS/cm)7.62 ± 0.157.22 ± 0.207.56 ± 0.184.51 ± 0.12
Ash (%)91.00 ± 0.5091.08 ± 0.4594.78 ± 0.5575.06 ± 0.80
Real density (g/mL)0.353 ± 0.0150.273 ± 0.0200.350 ± 0.0180.304 ± 0.025
Bulk density (g/mL)0.372 ± 0.0200.314 ± 0.0250.378 ± 0.0220.379 ± 0.030
Fiber (%)3.55 ± 0.1014.49 ± 0.2511.79 ± 0.300.97 ± 0.08
Data collection and analysis.
Disclaimer/Publisher’s Note: The statements, opinions and data contained in all publications are solely those of the individual author(s) and contributor(s) and not of MDPI and/or the editor(s). MDPI and/or the editor(s) disclaim responsibility for any injury to people or property resulting from any ideas, methods, instructions or products referred to in the content.

