1. Introduction
Permittivity measurements are essential for characterizing dielectric properties of materials, with important applications in material science, food science, chemistry, biology, and biomedical engineering [
1,
2,
3,
4,
5]. This material parameter quantifies a material’s ability to store electrical energy within an electric field. By measuring relative permittivity—also referred to as dielectric constant—over a wide frequency range, dielectric spectroscopy has been effectively applied in the food industry for quality control processes [
6,
7]. A comprehensive review of dielectric measurement techniques across different frequency ranges, including low-frequency methods, broadband spectroscopy, and high-frequency imaging, is presented in [
8]. The frequency range of interest varies depending on the specific application and the physical phenomena used to characterize the material under test (MUT).
Although sensors operating in the optical frequency range, such as near-infrared spectroscopy, offer high sensitivity, their limited penetration depth makes them unsuitable for characterizing bulky MUTs [
9,
10]. To characterize MUTs based on the presence of polar or non-polar molecules, the relevant phenomenon is dipolar or orientational polarization dominating in the microwave frequency range. Various measurement techniques have been reported in the literature to capture this effect. For example, ref. [
11] proposed a resonance-based method that detects material property changes by observing shifts in the sensor’s resonant frequency, offering high sensitivity. However, this approach relies on a single frequency point. For applications requiring permittivity characterization over a broad radio and microwave frequency range, the techniques are typically based on coaxial waveguides or transmission line-based test cells [
12,
13,
14]. Another type of broadband dielectric spectroscopy sensor uses the free-space technique, where antennas transmit and receive RF or microwave signals through the MUT. However, this method is prone to external noise, making it challenging to maintain accuracy due to environmental influences [
15].
For composite materials and biomedical samples, sensing is typically performed at lower megahertz frequencies. The dominant physical phenomenon in this frequency range is interfacial polarization, which occurs when charges accumulate at the interfaces between different materials or phases within a composite. This effect diminishes as the frequency exceeds its natural resonance. Blande et al. [
16] presented a low-frequency capacitive sensor designed to detect the void fraction of dielectric fluids in industrial applications. The study compares three electrode configurations: rod, concave, and parallel plate—and demonstrates that the parallel plate design, combined with a guard electrode and a high-dielectric-constant insulating material, provides the highest sensitivity. The authors attribute this to the uniform electric-field distribution and enhanced capacitance response enabled by the chosen materials and geometry.
Despite its simplicity, commercial capacitive sensing systems are often expensive, making them less accessible for small research labs and universities. In addition, a major challenge lies in the accuracy of the measurement, which is affected by fringing electric fields at the edges of the sensing electrodes. In commercial parallel-plate capacitance test fixtures, the fringing effect is typically compensated by using a guard electrode. This additional electrode is integrated coplanar to the sensing electrode and maintained at the same potential. By doing so, the guard electrode eliminates electric-field coupling at the edges, effectively preventing fringing fields from contributing to the measurement results [
16,
17,
18]. The electric field between the driving electrode and the low-potential electrode remains straight and uniform near the electrode edges due to the presence of a guard electrode. While this is an effective way to eliminate fringing effects from the measured capacitance, the inclusion of a guard electrode increases system complexity. Specifically, the guard electrode must be held at the same potential as the sensing electrode, requiring additional circuitry such as a high-input-impedance voltage follower to prevent current draw. Furthermore, a specially designed fixture incorporating the guard electrode is needed. Due to these requirements, implementing this accuracy-enhancement technique entirely from scratch poses significant challenges in an educational or small laboratory setting.
In another study, Piuzzi et al. [
19] designed and experimentally characterized a parallel-plate admittance cell, introducing a method to mitigate fringing-field effects using a correction factor derived from electromagnetic simulations of the sensor configuration. Their admittance cell is compatible with standard LCR meters, including two-terminal devices, and does not require a guard electrode. However, constructing the admittance cell requires precision machining of its components, making it too complex for in-house development or educational purposes. Another limitation is that the correction factor used to mitigate fringing effects must be derived from electromagnetic simulations. This means that any change in geometry or material of the admittance cell requires a new round of simulations to determine an appropriate correction factor. Moreover, limited access to commercial electromagnetic simulation software can present a practical challenge for small laboratories seeking to adopt this approach.
This paper presents a novel and low-frequency dielectric measurement approach using a low-cost cylindrical capacitive sensor (CCS). The study focuses on four non-ionic substances—air, deionized water (DI water), ethanol, and methanol—demonstrating the effectiveness of capacitance-based measurements for determining their dielectric constant at 1 MHz. Air and water, with well-known dielectric constants, are used as calibration standards to eliminate the effects of fabrication tolerance, parasitic capacitance, and fringing fields at the electrodes’ edges. The proposed CCS is easy to fabricate in-house using readily available materials like a PVC spacer, cut from a standard water pipe, and circular copper plates cut from a copper sheet. This low-cost construction requires no precision machining, and exact cell dimensions are not critical, as calibration compensates for fabrication tolerances. Capacitance is measured using an LCR meter, and the dielectric constant of the MUT is extracted from the measured values. The proposed design, combined with this straightforward calibration method, enables the creation of an effective low-frequency capacitive sensor for liquids at minimal cost. Furthermore, the calibration approach allows flexibility in MUT volume, as reliable permittivity extraction is independent of the test cell’s physical size and dielectric properties of the spacer. In this work, the CCS is validated at 1 MHz using four reference materials (air, deionized water, ethanol, and methanol), representing the lower megahertz region of interest. In addition, a frequency-swept measurement from 10 to 30 MHz is presented for cow’s milk to demonstrate the applicability of the sensor concept beyond 1 MHz.
2. Materials and Methods
2.1. Theoretical Background
By assuming a homogeneous electric field between the electrodes, the capacitance
of a parallel-plate capacitor can be expressed as follows:
where
ε0 is the permittivity of free space, a physical constant with an approximate value of 8.854 × 10
−12 F/m;
εr is the dielectric constant of the material filling the gap between the two electrodes of the parallel-plate capacitor;
d is the spacing between the electrodes; and
A is the area of each electrode plate. In the ideal case, the dielectric constant specific to the type and composition of the MUT can easily be extracted.
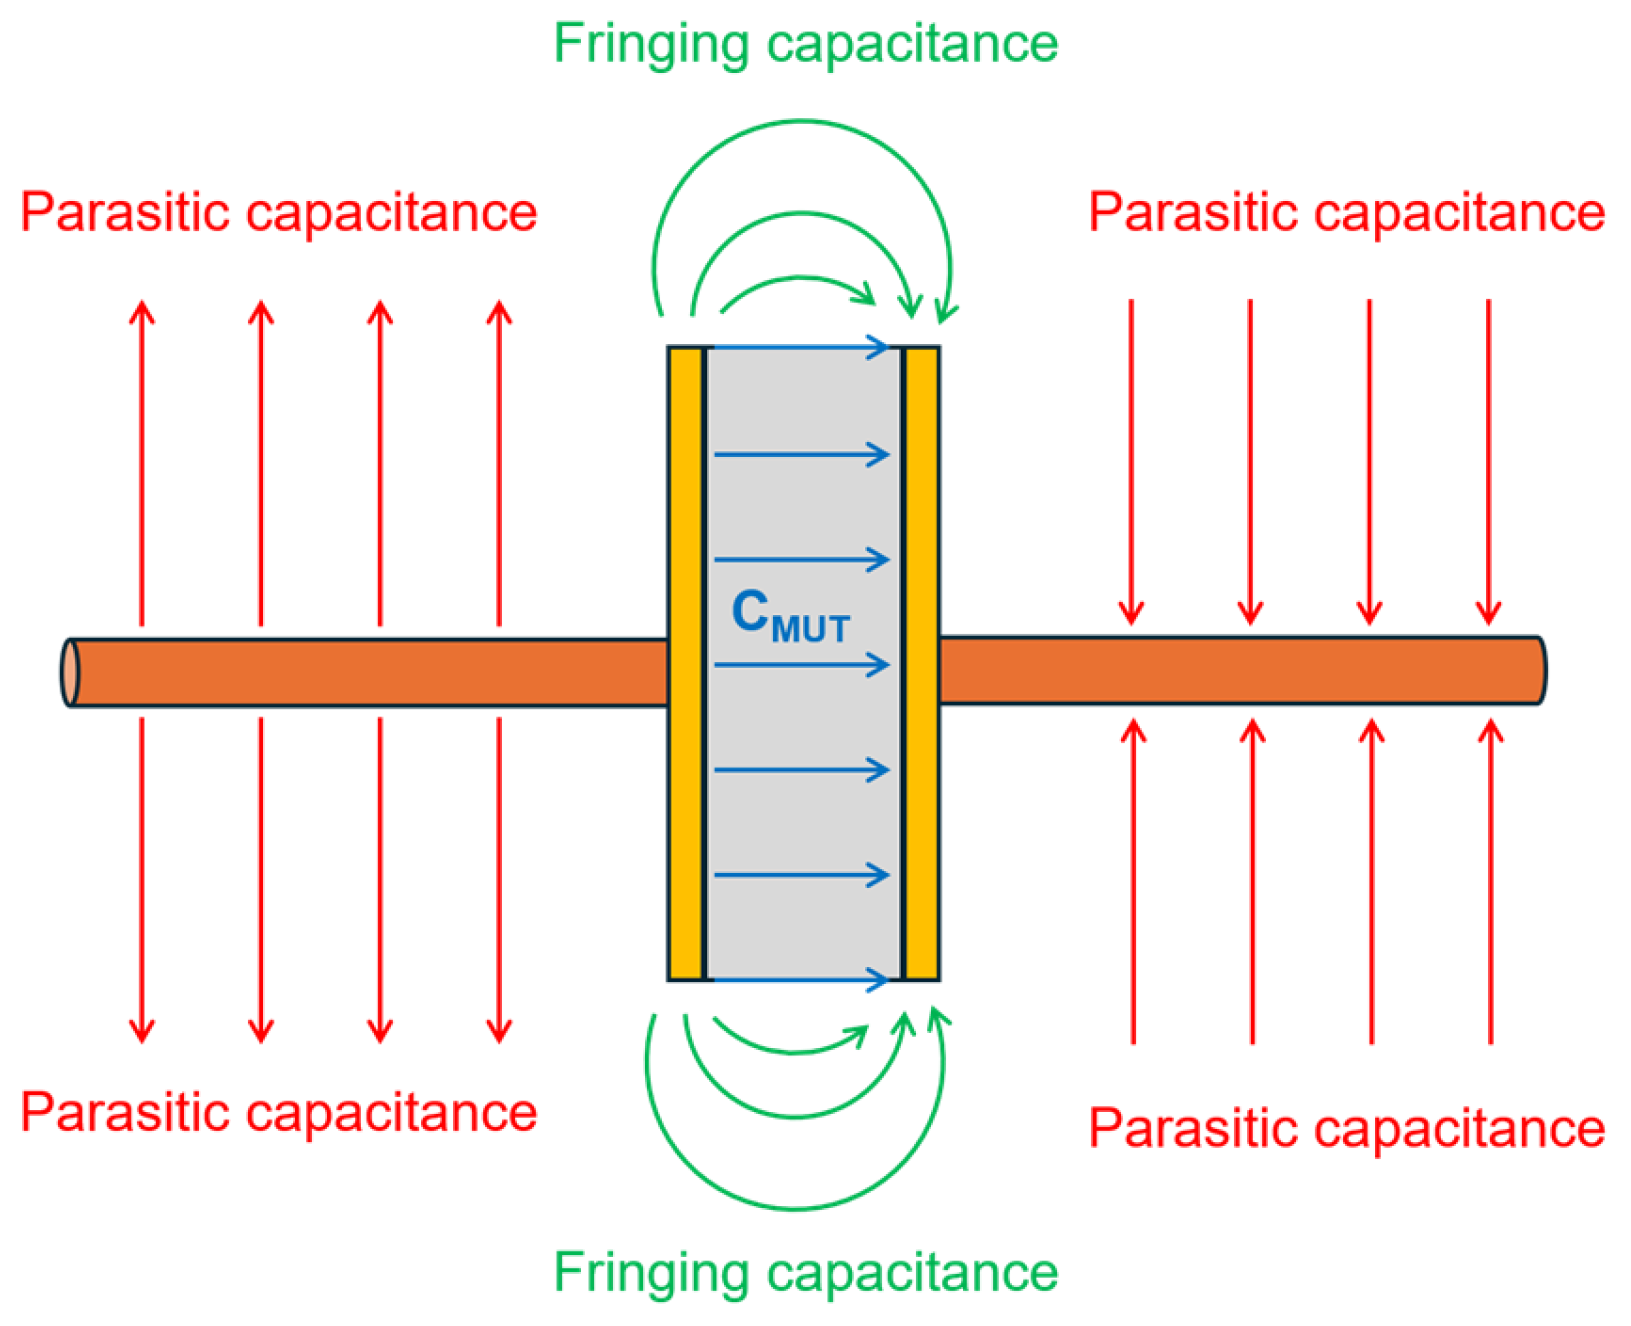
In practical measurements, the total measured capacitance consists of three components: the capacitance contributed by the MUT sandwiched between the electrodes, the fringing-field capacitance at the electrode edges, and the parasitic capacitance from connecting wires and other elements of the admittance cell. The measured capacitance can be expressed as follows:
where
Cmeas is the total capacitance measured by the instrument,
CMUT is the contribution from the MUT,
Cfr is the fringing-field capacitance, and
Cp is the parasitic capacitance of the admittance originating from peripheral structures like connecting wires that connect the electrodes of the capacitor to the measurement equipment.
Figure 1 shows an illustration of a typical parallel-plate capacitor configuration with all capacitive components from Equation (2). Blue electric field lines in the figure depict the homogeneous electric field between the electrode plates. The green lines represent the fringing electric fields at the edge of the electrodes. Finally, the red lines illustrate the electric field lines of parasitic capacitance originating from the connecting wires of both electrode plates. For the extraction of MUT’s dielectric constant, it is important to extract
CMUT from the measured value. The procedure for this extraction is described in
Section 3.2.
2.2. Sensor Structure and Fabrication
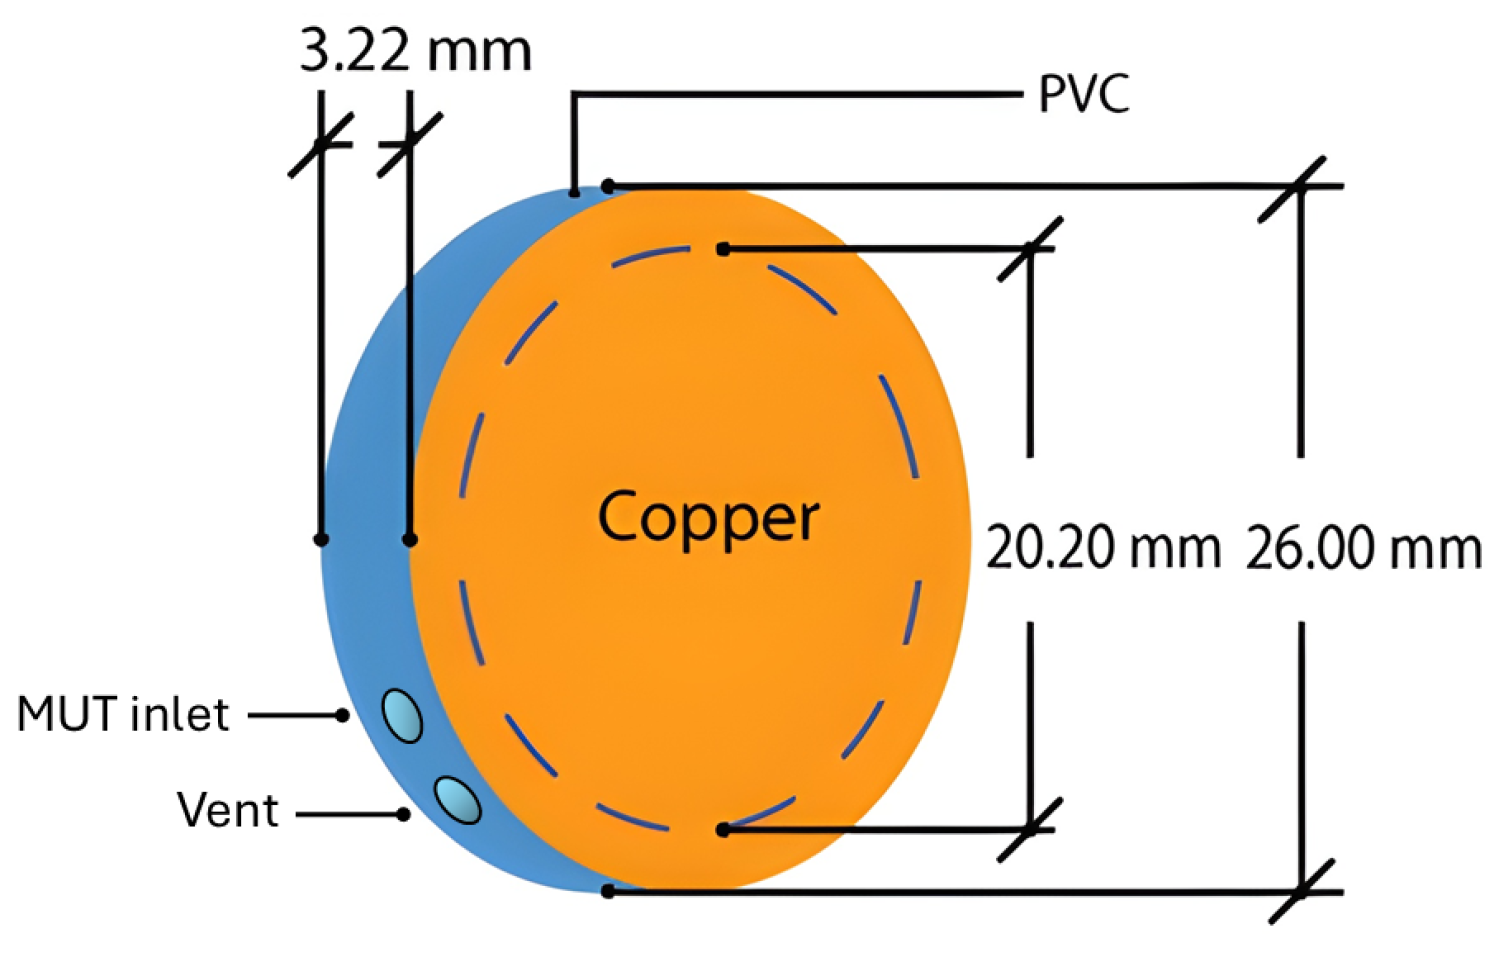
Our proposed test cell is a cylindrical-shaped parallel-plate capacitive sensor designed for dielectric liquid characterization. It comprises two circular electrodes made from 0.1 mm-thick copper sheets, positioned parallel to each other and separated by a cylindrical spacer constructed from a PVC hollow section cut from a commercially available water pipe, effectively defining the active sensing area and maintaining a fixed distance between the electrodes. The PVC spacer has an inner diameter of 20.2 mm, an outer diameter of 26 mm, and a height of 3.22 mm. This PVC section also serves as the side wall of the cylindrical container for the MUT with a sample volume of approximately 1.03 mL. The height of the spacer corresponds to the electrode separation distance, denoted as
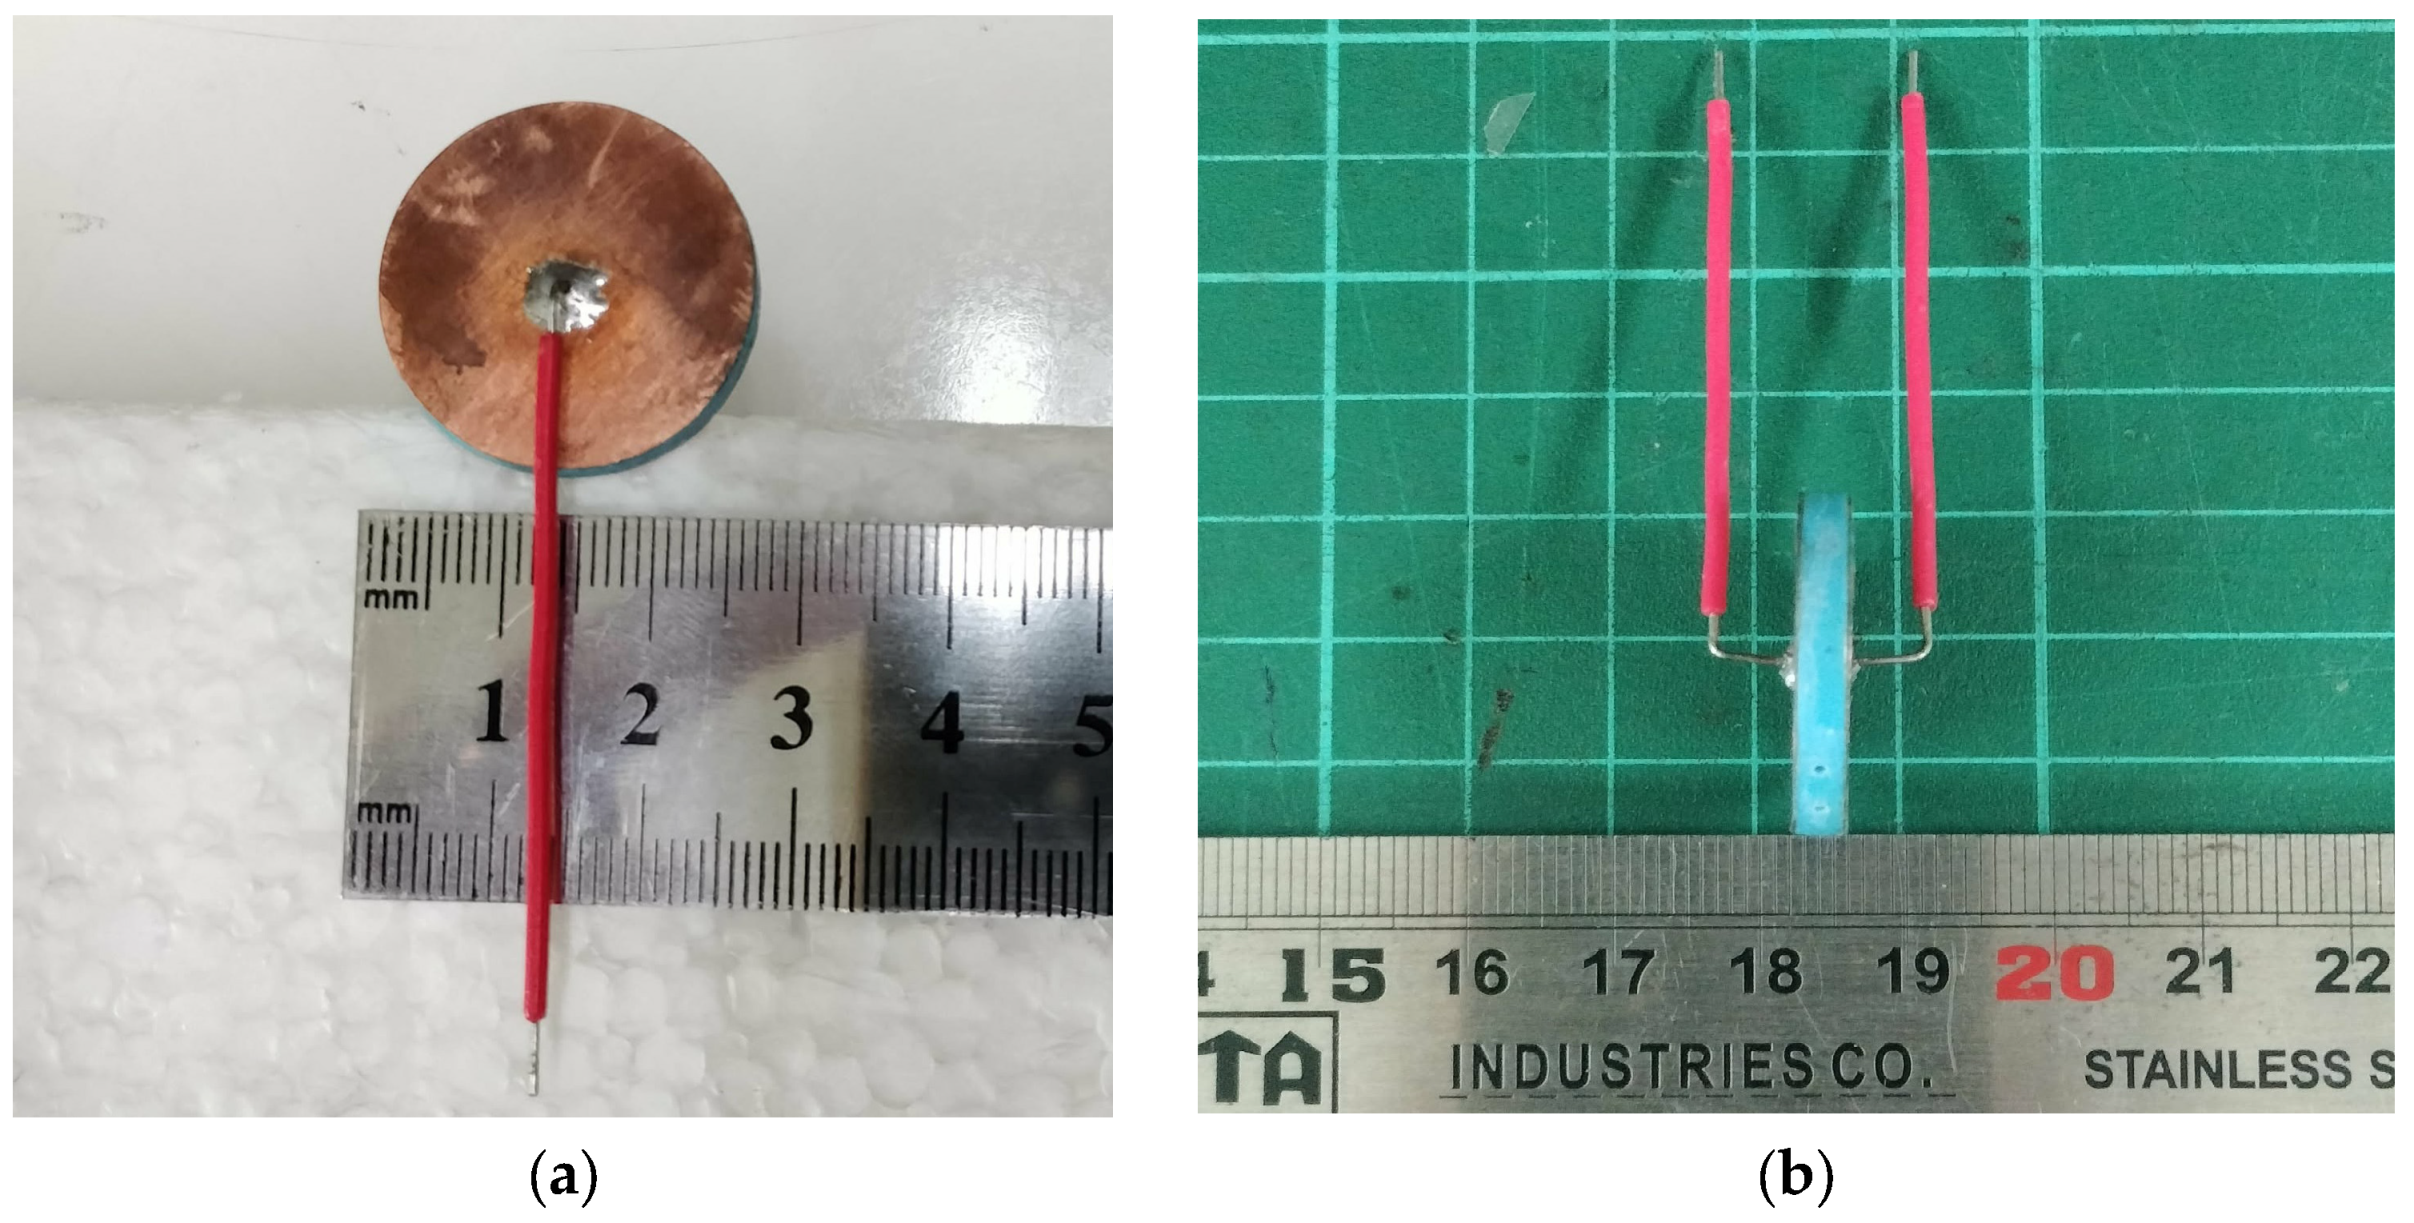
d, as found in Equation (1). Circular geometry is chosen for a more uniform electric field distribution between the plates and to reduce edge effects, which can introduce inaccuracy in the capacitance measurement. The proposed CCS is employed in both electromagnetic field simulations using ANSYS Q3D Extractor 2025 R2 (Ansys Inc., Canonsburg, PA, USA) and experimental measurements using an Agilent 4285A LCR meter (Agilent Technologies, Penang, Malaysia). An illustration of the CCS with all geometrical dimensions is shown in
Figure 2, and the fabricated sensor is presented in
Figure 3a,b. The copper electrodes were aligned coaxially on either side of the PVC spacer and bonded using a thin adhesive layer to ensure mechanical stability, maintain a uniform electrode separation, and prevent liquid leakage during measurements. The adhesive was applied only at the electrode periphery to minimize any influence on the effective sensing region.
The CCS incorporates a 1 mm inlet and a vent, implemented as small through-holes drilled in the PVC spacer, to ensure bubble-free filling of the sensing region with the MUT. The liquid is introduced using a needle and a syringe, while the vent enables trapped air to escape during injection. This design enhances accuracy and repeatability, as air bubbles disturb the electric field distribution and cause unstable measurements.
The materials under test were air, DI water, ethanol, and methanol. DI water used for the experiments was laboratory-grade DI water (Puricare, Samut Prakan, Thailand), specified to be clear and colorless with pH 5.5–7.0 at 25 °C with a low electrical conductivity in the order of a few µS/cm, according to the manufacturer. Ethanol used in the experiments was high-purity analytical-grade reagent (assay ≥99.9% by gas chromatography, water content ≤ 0.2% by coulometry). Methanol (CH3OH, ≥ 99.8% purity, analytical grade) was likewise used as received without further processing.
2.3. Mathematical Modeling
In
Section 2.1, the general operating principle of a parallel-plate capacitive sensor was introduced, where the measured capacitance arises from the dielectric material placed between two electrodes and additional contributions from fringing electric fields and measurement-related parasitics. Building on this foundation, the mathematical model is now extended to reflect the specific geometry and materials of the proposed sensor described in
Section 2.2.
Due to the PVC sidewall from
Figure 2, the measured capacitance value consists of multiple capacitive components. Accordingly, the measured capacitance can be expressed as follows:
where
represents the capacitance contribution from the liquid-filled region,
accounts for the contribution of the PVC sidewall,
represents the fringing-field capacitance due to finite electrode dimensions, and
includes parasitic capacitances associated with connecting wires, connectors, leads, and the test fixture. In the experimental setup,
was minimized by applying OPEN and SHORT compensation at the ends of the two-wire connections of the CCS using the LCR meter. This procedure effectively shifts the reference plane of the measurement to the electrode terminals of the sensor. Consequently, the parasitic contribution is assumed to be negligible in the analytical formulation, and the sensor capacitance can be approximated as follows:
2.3.1. Capacitance Contribution of the MUT
Since the circular electrodes fully cover the outer diameter of the PVC spacer, the effective sensing region can be approximated as a liquid-filled core bounded by the inner diameter of the PVC spacer. Under this assumption, the capacitance contribution of the MUT is therefore modeled using the parallel plate approximation as follows:
where
is the dielectric constant of the MUT;
is the height of the PVC spacer; and
is the base area of the MUT cylinder with
where
is the inner diameter of the PVC spacer.
2.3.2. Capacitance Contribution of the PVC Spacer
In addition to the liquid-filled core region, the annular region between the inner and outer diameters of the spacer is occupied by rigid PVC and lies within the electric field established between the electrodes. Because the electrodes extend to the outer diameter of the PVC spacer, this annular region contributes an additional capacitance that can be approximated as follows:
where
is the dielectric constant of rigid PVC;
is the height of the PVC spacer; and
is the area of the annular region with
with
and
as the outer and inner diameters of the PVC spacer.
2.3.3. Treatment of Fringing Capacitance
Due to the finite dimensions of the circular electrodes, fringing electric fields are inevitably present at the electrode edges and extend partially into the surrounding air. The resulting fringing capacitance, denoted as
, depends on the detailed three-dimensional field distribution and MUT’s property. Thus,
cannot be expressed in a closed analytical form for the present geometry. Instead, it is assessed indirectly through comparison between analytical predictions, numerical simulations, and experimental measurements, which will be discussed in detail in
Section 3.
2.3.4. Final Analytical Expression
Based on the above considerations, the total capacitance for the proposed CCS configuration is modeled as follows:
This analytical formulation provides a physically intuitive description of the sensor behavior and serves as a baseline for comparison with numerical simulations and experimental measurements presented in the subsequent sections.
2.4. Numerical Modeling and Simulation
Numerical simulations were performed using ANSYS Q3D Extractor, which employs three-dimensional quasi-static electromagnetic field solvers for the extraction of resistance, inductance, capacitance, and conductance matrices. This approach is well-suited to electrically small, low- to mid-frequency interconnect and capacitive structures, where wave propagation effects can be neglected.
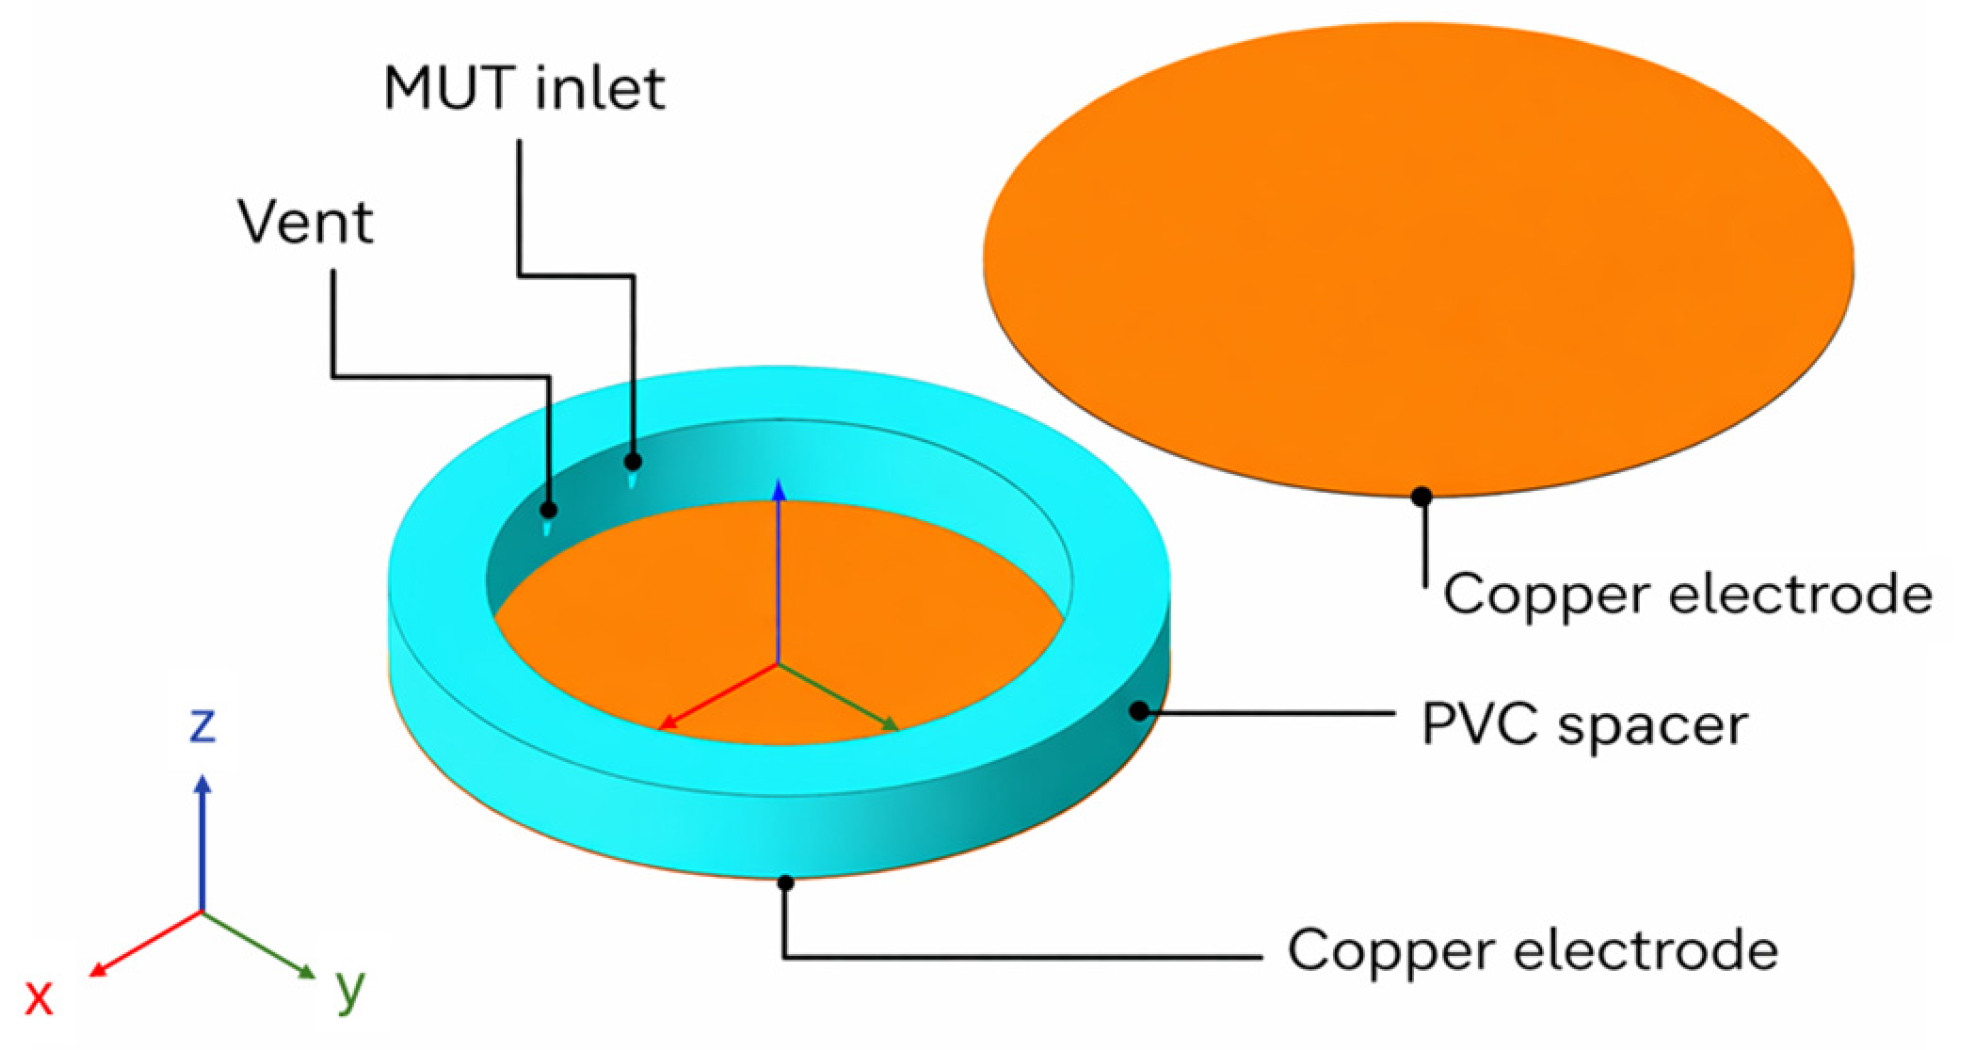
The three-dimensional geometry of the capacitive sensor was modeled according to the dimensions described in
Section 2.2. The circular copper electrodes and the PVC spacer were explicitly included in the model, as shown in
Figure 4. To emulate an unbounded environment, the sensor was enclosed within a surrounding air region whose outer boundary was placed at least five times the spacer outer diameter away from the structure so that the electric field decayed to negligible levels before reaching the computational boundary.
A floating reference at infinity was applied during matrix reduction to avoid artificial grounding effects and to retain only the coupling between conductors. Under this condition, the terminal capacitance between the two electrodes was extracted from the reduced capacitance matrix and interpreted as the two-terminal capacitance corresponding to the LCR meter measurement. This procedure ensures direct comparability between numerical simulation, analytical modeling, and experimental measurements.
The electrodes were modeled as perfect electric conductors. The surrounding region was defined as air with a dielectric constant of
. The PVC spacer was assigned a dielectric constant of
[
20,
21,
22,
23,
24], consistent with reported values at low frequencies near our operating frequency of 1 MHz. The MUTs in this study were air, DI water, ethanol, and methanol. In numerical simulations, DI water was modeled with a dielectric constant of
[
25,
26] at the temperature of 20 °C. Ethanol and methanol were modeled using dielectric constant values of
[
27,
28,
29,
30], and
[
31,
32] at 20 °C, respectively.
Capacitance extraction was performed at a single frequency point of 1 MHz in both simulations and experimental measurements. The default adaptive meshing strategy in ANSYS Q3D was employed, with the solver iterating until the relative change in extracted terminal capacitance between subsequent passes was below 1%, thereby ensuring convergence of the solution. The converged terminal capacitance values obtained at 1 MHz were then used for subsequent comparison with analytical predictions and experimental results.
2.5. Measurement Procedure
Capacitance measurements were performed using the LCR meter configured in a two-terminal measurement arrangement. The instrument was operated in the parallel capacitance mode, which is appropriate for low-loss capacitive structures at the selected operating frequency. The liquid measurements at 1 MHz were conducted at °C, which was verified using a glass thermometer immediately before loading each liquid sample into the CCS. This temperature condition is consistent with the value used in the numerical simulations.
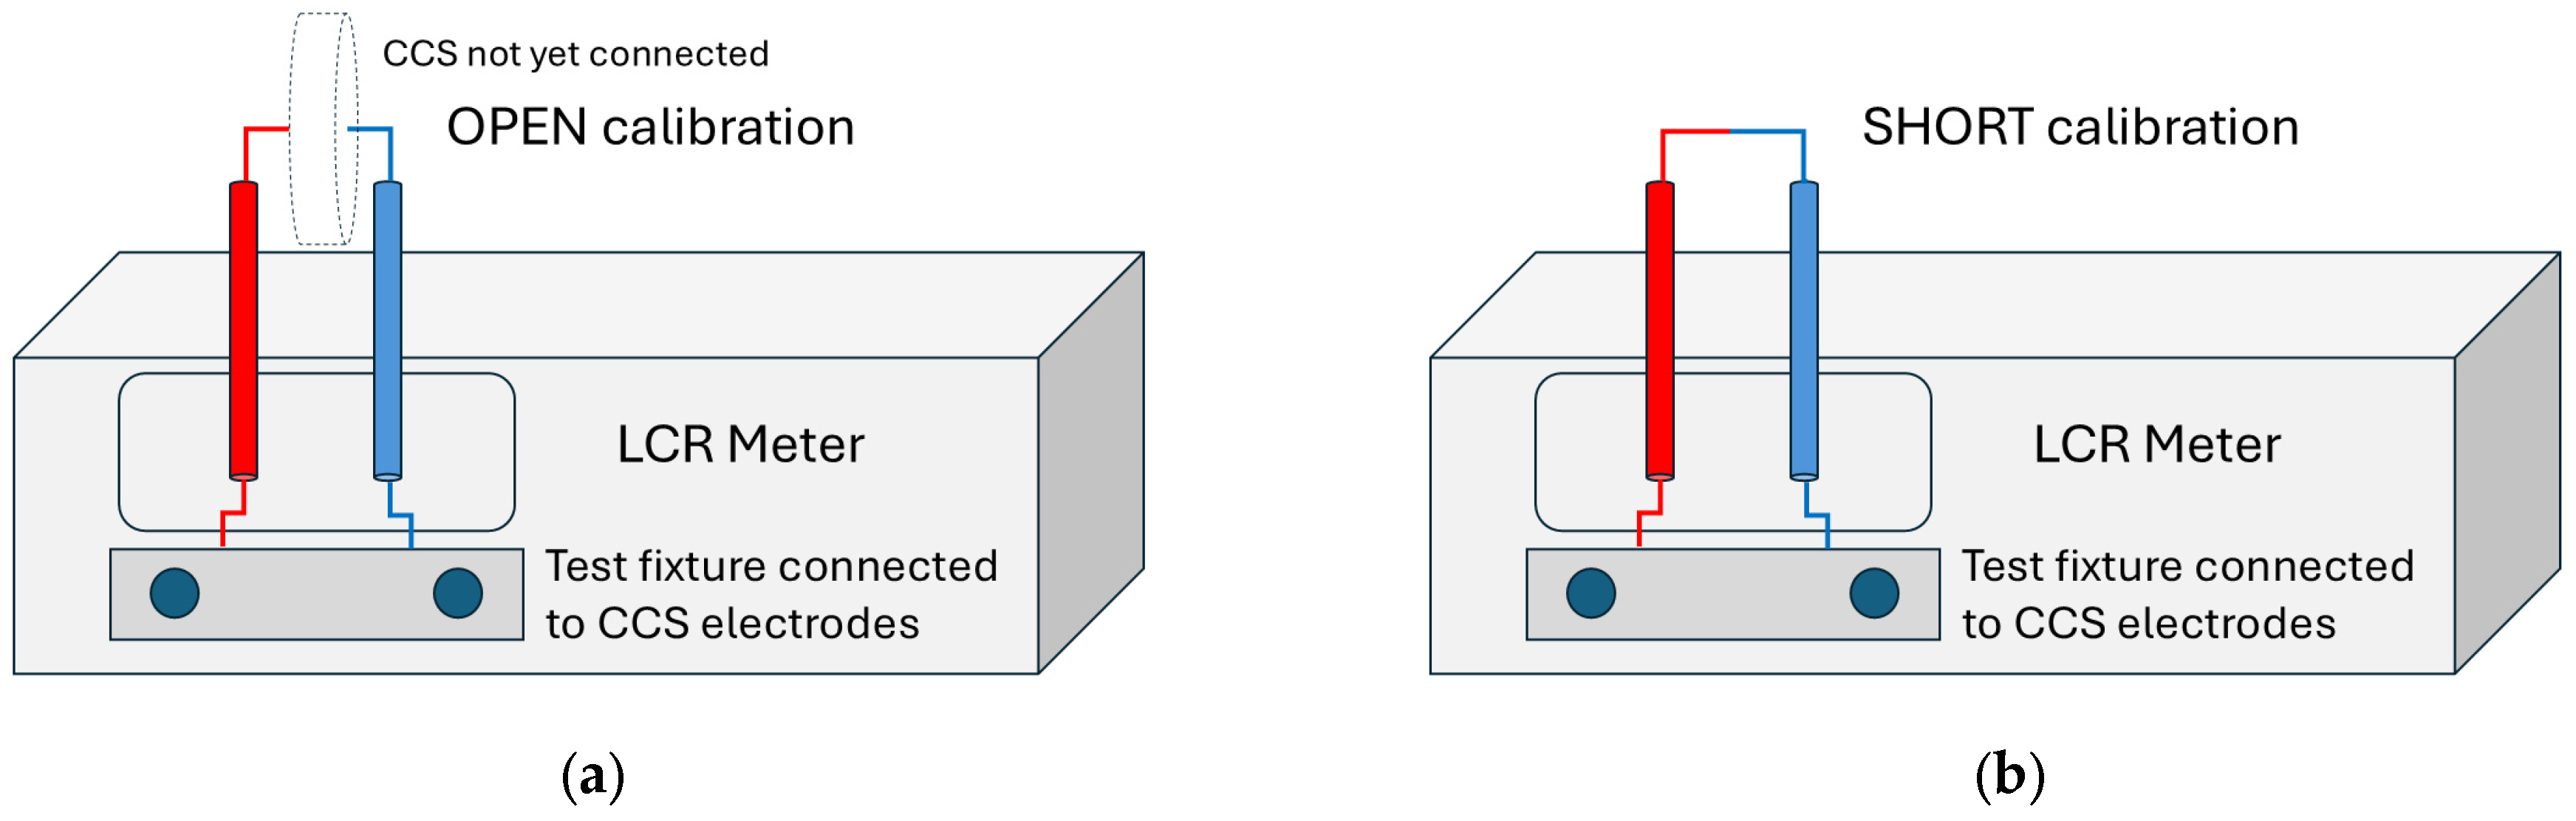
Prior to measurement, OPEN and SHORT compensation were performed using the same two-wire connection as for the CCS. During OPEN calibration, the measurement leads were left unterminated to account for stray capacitances, whereas SHORT calibration was carried out with the terminals shorted to compensate for residual series impedance of the leads and connections, as shown in
Figure 5. This procedure effectively removes lead- and fixture-related parasitic effects and shifts the electrical reference plane to the sensor electrodes, ensuring that the measured capacitance corresponds primarily to the CCS. OPEN and SHORT compensation was performed on the connecting wires prior to soldering them to the CCS electrodes. For the OPEN calibration, the free ends of the wires were left unterminated, while for the SHORT calibration, the same wire ends were directly shorted using a small socket. After completing both calibration steps, the wires were soldered once to the CCS electrodes and were not subsequently desoldered or re-soldered. This procedure minimizes the risk of contact degradation and avoids additional parasitic effects associated with repeated soldering.
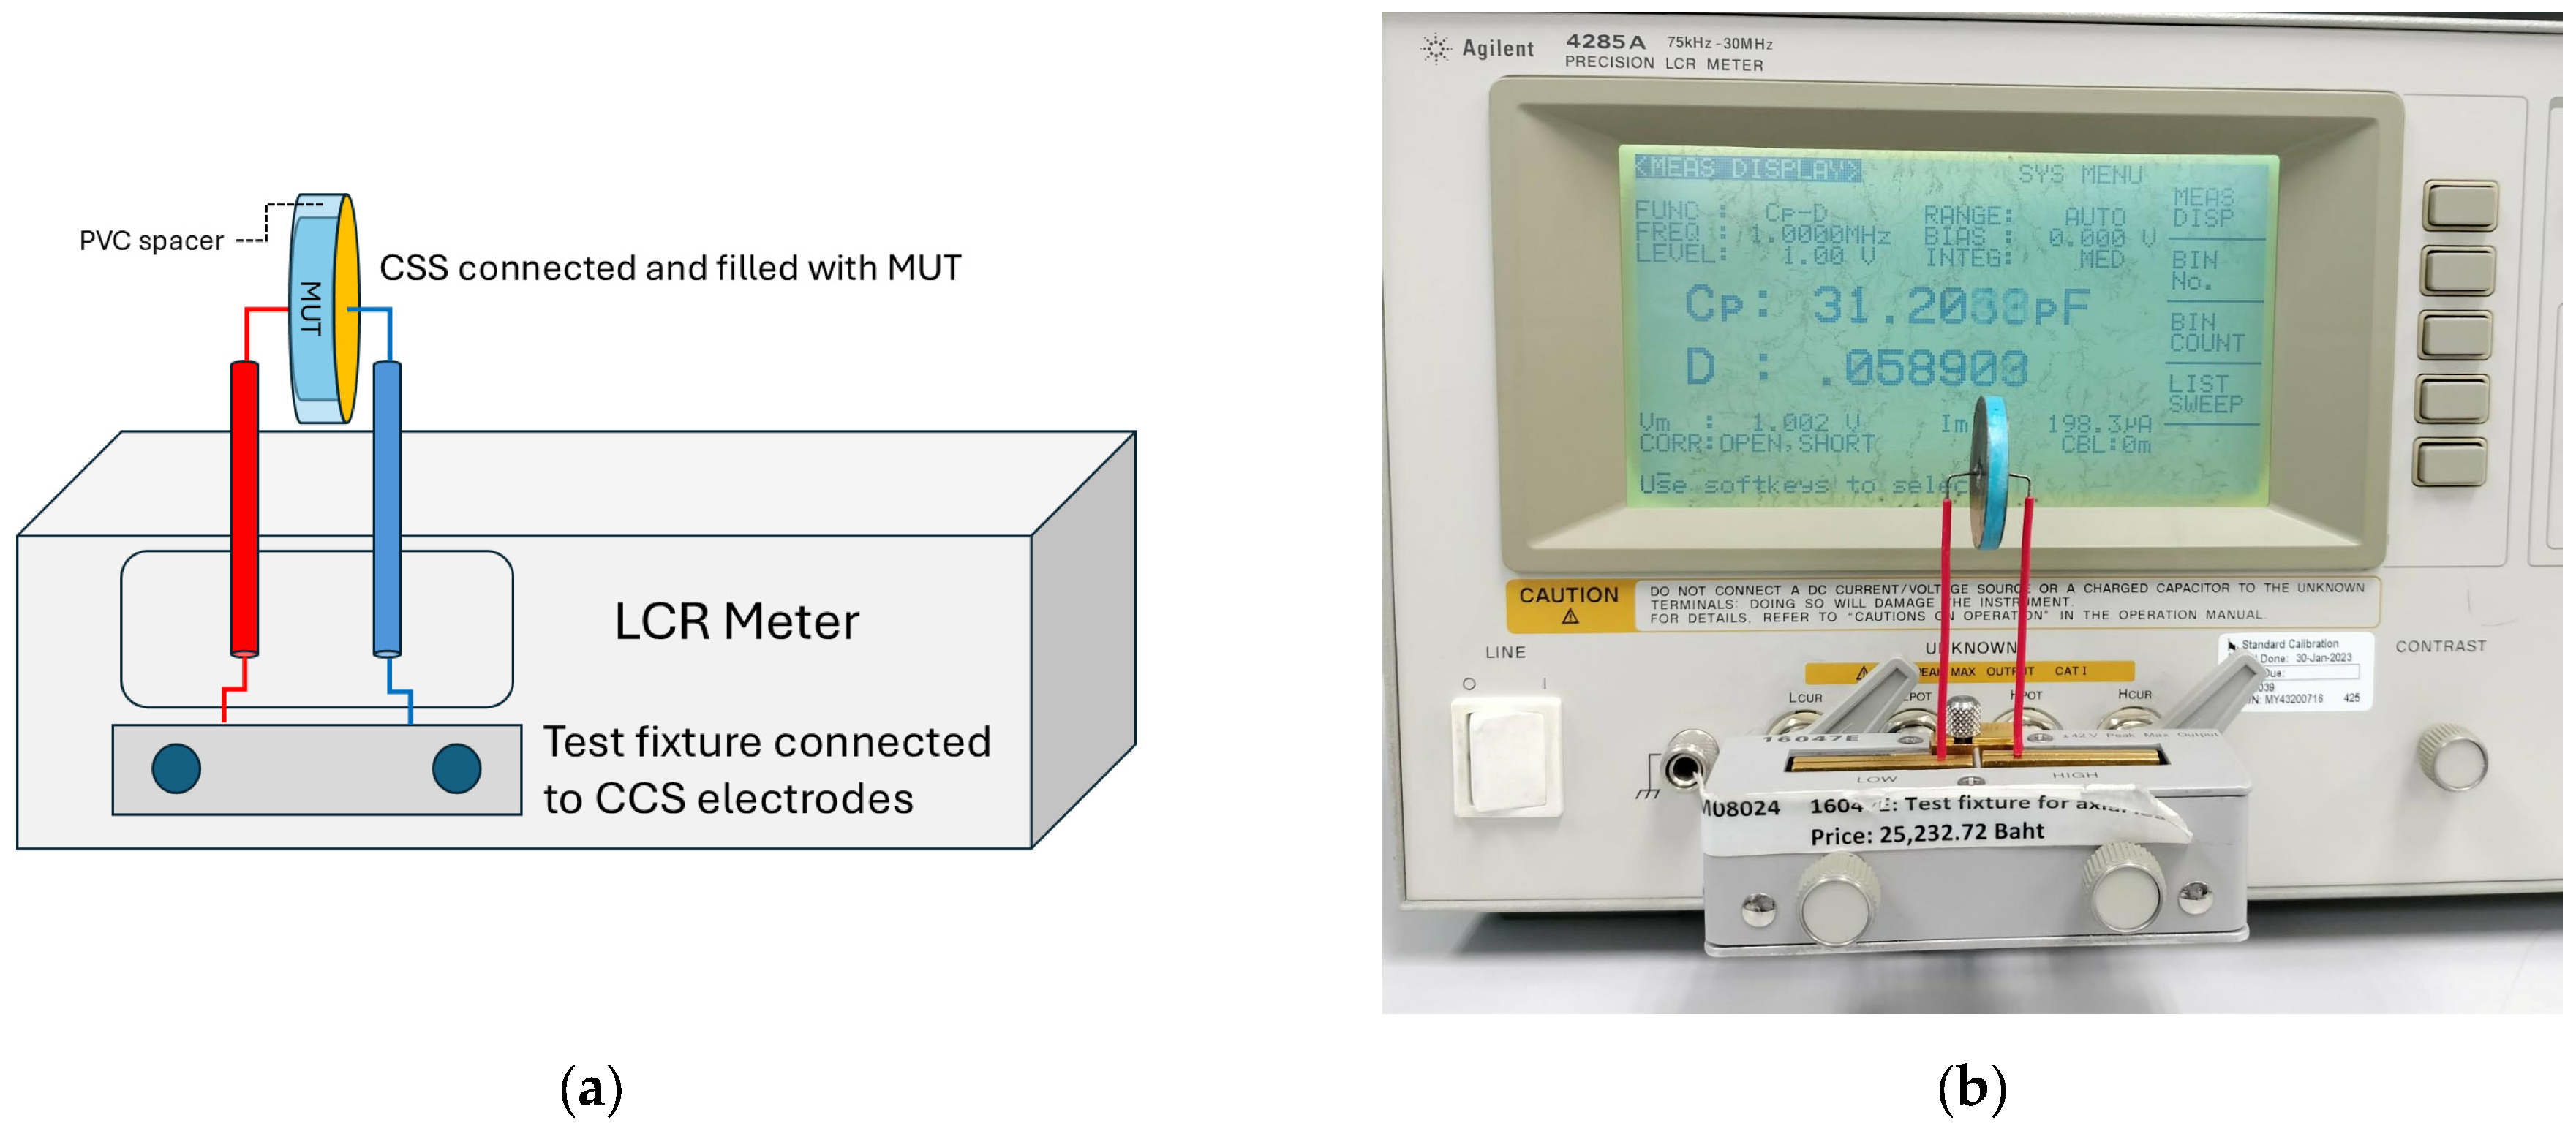
After OPEN and SHORT compensation, the CCS was filled with MUT, and capacitance readings were recorded once the displayed value stabilized, as shown in
Figure 6. Separate measurements were carried out for air, DI water, ethanol, and methanol under identical measurement conditions, and the stabilized capacitance values obtained from the LCR meter were used for subsequent comparison with analytical predictions and numerical simulation results. To evaluate repeatability of the measurement setup, five consecutive measurements were performed for each base material (air, DI water, ethanol, and methanol) at 1 MHz. Parallel capacitance
and dissipation factor
were recorded using the LCR meter operated in
–
mode. OPEN–SHORT compensation was applied at the end of the two-wire connection prior to all measurements, thereby shifting the reference plane to the CCS electrodes.
3. Results and Discussion
This section presents and discusses the analytical, numerical, and experimental results obtained using the proposed CCS. First, analytically calculated capacitance values derived from (9), neglecting fringing capacitance, are presented to establish a theoretical baseline. Next, simulation results obtained using ANSYS Q3D Extractor are reported and compared with the measurements. Finally, the dielectric constants of the MUT extracted using the analytical and calibration-based methods are compared.
3.1. Capacitance Comparison
Capacitance values from simulation, calculation, and measurement are summarized in
Table 1. The calculations were performed using known geometrical parameters of the CCS and literature-reported dielectric constants of the MUTs. Fringing electric field effects and higher-order parasitic contributions were not explicitly included in the analytical model. Therefore, the calculated capacitance represents an idealized approximation of the CCS response.
For all MUTs, the simulated results show small deviations from the measurements. These discrepancies are attributed to fringing fields, fabrication tolerances (e.g., spacer thickness and electrode alignment), and residual parasitic effects in the experimental setup that are not fully captured in the simulation model. The calculated values are consistently lower than both simulation and measurement results because the analytical model neglects fringing fields. Overall, the close agreement among calculated, simulated, and measured capacitance values across MUTs with markedly different dielectric constants demonstrates the robustness and reliability of the proposed CCS.
Table 2 summarizes the means and standard deviations of
and the dissipation factor
extracted from five repeated measurements. The relatively small standard deviations for
and
confirm repeatability of the measurement and support the applicability of the model used in the subsequent relative permittivity extraction.
From the experimentally measured capacitance values, the dielectric constant of the MUT can be extracted either through analytical calculation or via a calibration-based approach. In the latter, the capacitance of the CCS is measured when loaded with two reference MUTs with known dielectric constants. A detailed comparison of the dielectric constants obtained from these methods is presented in the following section.
3.2. Dielectric Constant Extraction
To extract the dielectric constant of the MUT from the measured capacitance, two different extraction approaches are employed in this study. The first approach is based on a conventional analytical formulation derived from the sensor geometry, while the second approach utilizes an air–water two-point calibration method to account for geometry-dependent offsets and fringing field effects. Both methods are described below.
3.2.1. Extraction Method Using Known CCS Geometries
In the conventional analytical approach, the dielectric constant of the MUT is extracted directly from the measured capacitance of the CCS using a geometry-based formulation. After OPEN and SHORT compensation of the measurement leads, the measured capacitance
is assumed to represent the intrinsic capacitance of the sensor structure, where the fringing capacitance in Equation (9) is simply neglected. The total measured capacitance is modeled as the superposition of the capacitance contributions associated with the PVC spacer and the MUT, and can be expressed as follows:
Rearranging the above expression, the dielectric constant of the MUT can be extracted with:
In this formulation, the dielectric properties and geometry of the PVC spacer are treated as known parameters. Fringing field effects and residual geometry-dependent parasitic contributions are not explicitly modeled and are therefore implicitly absorbed into the effective capacitance term. Consequently, the accuracy of this method depends on the assumed PVC dielectric properties and the validity of the simplified field distribution.
3.2.2. Extraction Method Using Air–DI Water Calibration
To overcome the accuracy limitations of the analytical method described in
Section 3.2.1, a calibration-based extraction approach is proposed. This method employs air and DI water as reference materials with well-established dielectric constants, thereby eliminating the need for explicit knowledge of the dielectric constant of the spacer material (PVC in this work). In addition, fabrication tolerances in the CCS geometry do not influence the extracted dielectric constant of the MUT. Although fringing fields are still present, their influence on the extracted permittivity is reduced because the higher dielectric constant of the PVC spacer confines a larger portion of the electric field within the spacer rather than the surrounding air.
For simplification, the measured capacitance of the CCS from Equation (10) can be expressed as follows:
where
is an effective geometry-dependent proportionality constant, and
is a constant offset term accounting for fixed capacitance contributions, including the PVC spacer capacitance, fringing electric fields, and residual geometry-dependent parasitic effects. Both
and
are treated as effective calibration parameters. This equation assumes a linear relationship between the measured capacitance and the real part of permittivity. This approximation is only valid when the sensor operates in the quasi-static regime, where its physical dimensions are much smaller than the wavelength, and the electric field distribution does not change significantly with different MUTs. Under this condition, the total capacitance can be expressed as the sum of a constant parasitic contribution and a term proportional to the permittivity of the MUT. Moreover, the electrode spacing should be small compared to the lateral dimensions of the electrodes, such that fringing field effects remain similar for different MUTs and can be effectively treated as a constant offset. Consequently, geometry-dependent factors, including spacer material properties and electrode configuration, are implicitly accounted for through calibration rather than requiring explicit modeling. It should be noted, however, that this assumption holds only when variations in spacer permittivity and electrode geometry do not significantly perturb the field distribution. In practice, the use of smooth electrode geometries (e.g., circular plates) and operation over a limited frequency range helps to minimize such effects and preserve the validity of the linear approximation.
To determine these parameters, two reference measurements are performed using air and DI water under identical measurement conditions. Substituting the known dielectric constant of air (
) into the above expression yields:
while for DI water with dielectric constant
, the measured capacitance is given by:
By subtracting the air reference Equation (13) from the water reference Equation (14), the constant offset term
is explicitly eliminated, as is common to both measurements. These yields:
from which the effective proportionality constant
can be determined implicitly. Consequently, the capacitance
can be derived from Equation (13). Substituting
and
back into the generalized capacitance expression from (12) leads to a formulation for extracting the dielectric constant of an arbitrary MUT with:
Through this air–DI water calibration, the dominant geometry- and spacer-dependent contributions to the measured capacitance are absorbed into the model parameters and . As long as the conditions for the assumption of a linear relationship from Equation (12) are fulfilled, the extraction of becomes largely insensitive to the exact value of the spacer permittivity and to moderate fabrication tolerances in electrode dimensions. The performance of this proposed method is evaluated and compared with the conventional analytical approach in the next section.
3.3. Dielectric Constant Extraction from CCS Measurement Results
To evaluate the accuracy of the dielectric constant extraction, the values obtained using the conventional analytical method described in
Section 3.2.1 and the proposed air–water calibration method (
Section 3.2.2) were compared with literature-reported values at comparable frequency and temperature. The comparison, together with the corresponding percentage errors, is summarized in
Table 3. The relative permittivity of water
used in the simulations corresponds to 20 °C, which matches the experimental temperature of the liquid measurements and thus minimizes temperature-induced discrepancies in
Table 3. For ethanol and methanol, the remaining deviations from literature values may partly arise from residual water content and trace impurities present in the commercial solvents, despite their high nominal purities (≥99.9% and ≥99.8%, respectively). The dielectric constants of the MUTs were first extracted using the conventional geometry-based analytical method from Equation (11). In this approach, the measured capacitance is decomposed into contributions from the MUT and the PVC spacer, assuming an ideal CCS configuration and dimensions. The accuracy of this method relies on the known sensor geometry as mentioned in
Section 2.2, low fabrication tolerance, and PVC’s dielectric constant close to 3.2 as reported in the literature. Using the experimentally measured capacitance values at 1 MHz, the dielectric constants extracted using the conventional analytical method are 1.02 for air, 80.577 for DI water, 24.90 for ethanol, and 33.34 for methanol. These values are in close agreement with commonly reported reference data, indicating that the analytical model provides a reasonable first-order estimate of the dielectric properties of the MUTs.
The dielectric constants of the MUTs were then extracted using the proposed air–DI water calibration method from Equation (16). Capacitance values of the CCS loaded with air and DI water from
Table 1 are used to extract the dielectric constant from the measured capacitance value of the CCS loaded with an unknown MUT. The extracted dielectric constant of MUT obtained from this method is 24.75 for ethanol and 33.12 for methanol. These values exhibit close agreement with literature-reported data. Since air and DI water served as calibration references, extracted dielectric constants are identical to the theoretical values reported in the literature, so that errors compared to theoretical values are not applicable (N/A) in
Table 3.
Compared with the conventional analytical method, the proposed air–DI water calibration approach demonstrates improved accuracy by reducing sensitivity to uncertainties in spacer material properties, fabrication tolerances, and idealized field assumptions. For ethanol, the extraction error in dielectric constant is 2.47% using the conventional method with known CCS geometric and material parameters. This error decreases to 1.85% with the proposed air–DI water calibration method. For methanol, the error is reduced from 0.73% to 0.06%.
This improvement arises since the calibration procedure removes the explicit dependence on the PVC dielectric constant and detailed sensor geometry. By referencing the measurements to air and DI water, fabrication tolerance, spacer material uncertainty, and fringing field effects are inherently compensated. Consequently, the sensor does not require highly precise fabrication or exact prior knowledge of the spacer dielectric constant. In practice, the spacer can be fabricated from a range of dielectric materials without precise permittivity characterization. Also, moderate geometric variations do not significantly degrade the extraction accuracy. This enhances the robustness and practical applicability of the proposed method for the characterization of the MUT.
Although the numerical errors obtained with the conventional analytical method and the proposed air–DI water calibration method are of comparable magnitude for the well-controlled CCS prototype investigated in
Table 3, the two approaches differ in their robustness with respect to practical implementation. The analytical method relies explicitly on accurate knowledge of the sensor geometry and spacer permittivity, as well as on simplified assumptions regarding the field distribution; therefore, its accuracy can degrade when fabrication tolerances, unknown spacer materials, or modified electrode geometries are introduced. In contrast, the calibration-based extraction absorbs residual parasitic effects as well as geometry- and spacer-dependent variations into the effective parameters
and
, and thus does not require precise prior characterization of the spacer or exact cell dimensions. Moreover, the proposed calibration approach is inherently scalable and adaptable: it can be directly applied when the CCS is resized or when the spacer material is changed, without the need to re-measure physical dimensions or reformulate the analytical model. A simple recalibration step is sufficient to maintain accuracy. As a result, the method is particularly suitable for low-cost, in-house fabricated sensors or applications involving design variations, where it preserves accuracy despite fabrication uncertainties and configuration changes.
3.4. Application Example: Frequency-Dependent Characterization of Cow’s Milk
To further validate the proposed sensor and extraction method using a realistic biological sample, additional measurements were conducted on a commercial ultra-high temperature (UHT) cow’s milk product (Thai–Denmark, plain 100% cow’s milk, Saraburi, Thailand). The sensor was operated at a controlled temperature of 25 °C, and all calibration procedures were performed at the same temperature to ensure fair comparison with literature data. This condition is consistent with Zhu et al. and Liu et al., who characterized raw cow’s milk over 10–4500 MHz at approximately 22–25 °C [
33,
34,
35]. The UHT milk sample in this experiment is produced from 100% fresh cow’s milk and has typical whole-milk macronutrient levels, with fat, protein, and lactose contents in the same order of magnitude as standard whole cow’s milk reported in dairy composition references [
36].
To calibrate the CCS at the working temperature of 25 °C, the capacitance values of CCS filled with air and DI water were first measured using the LCR meter. At least five consecutive readings were taken without disturbing the setup, showing an insignificant difference in the measured values. The results were averaged and used as the representative value for calibration. The DI water measurements yielded an extracted dielectric constant of 78.3 at 25 °C. This result is in good agreement with reported values of 78.3–78.4 at this temperature [
25,
37]. Because the dielectric constant of water decreases with temperature (for example, from about 80.1 at 20 °C to about 78.3 at 25 °C), performing the DI water calibration at 25 °C is essential to avoid inaccuracy when extracting the dielectric constant of the milk at the same temperature. The same protocol with at least five repeated measurements per condition was then applied to measure the UHT milk sample at each frequency point between 10 and 30 MHz. The average capacitance value was used to extract the dielectric constant as described in
Section 3.2.2.
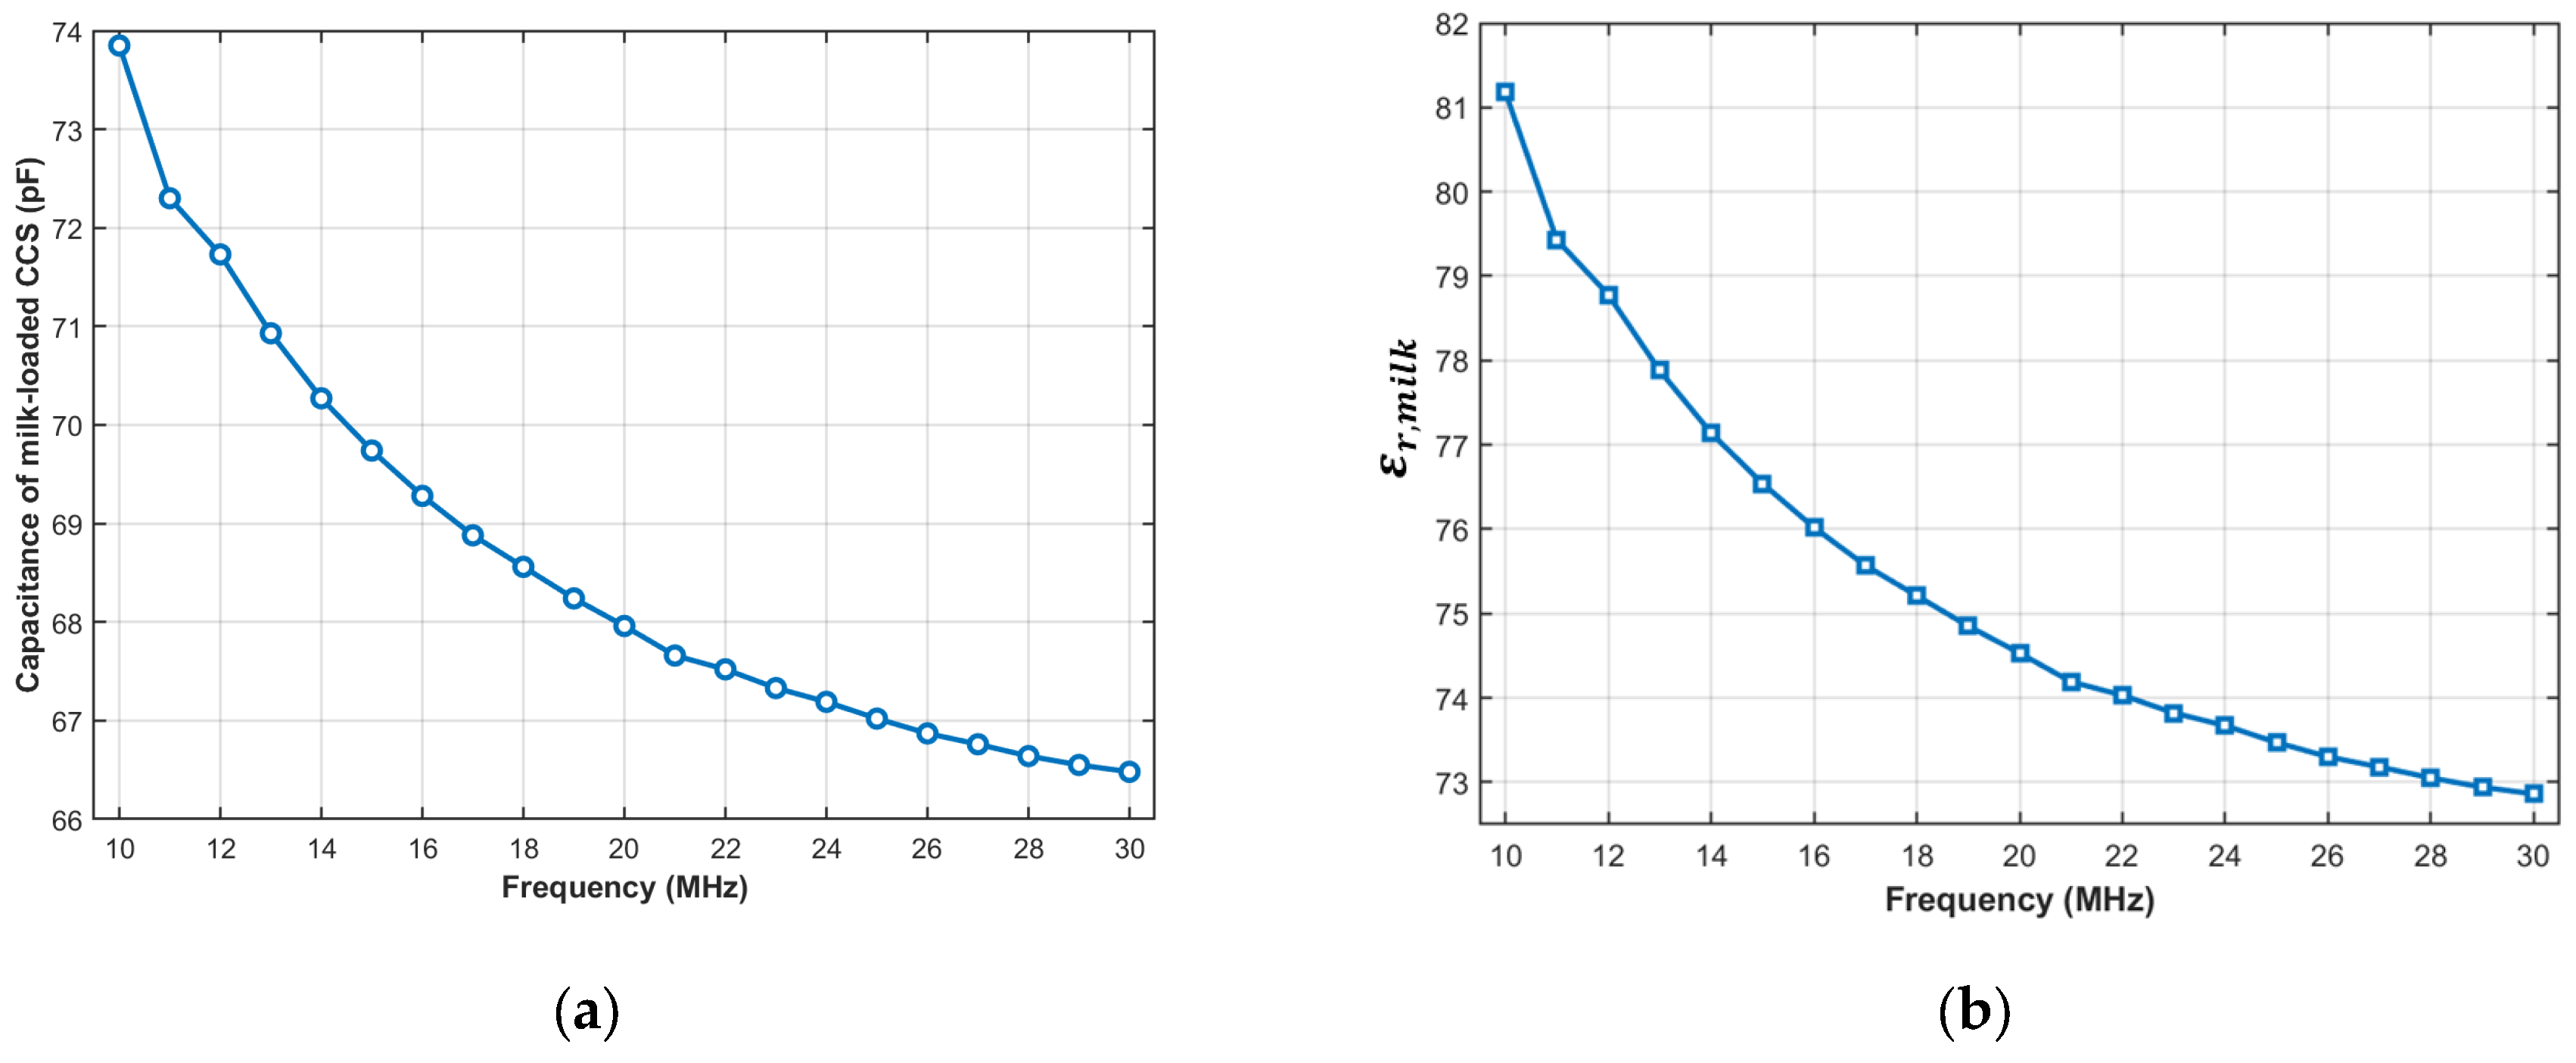
Figure 7a,b plots the measured CCS capacitance and the extracted dielectric constant of the UHT milk sample at 25 °C in a frequency range from 10 to 30 MHz.
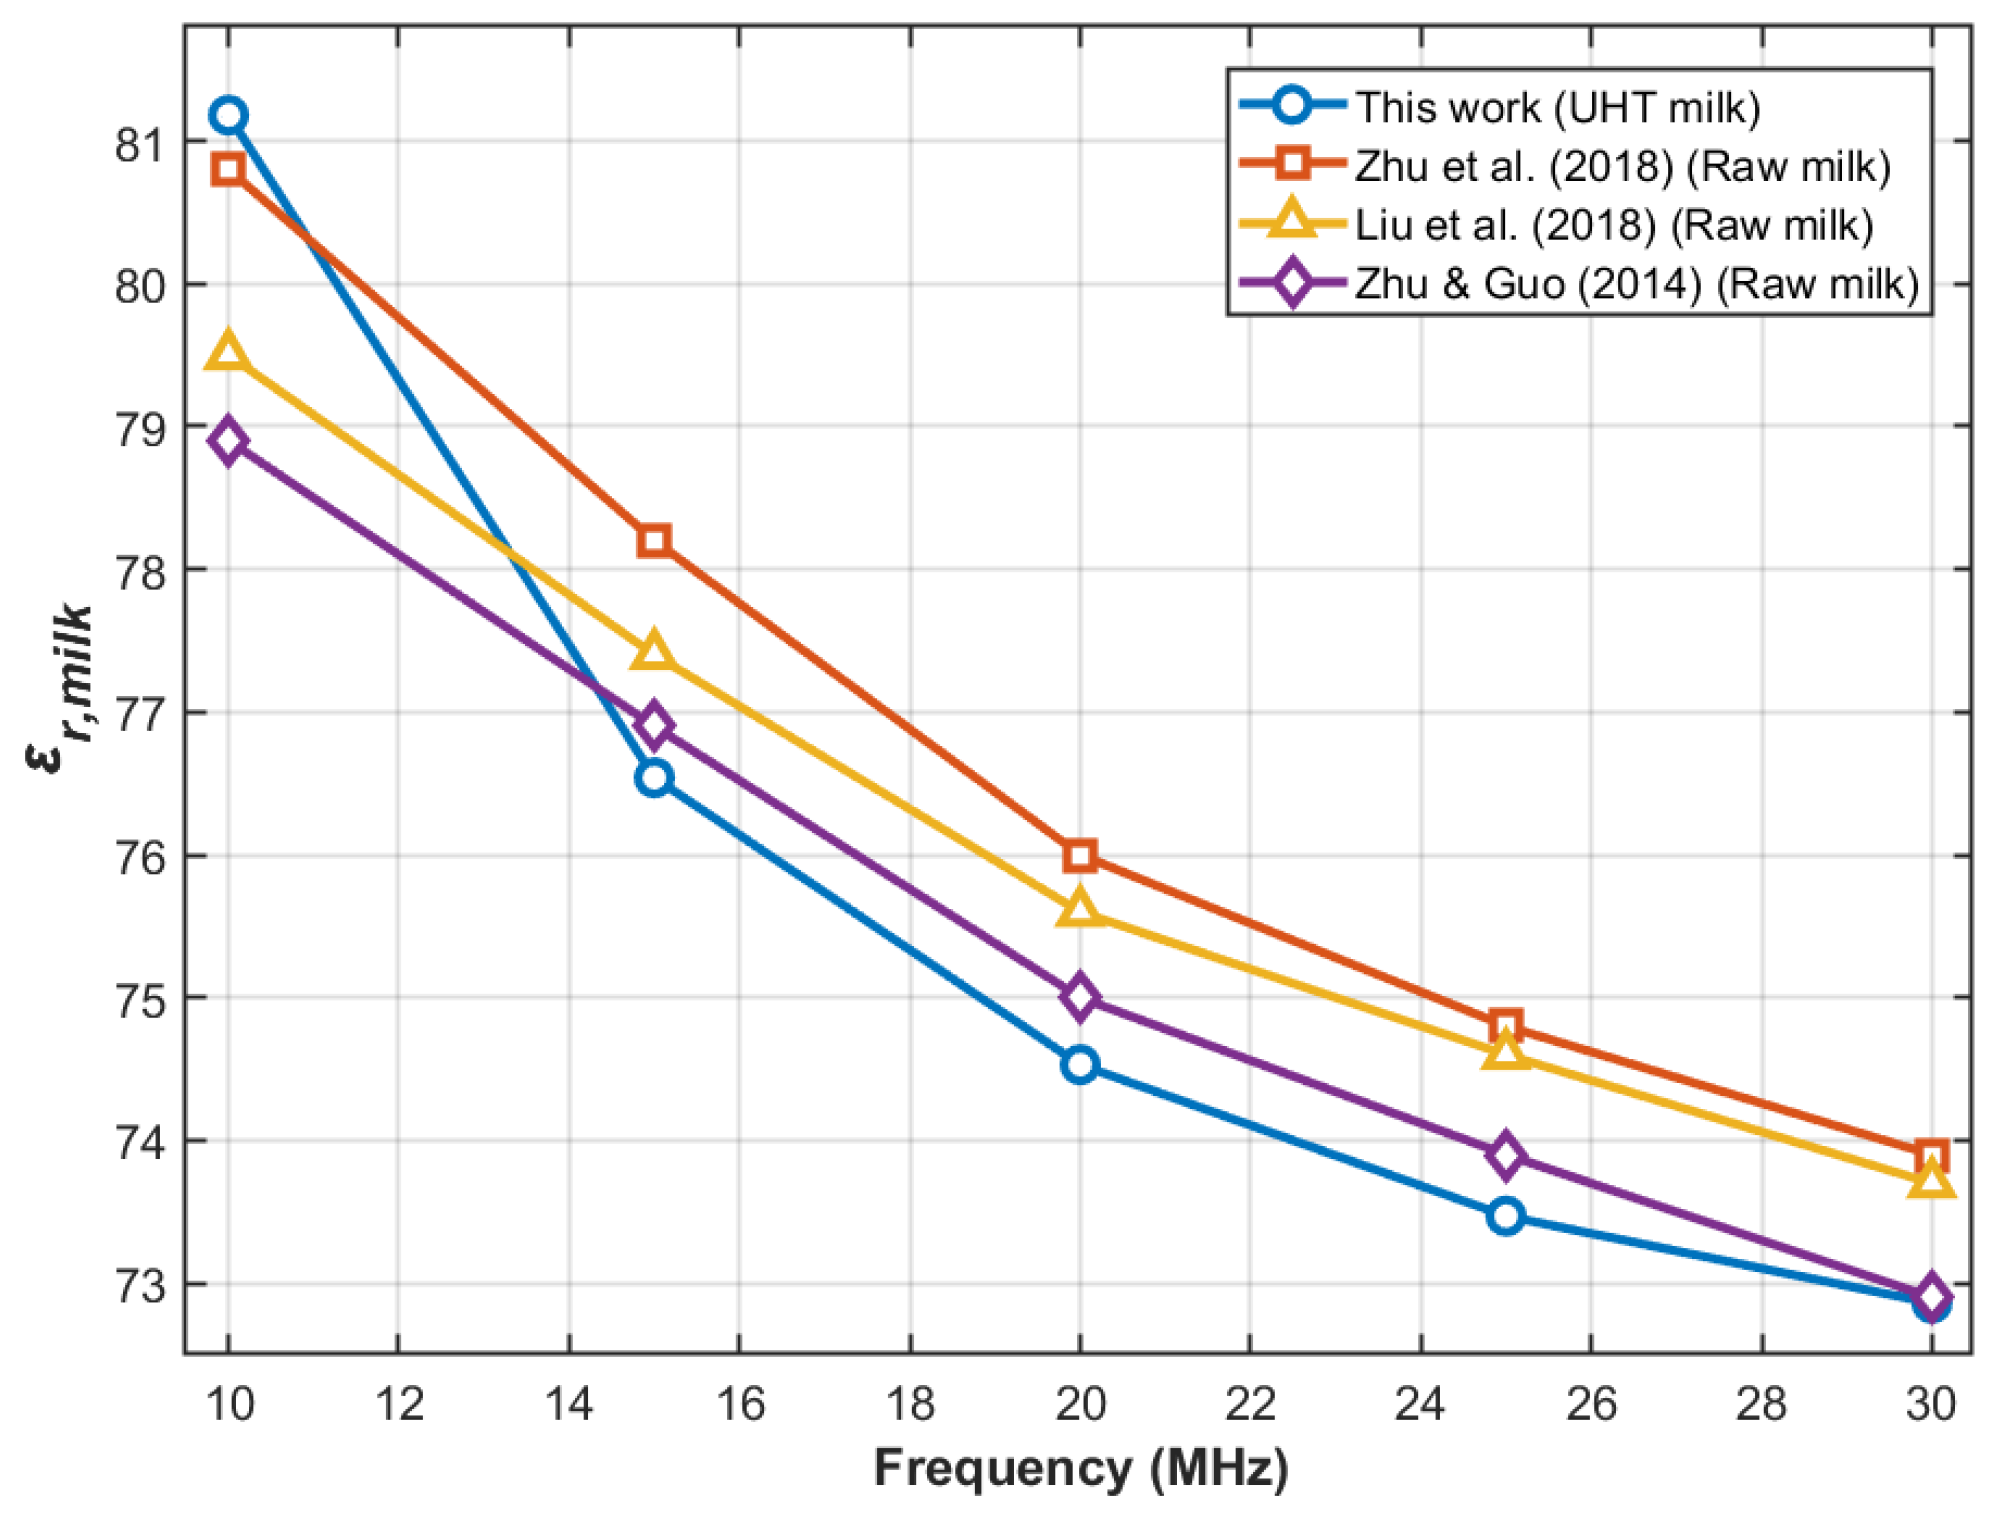
The monotonic decrease in dielectric constant with increasing frequency follows the expected dielectric relaxation behavior of milk as a multiphase polydisperse system composed of liquid fat globules emulsified in a water-based solution containing dissolved lactose, minerals, and suspended proteins. At low radio frequencies, several polarization mechanisms contribute to the dielectric constant, including dipolar rotation of water molecules, migration and accumulation of mobile ions, and interfacial polarization at boundaries between fat globules, casein micelles, and the aqueous phase. As frequency increases to tens of MHz, the interfacial polarization mechanism can no longer fully follow the rapidly oscillating electric field within each cycle, so its contribution to stored electric energy diminishes and the dielectric constant decreases with frequency. Similar decreasing trends of the dielectric constant with frequency have been reported for raw milk, soy milk, and other high moisture foods, confirming that the measured
curve in
Figure 8 and
Figure 8 is consistent with established dielectric relaxation behavior in aqueous, multi-phase food systems [
38,
39].
The observed dispersion can be interpreted in terms of Maxwell–Wagner–Sillars (MWS) interfacial polarization in heterogeneous dielectrics. In such systems, contrasts in permittivity and conductivity between dispersed and continuous phases lead to charge accumulation at internal interfaces and to a characteristic low-frequency dielectric dispersion, as rigorously analyzed for composite materials by Samet et al. and for heterogeneous polymers and emulsions by Samet et al. [
40] and Qian et al. [
41]. Hanai’s classical emulsion theory further shows that interfacial polarization is a key contributor to the dielectric spectra of concentrated emulsions, providing a widely used framework for interpreting frequency-dependent permittivity in oil-in-water systems [
42]. Within this perspective, cow’s milk can be viewed as a multiphase emulsion in which fat globules and protein aggregates are dispersed in an aqueous electrolyte phase, and the decrease of
between 10 and 30 MHz is consistent with the high-frequency tail of a Maxwell–Wagner–Sillars interfacial relaxation process.
To validate the extracted dielectric constant of the UHT milk sample over the frequency range from 10 to 30 MHz, the measured values are compared with literature data reported at 25 °C within a comparable frequency range [
33,
34,
35]. For consistency, dielectric constant data were exclusively chosen from the unmodified baseline raw cow’s milk curves presented in those studies. Only measurements corresponding to 25 °C were considered to ensure thermal comparability with the present work. Data obtained under altered salt, fat, or lactose concentrations, skimmed conditions, or different temperatures were intentionally excluded. The comparison is presented in
Figure 8. All datasets exhibit monotonic dielectric dispersion, with the UHT milk sample showing slightly lower permittivity at higher frequencies. This discrepancy is reasonably attributed to the use of commercially UHT-processed milk in the present study, whereas the referenced works investigated raw milk. Additional variation may arise from differences in fat, protein, lactose, and mineral composition among sample sources, as well as differences in measurement fixture geometry and calibration methodology.
Although the milk samples are not identical, their compositions are sufficiently similar to yield consistent dielectric behavior. All datasets show the characteristic decrease in dielectric constant with increasing frequency. This trend is consistent with the relaxation of Maxwell–Wagner interfacial polarization in milk as a heterogeneous oil-in-water emulsion. The comparison, therefore, provides a strong trend-based validation under closely matched conditions rather than an exact numerical replication.
Table 4 summarizes the performance of the proposed CCS compared with representative low- and high-frequency techniques reported in the literature for pure DI water, methanol, ethanol, and other liquids. Our results are comparable to or better than many reported low-frequency and microwave techniques. While cavity and resonator-based methods can reach sub-percent errors under carefully controlled conditions, they generally require complex calibration procedures and high-frequency measurement equipment. In contrast, the proposed air–water calibrated capacitive approach offers competitive accuracy with a simple cylindrical parallel plate geometry, low cost, low frequency instrumentation, and reduced sensitivity to spacer permittivity, fringing fields, and geometric tolerances.
4. Conclusions
In this study, a cylindrical parallel-plate capacitive sensor was designed, fabricated, and experimentally validated for the characterization of liquid materials in a lower megahertz frequency range. The sensor employs circular copper electrodes separated by a PVC spacer, providing a compact and repeatable capacitive test cell suitable for low-frequency small-volume liquid characterization. Analytical calculations, numerical simulations using ANSYS Q3D Extractor, and experimental measurements performed at 1 MHz were carried out to comprehensively evaluate the sensor performance. A close agreement was observed among analytically calculated, numerically simulated, and experimentally measured capacitance values for air, DI water, ethanol, and methanol, confirming the robustness and reliability of the proposed CCS design.
Two extraction methods for the extraction of the liquid sample’s dielectric constant from measured capacitance values were investigated. The conventional geometry-based analytical method provided reasonable first-order estimates of the dielectric constants; however, its accuracy depends on precise knowledge of the PVC spacer permittivity and idealized field assumptions. To address these limitations, an air–DI water calibration-based extraction method was proposed. By measuring the capacitance of air and DI water-loaded CCS as reference materials with known dielectric properties, this method effectively eliminated geometry-dependent offsets, spacer material uncertainty, and fringing field contributions. The proposed calibration-based method demonstrated improved accuracy and reduced sensitivity to experimental and modeling uncertainties, yielding extracted dielectric constants for ethanol and methanol that closely matched literature-reported values. These results highlight the practical advantage of the proposed approach for dielectric sensing applications where exact material properties and geometrical parameters of the CCS are not required. Future work will focus on extending the proposed sensing and calibration framework to a broader range of liquids and frequencies, as well as exploring sensor miniaturization and integration with microfluidic platforms for real-time characterization of biomedical and agricultural samples.




 ,
,