Article

The Influence of Structure-Directing Agent on Preparation and Regulation of Alumina Nanorods

1
State Key Laboratory of Heavy Oil Processing, China University of Petroleum, Beijing 102249, China
2
SINOPEC Research Institute of Petroleum Processing Co., Ltd., Beijing 100083, China
*
Author to whom correspondence should be addressed.
Micro 2026, 6(1), 17; https://doi.org/10.3390/micro6010017
Submission received: 24 December 2025 / Revised: 12 February 2026 / Accepted: 20 February 2026 / Published: 28 February 2026

Abstract

One-dimensional alumina nanorods have garnered significant attention due to their unique physical and chemical properties, which hold great promise for applications in catalysis, sensing, and other fields. However, the precise control over the morphology and properties of these nanorods remains a challenge, particularly in achieving a high specific surface area and desirable crystallinity. In this work, we explored the hydrothermal synthesis of alumina nanorods, focusing on the effects of structure-directing agents. It was observed that extending the hydrothermal time and optimizing the temperature led to the formation of nanorods with enhanced crystallinity and specific surface area. The addition of urea and different structure-directing agents significantly influenced the morphology and properties of the nanorods. Furthermore, density functional theory (DFT) calculations revealed the underlying mechanisms of how these structure-directing agents affect the adsorption and growth of alumina nanorods on different crystal planes. Our findings suggest that by carefully tuning these parameters, it is possible to achieve alumina nanorods with optimized properties. This work not only provides a systematic approach to the synthesis of alumina nanorods but also opens up new possibilities for the development of advanced materials with tailored properties for a wide range of applications.

1. Introduction

Alumina (Al2O3) is a widely used material in various industrial applications due to its excellent thermal stability, mechanical strength, and catalytic properties [1]. In recent years, the development of nanostructured alumina, especially in the form of nanorods, has attracted significant attention due to its unique physical and chemical properties [2]. These nanostructures offer high surface area, improved catalytic activity, and enhanced adsorption capabilities, making them ideal for applications in catalysis, environmental remediation, and sensing technologies [3]. Alumina nanorods have shown great potential in the field of catalysis. Their high surface area and unique morphology provide more active sites for catalytic reactions. For example, in the catalytic oxidation of CO, alumina nanorods have demonstrated higher catalytic activity compared to bulk alumina due to their increased surface area and better dispersion of active sites [4]. In addition to catalysis, alumina nanorods have also been explored for applications in environmental remediation. Their enhanced adsorption capabilities make them effective in removing pollutants from water and air. For instance, they can adsorb heavy metal ions and organic contaminants, providing a promising solution for water purification and air quality improvement [5,6,7].
The synthesis of alumina nanorods has been a topic of extensive research. Various methods have been developed to produce alumina nanorods, including sol–gel, hydrothermal, and template-assisted methods [8,9]. Among these methods, the hydrothermal method has gained significant attention due to its simplicity, scalability, and ability to produce high-quality nanorods. The hydrothermal method involves the reaction of aluminum precursors in an aqueous solution under high temperature and pressure conditions, which promotes the formation of alumina nanorods with desired morphologies and properties. By optimizing the reaction conditions, such as temperature, time, and the use of additives, the morphology, crystallinity, and specific surface area of the alumina nanorods can be precisely controlled.
The specific surface area and crystallinity of alumina nanorods are crucial factors that determine their performance in various catalytic applications. A high specific surface area provides more active sites for catalytic reactions and adsorption processes, while high crystallinity ensures better thermal stability and mechanical strength [10,11]. Therefore, it is essential to develop an efficient and scalable method for synthesizing alumina nanorods with high specific surface area and crystallinity. At present, the main strategies to control alumina nanorods are optimizing hydrothermal reaction conditions, template types, and metal species modification. For instance, Hu et al. optimized the morphology and size of alumina nanorods by adjusting the hydrothermal temperature, synthesis time, promoter, and calcination temperature [12]. They obtained γ-Al2O3 nanorods with diameters of 200–300 nm and an average length of 5 μm by calcining alumina precursors (AACH) at 800 °C. In addition, Ghosh et al. used P123 as a template and boehmite sol as the aluminum precursor to synthesize one-dimensional alumina nanorods and nanofibers [13]. They explored the effects of different temperatures (100–165 °C) on the morphology and properties of the nanorods. The study found that the nanofibers gradually transformed into nanorods as the reaction temperature increased, providing insights into the growth mechanism of these nanostructures. Structure-directing agents (SDAs) play a crucial role in controlling the morphology, porosity, and crystallinity of alumina (Al2O3), and their selective interactions with alumina precursors dictate the assembly process, allowing precise tuning of surface area, pore size, and phase stability. In the synthesis of chiral mesoporous γ-alumina, Dabbagh et al. used vitamin C as a chiral template and co-SDA guide to prepare alumina materials with high specific surface area (394 m2/g) and narrow pore size distribution [14]. However, despite these advancements, there are still several challenges and gaps in the current research. One of the main issues is the lack of a systematic study on the effects of SDAs on the adsorption and growth mechanisms of alumina nanorods on different crystal planes. While previous studies have explored the use of the additives, a comprehensive understanding of how these agents influence the nucleation, growth direction, and final morphology of the nanorods is still lacking. This gap in knowledge limits the ability to precisely control the synthesis of alumina nanorods with desired properties for specific applications.
In this study, we have explored the hydrothermal synthesis of alumina nanorods, with a particular focus on the effects of structure-directing agents on their morphology and properties. Our results demonstrate that by extending the hydrothermal reaction time, optimizing the reaction temperature, and carefully adjusting the amount of urea used as a precipitant, we can significantly enhance the crystallinity and specific surface area of the alumina nanorods. Additionally, the use of different structure-directing agents, such as various alcohols and amines, has been shown to have a profound impact on the growth and final morphology of the nanorods. Density Functional Theory (DFT) calculations have further illuminated the underlying mechanisms by which these agents influence the adsorption and growth processes on different crystal planes. These findings not only provide a systematic approach to the synthesis of alumina nanorods with tailored properties but also pave the way for the development of advanced materials with enhanced performance in catalysis, environmental remediation, and other applications. This work can further provide a deeper understanding of the structure-property relationships that lead to the creation of alumina nanorods with higher surface areas and improved functionalities, thus unlocking new possibilities for their use in a wide range of technological and industrial applications.

2. Experimental Section

2.1. Chemicals and Reagents

All chemicals used in this study were of analytical grade and used as received without further purification. Aluminum nitrate nonahydrate (Al(NO3)3·9H2O) and urea were used as the aluminum source and precipitant, respectively. Other reagents, including various alcohols and amines, were used as crystal plane regulators. Deionized water was used throughout the experiments. Details of the chemicals used are as follows: Al(NO3)3·9H2O was purchased from Shanghai MacLinn Biochemical Technology Co., Ltd. (Shanghai, China); urea, triethylamine, 1,6-hexanediamine, and triethanolamine were obtained from Shanghai Aladdin Biochemical Technology Co., Ltd. (Shanghai, China); methanol and ethanol were supplied by Tianjin Jindong Tianzheng Fine Chemical Reagents Factory (Tianjin, China), while n-propanol, n-butanol, and diethanolamine were sourced from Sinopharm Chemical Reagents Co., Ltd. (Shanghai, China).

2.2. Synthesis of Alumina Nanorods

The alumina nanorods were synthesized via a hydrothermal method. In a typical synthesis procedure, 4.51 g of aluminum nitrate nonahydrate (Al(NO3)3·9H2O, 0.012 mol) and 6.51 g of urea (0.108 mol) were dissolved in 60 mL of deionized water to obtain precursor solutions with concentrations of 0.20 mol/L for Al3+ and 1.8 mol/L for urea, respectively. The mixture was magnetically stirred at room temperature for 30 min at a stirring speed of 400 rpm to ensure complete dissolution and homogeneity. The resulting clear solution was then transferred into a 100 mL Teflon-lined stainless steel autoclave. The hydrothermal reaction was conducted at 100 °C for 48 h. After cooling to room temperature, the resulting white precipitate was washed three times with deionized water and dried at 100 °C for 12 h. Finally, the as-synthesized sample was calcined at 550 °C for 3 h with a heating rate of 2 °C/min to obtain γ-Al2O3 nanorods.
For the influence of structure-directing agent (SDA), methanol, ethanol, n-propanol, n-butanol, triethylamine, diethanolamine, or triethanolamine was added to the precursor solution at an SDA to Al molar ratio of 2:1 (for alcohols) or 1:1 (for amines). The subsequent procedures remained identical to the standard synthesis protocol described above.

2.3. Characterizations

2.3.1. X-Ray Diffraction (XRD)

The phase and crystallinity of the alumina nanorods were characterized using X-ray diffraction (XRD) with a D8 Advance diffractometer (Bruker AXS, Karlsruhe, Germany). The instrument operates with Cu Kα radiation (λ = 1.5406 Å) at a voltage of 40 kV and a current of 40 mA. The scanning range was set from 5° to 90° with a scanning speed of 11.5°/min. Before the measurement, the samples were ground into fine powders and placed on a sample holder to ensure a flat and uniform surface. The samples were ground by hand in an agate mortar for less than two minutes using only the weight of the pestle itself (i.e., without applying additional pressure). The XRD patterns were analyzed to identify the crystal phases and to calculate the crystallite sizes using the Scherrer equation. Comprehensive structural parameters derived from XRD analysis for all samples, are summarized in Tables S1–S5.
Relative crystallinity index calculation: We employed the peak area integration method (also known as the empirical peak ratio method) in this work. According to the reference [15], the crystallinity index (Xc) is defined as the ratio of the integrated area of the diffraction peak to the total integrated area of all diffraction contributions (crystalline + amorphous). And it is further normalized against a fully crystalline reference.
X c = A c r y s t a l l i n e A t o t a l × 100 %
where Acrystalline is the integrated area of the γ-Al2O3 diffraction peaks including (311), (400) and (440), and Atotal refers to the total integrated area of the crystalline peaks and the amorphous background.

2.3.2. Scanning Electron Microscopy (SEM)

The morphology of the samples was examined using a field emission scanning electron microscope (FE-SEM, Zeiss SIGMA 500, Carl Zeiss AG, Oberkochen, Germany). The samples were prepared by dispersing the nanorods on a conductive carbon tape and then sputter-coated with a thin layer of gold to enhance conductivity. The SEM images were acquired at an accelerating voltage of 10 kV. The magnification was adjusted to capture the detailed morphology of the nanorods, including their length, diameter, and surface features. Statistical analysis of nanorod dimensions (length, diameter, and aspect ratio) was performed on a minimum of 50–70 individual rods per sample using ImageJ software (version 1.53a). Diameter distribution histograms for all samples are presented in Figures S1–S5 (Supporting Information).

2.3.3. Nitrogen Adsorption–Desorption Isotherms

The specific surface area and pore size distribution of the alumina nanorods were determined by nitrogen adsorption–desorption isotherms using a Micromeritics ASAP 2460 physical adsorption instrument (Micromeritics Instrument Corporation, Norcross, GA, USA). Prior to the measurement, the samples were pre-treated by degassing under vacuum at 90 °C for 1 h, followed by heating to 350 °C for 3 h to remove any adsorbed moisture and organic residues. The specific surface area was calculated using the Brunauer–Emmett–Teller (BET) method, and the pore size distribution was derived from the Barrett–Joyner–Halenda (BJH) analysis of the desorption branch of the isotherms.

2.4. DFT Calculations

In this study, Density Functional Theory (DFT) calculations were employed to investigate the influence of different crystal surface regulators on the morphology of alumina nanorods. The calculations were performed using the VASP (Vienna Ab initio Simulation Package, Version 5.4.4) software, a widely recognized tool for performing DFT calculations. The Generalized Gradient Approximation (GGA) method was utilized to describe the electron–electron interactions, which is a common approach for simulating the electronic structure of materials.
The calculations involved the use of a plane-wave basis set with a cutoff energy of 450 eV, ensuring sufficient accuracy for the electronic structure calculations. A uniform k-point mesh with a resolution of 2π × 0.05 Å−1 was employed to sample the Brillouin zone, providing a good balance between computational efficiency and accuracy. The Methfessel–Paxton scheme was used for electronic smearing to handle the partial occupancies of electronic states, which is particularly useful for metals and semiconductors.
The adsorption energies of various small molecules, including methanol, ethanol, n-propanol, n-butanol, triethylamine, diethanolamine, and triethanolamine, on the (400) crystal surface of alumina were calculated. The adsorption energy (Eads) was determined using the following formula:
Eads = Etotal − (Esurface + Eadsorbate)
where Etotal is the total energy of the adsorption system, Esurface is the energy of the clean surface, and Eadsorbate is the energy of the isolated adsorbate.

3. Results

3.1. Effect of Preparation Conditions on Al2O3 Nanorods

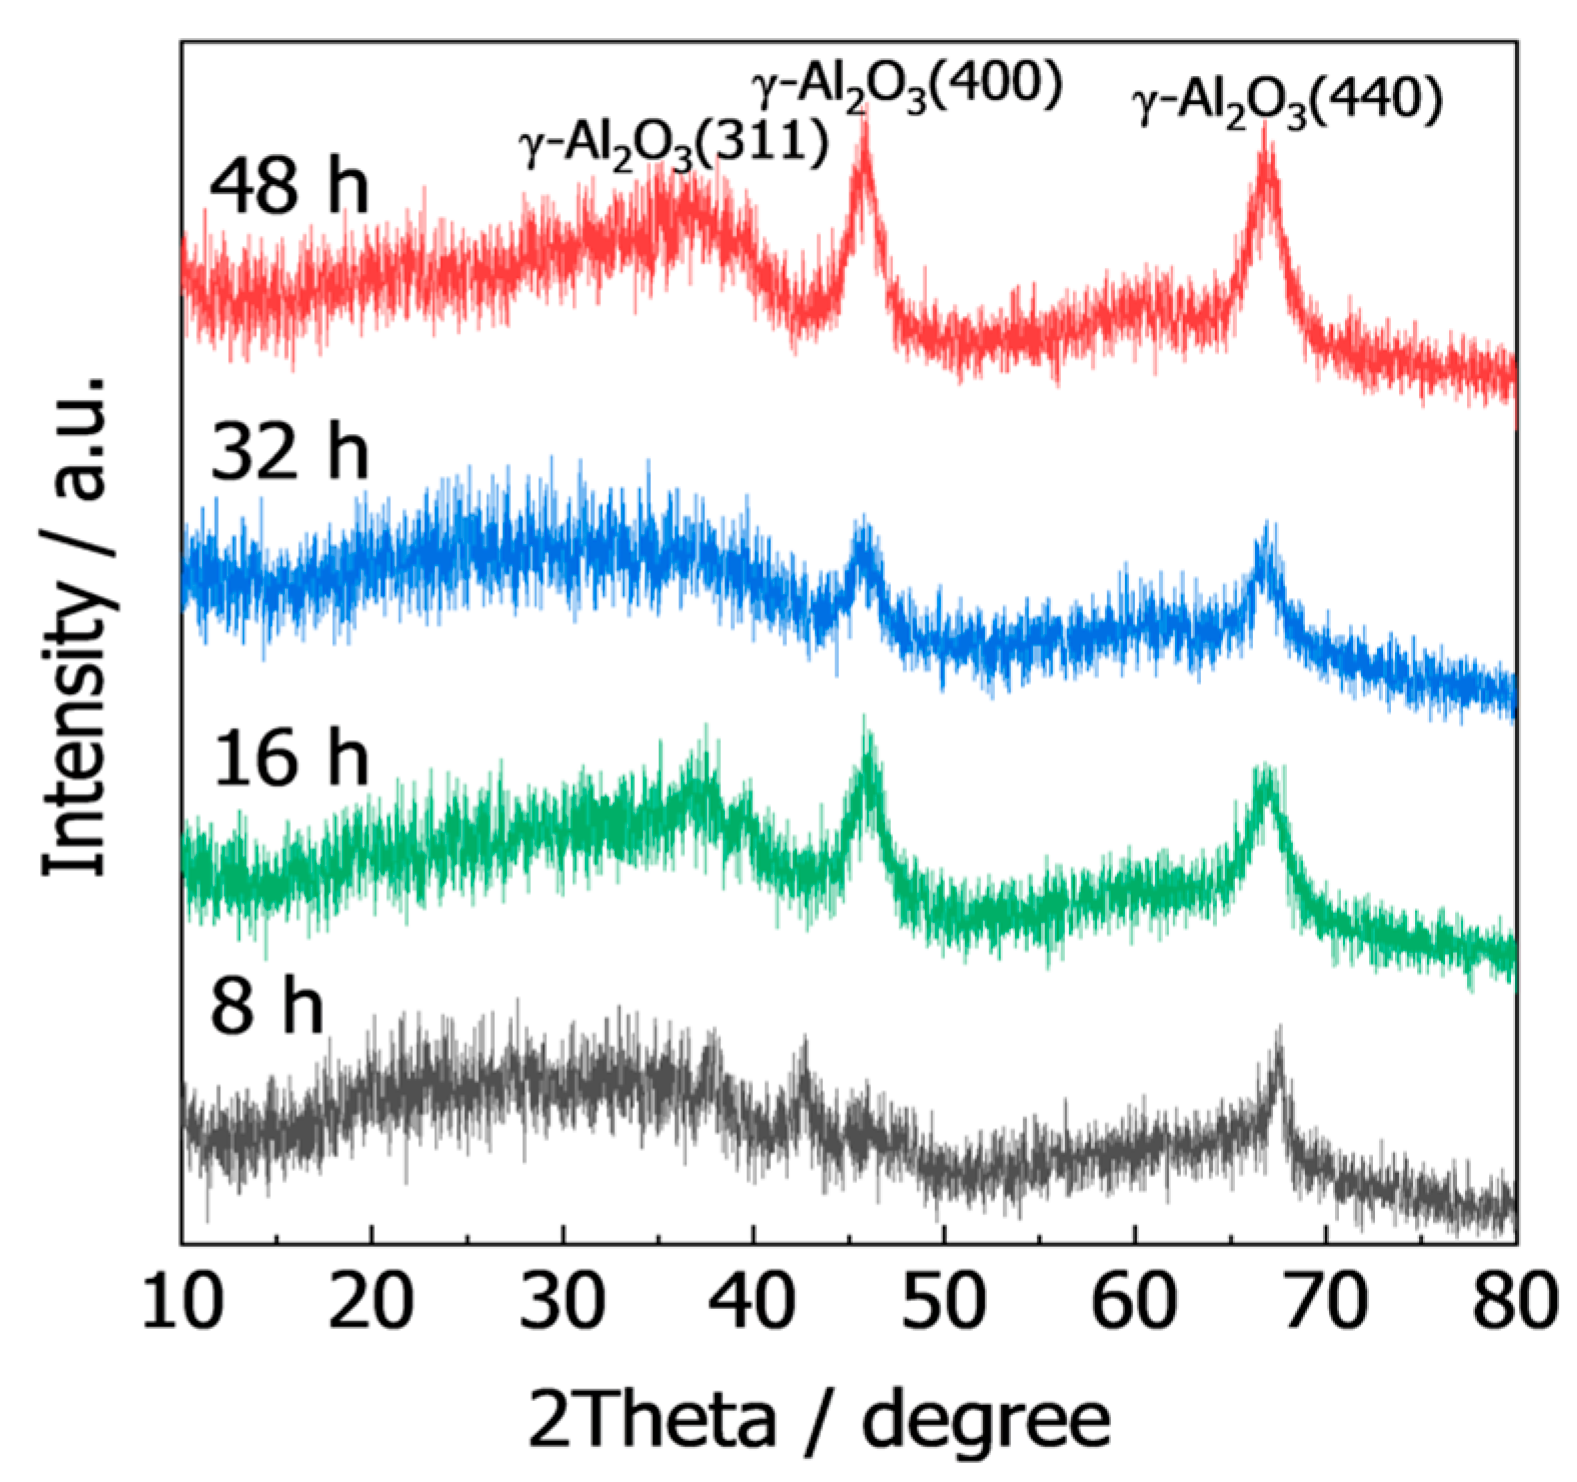
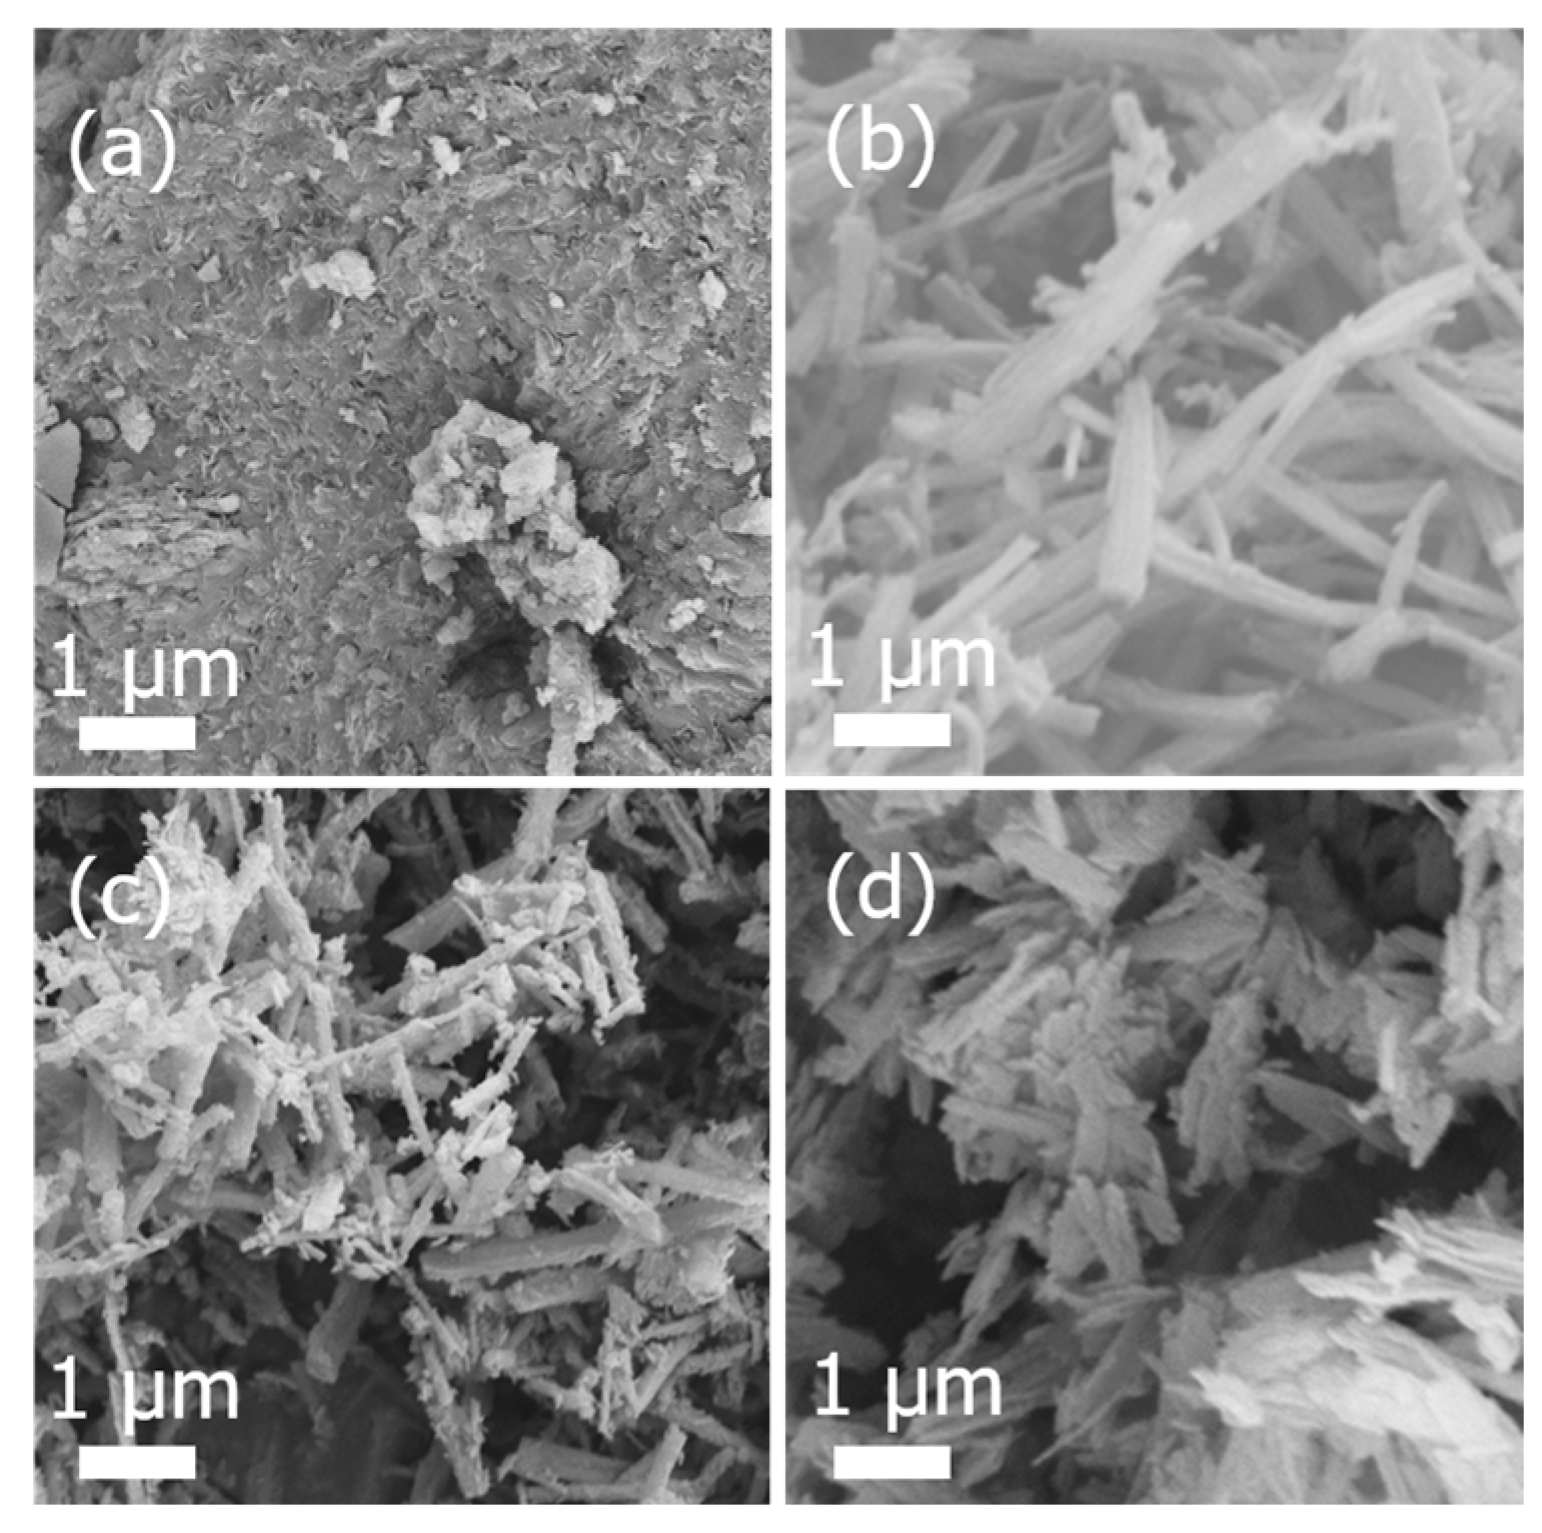
Hydrothermal duration is critical for determining the crystallinity, morphology, crystallinity, and specific surface area of alumina precursors. In this study, the system was hydrothermally treated at 100 °C for 8, 16, 32, and 48 h to systematically investigate the effects of hydrothermal duration on the product. SEM statistical analysis (n = 50, Figure 1a) reveals that when the duration is only 8 h, the product consists of irregular block-like particles with an average length of 0.4 ± 0.2 μm and a diameter of 180 ± 45 nm, yielding a low average aspect ratio of 2.2. As the hydrothermal time was progressively extended to 48 h (Figure 1d), the morphology evolved into uniform nanorods with average dimensions of 2.5 ± 0.6 μm in length and 150 ± 35 nm in diameter, achieving a high average aspect ratio of 16.7 with a narrow size distribution. The corresponding XRD patterns in Figure 2 reveal that after 8 h, only broad, low-intensity peaks are detected, indicating poor crystallinity. These peaks become progressively sharper and more intense, reaching optimal crystallinity at 48 h. At 32 h, the grain size was smallest (13.8 nm), while it was larger at 16 h (18.2 nm) and 48 h (21.5 nm), confirming that 32 h represents a dissolution–recrystallization transition state where grain domains undergo transient fragmentation. The microstrain reached its maximum value at 32 h (0.28%), exceeding those at 16 h (0.15%) and 48 h (0.12%), indicating the greatest lattice distortion during the morphological transformation process. Consistently, Table 1 shows that the BET specific surface area rises from merely 20 m2/g at 8 h to a maximum of 220 m2/g at 48 h, accompanied by a pore-volume increase from 0.05 to 0.33 cm3/g. Thus, extending the hydrothermal duration to 48 h is essential to obtain highly crystalline, high-aspect-ratio alumina nanorods with superior specific surface area. HRTEM is perform in Figure S6a, and distinct lattice fringes corresponding to the (400) crystal plane of γ-Al2O3, can be found. This verifies the crystallinity observed by XRD and supports the DFT calculations focusing on this specific facet. Energy-dispersive X-ray spectroscopy (Figure S6b) demonstrates a homogeneous spatial distribution of aluminum (Al, orange) and oxygen (O, red) elements throughout the nanorod.
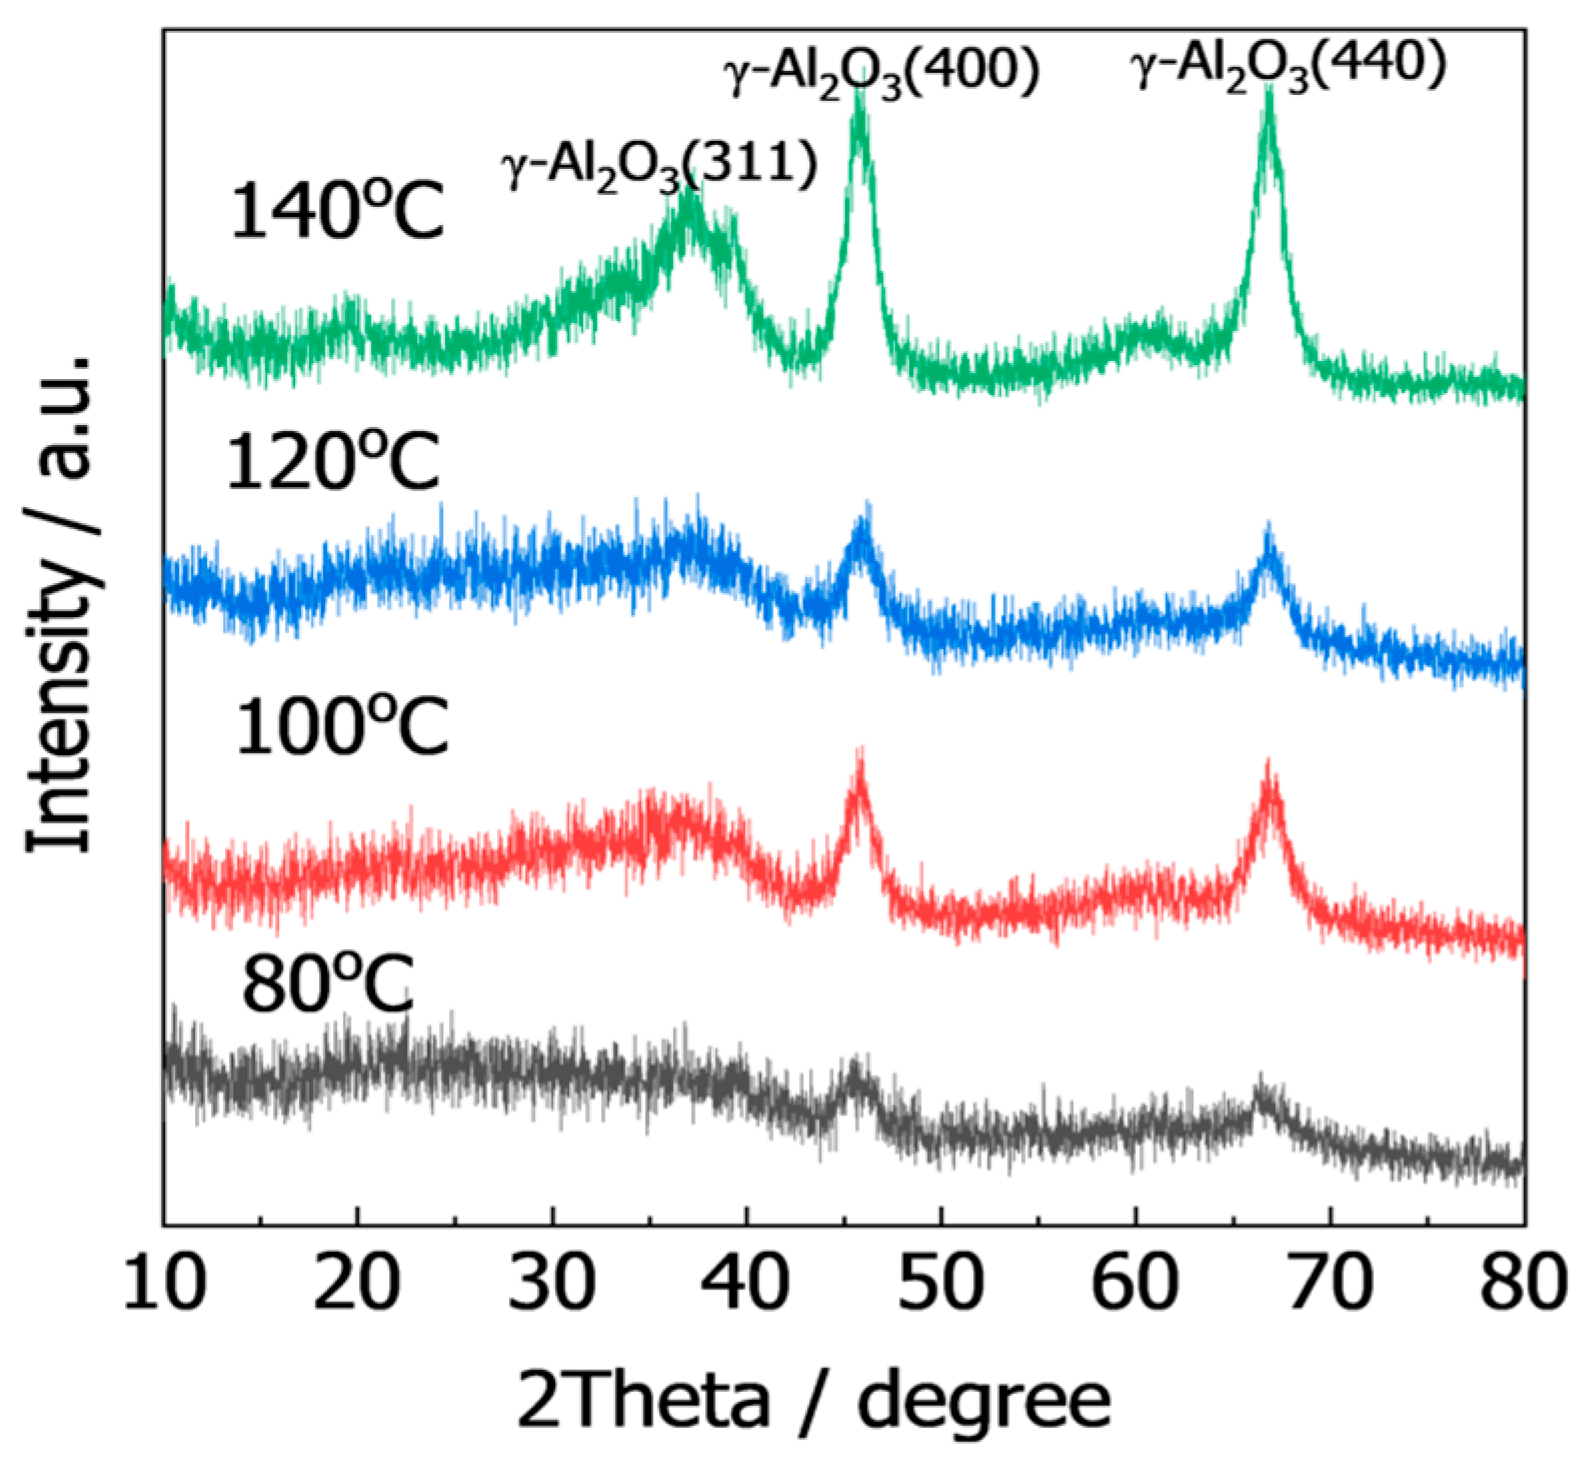
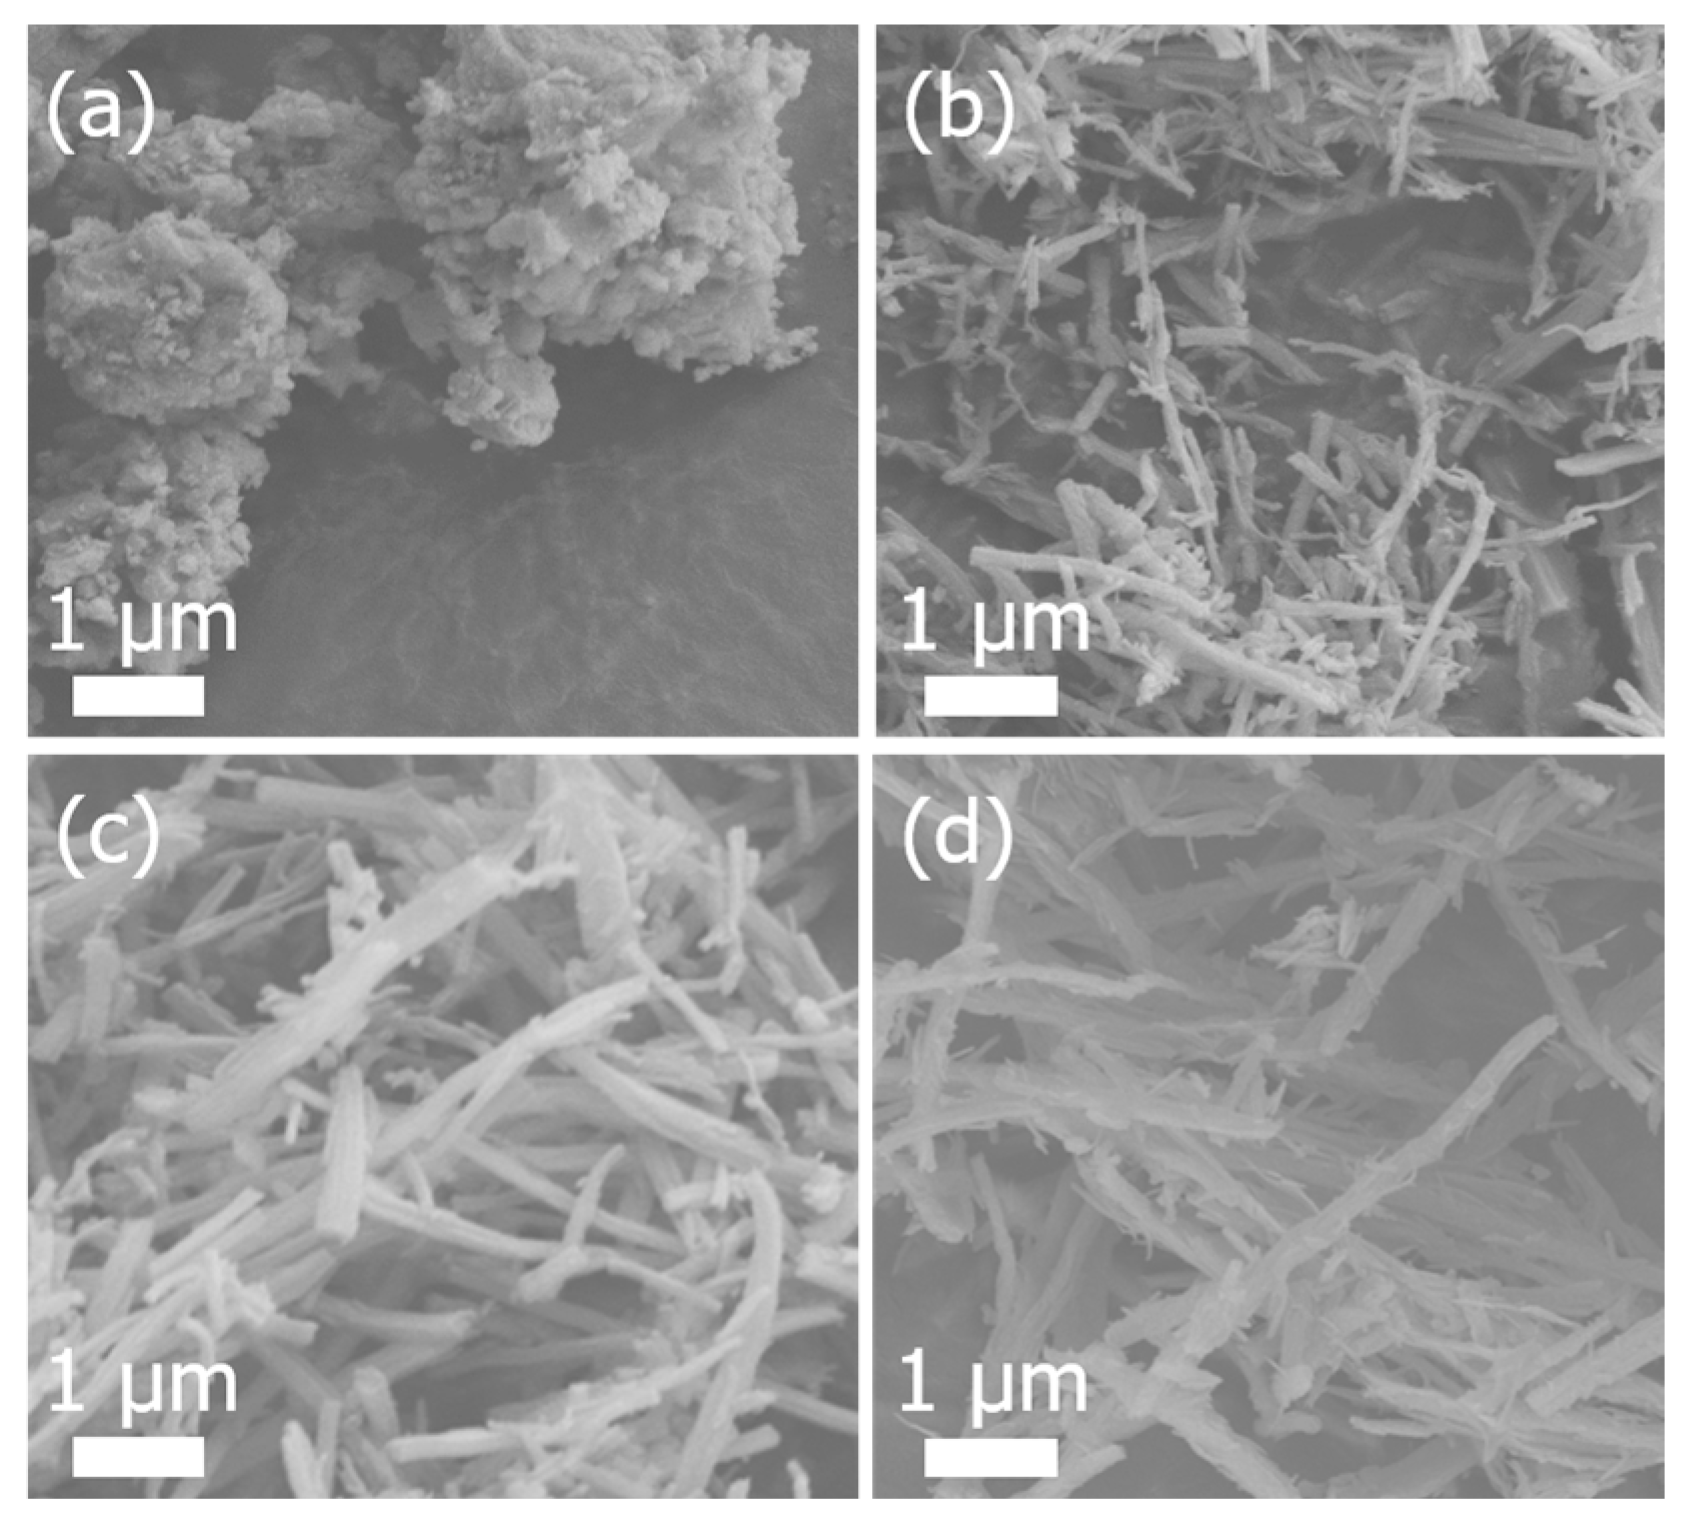
Hydrothermal temperature dictates the grain-growth rate and final morphology of alumina nanorods. Experiments were conducted at 80 °C, 100 °C, 120 °C, and 140 °C for a fixed duration of 48 h. Figure 3a reveals that at the lowest temperature (80 °C), the product is dominated by irregular agglomerated blocks with dimensions of 0.4 ± 0.2 μm in length and 200 ± 50 nm in diameter (with an average aspect ratio of 2.0), and lengths below 0.5 μm. When the temperature is raised to the optimal 100 °C (Figure 3b), uniform nanorods with an average length of 2.5 ± 0.6 μm and a diameter of 150 ± 35 nm are produced, giving an average aspect ratio of 16.7. Further elevation to 140 °C (Figure 3d) shortens and flattens the rods (0.3–0.6 μm long), reducing the aspect ratio to 4–6:1. The XRD patterns in Figure 4 show that crystallinity improves monotonically with temperature, yet excessive temperature (140 °C) leads to peak sharpening accompanied by peak broadening from flattened particles. At 100 °C, the grain size (20.3 nm) exhibits optimal matching with crystallinity. At 140 °C, abnormal grain growth (28.6 nm) occurs due to layer stacking, yet the specific surface area remains unchanged. Table 2 indicates that the BET surface area increases from 182 m2/g at 80 °C to 220 m2/g at 100 °C, remains 221 m2/g at 140 °C, but the high-temperature product possesses enlarged pores (0.42 cm3/g). Although 140 °C gives the same BET area (221 m2/g), the rods are short (average aspect ratio of 5) and plate-like, which is detrimental for flow applications. Hydrothermal treatment at 100 °C yields the highest combined score of average aspect ratio of 15, specific BET surface area of 220 m2/g and mechanical integrity, making it the optimal condition.
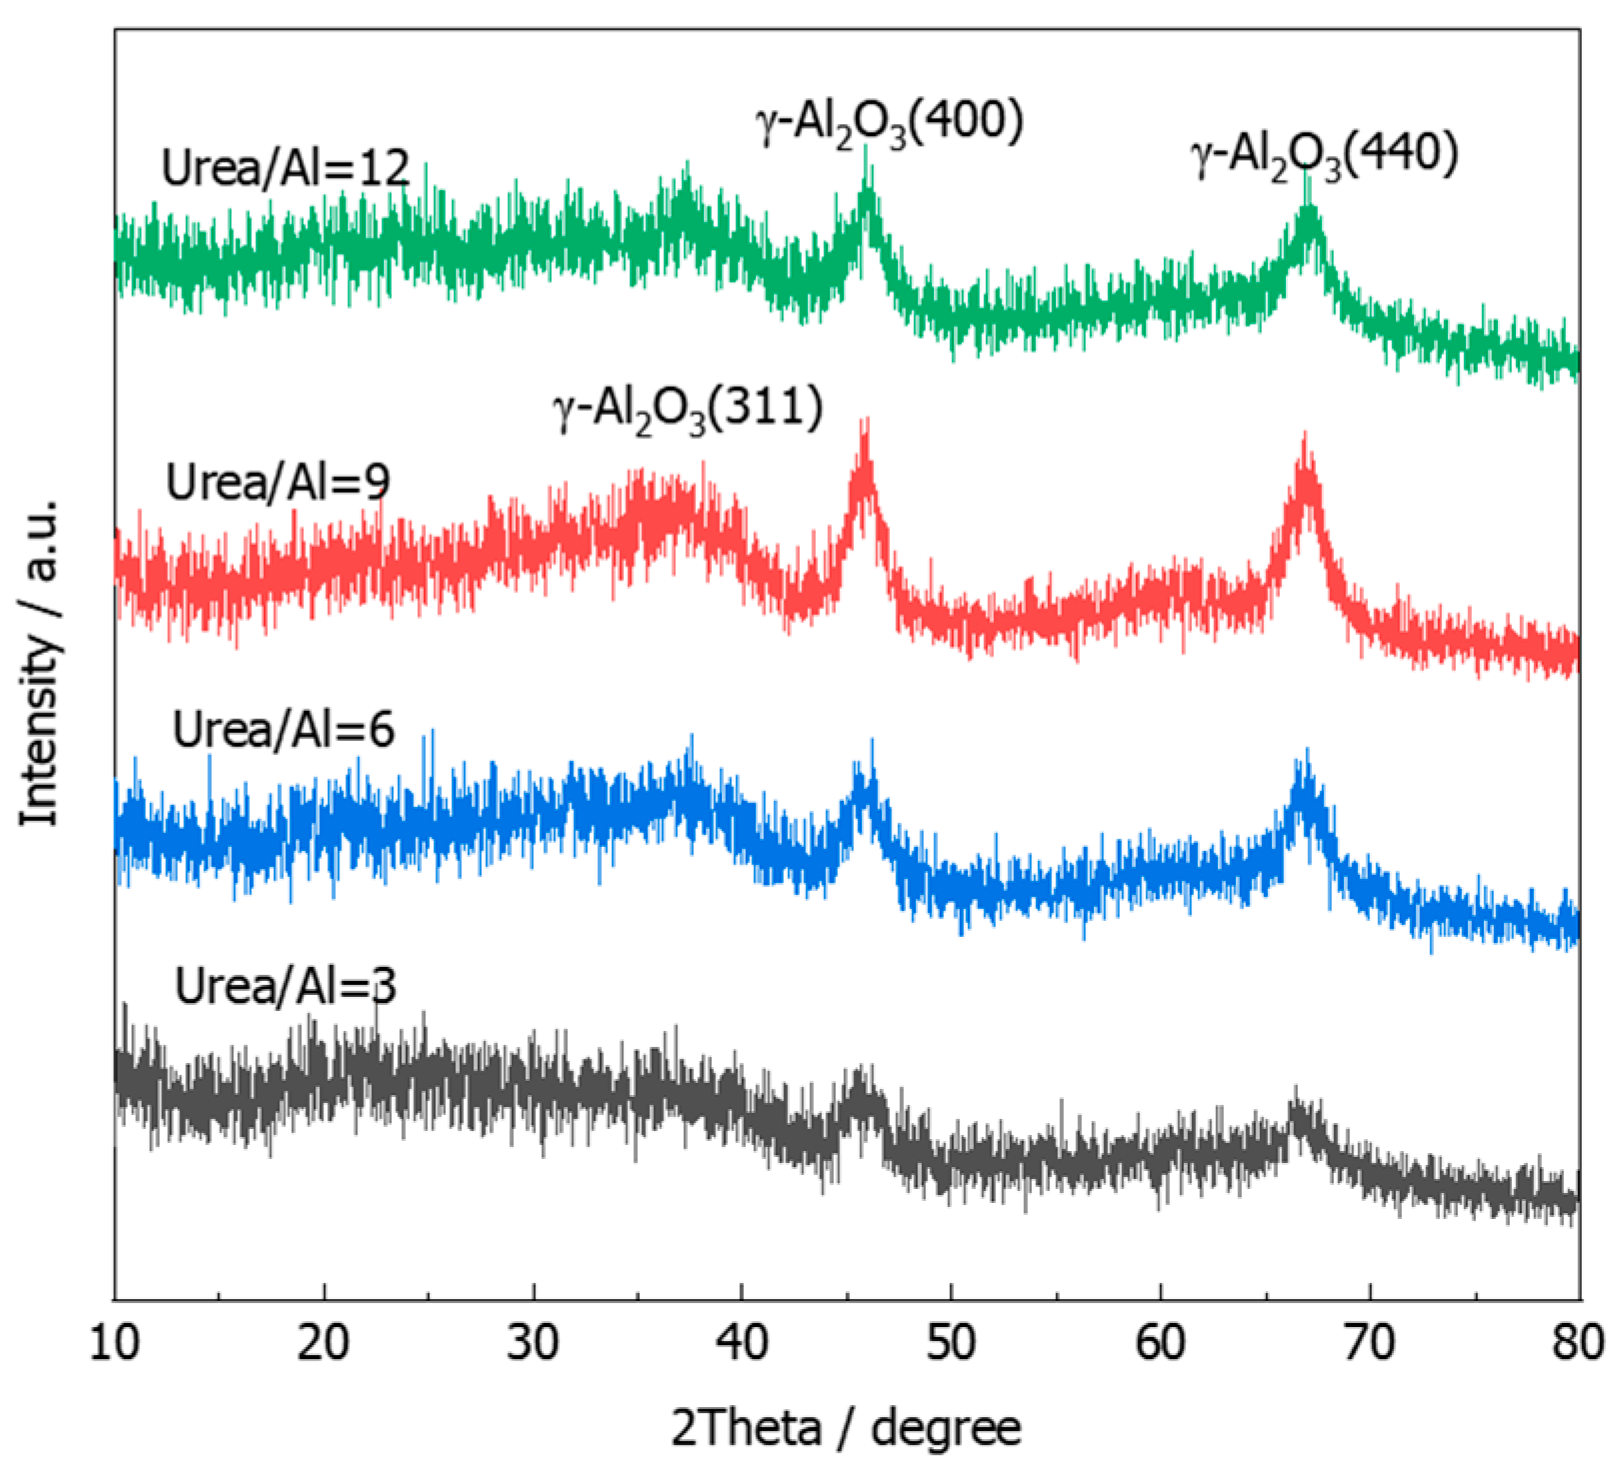
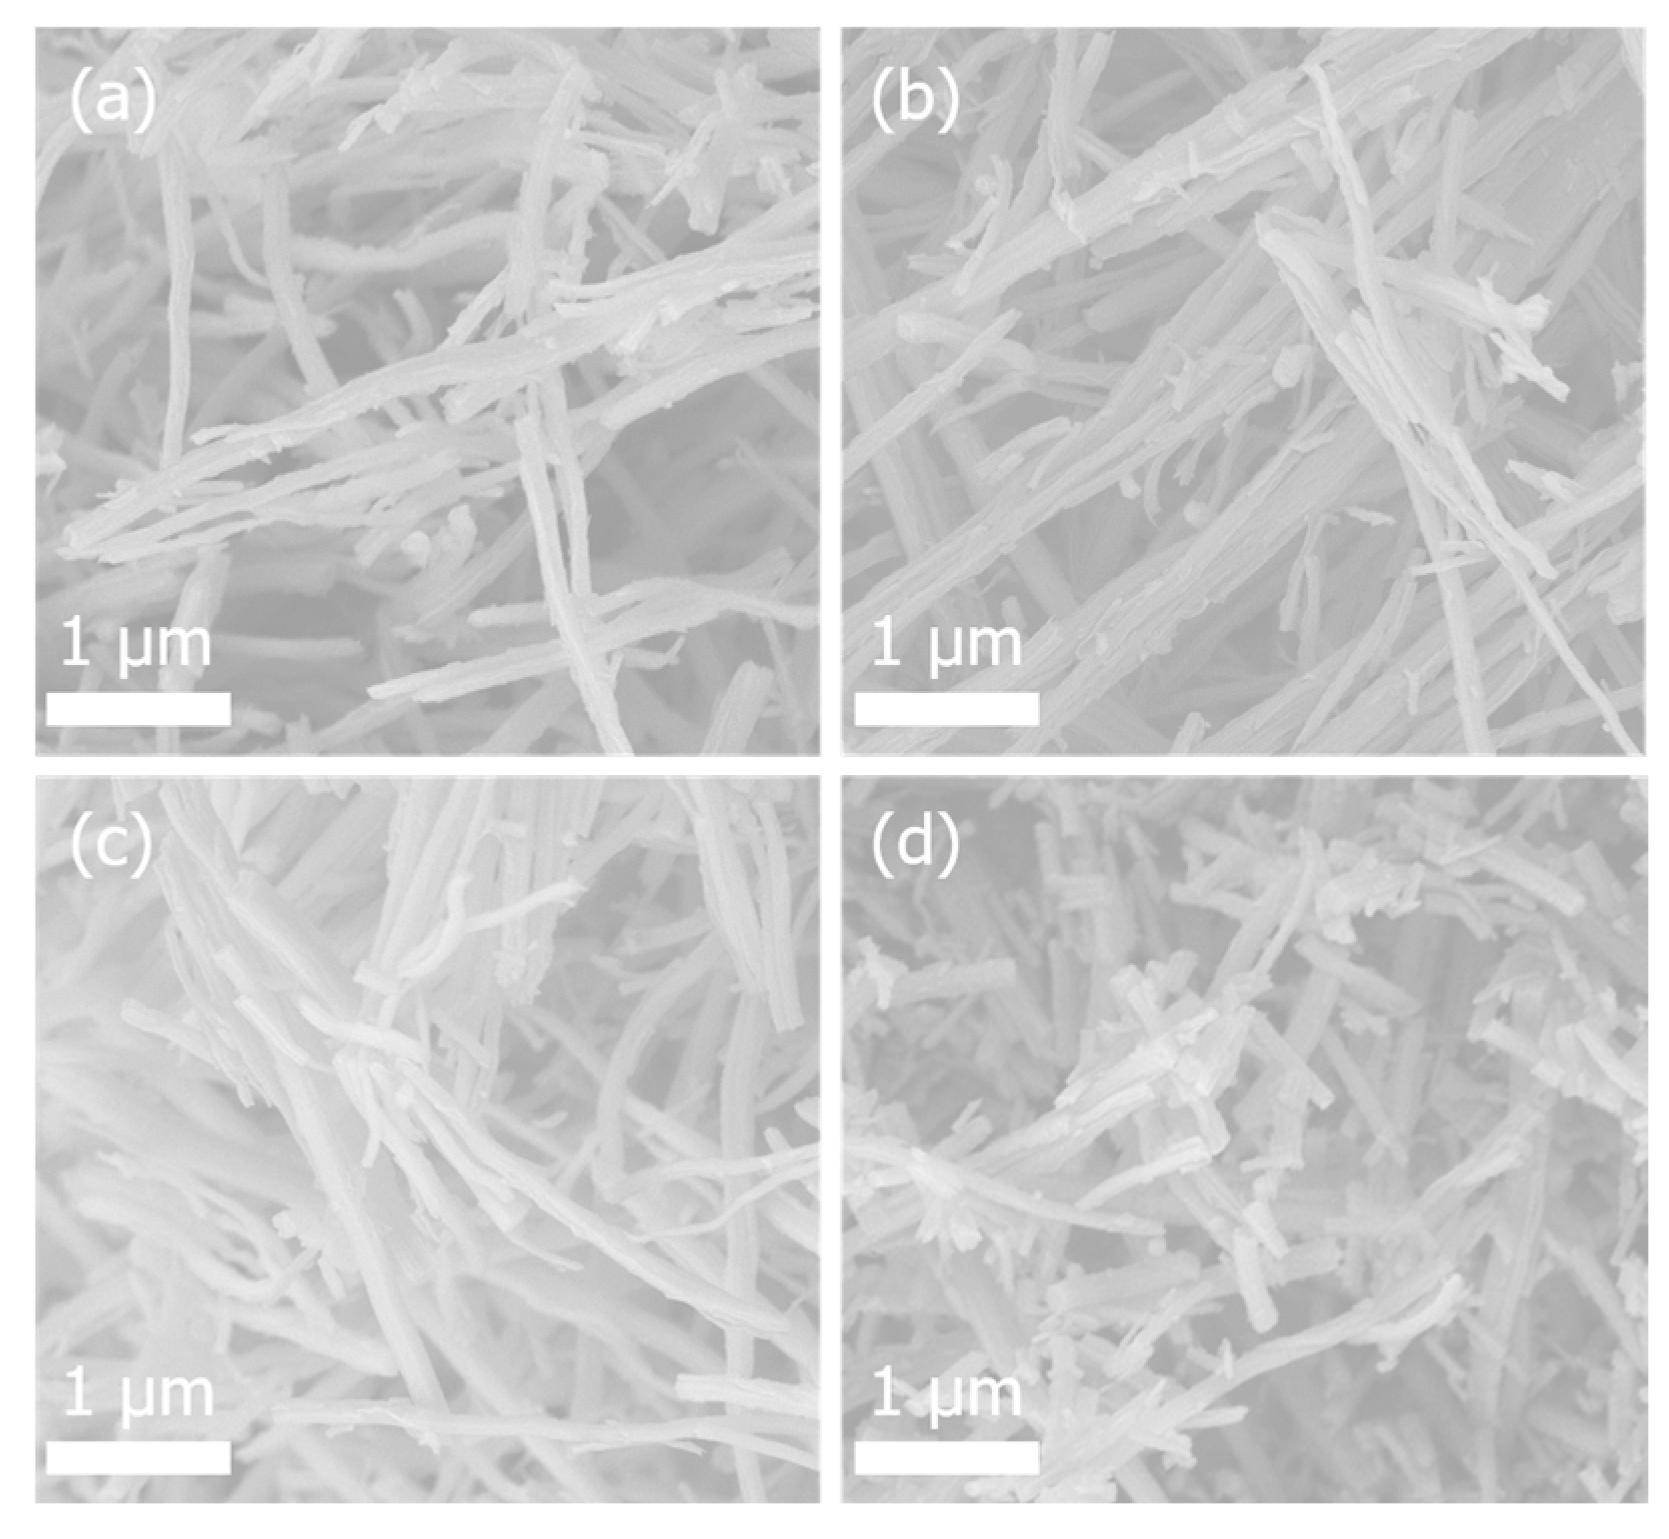
The dosage of urea as a precipitating agent determines the system’s alkalization rate and Al(OH)3 precipitation amount, thereby influencing the nucleation density and growth orientation of nanorods. In experiments, the urea-to-aluminum molar ratio (Urea/Al) was gradually increased from 3 to 12, with hydrothermal treatment at 100 °C for 48 h. At the lowest ratio (Urea/Al = 3, Figure 5a), the product consists of aggregated irregular particles with average dimensions of 0.6 ± 0.3 μm in length and 300 ± 70 nm in diameter (average aspect ratio of 2.0), yielding a BET surface area of only 138 m2/g (Table 3). Increasing the ratio to 6 (Figure 5b) initiates rod formation with dimensions of 1.5 ± 0.5 μm × 180 ± 50 nm (average aspect ratio of 8.3), and coexist with flake-like debris, raising the surface area to 208 m2/g. A further increase to the optimal ratio of 9 (Figure 5c) yields uniform nanorods with 2.5 ± 0.6 μm in length and 150 ± 35 nm in diameter (average aspect ratio of 16.7), maximizing the BET surface area to 220 m2/g. Excess urea (Urea/Al = 12, Figure 5d) elongates the rods to 3–4 μm but roughens their surfaces and slightly lowers the surface area to 218 m2/g. Consequently, a Urea/Al ratio of 9 is optimal for producing alumina nanorods with high specific surface area and uniform morphology. The Urea/Al = 9 sample achieves minimal lattice strain (0.11%), confirming the formation of highly ordered and crystalline γ-Al2O3 nanorods (Figure 6). In contrast, insufficient urea (ratio of 3) results in high strain (0.24%) from incomplete precipitation, while excess urea (ratio of 12) reintroduces defects (0.15%) from rapid nucleation kinetics.

3.2. Effect of Structure-Directing Agents

3.2.1. Effect of Alcohol Additives

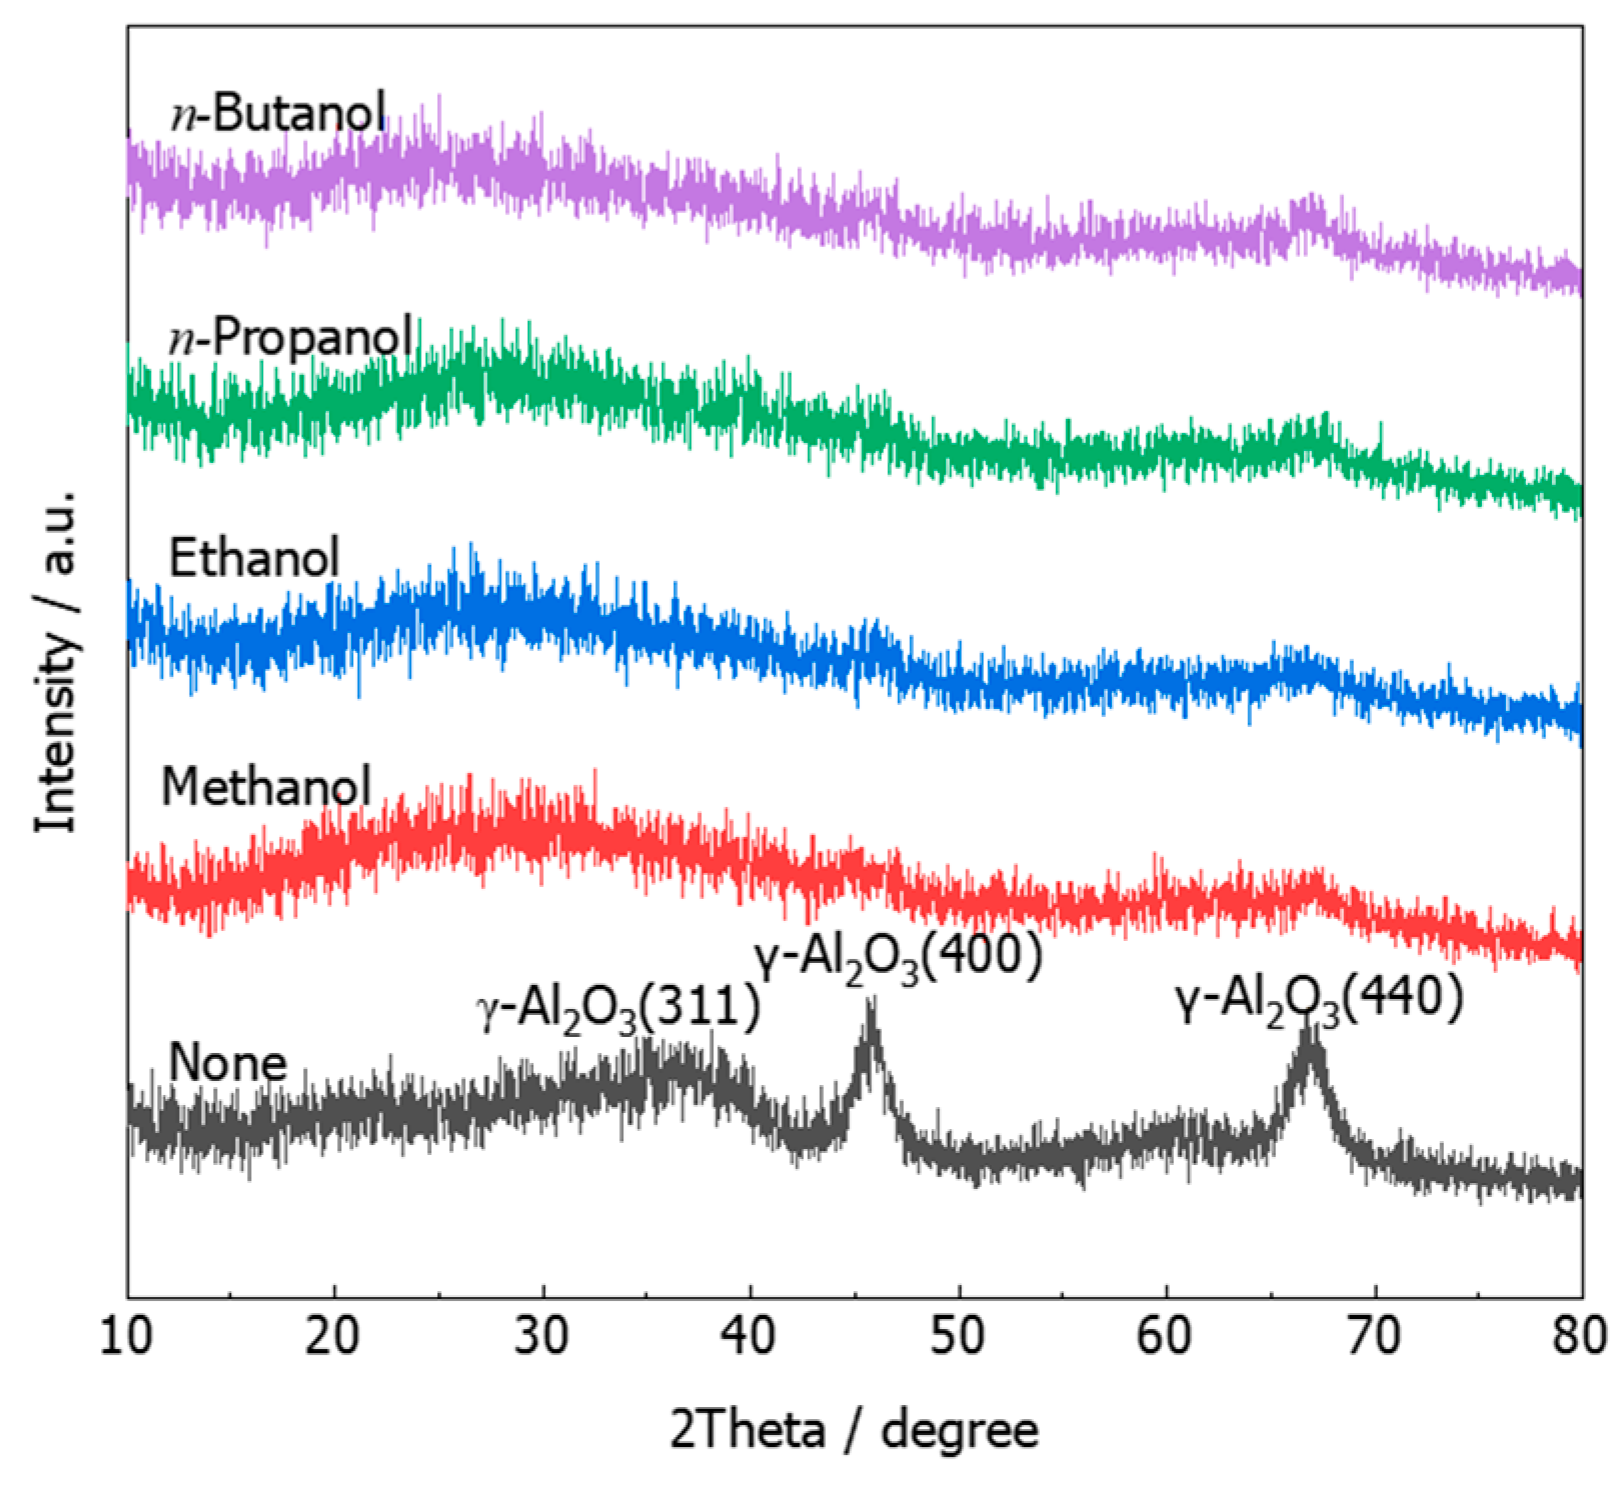
Alcohols act as crystal surface regulators that inhibit or promote specific growth directions through selective adsorption, significantly altering the aspect ratio and crystallinity of alumina nanorods. In experiments conducted under fixed hydrothermal conditions (100 °C, 48 h), methanol, ethanol, n-propanol, and n-butanol were sequentially added at an alcohol-to-Al molar ratio of 2:1. In the absence of alcohol (control), statistical analysis (Figure 7, n = 60) reveals nanorods with average dimensions of 2.5 ± 0.6 μm × 165 ± 40 nm, corresponding to an average aspect ratio of 15.2 and a BET area of 220 m2/g. Upon adding methanol, the rod length extends to 5.0 ± 1.2 μm with a diameter of 180 ± 45 nm (average aspect ratio of 27.8), yet the BET surface area decreases from 220 to 194 m2/g (Table 4). Switching to ethanol further elongates the rods to 10.2 ± 2.1 μm, with an increased diameter of 280 ± 60 nm, pushing the average aspect ratio to 36.4, while the BET surface area drops from 194 to 188 m2/g. Continued use of n-propanol maintains comparable length (9.8 ± 2.0 μm) but reduces diameter to 250 ± 55 nm (average aspect ratio of 39.2), slightly recovering the BET surface area from 188 to 195 m2/g. Finally, replacing n-propanol with n-butanol shortens the rods to 3.8 ± 0.9 μm × 190 ± 45 nm, lowering the average aspect ratio to 20.0, while the BET surface area rebounds from 195 to 208 m2/g. As shown in Figure 8, the introduction of alcohol additives resulted in varying degrees of broadening and intensity reduction in diffraction peaks. Ethanol samples exhibited the most pronounced peak broadening, indicating the most significant decrease in crystallinity. This is primarily because the weak adsorption of ethanol promotes one-dimensional preferential growth while simultaneously inhibiting crystal plane rearrangement and defect repair, leading to the accumulation of lattice distortion. This trend aligns with the SEM observations showing a substantial increase in nanorod length (10 μm) but a corresponding reduction in specific surface area (188 m2/g). In contrast, n-butanol samples maintained XRD patterns similar to the control group with slightly sharper peaks, suggesting better recovery of crystallinity. This corresponds to the SEM observations of shorter yet well-structured nanorods (3–4 μm) and the rebound in specific surface area (208 m2/g). The weak adsorption effect of alcohols promotes one-dimensional preferential growth of γ-Al2O3, achieving optimal results with ethanol and n-propanol, though accompanied by significant strain-induced broadening and corresponding reduction in crystallinity and specific surface area. XRD analysis (Figure 8) shows ethanol samples exhibiting substantial peak broadening, with the crystallinity index decreasing from 0.89 (control) to 0.83 (ethanol). The specific BET surface area drops from 220 m2/g to 188 m2/g (14.5% decrease). The sample using n-propanol exhibits a crystallinity index decreasing to 0.85 compared with that of the control sample (0.89). The specific BET surface area drops from 220 m2/g to 195 m2/g (11.4% decrease).

3.2.2. Effect of Amine Additives

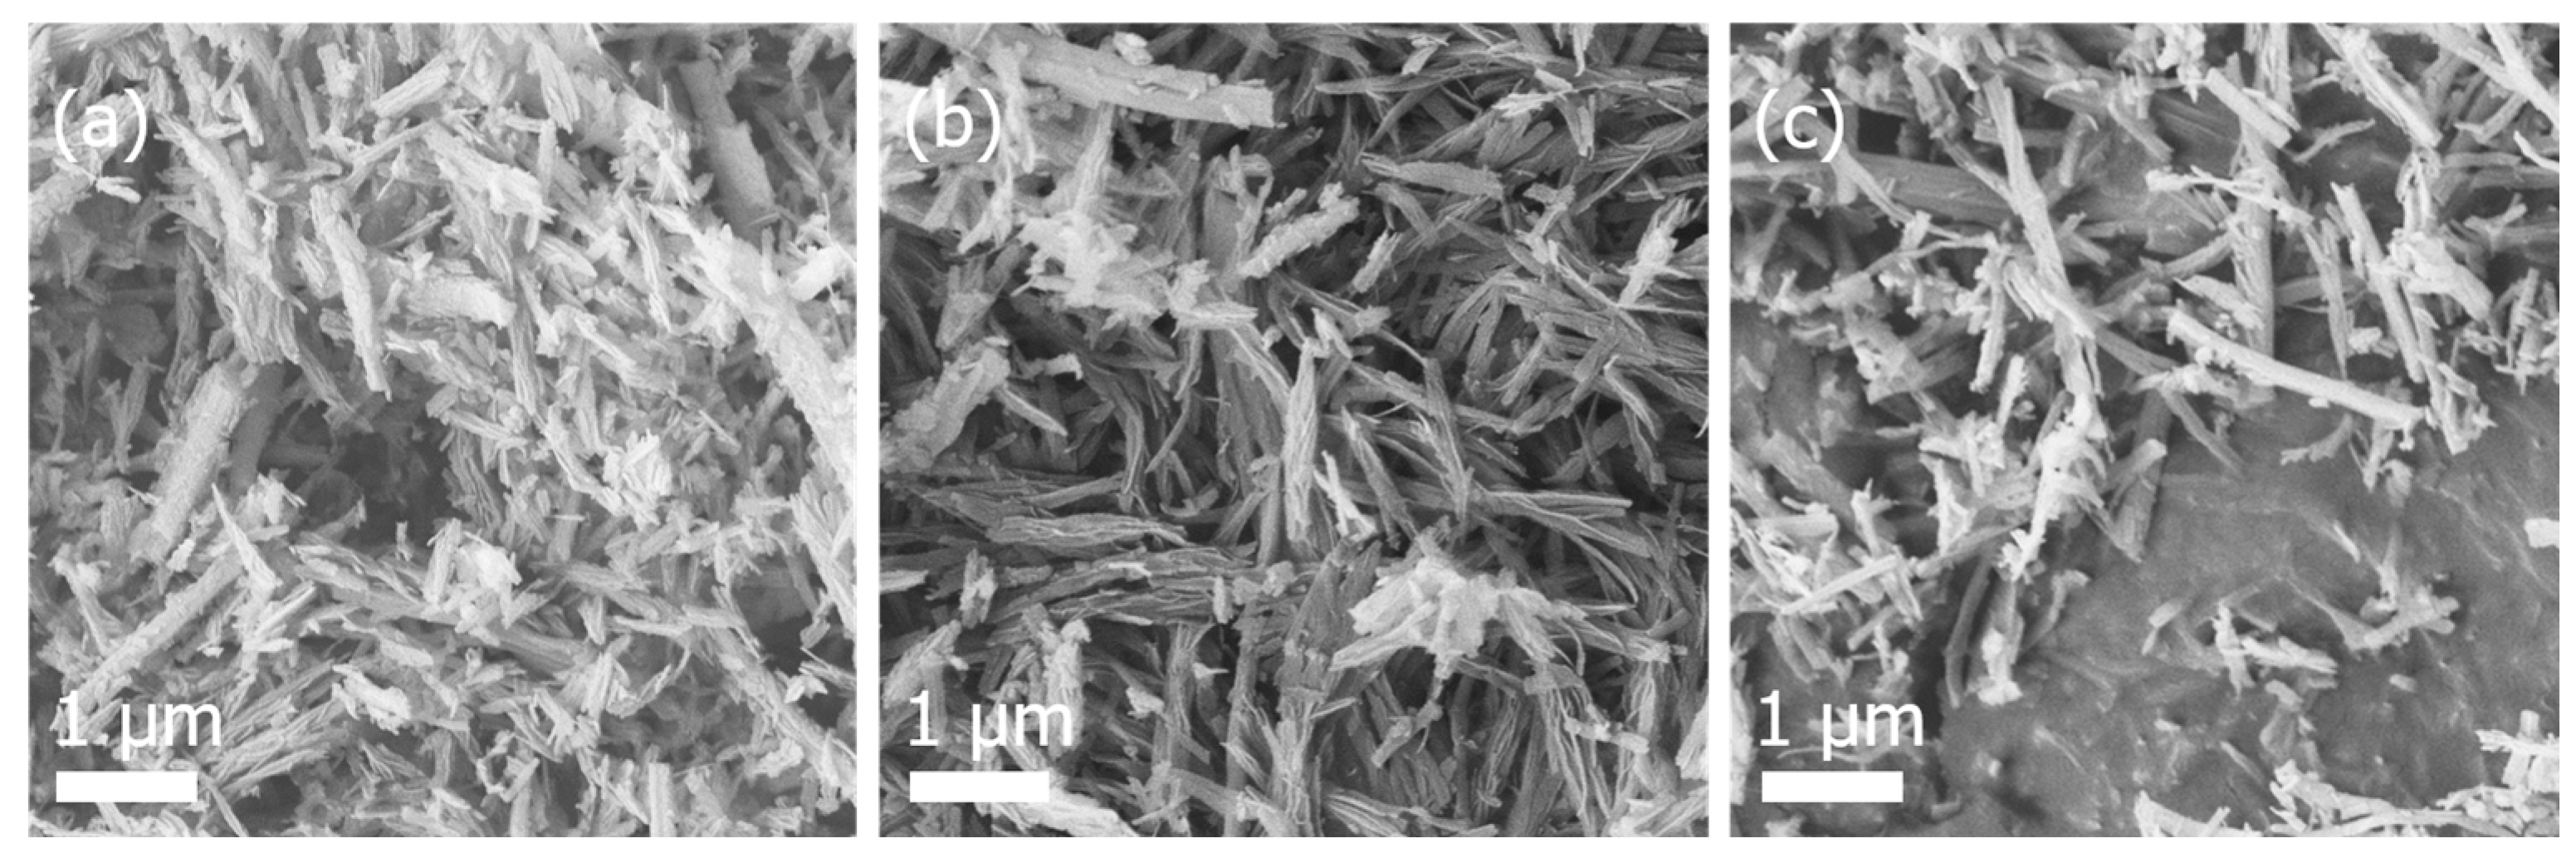
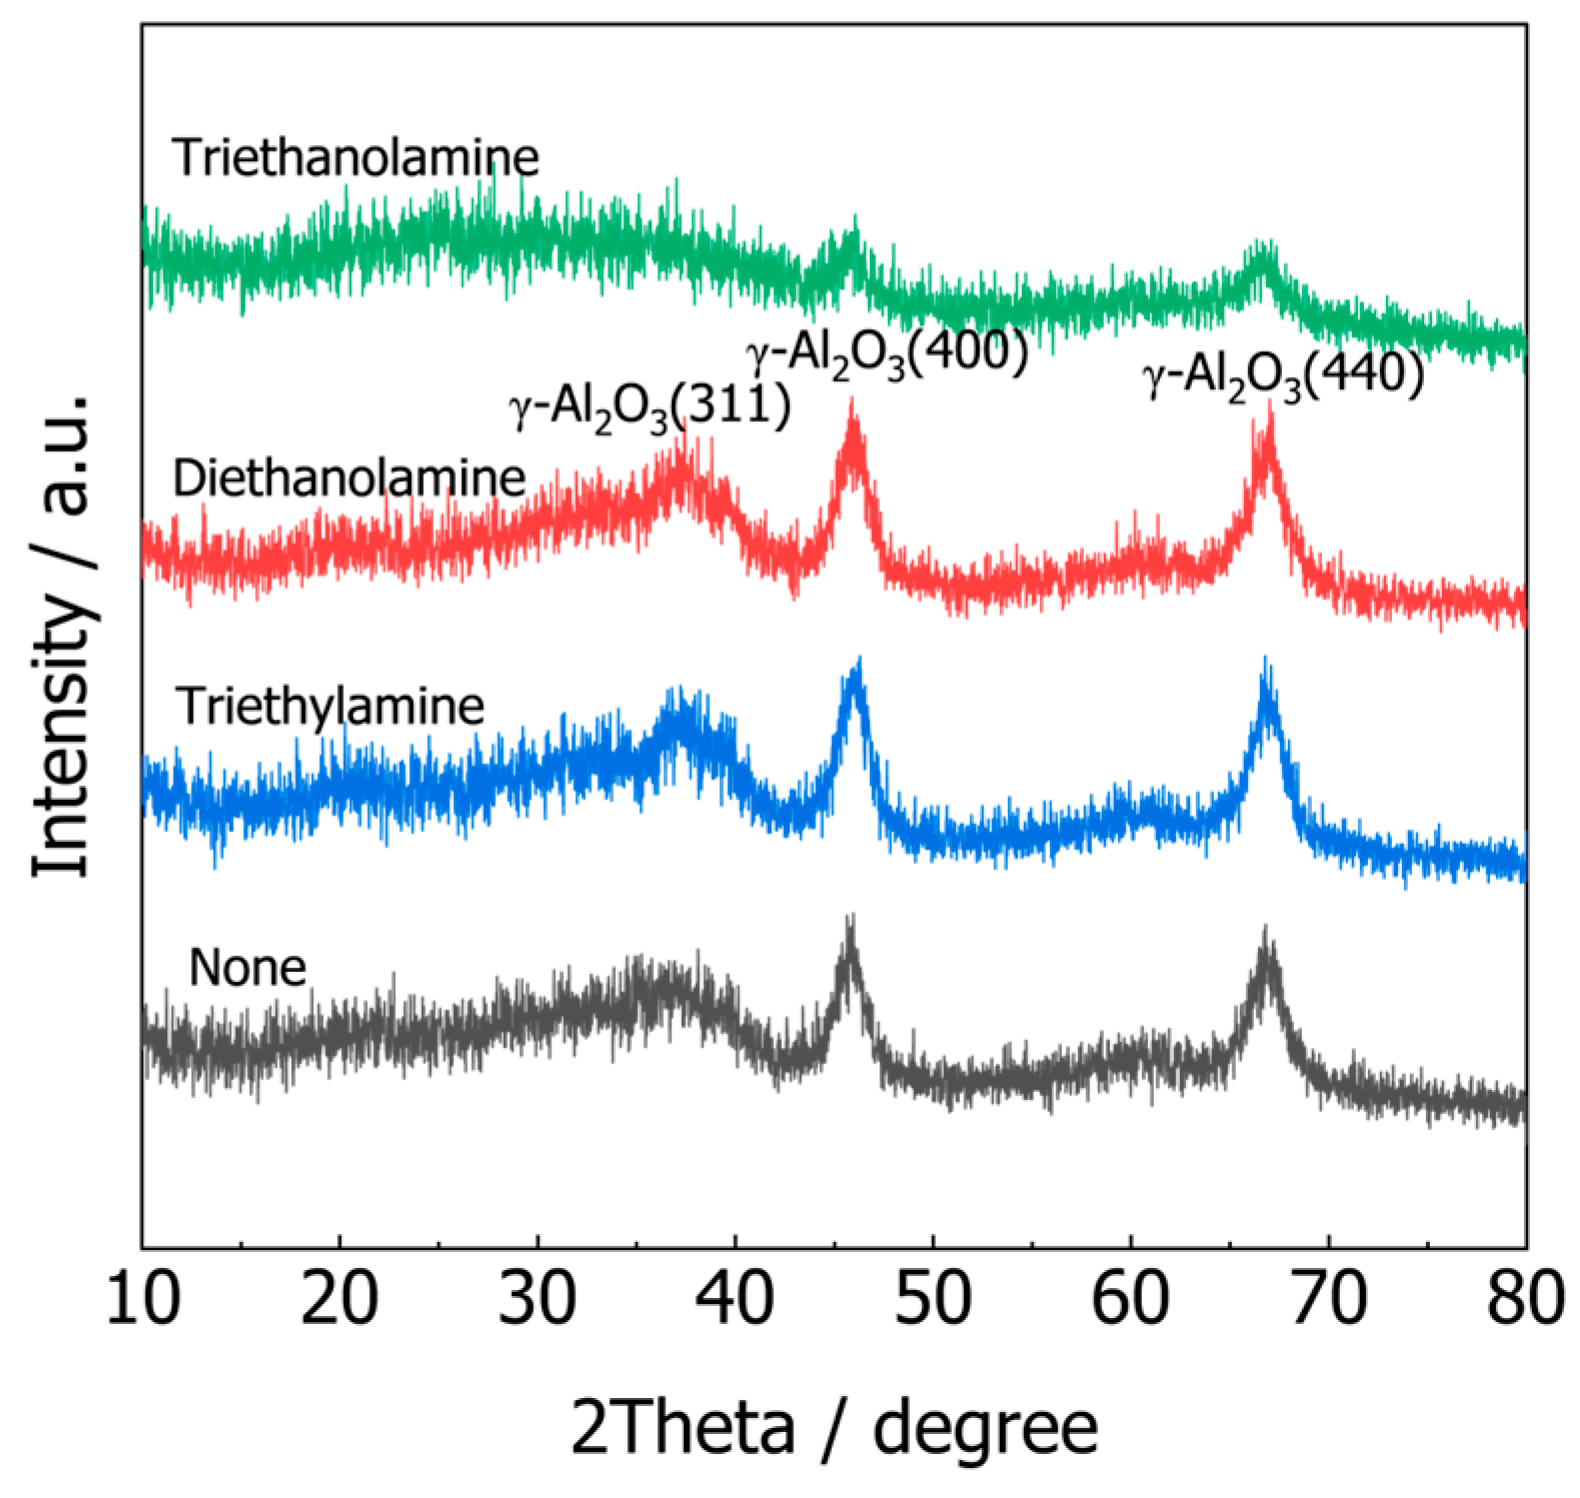
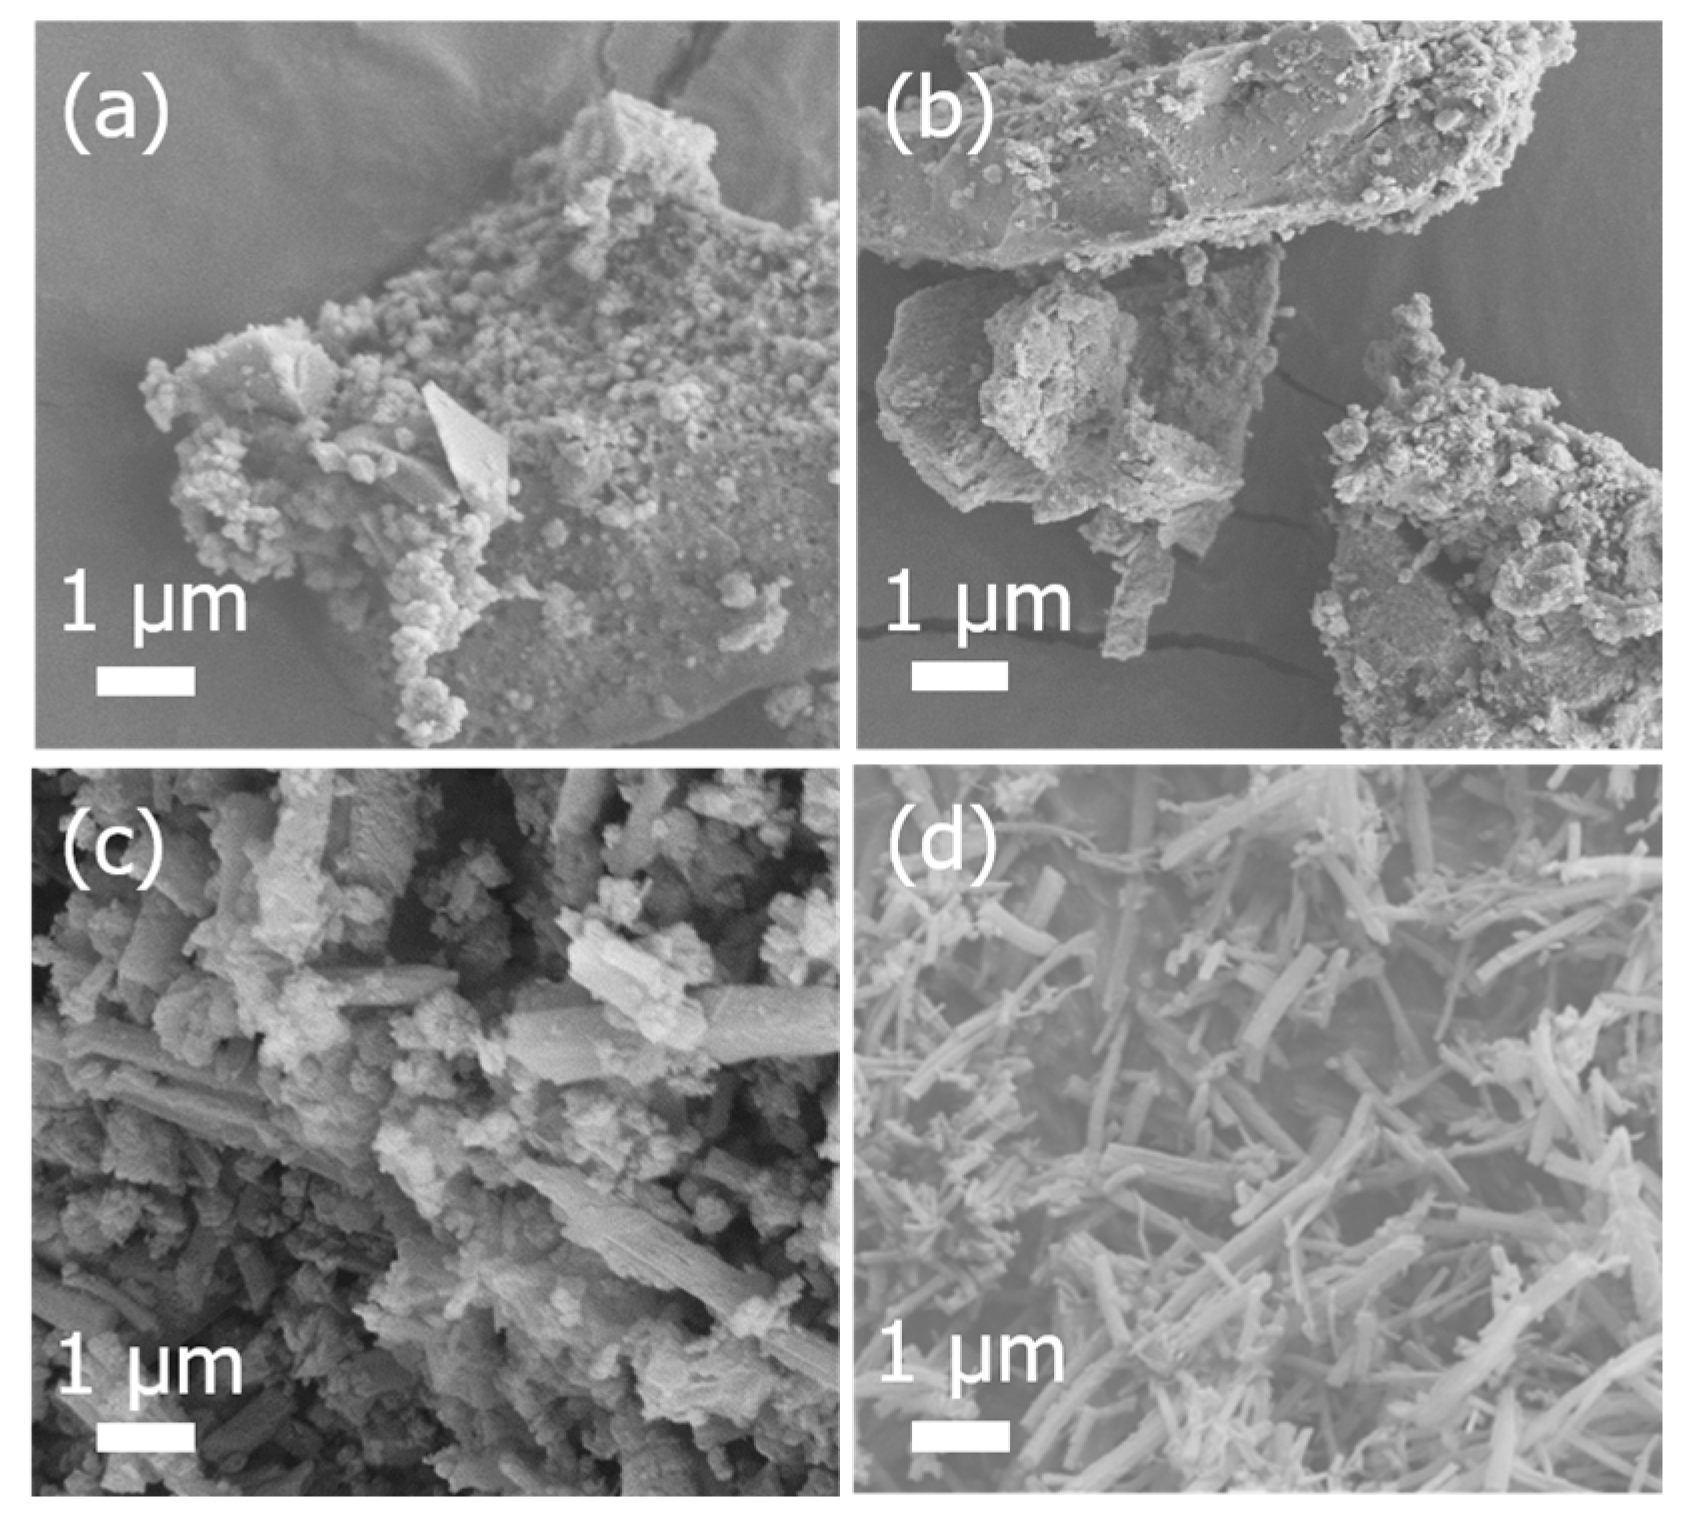
Amines anchor to alumina through -NH2/-OH groups, simultaneously tailoring rod dimensions and porosity. At an amine/Al molar ratio of 1:1 and otherwise identical hydrothermal conditions (100 °C, 48 h, and Urea/Al = 9), the following trends were observed. In the absence of amine, nanorods exhibit dimensions of 2.5 ± 0.6 μm × 165 ± 40 nm (average aspect ratio of 15.2) with a BET surface area of 220 m2/g. Introducing triethylamine shortens the rods to 1.0 ± 0.3 μm with a reduced diameter of 165 ± 35 nm, yielding an average aspect ratio of 6.1 (Figure 9a), while increasing the BET surface area from 220 to 250 m2/g (Table 5). Continued substitution with diethanolamine further reduces the length to 0.8 ± 0.2 μm while maintaining a narrow diameter distribution (110 ± 25 nm), resulting in an average aspect ratio of 7.3 with the most uniform willow-leaf-like morphology (Figure 9b); yet, it boosts the BET surface area from 250 to a maximal 260 m2/g, accompanied by an expanded pore volume (0.43 cm3/g). Switching to triethanolamine (Figure 9c) restores rod length to 2.0 ± 0.8 μm but increases diameter variability to 200 ± 70 nm (average aspect ratio of 10.0); however, it produces a looser morphology and decreases the BET surface area from 260 to 217 m2/g. As shown in Figure 10, the control sample without amine regulators exhibited typical sharp γ-Al2O3 diffraction peaks, indicating high crystallinity. The introduction of triethylamine resulted in slight broadening of XRD peaks and a minor decrease in crystallinity, yet maintained good crystal structure. The addition of diethanolamine further sharpened the XRD peaks with enhanced intensity. The strain decreased to 0.09%, corresponding to its high crystallinity (0.91) and regular willow-leaf morphology, demonstrating significantly improved crystallinity (crystallinity index reaching 0.91), consistent with the well-defined “willow-leaf” morphology observed in SEM and its maximum specific surface area (260 m2/g). In contrast, triethanolamine samples showed markedly broadened diffraction peaks with reduced intensity and the smallest crystal grain size (12.1 nm) and the highest microstrain, indicating the poorest crystallinity (0.75) and corresponding irregular loose structure observed in SEM, along with decreased specific surface area (217 m2/g). It is worth noting that grinding samples may alter their crystallinity and morphology. To clarify this, we performed XRD and SEM characterization on samples before and after grinding (Figures S7 and S8). The results indicate that grinding does not change their crystallinity and morphology in this study.
Thus, diethanolamine affords the highest BET surface area (260 m2/g) while preserving a moderate aspect ratio (7:1), making it the most effective amine regulator for balancing surface area and rod morphology.

3.2.3. Correlation with DFT Calculations

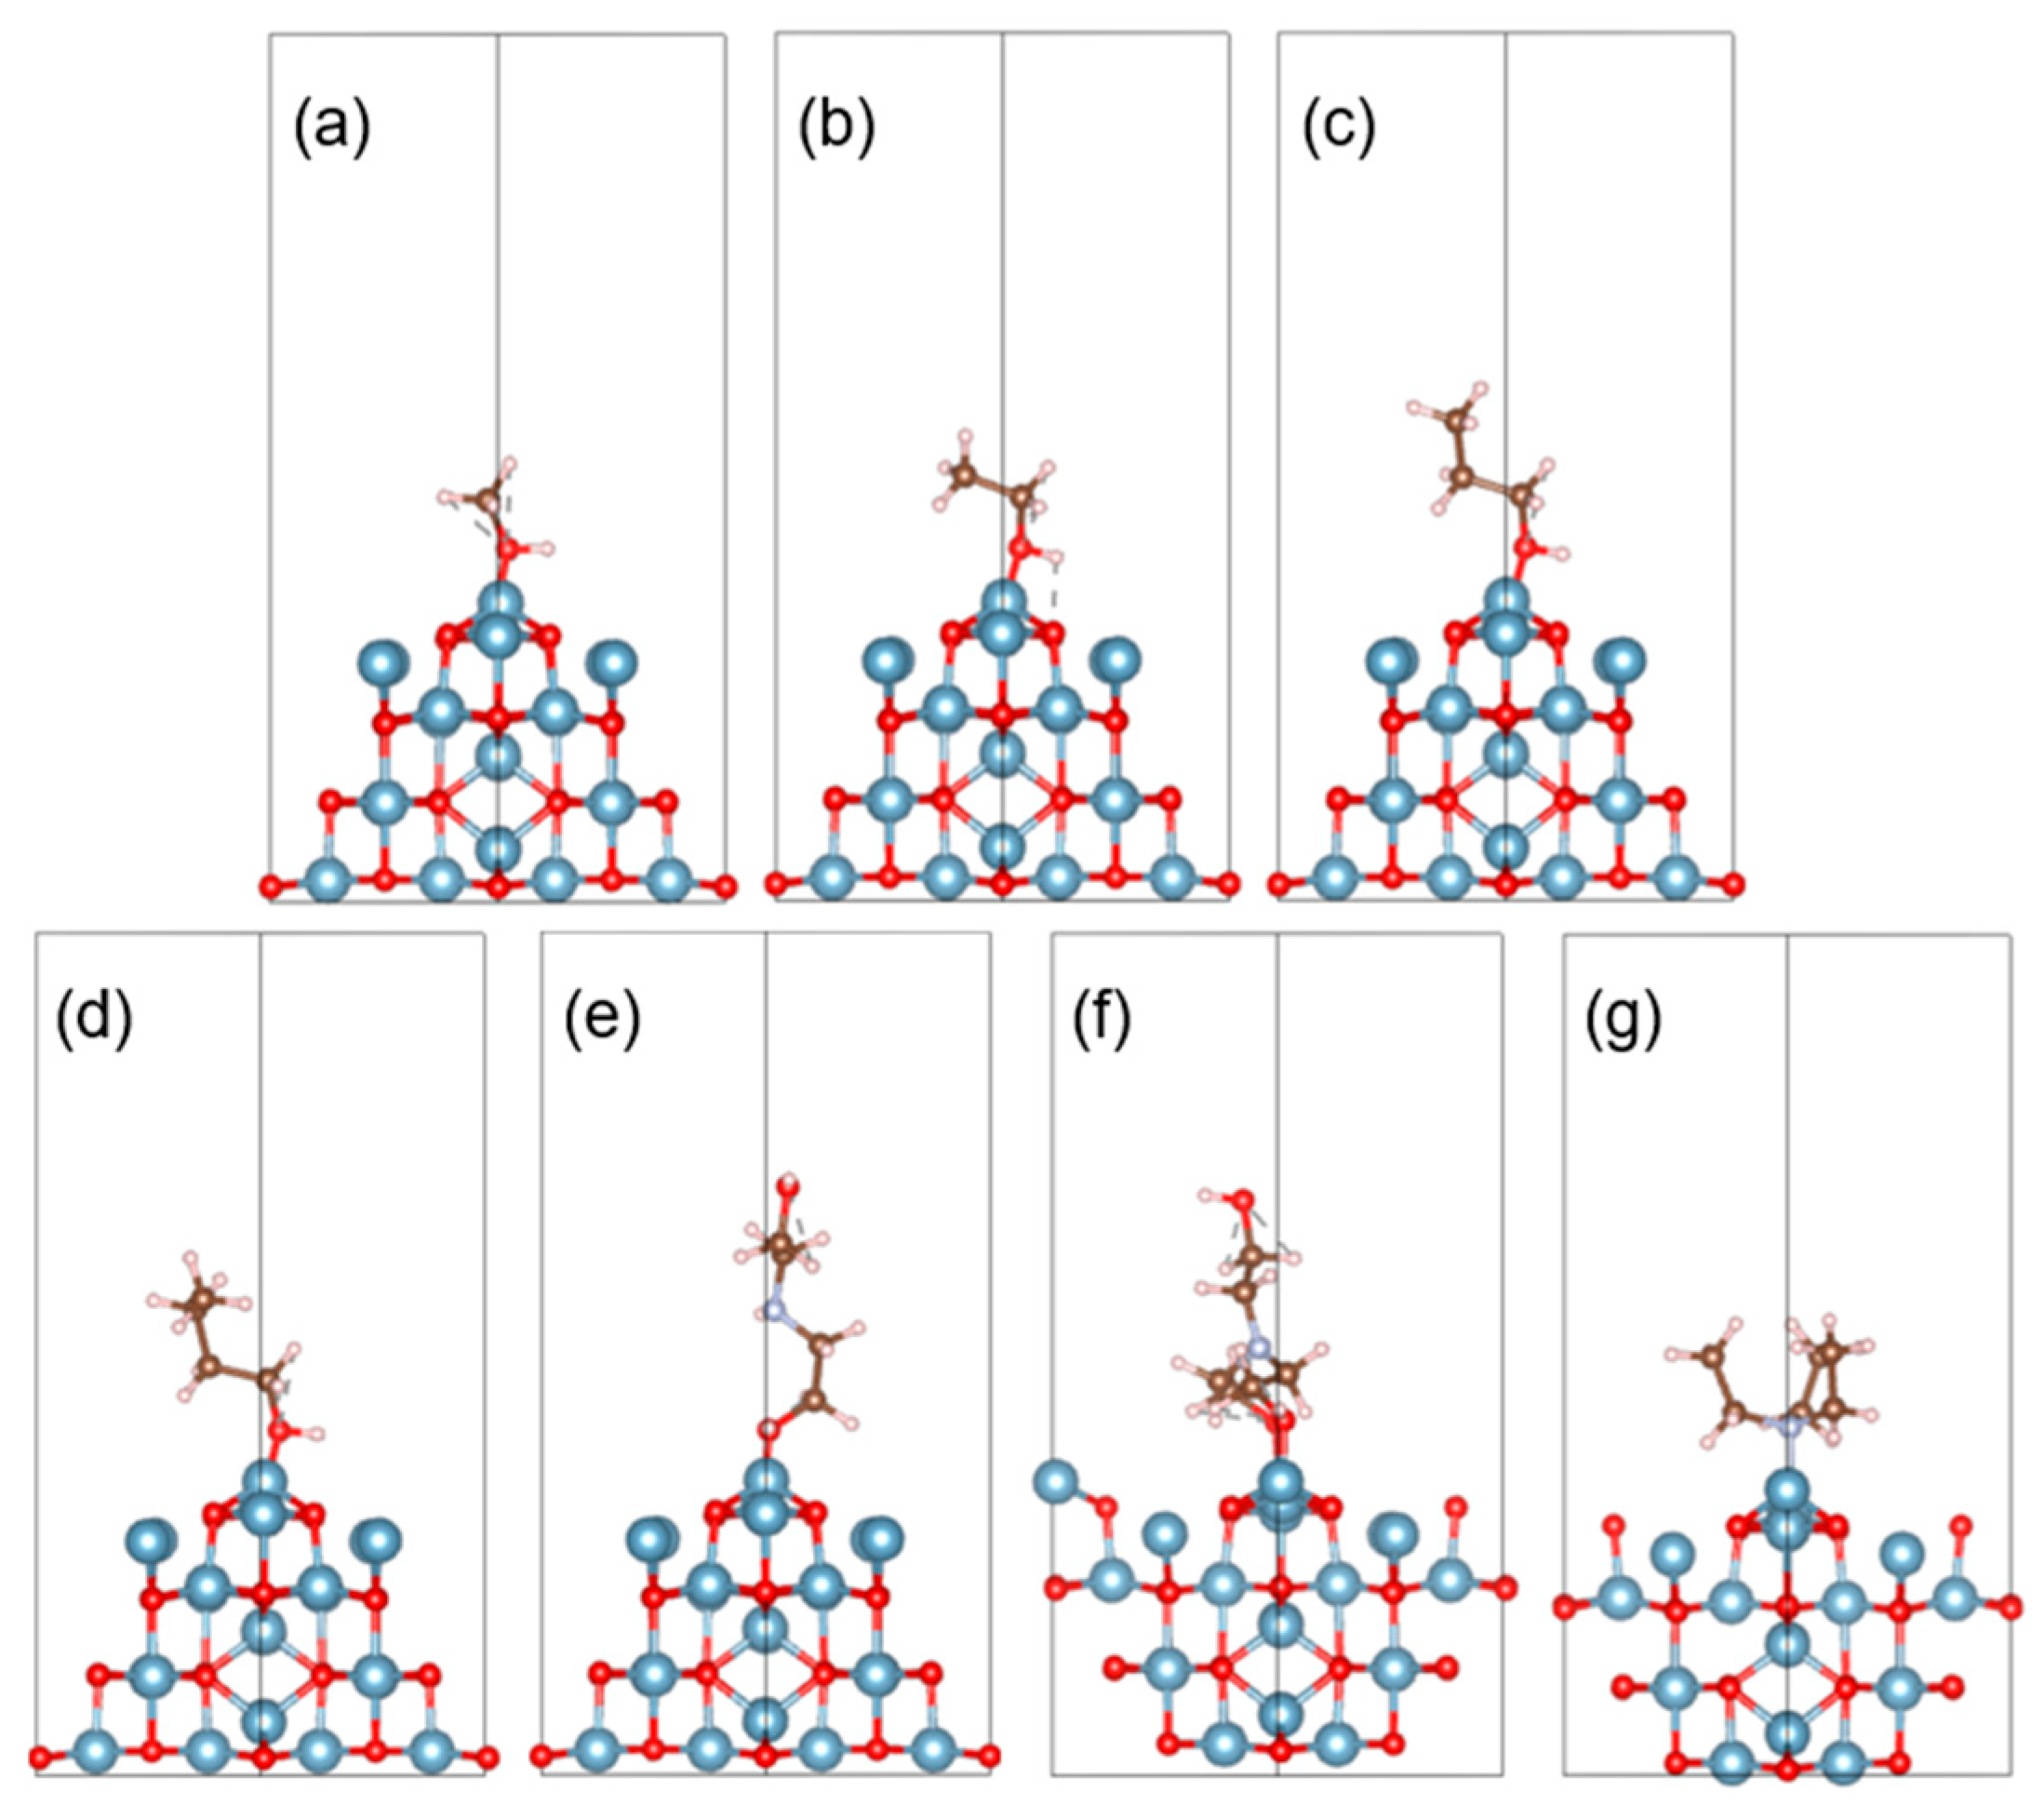
The adsorption energy of methanol, ethanol, n-propanol, n-butanol, triethylamine, diethanolamine and triethanolamine on the 400 crystal surface of alumina was calculated by DFT to study the influence of different crystal surface regulators on the morphology of alumina. Figure 11 shows the models of adsorption for various small molecules on the 400 crystal plane of alumina; triethanolamine and alumina have two aluminum oxygen bonds, while the others have only one bond. The calculated adsorption energies are −0.82 eV, −0.80 eV, −0.88 eV, −0.81 eV, −0.92 eV, −0.93 eV, and −1.89 eV, respectively.
The adsorption energies of alcohol additives show minimal differences, with little change in their morphological structures. In contrast, the adsorption energies of alcoholamine additives vary significantly, particularly the low adsorption energy of triethanolamine, which leads to more pronounced morphological changes. Although high aspect ratios can be achieved, both excessively strong and weak adsorption energies might result in morphological structures with degraded crystallinity. For example, while triethanolamine has the strongest adsorption and the largest average width, it results in a loose or irregular morphology. Adding alcohol regulators with weaker adsorption can form uniform nanorod structures, whereas diethanolamine, with moderate adsorption, forms a uniform willow-leaf structure with the smallest average width. Therefore, selecting a crystalline surface regulator with an appropriate adsorption energy is crucial for controlling the material’s morphology.
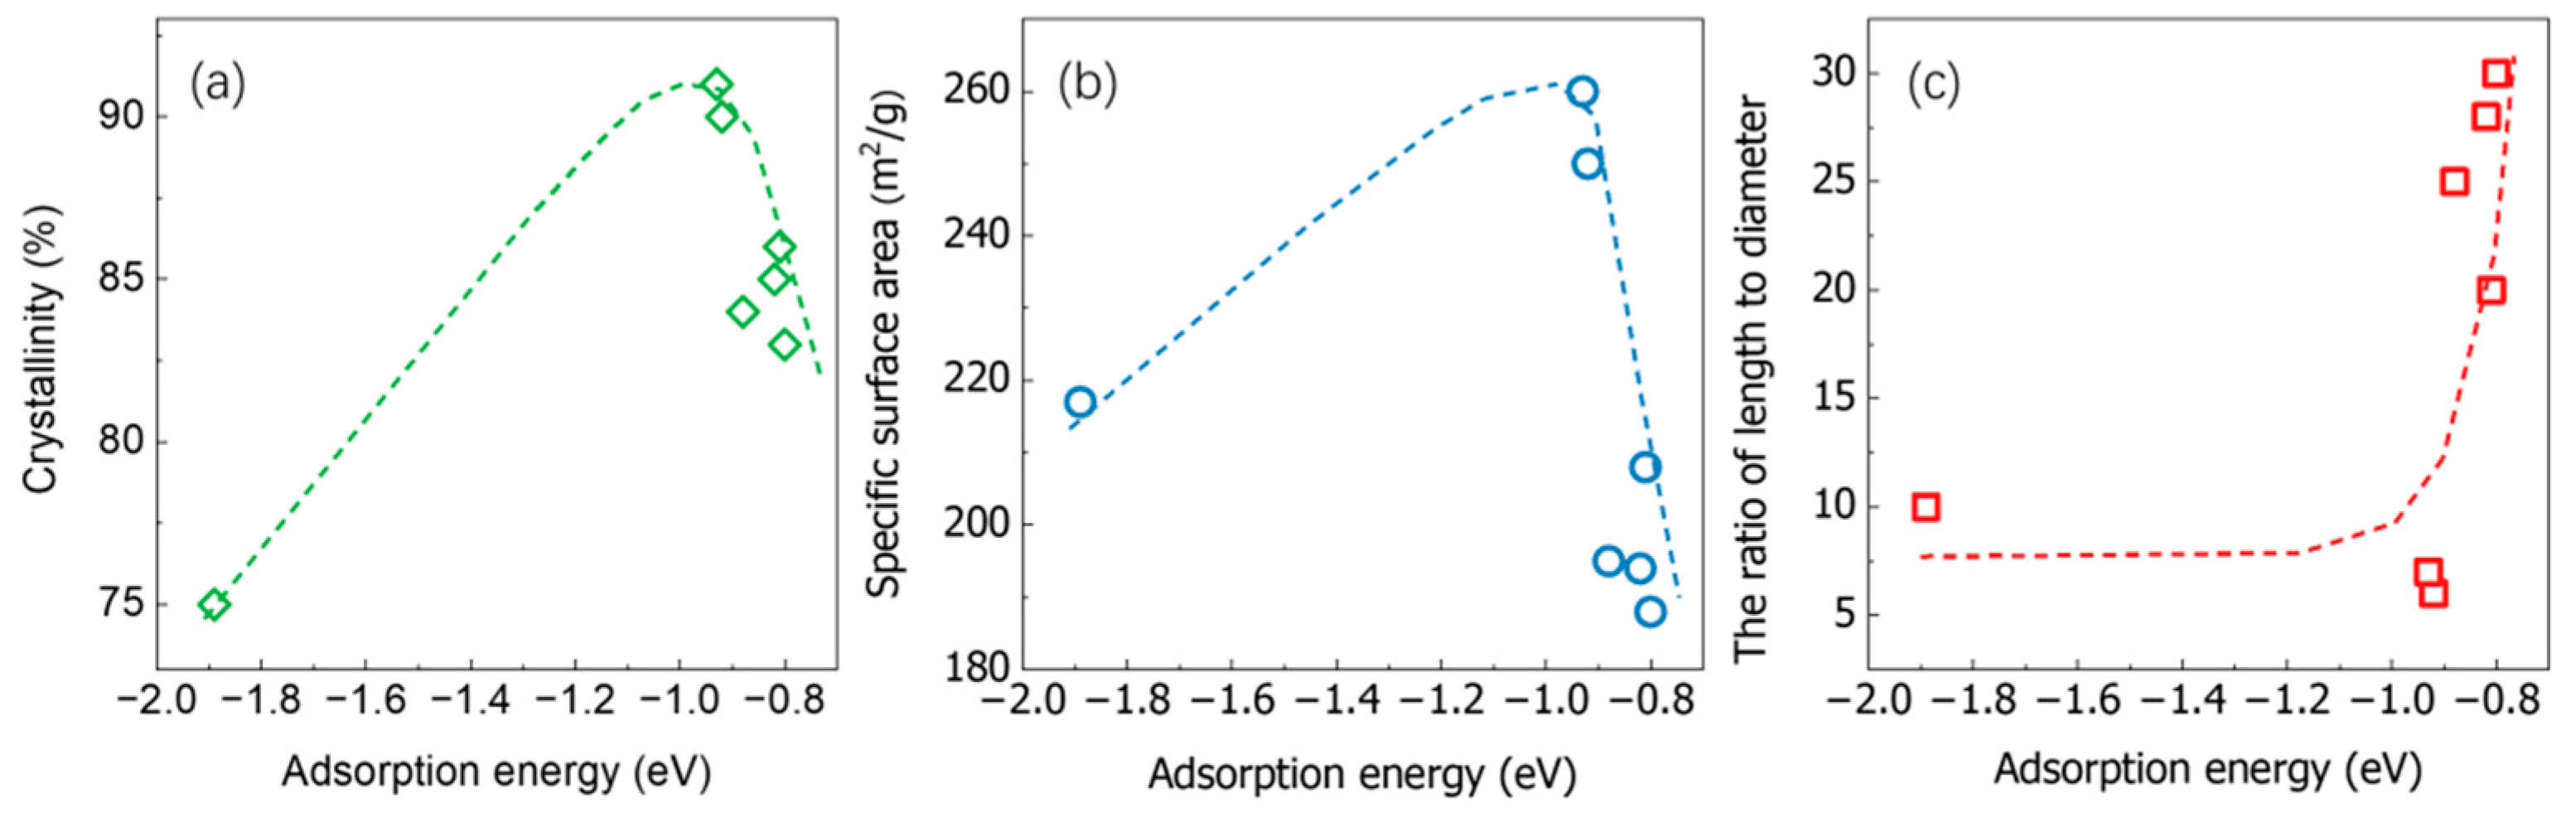
Figure 12 shows the correlation between adsorption energy and crystallinity, specific surface area and aspect ratio of alumina nanorods. As the adsorption energy increases, crystallinity and the specific surface area first increase and then decrease. The optimal adsorption energy for achieving the highest specific surface area is around −0.9 eV, as seen with diethanolamine.
The adsorption energies of methanol, ethanol, n-propanol, and n-butanol are close to (−0.80 eV to −0.88 eV), with specific surface areas ranging from 188 m2/g to 208 m2/g and crystallinity index levels between 0.83 and 0.86 [15]. This suggests that moderate adsorption energy can lead to the formation of uniform surface and crystal structures, enhancing specific surface area and crystallinity, and producing longer nanorods with a length-to-diameter ratio (L/D) of 20:1 to 30:1. Triethylamine and diethanolamine have slightly higher adsorption energies (−0.92 eV and −0.93 eV), with specific surface areas of 250 m2/g and 260 m2/g, and crystallinity levels of 0.90 and 0.91, respectively, but their L/D ratios are shorter at 6:1 and 7:1. Triethanolamine has the highest adsorption energy (−1.89 eV), with a lower specific surface area (217 m2/g) and crystallinity level (0.75), and a shorter L/D ratio (10:1), indicating that excessively high adsorption energy can reduce specific surface area, crystallinity, and L/D ratio.

4. Conclusions

In this work, one-dimensional γ-alumina nanorods with tunable morphology, high specific surface area, and excellent crystallinity were successfully synthesized through a facile hydrothermal route. By systematically varying hydrothermal time (8–48 h), temperature (80–140 °C) and urea dosage (Urea/Al = 3–12), we first identified the optimal synthesis window (100 °C, 48 h, Urea/Al = 9) that yields uniform nanorods 2–3 μm in length with a BET area up to 220 m2/g. Most importantly, we demonstrate that the judicious selection of structure-directing agents (SDAs), including alcohols and amines, provides an additional, powerful means for fine-tuning rod dimensions and porosity beyond what is achievable by classical parameter optimization alone.
Specifically, replacing the control (no SDA) with ethanol lengthens the nanorods from 2 to 3 μm to 10 μm and raises the aspect ratio from 15.2 to 39.2, whereas diethanolamine shortens the rods to 0.7–0.9 μm (average aspect ratio of 7.3) yet boosts the BET surface area from 220 to 260 m2/g. DFT calculations reveal that these morphological changes correlate directly with the adsorption energy of each SDA on the γ-Al2O3 (400) facet. Moderate adsorption energies around −0.9 eV (diethanolamine) maximize both crystallinity (0.91) and specific surface area (260 m2/g), while excessively strong (−1.89 eV, triethanolamine) or weak (−0.80 to −0.88 eV, alcohols) interactions compromise one or more of these properties. Consequently, by matching the adsorption strength of the SDA to the desired growth direction, we can rationally design alumina nanorods with tailored aspect ratios (6:1–30:1) and BET areas (188–260 m2/g) without additional synthetic complexity. Compared to previously reported hydrothermal methods (Table S1) [9,13,16,17,18,19,20,21,22,23] for alumina nanorods, our SDA strategy achieves a superior combination of high specific surface area, high crystallinity, and wide aspect ratio tunability. This performance surpasses the typical trade-off between porosity and crystallinity observed in conventional template-free or block-copolymer-templated syntheses, demonstrating the effectiveness of our alcoholamine-based crystal plane regulation approach.
These findings not only provide a systematic, experiment-plus-theory framework for morphology-controlled synthesis of alumina nanorods, but also open new avenues for engineering advanced alumina-based catalysts, adsorbents, and sensors with precisely tuned surface structures and functionalities.

Supplementary Materials

The following supporting information can be downloaded at: https://www.mdpi.com/article/10.3390/micro6010017/s1, Figure S1: Diameter distribution histograms of alumina nanorods prepared at different hydrothermal times: (a) 8 h; (b)16 h; (c) 32 h; (d) 48 h; Figure S2: Diameter distribution histograms of alumina nanorods prepared at different hydrothermal temperature: (a) 80 °C; (b) 100 °C; (c) 120 °C; (d) 140 °C; Figure S3: Diameter distribution histograms of alumina nanorods prepared with different urea addition amounts: (a) Urea/Al = 3; (b) Urea/Al = 6; (c) Urea/Al = 9; (d) Urea/Al = 12; Figure S4: Diameter distribution histograms of alumina nanorods prepared with different alcohol additives: (a) Methanol; (b) Ethanol; (c) n-Propanol; (d) n-Butanol; Figure S5: Diameter distribution histograms of alumina nanorods prepared with different amine additives: (a) None; (b) Triethylamine; (c) Diethanolamine; (d) Triethanolamine; Figure S6: (a) HRTEM images of γ-Al2O3 nanorods; (b) EDX images of O and Al; Figure S7: XRD of samples before and after grinding prepared under optimal conditions (100 °C, 48 h, and Urea/Al = 9 and Diethanolamine/Al molar ratio of 1:1); Figure S8: SEM of samples before and after grinding prepared under optimal conditions (100 °C, 48 h, and Urea/Al = 9 and Diethanolamine/Al molar ratio of 1:1); Table S1: Structural parameters of samples prepared at different hydrothermal times; Table S2. Structural parameters of samples prepared at different hydrothermal temperature; Table S3. Structural parameters of samples prepared with different urea addition amounts; Table S4. Structural parameters of samples prepared with different alcohol additives; Table S5. Structural parameters of samples prepared with different amine additive; Table S6. Comparison of synthesis methods and key properties of alumina nanorods.

Author Contributions

J.Y. designed and executed the complete experimental program. X.Z. performed all DFT calculations (adsorption-energy evaluations, surface-model construction and optimization) and prepared the corresponding figures, integrated theoretical results into the manuscript, and led the overall writing of the paper. K.L. supervised the project, administered the funding, and monitored progress to ensure deliverables were met. Y.L. conceived the research concept, provided strategic guidance, and critically reviewed the manuscript for scientific content and final submission. All authors have read and agreed to the published version of the manuscript.

Funding

Thanks to the financial support brought by the open fund project of the National Research Center for Refining Technology and Catalyst Engineering (Sinopec Research Institute) (No.: 33600000-23-FW2313-0001).

Data Availability Statement

The data presented in this study are available upon request from the corresponding author.

Acknowledgments

This work was supported by the Open Fund Project of National Engineering Research Center for Refining Technology and Catalysts (Sinopec Research Institute of Petrochemicals Co., Ltd.) (No. 33600000-23-FW2313-0001), and the State Key Laboratory of Heavy Oil Processing, China University of Petroleum.

Conflicts of Interest

Author Kangyu Liu was employed by the company SINOPEC Research Institute of Petroleum Processing Co., Ltd. The remaining authors declare that the research was conducted in the absence of any commercial or financial relationships that could be construed as a potential conflict of interest.

References

  1. Levin, I.; Brandon, D. Metastable Alumina Polymorphs: Crystal Structures and Transition Sequences. J. Am. Ceram. Soc. 1998, 81, 1995–2012. [Google Scholar] [CrossRef]
  2. Materna, K.L.; Grant, S.M.; Jaroniec, M. Poly(ethylene oxide)–Poly(butylene oxide)–Poly(ethylene oxide)-Templated Synthesis of Mesoporous Alumina: Effect of Triblock Copolymer and Acid Concentration. ACS Appl. Mater. Interfaces 2012, 4, 3738–3744. [Google Scholar] [CrossRef]
  3. Díaz de León, J.N.; Petranovskii, V.; de los Reyes, J.A.; Alonso-Nuñez, G.; Zepeda, T.A.; Fuentes, S.; García-Fierro, J.L. One dimensional (1D) γ-alumina nanorod linked networks: Synthesis, characterization and application. Appl. Catal. A Gen. 2014, 472, 1–10. [Google Scholar] [CrossRef]
  4. Choi, S.; Kang, Y.; Kim, S. Effect of γ-alumina nanorods on CO hydrogenation to higher alcohols over lithium-promoted CuZn-based catalysts. Appl. Catal. A Gen. 2018, 549, 188–196. [Google Scholar] [CrossRef]
  5. Selim, M.S.; El-Safty, S.A.; Fatthallah, N.A.; Shenashen, M.A. Silicone/graphene oxide sheet-alumina nanorod ternary composite for superhydrophobic antifouling coating. Prog. Org. Coat. 2018, 121, 160–172. [Google Scholar] [CrossRef]
  6. Shen, L.; Wang, Y.; Du, J.-H.; Chen, K.; Lin, Z.; Wen, Y.; Hung, I.; Gan, Z.; Peng, L. Probing Interactions of γ-Alumina with Water via Multinuclear Solid-State NMR Spectroscopy. ChemCatChem 2020, 12, 1569–1574. [Google Scholar] [CrossRef] [PubMed]
  7. Li, X.; Hufnagel, S.; Xu, H.; Valdes, S.A.; Thakkar, S.G.; Cui, Z.; Celio, H. Aluminum (Oxy)Hydroxide Nanosticks Synthesized in Bicontinuous Reverse Microemulsion Have Potent Vaccine Adjuvant Activity. ACS Appl. Mater. Interfaces 2017, 9, 22893–22901. [Google Scholar] [CrossRef]
  8. He, F.; Li, W.; Pang, T.; Zhou, L.; Wang, C.; Liu, H.; Li, M.; He, X. Hydrothermal synthesis of boehmite nanorods from alumina sols. Ceram. Int. 2022, 48, 18035–18047. [Google Scholar] [CrossRef]
  9. Keshavarz, A.R.; Rezaei, M.; Yaripour, F. Nanocrystalline gamma-alumina: A highly active catalyst for dimethyl ether synthesis. Powder Technol. 2010, 199, 176–179. [Google Scholar] [CrossRef]
  10. Zhang, J.; Wei, S.; Lin, J.; Luo, J.; Liu, S.; Song, H.; Elawad, E.; Ding, X.; Gao, J.; Qi, S.; et al. Template-Free Preparation of Bunches of Aligned Boehmite Nanowires. J. Phys. Chem. B 2006, 110, 21680–21683. [Google Scholar] [CrossRef]
  11. Suchanek, W.L.; Garcés, J.M.; Fulvio, P.F.; Jaroniec, M. Hydrothermal Synthesis and Surface Characteristics of Novel Alpha Alumina Nanosheets with Controlled Chemical Composition. Chem. Mater. 2010, 22, 6564–6574. [Google Scholar] [CrossRef]
  12. Hu, X.-Y.; Liu, Q.-Y.; Jing, M.-X.; Chen, F.; Ju, B.-W.; Tu, F.-Y.; Shen, X.-Q.; Qin, S.-B. Controllable preparation of alumina nanorods with improved solid electrolyte electrochemical performance. Ceram. Int. 2020, 46, 16224–16234. [Google Scholar] [CrossRef]
  13. Ghosh, S.; Naskar, M.K. Solvothermal Conversion of Nanofiber to Nanorod-Like Mesoporous γ-Al2O3 Powders, and Study Their Adsorption Efficiency for Congo Red. J. Am. Ceram. Soc. 2013, 96, 1698–1701. [Google Scholar] [CrossRef]
  14. Dabbagh, H.A.; Mozaffari Majd, M.; Bahrami, F.; Gholami, A. Effect of vitamin C template on morphology and structure of alumina: Emerging application in enantiomer separation. Chem. Pap. 2019, 73, 1931–1943. [Google Scholar] [CrossRef]
  15. Salem, K.S.; Kasera, N.K.; Rahman, M.A.; Jameel, H.; Habibi, Y.; Eichhorn, S.J.; French, A.D.; Pal, L.; Lucia, L.A. Comparison and assessment of methods for cellulose crystallinity determination. Chem. Soc. Rev. 2023, 52, 6417–6446. [Google Scholar] [CrossRef] [PubMed]
  16. Cai, W.; Hu, Y.; Chen, J.; Zhang, G.; Xia, T. Synthesis of nanorod-like mesoporous γ-Al2O3 with enhanced affinity towards Congo red removal: Effects of anions and structure-directing agents. Cryst. Eng. Comm. 2012, 14, 972–977. [Google Scholar] [CrossRef]
  17. Dewangan, N.; Ashok, J.; Sethia, M.; Das, S.; Pati, S.; Kus, H.; Kawi, S. Cobalt-Based Catalyst Supported on Different Morphologies of Alumina for Non-oxidative Propane Dehydrogenation: Effect of Metal Support Interaction and Lewis Acidic Sites. ChemCatChem 2019, 11, 4923–4934. [Google Scholar] [CrossRef]
  18. Feng, R.; Hu, X.; Yan, X.; Yan, Z.; Rood, M.J. A high surface area mesoporous γ-Al2O3 with tailoring texture by glucose template for ethanol dehydration to ethylene. Microporous Mesoporous Mater. 2017, 241, 89–97. [Google Scholar] [CrossRef]
  19. Rodriguez-Olguin, M.A.; Atia, H.; Bosco, M.; Aguirre, A.; Eckelt, R.; Asuquo, E.D.; Vandichel, M.; Gardeniers, J.G.E.; Susarrey-Arce, A. Al2O3 nanofibers prepared from aluminum Di(sec-butoxide)acetoacetic ester chelate exhibits high surface area and acidity. J. Catal. 2022, 405, 520–533. [Google Scholar] [CrossRef]
  20. Selim, M.S.; Mo, P.J.; Zhang, Y.P.; Hao, Z.; Wen, H. Controlled-surfactant-directed solvothermal synthesis of γ-Al2O3 nanorods through a boehmite precursor route. Ceram. Int. 2020, 46, 9289–9296. [Google Scholar] [CrossRef]
  21. Zhang, X.-Q.; Guo, Y.; Li, W.-C. Efficient removal of hexavalent chromium by high surface area Al2O3 rods. RSC Adv. 2015, 5, 25896–25903. [Google Scholar] [CrossRef]
  22. Meephoka, C.; Chaisuk, C.; Samparnpiboon, P.; Praserthdam, P. Effect of phase composition between nano γ- and χ-Al2O3 on Pt/Al2O3 catalyst in CO oxidation. Catal. Commun. 2008, 9, 546–550. [Google Scholar] [CrossRef]
  23. Qu, N.S.; Chan, K.C.; Zhu, D. Pulse co-electrodeposition of nano Al2O3 whiskers nickel composite coating. Scr. Mater. 2004, 50, 1131–1134. [Google Scholar] [CrossRef]
Figure 1. SEM images of samples prepared at different hydrothermal times: (a) 8 h; (b) 16 h; (c) 32 h; (d) 48 h.
Micro 06 00017 g001
Figure 2. XRD patterns of samples prepared at different hydrothermal times. Black: 8 h; Green: 16 h; Blue: 32 h; Red: 48 h.
Micro 06 00017 g002
Figure 3. SEM images of samples prepared at different hydrothermal temperatures: (a) 80 °C; (b) 100 °C; (c) 120 °C; (d) 140 °C.
Micro 06 00017 g003
Figure 4. XRD patterns of samples prepared at different hydrothermal temperatures. Black: 80 °C; Red: 100 °C; Blue: 120 °C; Green: 140 °C.
Micro 06 00017 g004
Figure 5. SEM images of samples prepared with different urea addition amounts: (a) Urea/Al = 3; (b) Urea/Al = 6; (c) Urea/Al = 9; (d) Urea/Al = 12.
Micro 06 00017 g005
Figure 6. XRD patterns of samples prepared with different urea addition amounts. Black: Urea/Al = 3; Blue: Urea/Al = 6; Red: Urea/Al = 9; Green: Urea/Al = 12.
Micro 06 00017 g006
Figure 7. SEM images of samples prepared with different alcohol additives: (a) methanol; (b) ethanol; (c) n-propanol; (d) n-butanol.
Micro 06 00017 g007
Figure 8. XRD patterns of samples prepared with different alcohol additives. Black: without alcohol additive; Red: methanol; Blue: ethanol; Green: n-propanol; Purple: n-butanol.
Micro 06 00017 g008
Figure 9. SEM images of samples prepared with different amine additives: (a) triethylamine; (b) diethanolamine; (c) triethanolamine.
Micro 06 00017 g009
Figure 10. XRD patterns of samples prepared with different amine additives. Black: without amine additive; Blue: triethylamine; Red: diethanolamine; Green: triethanolamine.
Micro 06 00017 g010
Figure 11. γ-Al2O3 400 crystal plane adsorption’s unit cell model of (a) methanol; (b) ethanol; (c) n-propanol; (d) n-butanol; (e) diethanolamine; (f) triethanolamine; (g) triethylamine. Blue: aluminum; Cyan: nitrogen; Red: oxygen; Brown: carbon; Pink: hydrogen.
Micro 06 00017 g011
Figure 12. Relationship between adsorption energy and (a) crystallinity, (b) specific surface area and (c) aspect ratio of alumina nanorods.
Micro 06 00017 g012
Table 1. Specific surface area and pore volume of samples prepared at different hydrothermal times.
SampleSpecific Surface Area (m2/g)Pore Volume (cm3/g)
Al2O3-8200.05
Al2O3-161440.15
Al2O3-321960.37
Al2O3-482200.33
Table 2. Specific surface area and pore volume of samples prepared at different hydrothermal temperatures.
SampleSpecific Surface Area (m2/g)Pore Volume (cm3/g)
Al2O3-48-801820.20
Al2O3-48-1002200.33
Al2O3-48-1201910.38
Al2O3-48-1402210.42
Table 3. Specific surface area and pore volume of samples prepared at different urea addition amounts.
Urea/Al Molar RatioSpecific Surface Area (m2/g)Pore Volume (cm3/g)
31380.15
62080.26
92200.33
122180.32
Table 4. Specific surface area and pore volume of samples prepared with different alcohol additives.
SDASpecific Surface Area (m2/g)Pore Volume (cm3/g)
Methanol1940.31
Ethanol1880.30
n-Propanol1950.29
n-Butanol2080.32
None2200.33
Table 5. Specific surface area and pore volume of samples prepared with different amine additives.
SDASpecific Surface Area (m2/g)Pore Volume (cm3/g)
Triethylamine2500.41
Diethanolamine2600.43
Triethanolamine2170.37
None2200.33
Disclaimer/Publisher’s Note: The statements, opinions and data contained in all publications are solely those of the individual author(s) and contributor(s) and not of MDPI and/or the editor(s). MDPI and/or the editor(s) disclaim responsibility for any injury to people or property resulting from any ideas, methods, instructions or products referred to in the content.