1. Introduction
The São Paulo Metropolitan Region (RMSP, from Portuguese
Região Metropolitana de São Paulo) is one of the most densely populated areas in the world, with approximately 21 million people and comprising 39 municipalities [
1]. This region faces significant challenges related to urban mobility and environmental sustainability [
2,
3,
4]. The São Paulo subway system, as a pivotal element of the city’s public transportation network, plays a crucial role in addressing these challenges [
5]. Established in 1974, this rapid transit system has since expanded to become one of the largest and most efficient metro systems in Latin America, with a total distance of 104.4 km and serving over 5 million passengers daily across 91 stations [
6]. With its extensive network of lines and stations, the metro connects key areas of the metropolis, providing a vital service for the daily commute of its residents.
Beyond the benefits related to urban mobility, the use of the subway in São Paulo also brings significant environmental and economic advantages [
7,
8,
9]. By providing a reliable alternative to private car usage, this mode of transportation helps reduce traffic congestion, leading to lower greenhouse gas emissions, reduced air pollution, and consequently, improved air quality [
7,
10,
11,
12,
13]. Public transportation systems like the São Paulo metro are critical in promoting sustainable urban development, aligning with global efforts to mitigate climate change and enhance the livability of cities [
2,
9,
14]. Furthermore, the metro supports the reduction in noise pollution in cities and promotes a more efficient use of urban space [
4,
15,
16], encouraging a shift towards more sustainable and eco-friendly modes of transport. This approach not only benefits the environment but also enhances the quality of life for residents [
10,
17,
18,
19], making the city a more attractive and healthier place to live.
However, the subway system of São Paulo itself is far from covering the entire urban area of RMSP and only operates within the limits of the city of São Paulo [
6]. Consequently, as many users are from the metropolitan region and not necessarily from the city of São Paulo, numerous users face significant challenges in accessing this public transportation system [
8,
20,
21]. Moreover, the peripheral areas of the city often suffer from inadequate infrastructure and lower service frequencies, further complicating access to the subway for residents in these regions [
22]. The spatial disparity in metro access underscores the need for integrated and inclusive transportation planning that addresses the mobility needs of all citizens, particularly those in underserved areas. Additionally, previous investigations on the subway system of São Paulo often focus on the entire population [
21,
23], which can lead to different findings when considering those who use this public transportation consistently and frequently, such as people going to work or study. Thus, the specific contribution of this study is to evaluate socioeconomic and travel variables among regular metro users, focusing on a group with more consistent commuting patterns.
An important source of data for understanding the dynamics of subway use in the RMSP is the Origin–Destination Survey [
24]. Conducted every 10 years since 1967 by the São Paulo Metro Company (Companhia do Metropolitano de São Paulo—METRÔ), this survey investigates the daily travel patterns of people in the region, with the most recent survey conducted in 2017 [
25]. The survey consists of two main parts: the Household Survey, which investigates internal travels within the RMSP, and the Boundary Line Survey, which examines external travels that originate or end outside the study area or simply pass through it [
26].
In its most recent edition, the Origin–Destination Survey gathered data from approximately 150,000 individuals across about 32,000 households [
26]. The 2017 survey, with results published in July 2019, collected detailed information on a variety of socioeconomic variables, including household income, age, gender, education level, place of residence, and travel purpose. Additionally, it gathered data on travel-specific variables such as travel time, travel origins, and travel destinations. Thus, with the use of the database obtained through this survey, it is possible to derive valuable information about the travel behaviors and patterns of the RMSP residents, allowing for a deeper understanding of how socioeconomic factors are associated with mobility characteristics among subway system users in this region.
In this context, it is evident that the subway has a significant impact on the lives of RMSP residents. However, many users face significant challenges in accessing this public transportation and do not have the privilege of living near areas covered by São Paulo’s subway infrastructure, necessitating a deeper exploration of these disparities. Therefore, our study leverages data from the 2017 Origin–Destination Survey to investigate associations between socioeconomic and travel variables among RMSP residents who use the São Paulo subway system for work or study purposes. To accomplish this, we employed a comprehensive set of analyses, including Pearson correlation analysis, factor analysis of mixed data (FAMD), and multiple linear regression. Through this approach, we expect to uncover correlations, trends, and patterns that can inform strategies to enhance public transportation and promote sustainable urban development in the RMSP.
2. Materials and Methods
2.1. Data Source and Selection of Variables
The primary dataset for this study is derived from the microdata of the 2017 Origin–Destination Survey conducted by the São Paulo Metro Company in the RMSP [
25]. This comprehensive survey collected detailed travel information from 157,993 participants across the region, with a margin of error below 6% and a confidence level of 92%.
For the purposes of this study, we focused on a specific subset of the dataset. The first criterion for the selection of the data was to include only travels made for work or study purposes, as travels for other reasons (such as leisure or shopping) do not have a consistent frequency. The second criterion was to only consider travels that included using the metro, allowing us to concentrate on and analyze relations specific to this mode of transportation. After applying these criteria, the resulting analytical sample included 10,522 respondents. Therefore, all analyses presented in this study were based on this subset. No additional subsampling procedure was performed.
The full Origin–Destination Survey dataset contains 119 variables for each trip. From these, 43 variables were identified as potentially relevant for our research. Additionally, three more variables were calculated: total travel distance, distance from the origin to the nearest metro station, and distance from the destination to the nearest metro station. These distances were calculated by our research group in kilometers using the coordinates provided in the microdata and processed with QGIS software version 3.30. These distance-based variables were used to represent the spatial dimension of metro accessibility at the travel level, focusing on travel distance and proximity to metro stations rather than on municipal-level or cartographic spatial patterns.
Despite the potential to analyze 46 variables (43 original plus 3 estimated), a pre-selection process was performed to identify the most pertinent variables, as some exhibited redundancy and encompassed information from other variables. One such variable is the Brazilian Economic Classification Criteria (Brazilian Criteria), a system used in Brazil to segment the population into different economic classes [
27]. This criterion, developed by the Brazilian Association of Research Companies (ABEP), considers the ownership of durable goods in the house (such as rooms, bathrooms, appliances, and computers, among others), the educational level of the household head, and access to certain services. It is widely used in market research and social studies to define the economic profile of families in Brazil, classifying them into categories A, B1, B2, C1, C2, and DE. Given that this criterion undergoes annual updates, for this study, the 2017 version was used to ensure it reflects the reality of the respondent population during that period [
27].
Thus, for the analyses, thirteen variables were selected and divided into two main groups: socioeconomic variables from the traveler and travel variables. The socioeconomic variables included the Brazilian Criteria, monthly household income, age, gender, current student status, education level, employment status, and number of vehicles owned. The travel variables included the distance between origin and destination, distance from the origin to the nearest metro station, distance from the destination to the nearest metro station, travel duration (minutes), and whether other modes of transportation besides the metro are used.
2.2. Data Analysis
For this investigation, FAMD was employed to summarize the structure of socioeconomic and travel variables among users of the metro as a mode of transport for work and/or study travels in the RMSP. FAMD was selected because the dataset includes variables with different measurement scales, including quantitative and categorical variables. In this approach, Brazilian Criteria score, household income, age, number of vehicles, travel distances, and travel duration were treated as quantitative variables, while gender, study status, education level, employment status, and use of other modes of transportation were treated as categorical variables.
FAMD is a multivariate exploratory method designed for datasets containing both quantitative and categorical variables [
28]. It can be understood as an extension of factorial methods that combines the logic of Principal Component Analysis (PCA), which is suitable for quantitative variables, and Multiple Correspondence Analysis (MCA), which is suitable for categorical variables, allowing both types of variables to be analyzed within the same factorial space [
28]. In this procedure, quantitative variables are standardized, while categorical variables are transformed into a disjunctive table and scaled to balance the influence of quantitative and categorical variables in the analysis [
28]. This analysis performs a decomposition of a set of correlated variables into a set of uncorrelated variables, denoted as dimensions, which are organized by descending order of variance. This method is particularly useful for dimensionality reduction, as it allows for the elimination of dimensions that are less important (less variance) than the original data. The dimensions that remain are useful to develop new models, and their loadings can be used to calculate the contribution of each factor in the collected data.
In our approach, the eigenvalues and the percentage of variance explained by each FAMD dimension were calculated to evaluate how the total variability of the mixed dataset was distributed across dimensions. Only dimensions with eigenvalues greater than 1 were retained for interpretation, ensuring that the selected dimensions are more important than the original variables. The cumulative variance was also estimated to assess the proportion of the dataset structure explained by the retained dimensions. The importance of each variable in the selected FAMD dimensions was determined by its absolute correlation with the generated dimension. For our analysis, only variables with an absolute correlation greater than 0.15 with each retained FAMD dimension were considered important factors. This criterion was adopted considering the exploratory nature of the analysis, the number of variables included, and the large analytical sample of 10,522 respondents. The approach is similar to the approach used by Martins et al. [
29] for PCA, who applied this analysis in the medical field to identify recurrent venous thromboembolism; however, in the present study, it was applied within a FAMD framework because of the mixed nature of the variables included in the analysis.
Additionally, Pearson correlation analysis was conducted between all study variables. Multiple linear regression analyses were also performed between socioeconomic variables and travel variables. Because this statistical approach is more appropriate for numerical or ordinal predictors, categorical variables without a clear quantitative structure were not included in the multiple linear regression models. This decision was adopted to avoid treating nominal categories as continuous predictors and to keep the regression analyses restricted to socioeconomic gradients that could be meaningfully interpreted. Thus, this analysis investigated the socioeconomic variables of Brazilian Criteria, monthly household income, age, and the number of vehicles. The travel variables analyzed included the distance from the origin to the nearest metro station, the distance from the destination to the nearest metro station, and travel duration. In these analyses, the socioeconomic variables were treated as independent variables, while the travel variables were the dependent variables.
Pearson correlation and multiple linear regression analyses were performed using STATISTICA 12.0, while FAMD was performed using Python 3.14.5 with the Prince library. All data analyses were considered statistically significant when p < 0.05. Data processing was performed using Microsoft Excel spreadsheets.
3. Results
3.1. Prevalence of Socioeconomic Variables and Distribution of Travel Variables
The analysis of the socioeconomic characteristics of the 10,522 respondents reveals significant information about the composition of metro users in the RMSP (
Table 1). The majority of respondents fall within the B2 and C1 economic classes, collectively accounting for 58.68%. The higher economic classes A and B1 make up 27.53% of the respondents, while the lower classes C2 and DE constitute 13.79%. A substantial proportion of respondents reported household incomes between 2 and 4 minimum wages (MW) and 4 and 8 MW, together representing 71.39%. Higher income categories of 8 to 12 MW and above 12 MW comprise 19.89% of the respondents, while the lower income category of up to 2 MW accounts for only 8.72%.
Due to this study criterion, the age distribution is predominantly skewed towards younger adults and adults, with 32.10% of respondents aged 20–29, followed by 39.24% aged 30–49. Adolescents account for 9.99% of the sample, while older age groups, including those aged between 50 and 69, represent 17.56% of the sample. Children under 10 years and those above 70 years are minimally represented. Additionally, the use of the metro in the sample is relatively balanced in terms of gender.
A significant majority, 69.54%, are not currently studying but are either working or seeking employment. Among those who are studying, 78.91% are in higher education. In terms of education level, the majority of respondents have completed secondary education, while a substantial portion have completed higher education. The two lower education levels are less represented in the sample, accounting for only 6.99%. Moreover, the vast majority of respondents have regular jobs, followed by those who only study. Lastly, vehicle ownership among respondents indicates that the majority own one vehicle, closely followed by those who do not own any vehicles.
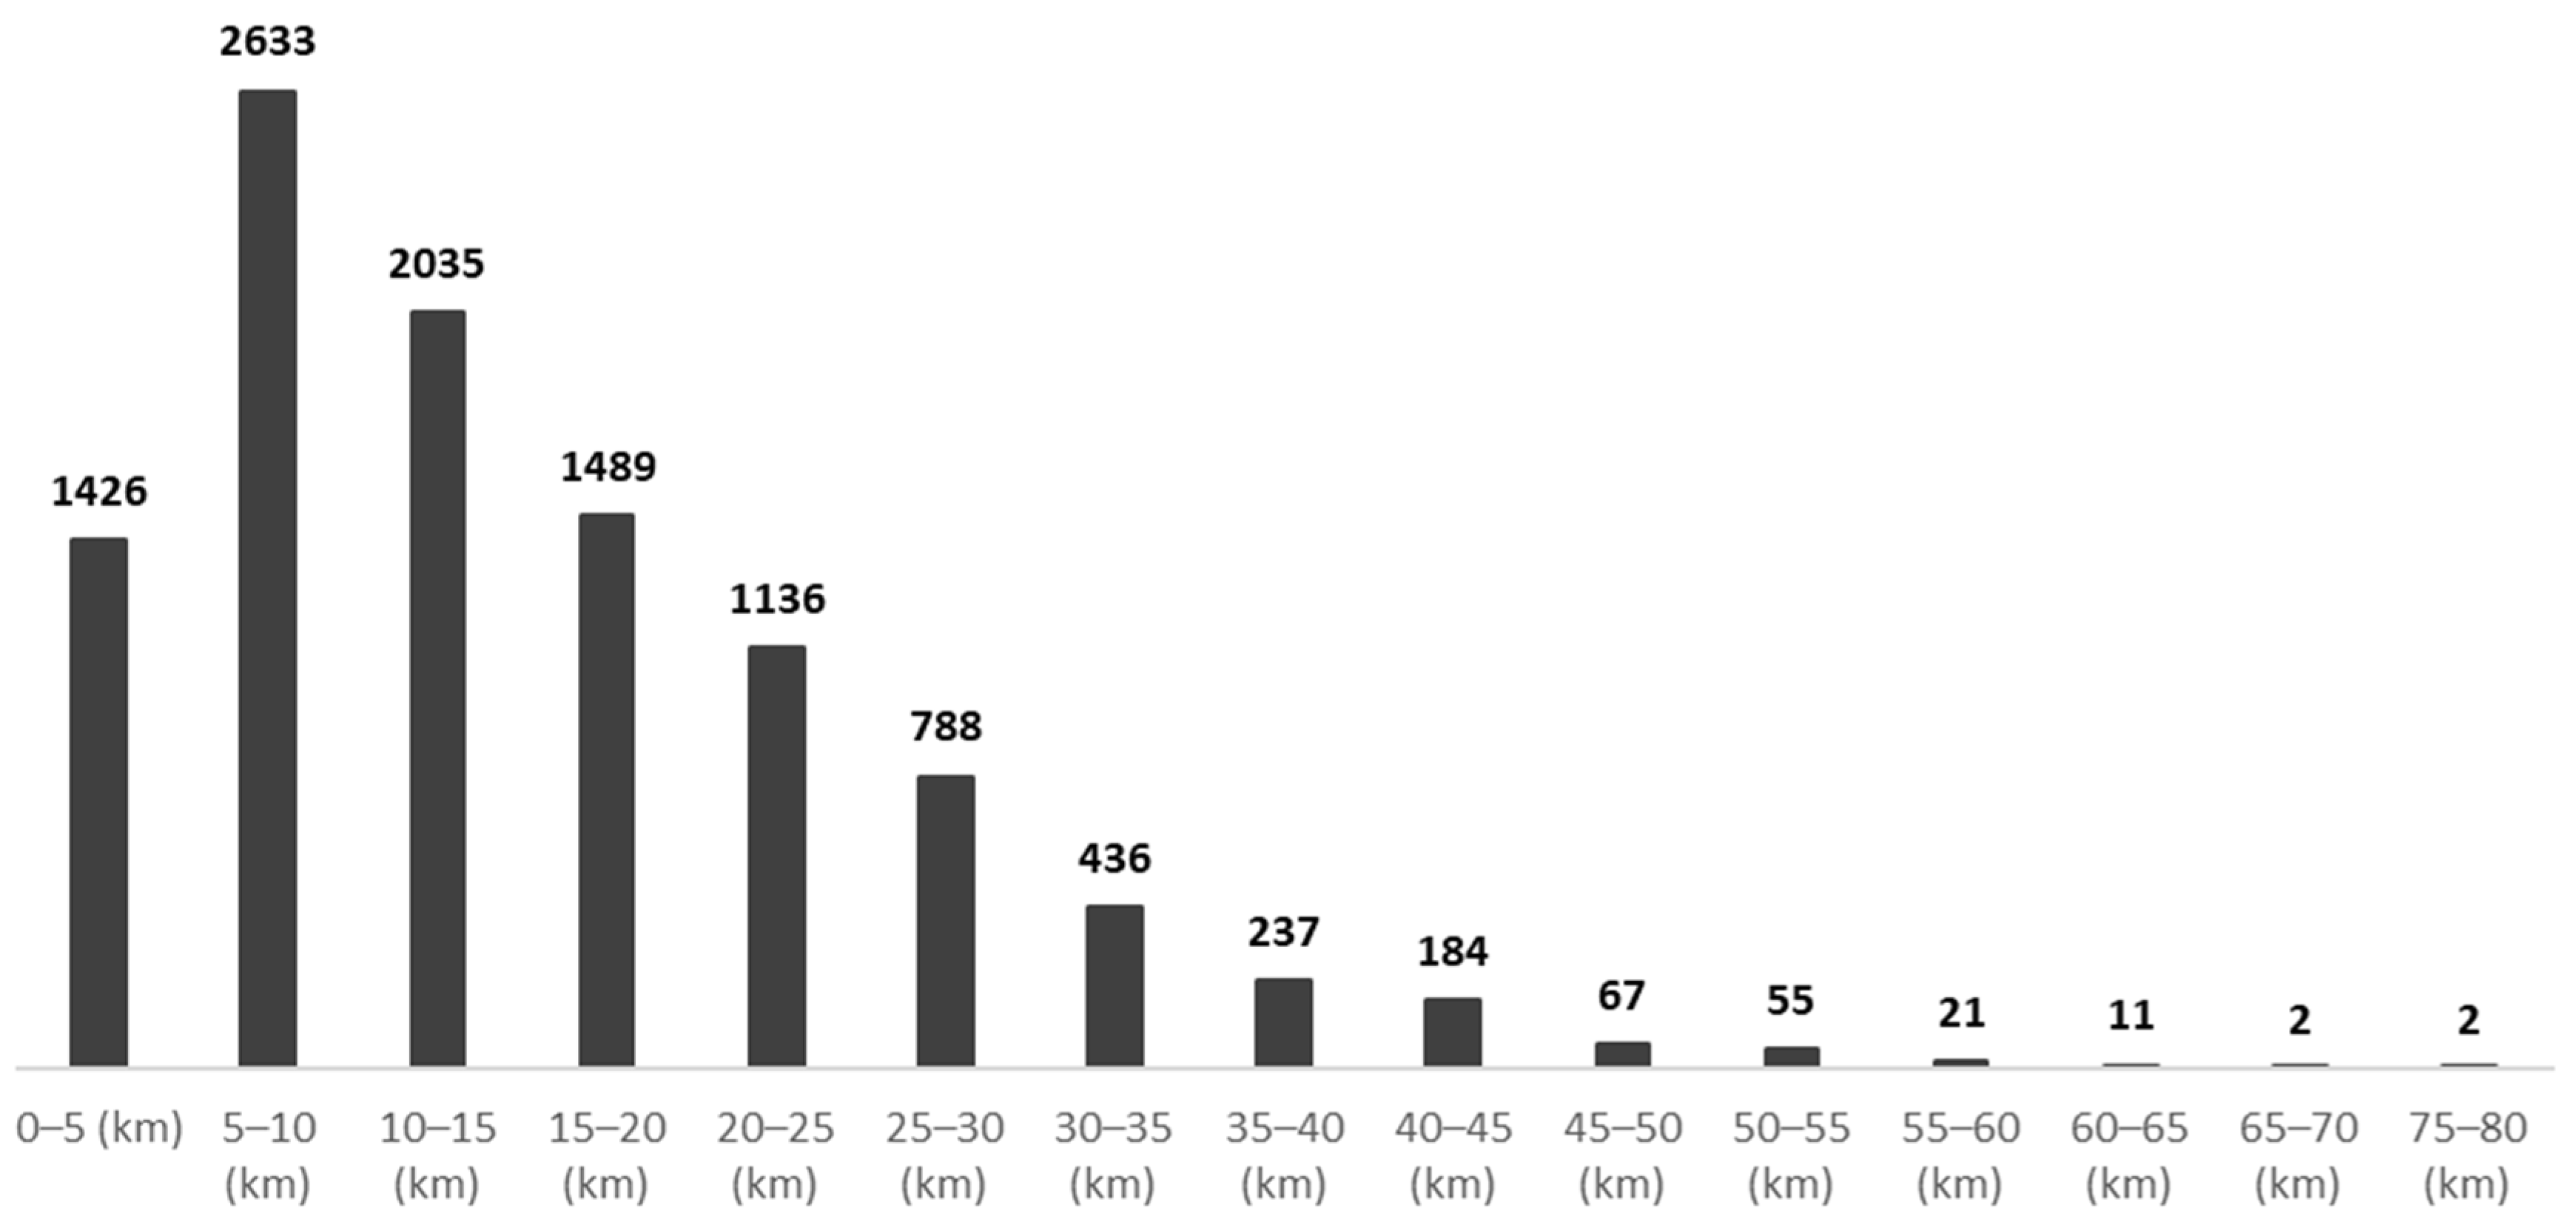
Regarding the travel variables, the distribution of distances between the origin and destination is presented in
Figure 1. It can be observed that the highest concentration of travel falls within distances of up to 20 km, with the majority of users traveling between 5 and 10 km within the RMSP. Additionally, the average distance traveled by the users was 15.35 km. The average travel time for São Paulo metro users is 74 min.
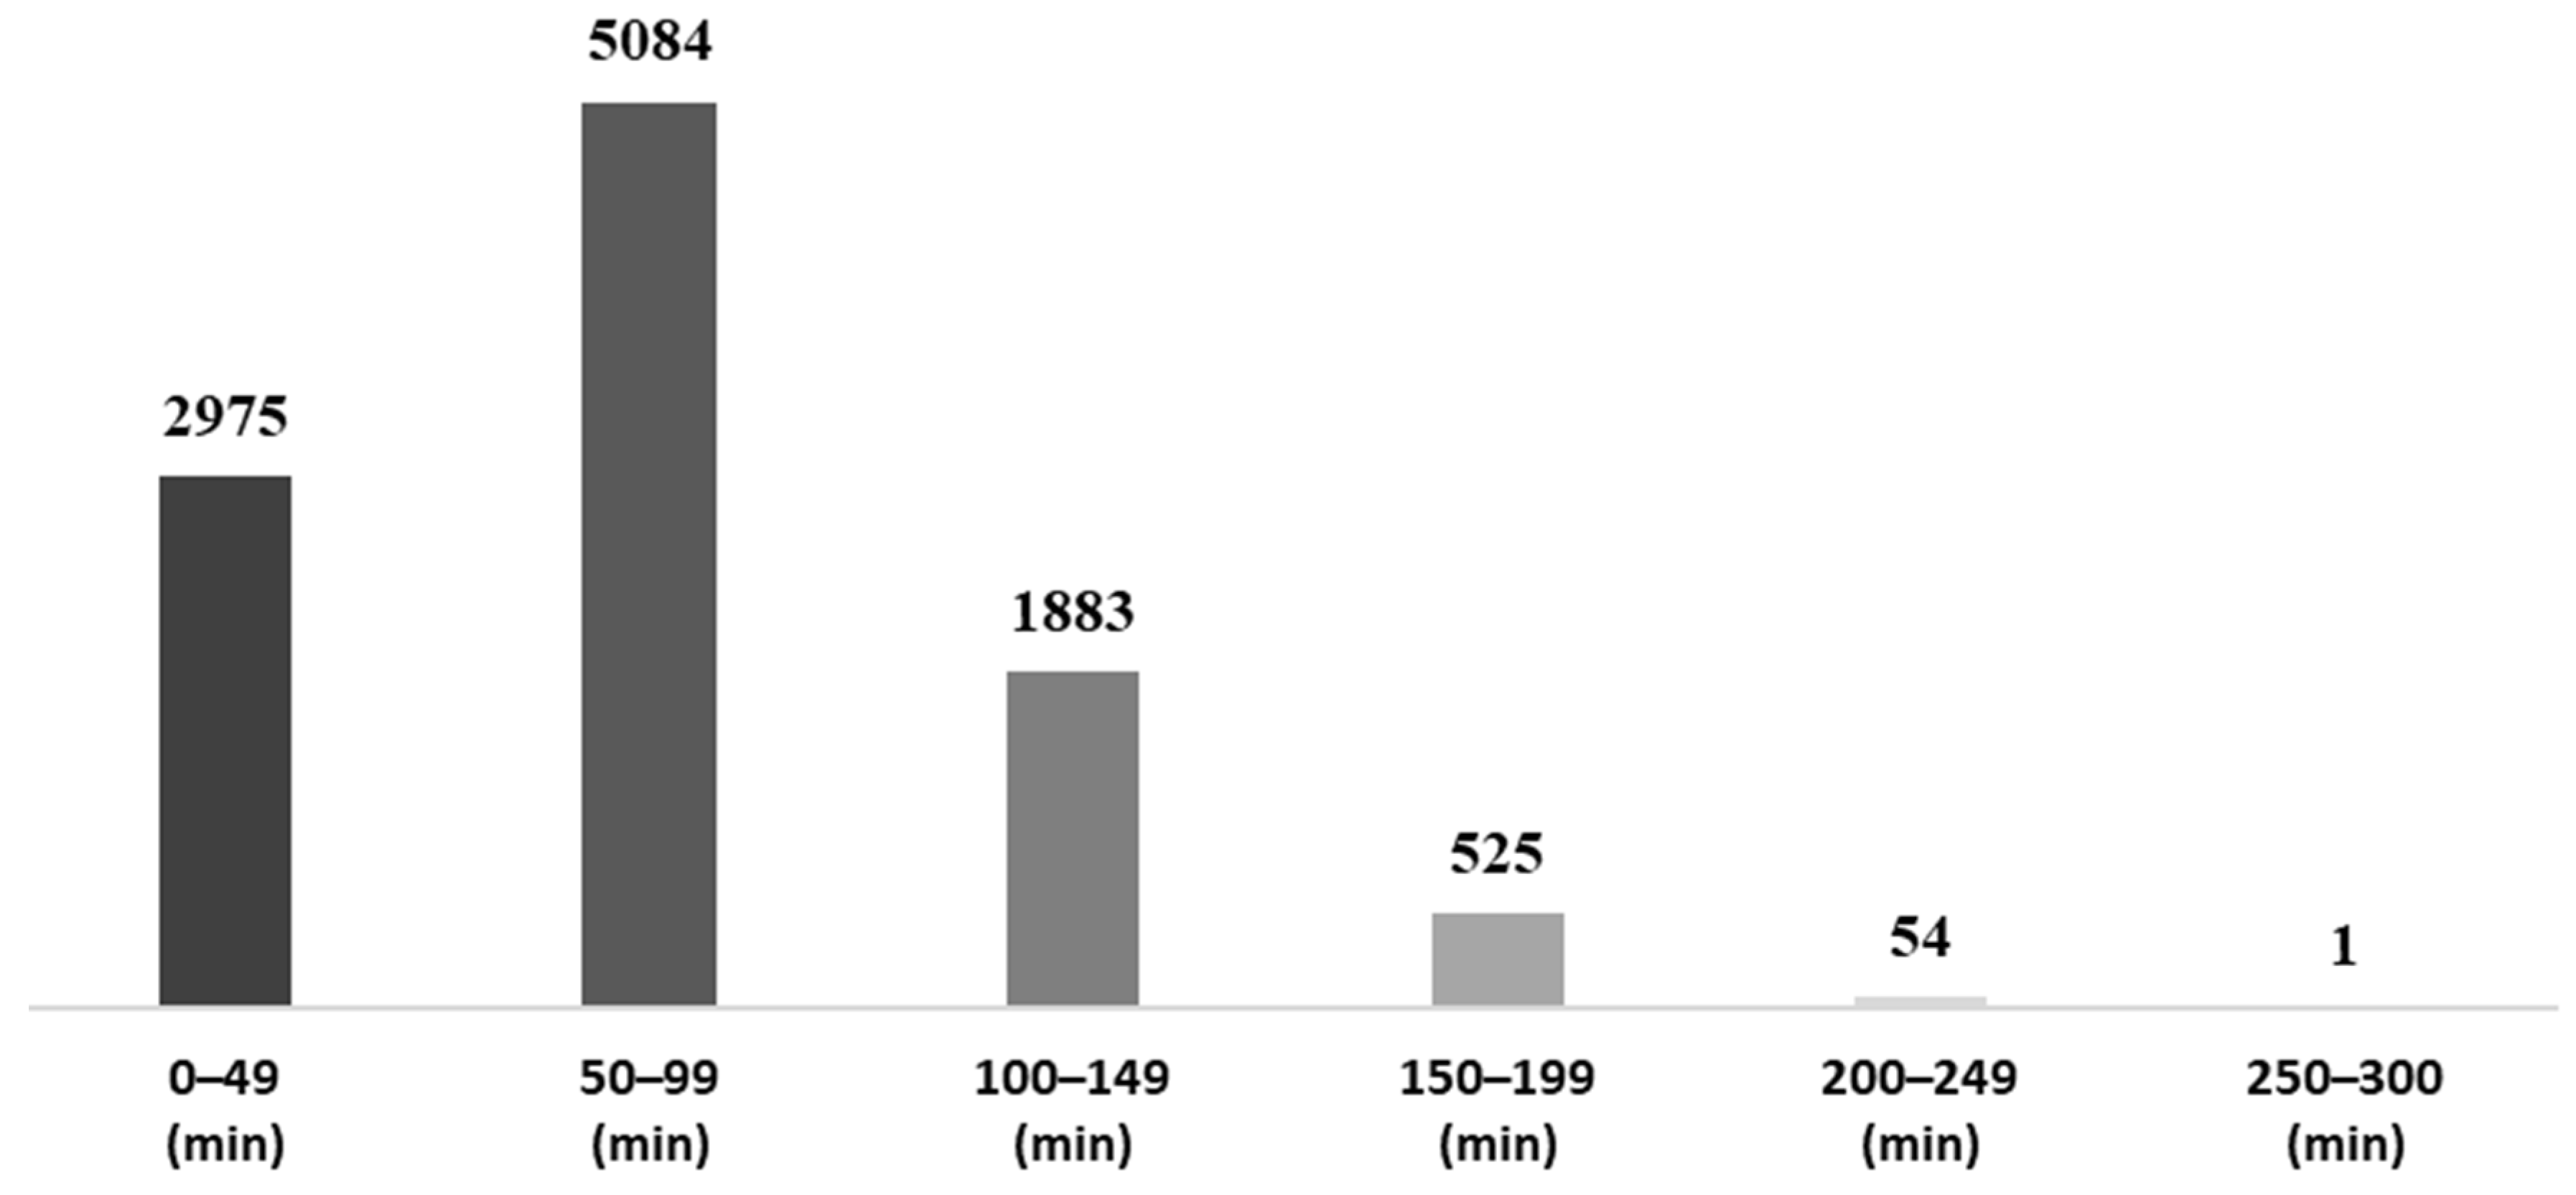
Figure 2 shows the distribution of the duration of travel. It is possible to observe that the highest concentration of travel is within the range of 50 to 99 min, followed by trips lasting from 0 to 49 min. Aligning the observations from these two figures, it indicates that although the vast majority of trips are for distances of up to 20 km, they typically last up to 99 min. Furthermore, 72% of the people who traveled by metro under the conditions in this study also used other means of transportation (such as buses, bicycles, and cars, among others).
3.2. Pearson Correlation for the Socioeconomic and Travel Variables
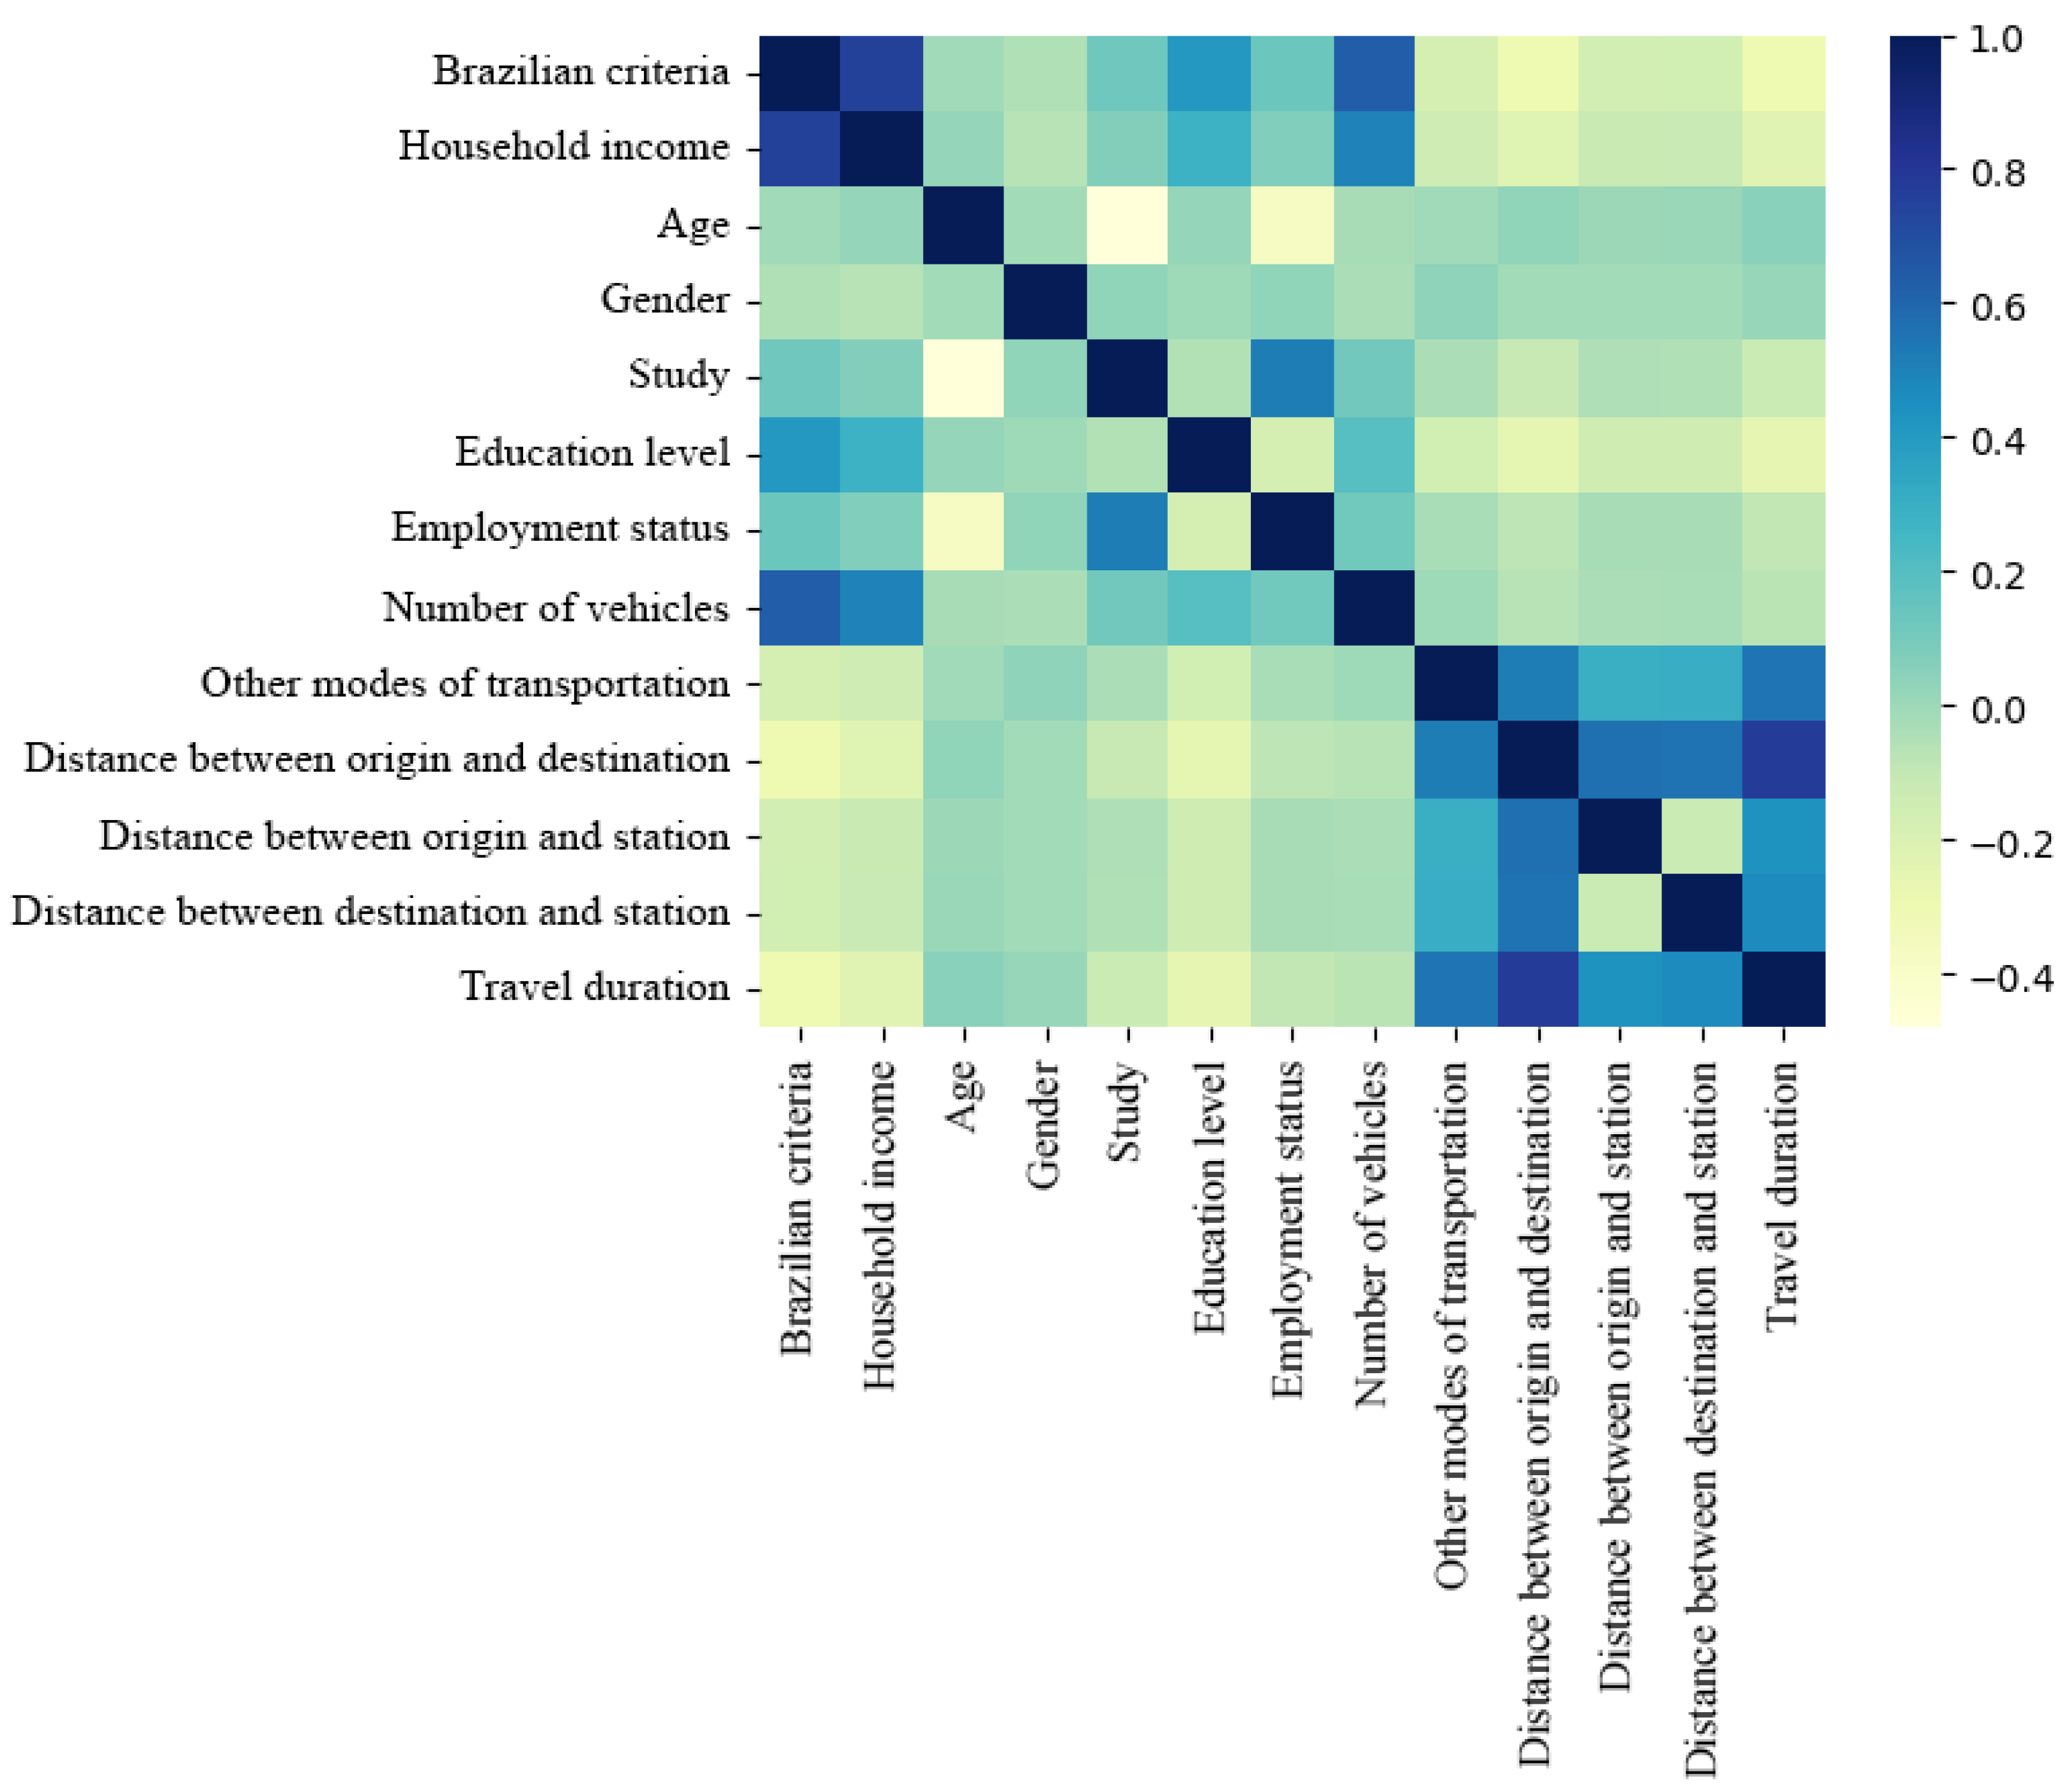
The Pearson correlation analysis reveals significant correlations between various socioeconomic variables and travel variables among the users of the São Paulo Metro (
Table 2). Additionally, a heatmap of the correlations is presented in
Figure 3. The analysis confirms expected relations between variables, showing a strong positive correlation between the Brazilian Criteria and household income, indicating that higher economic classification is associated with higher household income. Additionally, age presents a moderate negative correlation with studying status, suggesting that younger respondents are more likely to be studying.
Regarding the correlations between socioeconomic variables and travel variables, the Brazilian Criteria and household income exhibit negative correlations with all travel variables. This implies that lower economic classes tend to have longer travel distances and durations. Similarly, these two socioeconomic variables negatively correlate with the use of other modes of transportation, suggesting that lower economic classes are more likely to use additional transportation modes. Education level negatively correlates with all travel variables, indicating that lower education levels are usually associated with longer travel distances and durations. The number of vehicles also negatively correlates with travel duration, indicating that households with more vehicles tend to have shorter travel durations.
There are strong and moderate positive correlations among the travel variables themselves. Specifically, the distance between origin and destination is strongly correlated with travel duration and moderately correlated with the distance between origin and station and the distance between destination and station. This suggests that traveling longer distances to reach a metro station likely involves more travel time, and metro station accessibility also has a significant impact on overall travel time. Additionally, the use of other modes of transportation positively correlates with all travel variables, suggesting that individuals who need to cover greater distances are more likely to use multiple transportation modes. This is because longer distances often necessitate combining different types of transport to efficiently complete the journey.
3.3. Factor Analysis of Mixed Data (FAMD) for the Investigated Variables
The FAMD allowed for a cumulative variance assessment to understand the behavior of each dimension within the mixed dataset (
Table 3). The analysis shows that the dataset could be explained up to 72.95% by thirteen dimensions. This indicates that these dimensions captured most of the variability in the data, providing a robust summary of the original variables.
With the number of FAMD dimensions determined, it is possible to evaluate each dimension according to the variables with the highest absolute correlations.
Table 4 lists the weights of each variable for each dimension, highlighting those with a weight (absolute value) greater than 0.150. This analysis helps to identify the variables with the highest contribution within each dimension.
The FAMD reveals that both socioeconomic and travel variables play significant roles in explaining mobility characteristics among the evaluated metro users. The first dimension was associated with travel-related variables, specifically the distance between origin and destination and travel duration. This indicates that the first dimension reflects a general travel burden axis among metro users. The second and third dimensions presented similar patterns and were mainly associated with age, study status, employment status, and education level. Therefore, these dimensions appear to represent differences related to life stage and educational/occupational profile among regular metro users. The fourth dimension was again associated with travel characteristics, particularly the distance between origin and destination and the distance between destination and station, indicating an additional dimension related to spatial accessibility and travel distance.
From the fifth dimension onwards, the FAMD showed a stronger recurrence of socioeconomic and demographic variables. The fifth dimension was represented by the number of vehicles and employment status, while dimensions 6 to 13 repeatedly included the Brazilian Criteria score and age, and in some dimensions, the number of vehicles, education level, and travel duration. Although the individual variance explained by each of these latter dimensions was lower than that of the first dimensions, their repeated structure indicates that economic classification, age, and vehicle ownership remain relevant to the organization of mobility characteristics within the dataset. Thus, the FAMD captured three main groups of information: travel burden and spatial accessibility; life-stage and educational/occupational status; and socioeconomic position combined with age.
Therefore, we can identify that the main variables associated with mobility characteristics among metro users in the RMSP are the distance between origin and destination, along with the distances to the respective stations, travel duration, age, study status, employment status, education level, Brazilian Criteria score, and number of vehicles. In contrast, gender, household income, use of other modes of transportation, and distance between origin and station did not emerge among the variables with the highest contributions in the FAMD dimensions.
3.4. Multiple Linear Regression Between Socioeconomic and Travel Variables
The multiple linear regression analysis was conducted to further investigate the relations between quantitative socioeconomic and travel variables among São Paulo Metro users in the RMSP (
Table 5). The results show that the Brazilian Criteria presents a negative association with all travel variables, suggesting that individuals with lower economic classification commuted for longer travel distances and durations. Similarly, the number of vehicles owned also showed negative associations with all travel variables, indicating that households with fewer vehicles undertake longer trips.
Additionally, both household income and age presented weak associations with travel durations, but in opposite directions. Household income shows a negative association, whereas age shows a positive association. This indicates that older respondents tend to have longer travel distances and durations, whereas the association of household income is more pronounced with travel duration. Overall, the results from the multiple linear regression analysis reinforce and deepen the findings obtained in the previous analyses, highlighting the complex interplay between socioeconomic conditions and travel variables.
4. Discussion
It is well-established that the São Paulo subway system has a significant impact on the lives of over 5 million residents in the RMSP who use this public transportation system daily, serving as a crucial pillar of urban mobility in the region [
6]. This study, focusing on metro travels done for work and study purposes—travels that have a defined frequency—utilizes the extensive dataset from the 2017 Origin–Destination Survey.
This provides a comprehensive analysis of the relationship between socioeconomic variables and travel variables among metro users. Using Pearson correlation, the study delineated the relations between these variables, highlighting significant associations. FAMD was employed to summarize the structure of the mixed dataset and identify the main variables associated with mobility characteristics within this group, thereby simplifying the complexity of the data. Additionally, multiple linear regressions were conducted to further evaluate the association between quantitative socioeconomic variables and travel distances and durations, providing additional support for the observed patterns and relationships. The importance of this study lies in its specificity. Although previous studies have examined mobility indicators, accessibility, and transport inequalities in São Paulo and the RMSP [
21,
30], our analysis focuses specifically on regular metro users traveling for work or study purposes. This approach helps to understand the mobility characteristics of regular metro usage and contributes to a deeper understanding of urban mobility patterns, yielding significant findings.
First, through the use of multiple statistical approaches, our findings identified that both socioeconomic and travel variables are significantly associated with mobility characteristics among subway users in the RMSP. Among these, the main variables associated with mobility characteristics within this group were the distance between origin and destination, the distances to the respective stations, travel duration, age, study status, employment status, education level, Brazilian Criteria score, and number of vehicles. The FAMD further showed that these variables were organized into different dimensions. The first and fourth dimensions were mainly related to travel burden, represented by the distance between origin and destination, distance between destination and station, and travel duration, while the second and third dimensions were mainly associated with age, study status, employment status, and education level. From the fifth dimension onwards, socioeconomic and demographic variables became more recurrent, particularly the Brazilian Criteria score and age. Thus, the FAMD captured three main groups of information: travel burden and spatial accessibility; life-stage and educational/occupational profile; and life-stage and socioeconomic position. This highlights the multifaceted nature of subway commuting, which is not solely dependent on travel logistics but is deeply intertwined with socioeconomic circumstances.
In line with this multidimensional pattern, the socioeconomic composition of users who rely on this mode of transportation consistently and frequently includes individuals from various social classes, but there is a higher prevalence of middle and middle-lower economic classes. Correlation analyses demonstrated that lower economic classification (Brazilian Criteria) and lower household income were associated with longer travel distances and durations. These findings were also supported by the multiple linear regression analysis for travel distance and duration. In addition, the correlation analysis showed that these two socioeconomic variables are negatively associated with the use of other modes of transportation, suggesting that lower economic classes are more likely to use additional transportation modes to complete their travels. Furthermore, education level negatively correlates with all travel variables, indicating that individuals with lower education levels have longer travel distances and durations. Overall, our findings suggest that education and economic status are important variables associated with travel behavior, including how far individuals need to travel and the manner in which they reach their destinations.
Allied to this, the highest concentration of subway trips in the analyzed dataset falls within distances of up to 20 km, with most users traveling between 5 and 10 km. The average travel time, considering the entire journey from origin to destination, is 74 min. This represents a significant time investment for daily commuters, reflecting the extensive travel times that many residents endure, which can affect their overall quality of life and productivity [
31,
32]. On average, each individual spends 148 min per day traveling by subway, which amounts to approximately 2.5 h dedicated to transport. This represents a significant time investment for transportation purposes, resulting in the loss of valuable hours that could be allocated to other activities such as spending time with family, studying, practicing sports, or engaging in leisure activities. This substantial time lost in transportation constitutes an important opportunity cost, which can have ripple effects throughout the overall economic system.
Moreover, strong and moderate positive correlations were observed among the travel variables themselves, underscoring the significant impact of metro station accessibility on overall travel time and distances. These findings suggest that station accessibility is closely linked to reduced travel times, emphasizing the need for well-planned and accessible metro networks. It is important to note that the spatial dimension in this study was represented through distance-based accessibility measures derived from the OD data. Therefore, the findings capture spatial accessibility at the travel level, but they do not constitute a full spatial analysis of origin–destination flows.
In Latin America, the majority of individuals from lower economic classes live far from areas served by the subway, necessitating longer travel distances and durations [
33,
34,
35]. This spatial distribution highlights the socioeconomic divide in urban planning and access to services, where lower-income households are often situated in peripheral areas with longer commutes [
30,
35,
36]. Another significant factor influencing these findings is the distribution of metro stations and the accessibility of the metro system. Areas with dense metro coverage typically see shorter travel distances and durations due to the ease of access to metro stations. In contrast, individuals living in areas with sparse metro coverage may face longer distances to reach the nearest station, contributing to longer overall travel times [
30,
36]. This disparity underscores the need for expanded metro networks and improved first-mile/last-mile connectivity, particularly in underserved areas.
Our findings demonstrate the vulnerability of the population relying on this public service and the significant challenges they face in accessing this crucial transportation system in the RMSP. These findings are consistent with the principles, guidelines, and objectives of the National Urban Mobility Policy (Federal Law No. 12.587/2012), which emphasizes the need to “reduce inequalities and promote social inclusion” and “improve urban conditions for the population in terms of accessibility and mobility” [
37]. Moreover, our results align with previous studies that highlight the relationship between urban mobility conditions and social exclusion [
21,
36,
38], indicating that Brazilian cities are characterized by unequal access to transportation services [
39], which is further emphasized in São Paulo [
35]. In the RMSP, despite the critical role of public transportation in promoting social inclusion, inequalities in the distribution of rail transportation remain relevant [
21,
35,
36].
In this context, improved infrastructure, with expanded and better-distributed stations throughout the RMSP, may contribute to enhancing accessibility and promoting social inclusion in a metropolis like São Paulo, which continues to grow and serves as Brazil’s economic heart [
1]. Additionally, alongside the social benefits and urban mobility improvements, the expansion of this public transportation system may also bring environmental and economic advantages [
7,
8,
9]. By offering a reliable and efficient alternative to private vehicles, the metro system helps decrease traffic congestion and reduce air pollutants and greenhouse gas emissions [
10,
11,
12]. Recent studies indicate that the metro system helps eliminate millions of car trips annually, significantly cutting down on carbon dioxide emissions and other pollutants [
9,
14]. This reduction in traffic not only lowers the environmental footprint of urban transportation but also contributes to improved air quality and public health [
10,
11,
12]. These efforts are crucial as São Paulo, like many other megacities, grapples with the adverse effects of air pollution [
40,
41] and climate change [
42]. The subway system’s role in mitigating these issues highlights the importance of sustainable transport solutions in urban areas [
43].
Furthermore, the improvement and expansion of the subway system beyond the borders of the municipality of São Paulo, reaching the adjacent cities that constitute the RMSP, align with the 2030 Agenda for Sustainable Development, adopted by all United Nations Member States in 2015, and many of its Sustainable Development Goals (SDGs). This approach to the São Paulo subway system contributes to several SDGs, most notably Goal 11, Sustainable Cities and Communities, which aims to make cities inclusive, safe, resilient, and sustainable. By enhancing public transportation, reducing air pollution, and improving the overall quality of urban life, the metro system supports the broader objectives of sustainable development. Moreover, economically approaching this issue, the metro system supports the local economy by facilitating the efficient movement of the workforce and reducing travel times, thereby increasing productivity and quality of life. Additionally, these improvements can encourage economic development in underserved areas, providing greater access to job opportunities and essential services, and stimulate economic growth through job creation and increased investment in related sectors. These multifaceted benefits highlight the importance of continued investment in metro systems as part of broader sustainable urban development strategies.
The approach adopted in this study, incorporating multiple statistical analyses, proved to be satisfactory and appropriate for the designed objectives. Pearson correlation delineated the relations between variables, FAMD summarized the structure of the mixed dataset and identified the main variables associated with mobility characteristics among metro users, and multiple linear regressions further supported the associations between quantitative socioeconomic variables and the different travel distances and duration. However, while this study provides valuable information, it has limitations. The primary limitation is that the study focuses on a specific subset of the population (individuals who use the metro for work or study purposes, ensuring consistent weekly usage), which may limit the generalizability of the findings to the broader population that uses this mode of transport. Moreover, because the analytical sample does not include a comparison group of non-metro users, the results should not be interpreted as determinants of metro choice, but rather as associations observed among regular metro users. In addition, as this is an observational analysis, residual confounding may remain, including factors such as residential location, workplace or school location, job type, and proximity to specific metro lines or stations. Another limitation is that the study does not include a formal spatial analysis. Although distance-based variables were used to represent spatial accessibility, the analysis did not evaluate origin–destination geography, peripheral–core patterns, or spatial variation in metro dependence. Future studies could build on these findings by applying spatial methods to investigate where accessibility barriers are concentrated within the RMSP.
In general, our findings emphasize the importance of considering socioeconomic variables in transportation planning and policymaking and highlight the persistent accessibility and inclusion challenges faced by the poorer segments of São Paulo society. By understanding the travel behaviors of individuals who use the subway daily and consistently for work or study, policymakers and responsible personnel can design more inclusive and efficient public transportation systems.
These future data will enable further analysis and comparison, helping to identify changes and trends in travel behavior over time. Additionally, our results support the relevance of interventions aimed at improving transportation equity. For instance, expanding metro networks into peripheral areas and enhancing the affordability of metro services may significantly improve access for lower-income groups and potentially improve their quality of life. Targeted subsidies or incentives for frequent metro users from disadvantaged backgrounds could also be considered to promote greater utilization of this public transport system, although their potential effects should be evaluated in future studies.






 ,
,