1. Introduction
Metro systems play a strategic role in the urban mobility of large cities by offering high-capacity public transportation that helps reduce traffic congestion, lower pollutant emissions, and promote more efficient and sustainable mobility [
1,
2,
3].
The construction of a metro system is a product of rapid urbanization and depends on the city’s economic capacity and population size. A comprehensive analysis of the city’s stage of development, economic strength, and population is crucial to ensure sufficient demand and financial capacity for the construction and future expansion of the metro, thereby preventing unguided development [
4].
In the Brazilian context, however, metro networks still face significant challenges related to unplanned urban expansion, the lack of integrated mobility policies, and limited financial and institutional resources. These factors have resulted in systems with varying degrees of efficiency, territorial coverage, and modal integration [
5].
In this context, it becomes essential to analyze the models of operation, planning, and financing adopted not only in Brazil but also in countries with consolidated, efficient metro networks. Studying successful international experiences provides valuable insights for public policy design, governance improvement, the adoption of technological innovations, and the promotion of social inclusion in urban transportation.
In recent decades, the debate on sustainable urban mobility has become central to global development agendas, such as the United Nations Sustainable Development Goals (SDG 11—Sustainable Cities and Communities). Metro systems are not only key elements of mass transportation, but also catalysts for low-carbon urban transitions, equitable access to jobs and services, and urban resilience. International organizations, including the International Association of Public Transport (UITP) and the World Bank, have highlighted the metro as an essential infrastructure to mitigate impacts of climate change while enhancing social equity and productivity in metropolitan areas.
Despite the global recognition of metro systems as engines of sustainable development, there remains a research gap regarding comparative assessments that integrate technical, institutional, financial, and social dimensions across different governance contexts. Most benchmarking studies focus narrowly on performance metrics or technological aspects, overlooking how institutional maturity, funding diversification, and urban integration shape long-term system sustainability [
6,
7]. This study seeks to bridge this gap by adopting a multidimensional benchmarking framework that allows the identification of systemic patterns and policy-relevant lessons for developing countries.
This study adopts an exploratory and descriptive benchmarking approach. It does not aim to test statistical hypotheses, establish causal relationships, or develop predictive models. Instead, it seeks to provide a structured comparative assessment of metro systems, focusing on the identification of structural patterns, institutional arrangements, and policy-relevant insights.
Benchmarking studies are essential for understanding and improving metro system performance in different contexts. By systematically comparing operational efficiency, governance structures, financial strategies, and social outcomes, benchmarking allows policymakers and planners to identify best practices, avoid common pitfalls, and adapt successful solutions to local conditions [
8,
9]. Such comparative analyzes provide evidence-based insights for strategic decision-making, supporting sustainable development, technological innovation, and equitable access to urban transportation. In the context of developing countries like Brazil, benchmarking can guide the design, expansion and management of metro systems to achieve long-term efficiency and social impact.
In this context, this study is guided by the following research questions: (i) How do Brazilian metro systems compare to consolidated international systems in terms of operational performance, governance structures, and financing models? (ii) What best practices can be identified from international experiences that are transferable to the Brazilian context, considering its economic, institutional, and urban constraints? (iii) How can a multidimensional benchmarking framework contribute to more effective policy design and strategic decision-making for metro system development?
Based on these research questions, the objective of this study is to develop and apply a multidimensional benchmarking framework that enables a systematic and comparative assessment of metro systems across different governance contexts, moving beyond a descriptive inventory of indicators toward a structured and policy-oriented analysis.
From a methodological perspective, this work contributes by combining quantitative indicators and qualitative assessments to create a comprehensive comparative framework of metro systems. The analytical approach facilitates not only the evaluation of operational efficiency, but also the understanding of governance, planning, and social impacts. In practical terms, the study offers strategic recommendations for the design and expansion of Brazilian metro systems, emphasizing financial resilience, multimodal integration, and sustainability-oriented innovation.
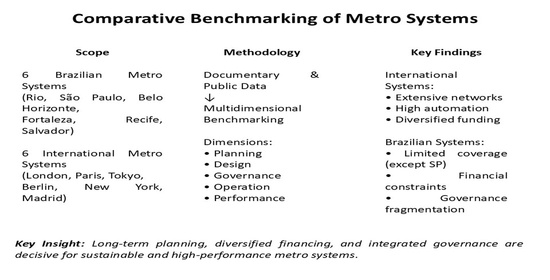
This article presents a comparative benchmarking study of 12 metro systems: 6 from Brazil (Rio de Janeiro, São Paulo, Belo Horizonte, Fortaleza, Recife, and Salvador) and 6 international cases (Paris, London, Tokyo, Berlin, New York City, and Madrid). The selection was based on criteria such as historical relevance, operational scale, institutional maturity, and level of technological innovation.
Through the analysis of technical, institutional, operational, and financial data, this study aims to identify best practices, recurring challenges, and potential areas for improvement, and to provide evidence-based recommendations for enhancing the planning, financing, and management of metro systems in Brazil.
Accordingly, the study is positioned as an analytical benchmarking exercise rather than a causal or econometric investigation, with emphasis on institutional learning and strategic policy guidance.
Following this introduction, this paper is organized as follows.
Section 2 describes the methodological framework adopted for the comparative benchmarking analysis.
Section 3 presents and discusses the main results of the benchmarking analysis, highlighting similarities and differences between Brazilian and international metro systems across planning, design, governance, and performance dimensions. Finally,
Section 4 summarizes the main findings of the study, discusses their policy implications, and outlines recommendations for the planning, financing, and management of metro systems in Brazil.
2. Methodology
This study employed a structured comparative benchmarking methodology designed to evaluate and contrast metro-rail systems across multiple dimensions—planning, design, governance, and performance. The approach integrates qualitative interpretation and quantitative normalization, aiming to identify best practices, operational bottlenecks, and governance patterns that influence the long-term effectiveness and sustainability of metro systems, with particular relevance to future projects in Brazil.
The methodological process was organized into four complementary phases: (A) documentary and bibliographic review; (B) selection of case studies; and (C) comparative analytical framework.
It is important to clarify that this study does not aim to conduct a systematic, bibliometric, or quantitative literature review. Instead, it adopts an exploratory and descriptive analytical approach, consistent with the objectives of comparative benchmarking studies. The literature and documentary review focuses on identifying conceptual frameworks, operational indicators, and institutional practices previously proposed by other authors and organizations, which are then used to support the selection of dimensions and indicators applied in the comparative analysis of metro systems.
2.1. Documentary and Bibliographic Review
This phase consolidated the conceptual and empirical basis of the study. Primary and secondary sources were collected systematically during the period from April to May 2025 and categorized according to their thematic relevance and reliability. The materials included: technical and operational reports; urban mobility plans, transport legislation, and metropolitan development frameworks; publications from international organizations and sectoral associations and; academic papers and peer-reviewed journals.
2.2. Selection of Case Studies
As mentioned in the previous section, the benchmarking sample comprised 12 systems, divided into two analytical groups: (1) International systems—London, Paris, Tokyo, Berlin, New York, and Madrid selected for their maturity, technological innovation, and institutional governance models; (2) Brazilian systems—São Paulo, Rio de Janeiro, Belo Horizonte, Fortaleza, Recife, and Salvador chosen for their geographic and institutional diversity, representing different stages of development and management models—public, concession, or public–private partnerships (PPPs).
The selection process followed explicit criteria: Geographical diversity, Institutional maturity, Financing structure, and Technological and managerial innovation. For the Brazilian cases, an additional criterion related to urban scale was applied, using the population of the served capital cities as a proxy for metropolitan scale and potential metro demand.The objective was not to ensure statistical or socioeconomic comparability between cities, but to identify structural patterns and transferable best practices through an exploratory benchmarking approach, in which international systems serve as analytical reference benchmarks rather than direct proxies.
2.3. Comparative Analytical Framework
The data was organized into a structured comparative framework, using a set of tables organized according to five analytical dimensions, consistent with the organization of the results section: general characteristics, planning characteristics, design characteristics, governance characteristics, and performance indicators.
Each dimension incorporated a combination of quantitative metrics (e.g., network length, ridership, frequency, and costs) and qualitative descriptors (e.g., governance model, integration with master plans, and institutional coordination). The analysis does not assume direct equivalence between the systems under study, but adopts an exploratory comparative benchmarking approach in which international metro systems are treated as analytical reference cases. Differences in scale, economic context, and urban characteristics across cases are explicitly acknowledged and interpreted as analytical dimensions of the study rather than as confounding variables to be statistically controlled. Data were cross-checked between multiple sources to ensure consistency and comparability.
Although the analysis encompasses all 12 metro systems under a single multidimensional benchmarking framework, the presentation of results distinguishes between Brazilian and international cases in separate tables. This separation is not methodological, as the same analytical dimensions and criteria are applied to all systems. Rather, it is an organizational and expository choice aimed at improving data clarity and readability, given the substantial differences in scale, institutional maturity, governance arrangements, and economic context between the two groups. Presenting the systems separately allows for clearer identification of internal patterns within each group, which are subsequently examined through an integrated comparative analysis in the discussion section.
To ensure methodological reproducibility, the benchmarking framework was structured around clearly defined analytical dimensions, standardized indicators, and publicly available data sources. The same procedure, comprising case selection based on explicit criteria, data collection from official operator reports and institutional documents, harmonization of quantitative indicators (such as fares, daily ridership, and average train headways), and organization of results according to the five analytical dimensions, can be directly replicated for other groups of metro or urban rail systems. This enables transparent, consistent, and reproducible application of the proposed benchmarking methodology beyond the cases analyzed in this study.
3. Results and Discussions
The comparative benchmarking exercise produced a set of structured findings across operational, planning, design, governance, and performance dimensions by analyzing 12 metro systems, where 6 systems are Brazilian and 6 are international.
It was possible to identify both convergences and divergences, as well as recurring opportunities and challenges. The results are presented in a progressive manner, starting with general system characteristics, followed by planning approaches, design and technological aspects, governance arrangements, and finally, performance and social–environmental impacts. This organization enables a clear understanding of how different factors interact to shape the effectiveness and sustainability of metro networks, while also providing evidence to guide future projects in the Brazilian context.
3.1. General Characteristics
Table 1 presents the general characteristics of the international metro systems analyzed and
Table 2 presents the general characteristics of the Brazilian metro systems. The selected international systems, particularly in London (1863), Paris (1900), and New York (1904), have over a century of operational history, allowing them to expand into extensive networks. London, for instance, has 408 km of track and 272 stations, while New York boasts 394 km and 472 stations. In contrast, Brazilian systems are relatively young, with the oldest, São Paulo (1974) and Rio de Janeiro (1979), being less than 60 years old. The length of the network in Brazil remains modest, with São Paulo being the largest at 104.2 km, followed by Fortaleza at 84.3 km, while others, such as Belo Horizonte, operate less than 30 km.
In addition to network length and number of stations, differences emerge when considering structural indicators such as network density (stations/km) and average inter-station spacing. The sample international systems exhibit higher station densities and shorter inter-station spacing, reflecting a long-term strategy focused on fine-grained spatial coverage and high accessibility. Paris stands out for one of the highest network densities and an average inter-station spacing below 1 km, while New York and Berlin also exhibit high densities and relatively short spacing. Conversely, Brazilian metro systems tend to present lower network densities and larger average inter-station spacing, consistent with a development stage primarily oriented toward corridor-based expansion and initial network consolidation rather than dense urban penetration.
These structural differences have direct implications for the relative role of metro systems within each city’s overall mobility framework. International systems characterized by high station density, short inter-station spacing, and extensive network coverage tend to achieve higher metro modal share, particularly in dense urban cores where metro services are highly competitive with private car use. In contrast, Brazilian systems, which generally exhibit lower network density and larger inter-station spacing, play a more limited role in total urban mobility and often depend more strongly on feeder bus services and intermodal transfers. Differences in urban density, land-use patterns, fare integration policies, service coverage, and the degree of multimodal coordination help explain these variations, reinforcing the importance of integrated transport and land-use planning to increase the effective modal share of metro systems.
Intermodal travel patterns also differ significantly across the analyzed systems. International metro networks generally exhibit strong integration with bus services, commuter rail, and active modes, supported by coordinated timetables, unified fare systems, and well-developed first- and last-mile connections. In several cities, park-and-ride facilities further facilitate integration with private cars. In contrast, Brazilian metro systems rely more heavily on bus-based feeder services, with varying levels of physical and fare integration. Limitations in network coverage and first-/last-mile connectivity often increase transfer penalties, reducing overall system attractiveness. These differences highlight the importance of coordinated intermodal planning to enhance metro accessibility and effective use.
Daily ridership figures demonstrate the high capacity and usage of international systems. Tokyo leads with 6.52 million daily trips, followed closely by London (5 million) and Paris (4 million). These figures reflect both dense urban populations and a well-integrated role in everyday mobility. In Brazil, São Paulo stands out with 4 million daily passengers, comparable to Paris, indicating high demand despite its smaller network. In contrast, systems like Fortaleza (56 thousand) and Belo Horizonte (100 thousand) operate at much lower volumes, suggesting underutilization or limited catchment areas.
Average train headways further illustrate performance differences. International systems like Paris and Tokyo maintain frequencies as low as 2 min during peak periods, while Berlin averages 4–5 min. Brazilian performance is more heterogeneous: São Paulo achieves a competitive 1.6 min headway, comparable to top international standards, while cities such as Fortaleza (15 min) and Belo Horizonte (7–15 min) have much lower frequencies, which can limit system attractiveness and capacity.
In terms of cost, Brazilian metro fares, are significantly lower than those of major international cities, often less than US$1.50 (R$8.25), compared to London’s upper fare range of US$9.45 (R$52.00). This reflects local income levels and fare policy strategies aimed at accessibility. However, lower fares do not necessarily translate into high ridership in smaller Brazilian systems, pointing to the importance of network extent and service quality.
Both international and Brazilian systems generally offer fare integration with other modes, with varying degrees of comprehensiveness. International examples such as London’s Oyster card and Berlin’s zone-based system facilitate seamless transfers across different modes. Brazilian systems also feature integrated ticketing, São Paulo’s Bilhete Único and Rio de Janeiro’s Intermunicipal Bilhete Único being notable examples, although integration effectiveness can be influenced by operational coordination and network coverage.
Fare collection technologies and security inspection practices also vary across the analyzed metro systems. International networks generally employ advanced fare collection systems based on smart cards, contactless bank cards, and mobile payments, enabling faster passenger flows and reduced dwell times at stations. Security screening practices in these systems are typically proportionate and risk-based, prioritizing passenger throughput and operational efficiency. Brazilian metro systems have progressively adopted electronic ticketing and smart cards, often integrated with bus systems, but the level of technological maturity and interoperability remains uneven. In some cases, more manual or fragmented security and access control procedures may increase transfer times and negatively affect passenger experience, highlighting the role of technology and institutional coordination in improving system efficiency.
The analysis suggests that while Brazilian metros share some operational characteristics with leading international systems, such as São Paulo’s high ridership and frequency, they face challenges in scale, network density, and service consistency. Expanding network length, increasing operational frequency in underperforming systems, and ensuring robust multimodal integration are critical for enhancing their role in urban mobility. International benchmarks demonstrate that sustained investment over decades, combined with integrated urban transport planning, is key to achieving high-capacity, high-coverage metro networks.
3.2. Planning Characteristics
Table 3 and
Table 4 presents the comparative analysis of planning characteristics of the international and Brazilian metro systems, respectively. In terms of integration with urban and metropolitan master plans, all international cases demonstrate full alignment with sustainable urban development policies and metropolitan-scale planning frameworks. This integration ensures that metro network expansion supports land-use optimization, accessibility improvement, and multimodal connectivity. In contrast, although most Brazilian systems report integration with official urban mobility or development plans, Rio de Janeiro presents only partial alignment, reflecting fragmented implementation and weak intergovernmental coordination. This suggests a structural governance challenge that may limit the system’s capacity to deliver cohesive and timely infrastructure improvements.
Regarding funding mechanisms and resource mobilization, international systems employ diversified portfolios combining fare revenues, public subsidies, loans, public–private partnerships, and, in some cases, specialized funds such as European Investment Bank financing. The diversification of funding sources reduces dependency on a single revenue stream and enhances resilience against fiscal fluctuations. Brazilian systems, however, exhibit more restricted and localized funding arrangements, often centered on infrastructure debentures, direct subsidies, or isolated PPPs initiatives. Such limitations can slow down expansion projects and restrict innovation, particularly in cities where demand growth requires proactive investment.
Beyond fare revenues, international metro systems typically rely on diversified income sources to enhance financial sustainability. These include commercial retail spaces within stations, advertising revenues, real estate development, and Transit-Oriented Development (TOD) strategies coordinated with urban planning policies. Such mechanisms reduce dependence on farebox recovery and public subsidies, while reinforcing the integration between transport infrastructure and urban development. In contrast, Brazilian metro systems tend to exhibit more limited use of non-fare revenues, with financial models still largely centered on fares, direct subsidies, or concession arrangements. Although isolated initiatives related to advertising and commercial use of stations exist, the systematic integration of TOD and real estate-based revenues remains incipient, indicating a potential area for institutional learning and future policy development.
For future scenarios and demographic projections, international networks demonstrate strategic and large-scale commitments, often involving multi-decade expansion programs and continuous modernization initiatives. Projects such as Paris’s four new lines and Tokyo’s planned network extensions to 2030 illustrate long-term vision and coordinated investment. Brazilian systems, while generally acknowledging the need for modernization and expansion, tend to focus on shorter-term actions or face uncertainties tied to financial constraints. For example, São Paulo presents a more robust future-oriented strategy, whereas Recife’s priorities center on maintenance and operational stability, and Rio de Janeiro’s progress remains conditional on significant new investments.
Overall, the data indicate that international metro systems benefit from stronger institutional alignment, diversified financing mechanisms, and sustained long-term planning, resulting in more predictable and scalable development trajectories. Brazilian systems, although advancing in formal planning integration, still face challenges in governance coordination, funding diversification, and strategic foresight, which could hinder their ability to meet future mobility demands effectively. Addressing these gaps—particularly by adopting multi-source financing models and reinforcing metropolitan governance—could enhance both the resilience and the competitiveness of Brazilian metro networks in the long term.
To ensure transparency and traceability of the information presented, it is important to note that all data and institutional details discussed throughout this section were obtained from official sources. The international systems analyzed include BVG (Berliner Verkehrsbetriebe), Metro de Madrid, Tokyo Metro, Transport for London, as well as sectoral organizations such as UITP and UrbanRail. For the Brazilian context, the information was collected from the official websites of Metrô Recife, Metrô de Belo Horizonte, Metrô de Fortaleza, Metrô de São Paulo, and Metrô do Rio de Janeiro.
3.3. Design Characteristics
Table 5 and
Table 6 presents the comparative assessment of design characteristics of the international and Brazilian metro systems, respectively. Regarding geometric design standards and track infrastructure, both international and Brazilian systems employ a combination of underground, elevated, and surface alignments, with gauge choice reflecting historical and operational contexts. International systems often feature extensive underground networks in dense urban areas (e.g., Paris and Tokyo), optimizing space use and minimizing surface impact. Brazilian systems, while diversified in alignment types, are more heterogeneous in gauge and electrification methods, with several networks adapted from preexisting railway infrastructure (e.g., Recife), which can impose operational and capacity constraints.
In station design and modal integration, international systems show strong emphasis on architectural modernization, commercial integration, and multimodal connectivity, with several networks incorporating urban services directly into stations. Brazilian systems also demonstrate concern for intermodality, often linking metro stations to bus terminals, bike paths, and LRT lines; however, design upgrades tend to be more functional than architecturally distinctive, and commercial integration is generally less prominent.
User accessibility and comfort emerge as a differentiating factor. While international systems such as Tokyo and Berlin offer full or near-complete accessibility, others like London still face limitations, particularly in older stations. Brazilian systems have advanced in implementing elevators, tactile flooring, and ramps, but modernization remains uneven, with some networks (e.g., Recife) still undergoing adaptation programs. Air conditioning in trains is a common feature in Brazil, representing a comfort-oriented design choice adapted to local climate conditions.
With respect to sustainability in design, international cases reveal structured, long-term environmental commitments, including LED retrofits, recyclable construction materials, reduction targets, and integration into broader climate policies (e.g., Tokyo’s net-zero by 2050 goal). Brazilian systems are increasingly incorporating sustainable measures, such as LED lighting, water reuse, urban greening, and waste recycling programs, but these initiatives are often project-specific and less systematically integrated into long-term corporate strategies.
In technology, Advanced Train Supervision (ATS) and automation levels vary significantly among the analyzed metro systems. The international networks, such as Paris, London, and Tokyo, employ advanced signaling and supervision systems, including CBTC and ATC, that enable high levels of automation, with some lines operating under driverless or unattended train operation. These technologies support higher service frequency, improved safety performance, and lower marginal operating costs. In Brazilian metro systems, advanced supervision and automation are increasingly adopted, particularly in São Paulo and Salvador, but remain limited to specific corridors or lines. Other systems continue to rely predominantly on conventional signaling with incremental upgrades. This heterogeneity reflects differing investment capacities and institutional maturity, and highlights the role of automation as a strategic lever for future capacity expansion and operational efficiency.
Finally, in use of modeling tools, both international and Brazilian systems are adopting BIM and GIS to improve project planning, execution, and asset management. International cases typically integrate these tools with simulation models and real-time operational systems, whereas Brazilian applications are more concentrated in project design and construction phases, with limited integration into daily operational decision-making.
The data suggest that while Brazilian metro systems are converging toward international best practices, particularly in accessibility improvements, technological modernization, and BIM adoption, there remain significant gaps in full network automation, environmental policy integration, and the architectural and commercial enhancement of stations. Strategic, long-term design planning that incorporates sustainability, technology, and user experience in an integrated manner could accelerate this convergence and improve the resilience and attractiveness of Brazilian urban rail systems.
3.4. Governance Characteristics
Table 7 and
Table 8 presents the comparative analysis of governance characteristics of the international and Brazilian metro systems, respectively. In terms of operation models, most international systems are publicly operated, either by municipal or state-owned companies, while incorporating varying degrees of autonomy and accountability, such as Transport for London’s mayor-appointed board or Paris’s contractual governance between RATP and Île-de-France Mobilités. Tokyo stands out as a hybrid public–private model with government shareholding. In Brazil, however, there is a greater prevalence of concessions and PPPs, especially in Rio de Janeiro, Belo Horizonte, and Salvador, while São Paulo adopts a mixed model and Recife and Fortaleza maintain full public operation. This suggests that, whereas international systems tend to maintain public control with structured governance frameworks, Brazilian systems often leverage private participation to overcome investment and operational capacity constraints.
Regarding institutional governance, international systems operate under clear regulatory arrangements with well-defined roles for oversight bodies and transport authorities, often integrated into metropolitan transport planning. Brazilian governance structures also include regulatory and supervisory agencies at state or federal level, but the degree of integration with broader metropolitan governance varies significantly. The more fragmented arrangements, especially in systems spanning multiple government levels, may pose challenges for coordination and long-term strategic planning.
In risk and contingency management, international systems adopt highly structured protocols, often supported by digital monitoring tools, real-time control centers, and frequent drills. Brazilian systems have established contingency plans and safety protocols, with regular training, but the sophistication and technological integration of these systems are generally less advanced, relying more on procedural approaches than on automated or predictive systems.
With respect to training and capacity building, both groups prioritize continuous staff development, though the scope and specialization differ. International systems often combine technical, customer service, and safety training with simulation-based exercises and event-specific preparedness (e.g., large gatherings, emergencies). Brazilian systems also maintain ongoing programs, particularly in safety and operational efficiency, but training content is often more operationally focused, with fewer references to advanced simulation or scenario-based training.
In contract management and performance oversight, international cases show robust KPI frameworks, performance-based incentives, and penalty structures—Paris’s bonus-malus system being a notable example that incorporates passenger satisfaction into financial adjustments. Brazilian systems also monitor KPIs and enforce penalties for non-compliance, but incentives are less frequently tied to customer perception or broader service quality metrics, focusing instead on contractual compliance and operational outputs.
International metro governance tends to combine public operational control with high institutional integration, advanced risk management technologies, and performance systems that link funding or penalties to both operational and user-experience outcomes. Brazilian systems, while increasingly adopting formalized governance and performance monitoring, still face challenges in institutional coordination, technological sophistication in risk management, and in aligning contractual oversight with passenger-centered quality metrics. Strengthening regulatory integration, expanding technological adoption, and embedding customer-oriented incentives could enhance governance effectiveness and system performance in the Brazilian context.
3.5. Performance Indicators
Table 9 and
Table 10 presents the comparative assessment of performance indicators between international and Brazilian metro systems, respectively. In terms of operational indicators, international metro networks employ a broader and more diversified set of metrics, encompassing train-kilometres operated, customer hours lost, excess journey time, passenger density, and service availability. Systems such as Paris and Madrid also incorporate frequency, punctuality, and train occupancy rates into their evaluations. In contrast, Brazilian systems predominantly track punctuality, train availability, and technical failure rates. Some networks, such as São Paulo, include additional parameters—elevator/escalator availability—while others focus on structural attributes such as network length and fleet size.
In the service quality indicators, international systems regularly measure user satisfaction, complaint and commendation volumes, accessibility, and reliability. Specific tools, such as the Perceived Quality Index (Madrid) and mobile application-based feedback collection (Paris), are common. Brazilian systems include indices such as IQS (Rio de Janeiro) and periodic satisfaction surveys (São Paulo, Belo Horizonte), though in several cases, the scope of quality metrics remains generic or underdeveloped.
In financial and economic indicators, international cases report detailed financial data, including revenue and cost per kilometre, net profit, and infrastructure investment, often linked to sustainability analyses. Brazilian systems disclose revenues, deficits, and investment levels; however, comprehensive financial reporting is inconsistent, with some systems (e.g., Recife) presenting only operational deficits.
In environmental indicators, international networks track a wide array of metrics, from emissions and energy consumption to energy efficiency, air quality within stations, and even biodiversity impacts (Madrid). Brazilian systems monitor reduction and implement initiatives such as water reuse and sustainable fleets, though environmental indicators remain narrower in scope and lack standardisation.
In social indicators, international systems integrate social dimensions, including accessibility, safety, social inclusion, community engagement, and gender diversity. Brazilian networks generally record direct employment figures and certain social programmes, but rarely address diversity or community participation systematically.
In monitoring and continuous evaluation, advanced technological tools such as CBTC, IoT-based monitoring, digital twins, and integrated audit platforms are standard among international systems. Brazilian systems rely primarily on centralized operational control, SCADA systems, and video surveillance, with comparatively lower levels of automation and integration.
International metro networks exhibit greater diversification and integration of operational, economic, environmental, and social performance indicators, enabling a more comprehensive and data-driven management framework. This approach strengthens transparency, accountability, and strategic decision-making. Brazilian systems, while making consistent efforts to monitor punctuality, availability, and user satisfaction, display a narrower and more heterogeneous indicator set, with notable gaps in environmental and social metrics, as well as in real-time data analytics.
Technological disparities further widen this gap: while networks such as Tokyo and Paris employ artificial intelligence, IoT sensors, and digital twins to enhance predictive maintenance and incident response, Brazilian networks largely rely on centralised, less interoperable systems. Furthermore, in international contexts, indicators are often closely tied to contractual governance mechanisms, such as bonus-malus schemes and independent audits, promoting continuous improvement. In Brazil, despite the presence of contractual penalties, the scope and enforcement of such mechanisms vary widely, particularly in publicly operated systems.
4. Conclusions
This study conducted a comparative analysis of six Brazilian and six international metro systems, examining their planning, design, operation, governance, and performance. The analysis was based on a structured and multidimensional benchmarking framework, combining standardized quantitative indicators and qualitative institutional assessment to enable systematic comparison across heterogeneous governance and urban contexts.
The results reveal significant disparities in scale, technological adoption, and management capacity. While international networks such as Tokyo, Paris, and London demonstrate well-established models based on long-term planning, diversified funding, and institutional maturity, Brazilian systems remain quite varied. São Paulo stands out for approaching these standards, whereas others face financial, operational, and institutional constraints. These findings are useful for policymakers, transport authorities and urban planners involved in the development and management of urban rail systems.
The research highlights that the success of metro systems goes beyond technical infrastructure, relying on effective integration within comprehensive governance and planning frameworks. International experiences underscore the importance of diverse funding sources, clear regulatory oversight, and alignment with sustainable urban development strategies. In Brazil, promising advances include São Paulo’s advanced automation, Salvador’s well-structured public–private partnership, Fortaleza’s emphasis on social and environmental benefits, and Belo Horizonte’s integration of social programs. However, ongoing challenges in financing diversification, governance coordination, and long-term strategic planning still hinder broader progress.
For the Brazilian context, three strategic challenges stand out: (i) developing resilient financial models that combine public resources, private participation, and international funds; (ii) integrating metro expansion with metropolitan-scale urban planning to ensure connectivity, accessibility, and social inclusion; and (iii) embedding sustainability and innovation as core pillars, aligning climate commitments, technological modernization, and social impact with operational models.
By articulating these strategic challenges through a comparative and multidimensional lens, the study contributes to transport policy literature by demonstrating how institutional maturity, governance arrangements, and financing structures jointly shape metro system performance. Rather than evaluating isolated indicators, the proposed benchmarking framework enables cross-case learning and supports evidence-informed decision-making in contexts characterized by institutional and economic heterogeneity.
This study presents some limitations. The benchmarking analysis is exploratory and based on secondary data from official and institutional sources. Furthermore, the case selection was intentional and not statistically representative, meaning that the results should be interpreted as illustrative rather than generalizable. Finally, the study does not seek to establish causal relationships or quantitatively assess the impacts of specific policies or technologies, but rather to provide a structured comparative perspective to support institutional learning and policy discussion.
Future studies should explore not only technical and operational benchmarking but also the political, institutional, and socio-environmental dimensions that shape the success of metro systems. In this context, future research could develop and test new numerical indicators for planning characteristics, as well as expand the set of performance sub-indicators—such as lost customer hours, excess journey time, and perceived quality indices. Investigating issues such as community participation, climate adaptation, and integration with emerging mobility technologies (e.g., Mobility-as-a-Service, electric buses) would provide a broader framework for sustainable metropolitan transport planning. In addition, although this study deliberately adopted structured comparative tables to ensure transparency, consistency, and methodological reproducibility in the multidimensional benchmarking analysis, future research could complement this approach with well-designed visual representations, such as schematic diagrams or synthetic figures, thereby enhancing the communication of complex relationships and comparative patterns, particularly as more standardized and harmonized datasets become available. Finally, future research may build upon this framework by incorporating econometric or causal analyses as more harmonized longitudinal data become available.




 ,
,