Article

Genome-Wide Identification and Expression Profiling of PYL Genes in Brassica napus Under ABA and Drought-Stress Treatments


by
Rana Muhammad Amir Gulzar
1,
Nazir Ahmad
2,
Xiaohong Zhao
3,
Tong Zhao
1,
Jianyin Zhan
1,
Hongrui Yu
1,
Muhammad Haseeb Javaid
1,
Raheel Munir
1,
Muhammad Mudassir Nazir
4,* and
Iqbal Hussain
1,*
1
Institute of Vegetable Science, Zhejiang University, Hangzhou 310058, China
2
West Tennessee AgResearch & Education Center (WTREC), Department of Plant Science, University of Tennessee, Knoxville, TN 38301, USA
3
College of Life and Environmental Sciences, Hangzhou Normal University, Hangzhou 311121, China
4
School of Environment and Safety Engineering, Jiangsu University, Zhenjiang 212013, China
*
Authors to whom correspondence should be addressed.
Stresses 2026, 6(3), 41; https://doi.org/10.3390/stresses6030041
Submission received: 16 May 2026 / Revised: 23 June 2026 / Accepted: 25 June 2026 / Published: 27 June 2026
(This article belongs to the Topic New Insights into Plant Biotic and Abiotic Stress)

Abstract

Brassica napus L. is a major oilseed crop whose productivity is significantly affected by abiotic stresses such as drought. PYR/PYL/RCAR (PYL) proteins act as key abscisic acid (ABA) receptors and play central roles in stress responses. However, a comprehensive genome-wide analysis of the PYL gene family in B. napus is still lacking, limiting our understanding of their functions in plant and stress adaptation. This study reports the first comprehensive genome-wide analysis of the PYL gene family in B. napus (rapeseed), cultivar ZS11, identifying 25 BnPYL genes grouped into four subfamilies, I (four genes), I-II (five genes), II (five genes), III (11 genes), and their encoded proteins were predicted to be mainly localized in the chloroplast. Structural analysis revealed diverse exon–intron organization and 10 conserved motifs. All identified BnPYLs contained Polyketide_cyc2 domains (PF10604), supporting their annotation as members of the PYL family. Promoter analysis identified cis-regulatory elements related to light response, stress regulation, and hormonal signaling. Computational analysis of post-translational modifications suggested that phosphorylation sites are mainly localized at serine and threonine residues. Tertiary structure modelling revealed conserved three-dimensional architectures among BnPYL proteins, suggesting potential functional conservation. Expression profiling and RT-qPCR analyses revealed that several BnPYL genes respond to ABA-mediated drought stress, with BnPYL15 and BnPYL22 exhibiting the highest induction (4–5-fold) and BnPYL2, BnPYL5, BnPYL6, BnPYL17, BnPYL18, and BnPYL25 showing significant upregulation (2.0–4.5-fold), suggesting potential roles in enhancing drought tolerance in B. napus.

1. Introduction

Brassica napus L. (rapeseed) is a major oilseed crop cultivated across temperate regions worldwide, including China, Canada, and India, accounting for roughly 60% of global production and serving as an essential source of edible oil and protein-rich feed [1]. Its agronomic importance has been reinforced by genomic studies that have facilitated crop improvement and adaptation [2]. In China, B. napus is a principal winter oilseed crop and plays a vital role in maintaining edible oil security [3]. However, increasing climate variability has intensified drought stress, which severely limits crop productivity by impairing physiological processes such as photosynthesis, water-use efficiency, and reproductive development, ultimately reducing seed yield and oil content [4].
PYRABACTIN RESISTANCE1/PYR1-LIKE (PYR/PYL) proteins act as core receptors of abscisic acid (ABA) and play a central role in mediating plant responses to environmental stresses. These receptors perceive ABA signals and initiate downstream signaling by inhibiting clade A protein phosphatases type 2C (PP2Cs), thereby activating SNF1-related protein kinases (SnRK2s) and ABA-responsive gene expression [5,6]. Under abiotic stress conditions, ABA levels rapidly increase, triggering adaptive responses that enhance plant survival [7,8]. In A. thaliana, fourteen PYL genes (PYR1 and PYL1–PYL13) have been identified, exhibiting both functional redundancy and specificity in ABA signaling [9,10]. Several members, including PYL4, PYL5, and PYL8, have been shown to positively regulate drought tolerance by enhancing stomatal closure, reducing water loss, and promoting stress-responsive transcriptional regulation [11,12,13]. PYL8, in particular, is involved in root growth modulation under stress conditions, highlighting its role in adaptive development [14]. In other crop species, PYL homologs also contribute significantly to abiotic stress tolerance; for example, overexpression of rice PYL genes improves drought and salinity resistance by modulating ABA sensitivity and stress signaling pathways [15,16]. Similarly, PYL proteins in wheat and maize have been associated with improved water-use efficiency and enhanced tolerance to osmotic stress [17,18]. Collectively, these findings highlight the conserved and critical roles of PYL proteins in coordinating stress responses and developmental processes across plant species.
During the past few years, multiple PYL gene families have been identified, especially in eggplant [19], tartary buckwheat [20], Chinese licorice or gancao [21], oat [22], pear [23], rice [24], and cucumber [25], containing 24, 19, 10, 12, 67, 13, and 14 PYL members, respectively. Conserved domains such as Polyketide_cyc2 domains (Pfam domain: PF10604) had been predicted in most of the PYLs of the above crops. The expression patterns of many PYL genes were also investigated in different tissues and in response to various abiotic stresses in plants [26]. Although members of the PYL family have been reported in various plant species, their diversification appears to be linked with distinct regulatory functions in ABA-dependent stress responses, whereas the evolutionary patterns and biological roles of PYL genes in B. napus are still not fully understood.
Despite the agronomic significance of Brassica napus, a comprehensive understanding of the genomic organization and evolutionary dynamics of the PYL gene family in this species remains limited. To address this gap, a systematic genome-wide identification and characterization of BnPYL genes was undertaken in the current study. In total, 25 BnPYL genes were identified from the genome of the oilseed rape plant. Detailed bioinformatic investigations characterized the BnPYL gene family in terms of their evolutionary relationships with A. thaliana and B. rapa, predicted chromosomal locations, possibly conserved domains and motifs, putative promoter cis-regulatory motifs, three-dimensional structures, computationally predicted post-translational modification (PTM) sites, and other predicted group-specific features. Protein–protein interaction analysis further suggested a potential role for BnPYL proteins in biotic and abiotic stress responses through their associations with stress-related proteins. Expression profiling highlights the regulatory role of BnPYL genes in plant tissues, drought stress, and ABA application under drought stress. This study provides a primary characterization of BnPYL genes and investigates their potential roles in ABA-mediated signaling networks associated with drought stress adaptation in B. napus; however, further detailed functional studies are required to fully elucidate their underlying molecular mechanisms.

2. Results

2.1. Identification and Physicochemical Properties of the PYL Gene Family in B. napus

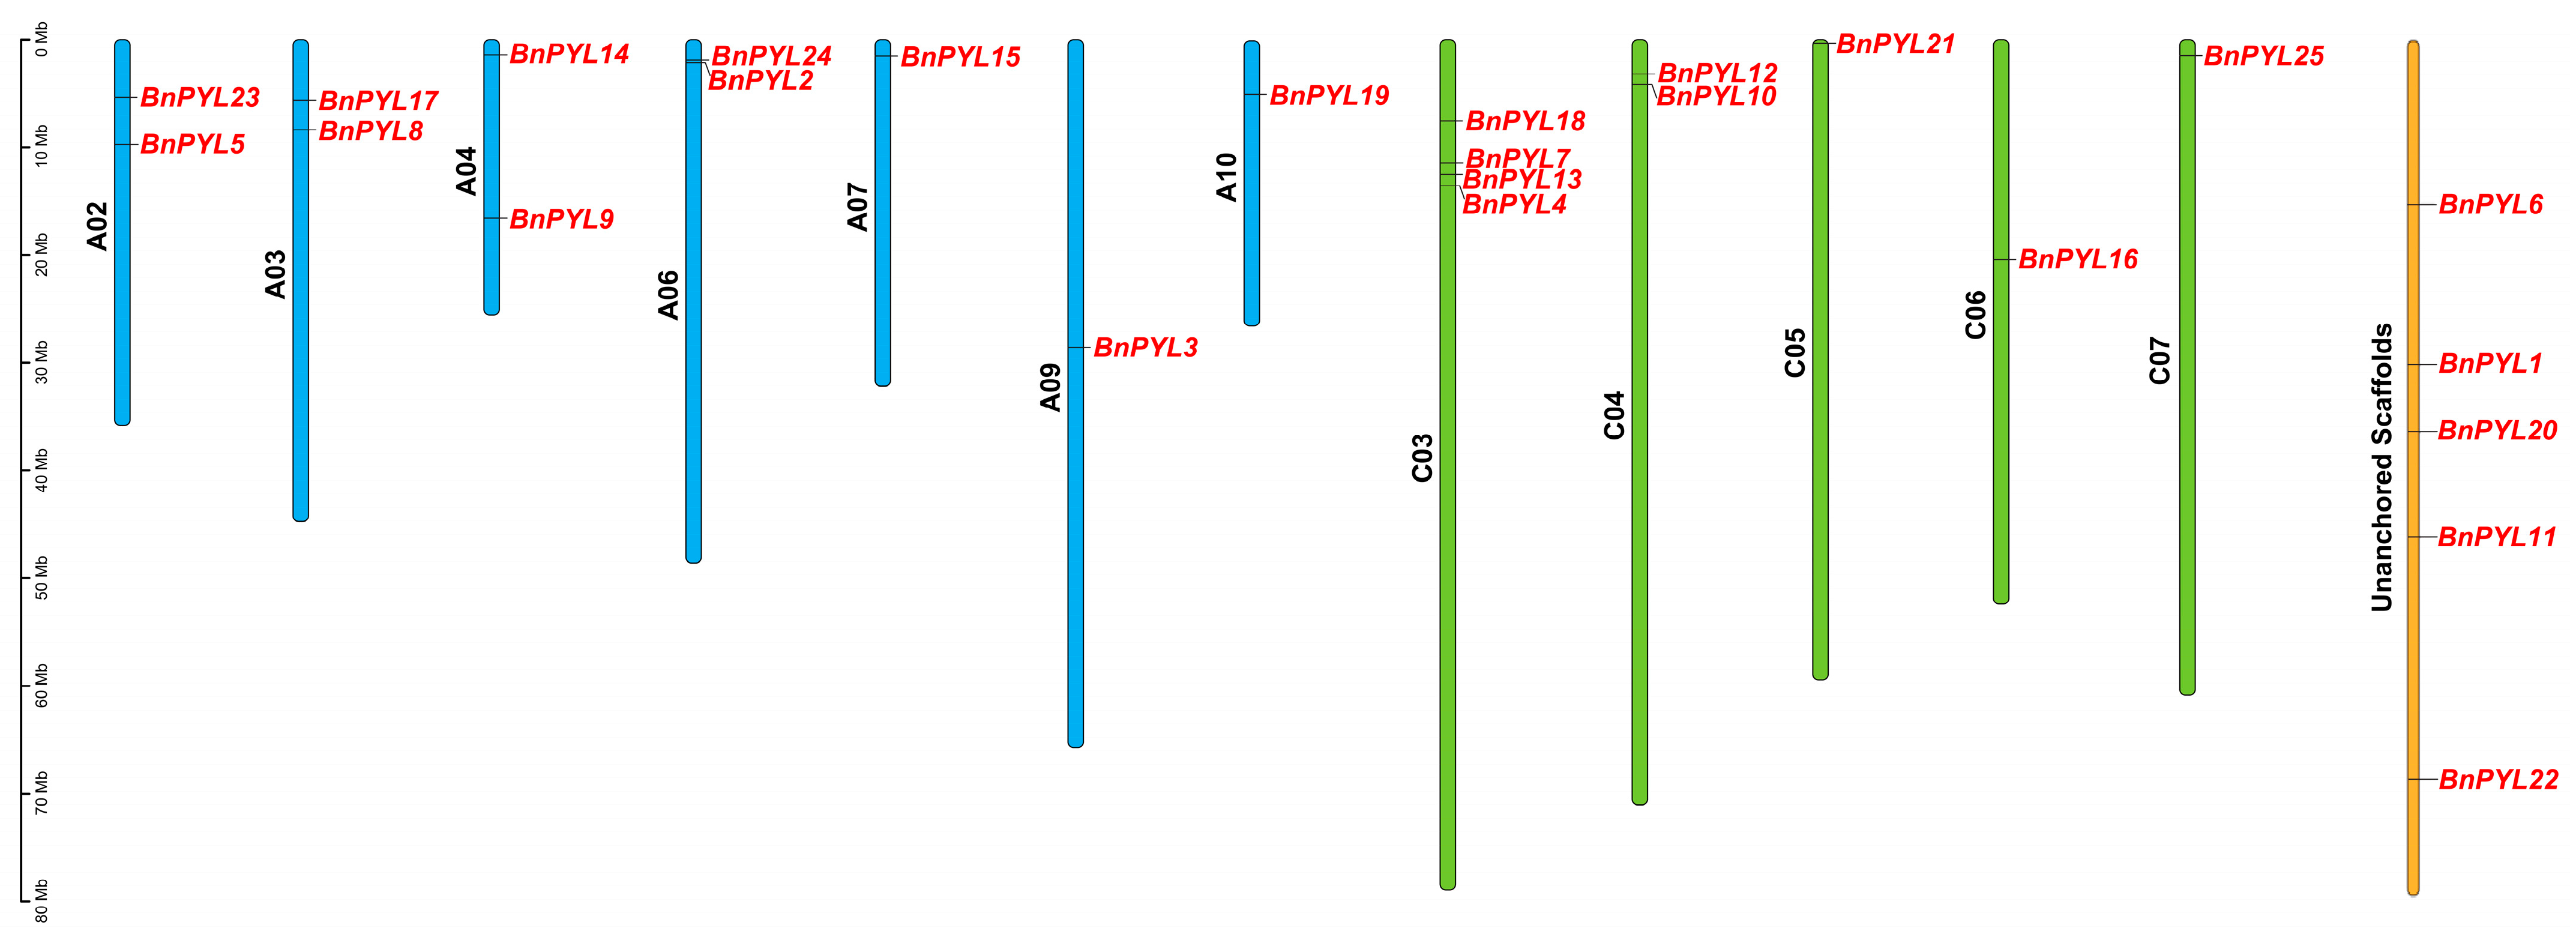
To identify PYL (Pyrabactin Resistance 1-like) proteins in B. napus, thirteen known PYL sequences from A. thaliana were retrieved from the TAIR database and used as query sequences for BLASTP (https://blast.ncbi.nlm.nih.gov/Blast.cgi?CLIENT=web&DATABASE=nr&NCBI_GI=on&PAGE=Proteins&PROGRAM=blastp&QUERY=IDQILETNRIACRFNHSNQKYAFSITFQEECAHVTLVVYGRNLHKHFFYWKLHKQLIDLIANPNDMFFF&END_OF_HTTPGET=Y (accessed on 16 May 2026)) searches against the B. napus genome assembly (Brana_Dar_V5), available at the Brassica Database. In addition, previously annotated PYL homologs available in public databases and published literature were also examined to verify the identified candidates and to ensure comprehensive detection of PYL gene copies in the B. napus genome. A total of 25 candidate BnPYL proteins were identified and named according to their sequence similarity with corresponding AtPYLs (Table 1). The predicted proteins varied in length from 162 to 213 amino acids and had molecular weights ranging from approximately 17.82 to 23.71 kDa. Two BnPYLs (BnPYL4 and BnPYL5) were predicted to localize in the plasma membrane, whereas the remaining BnPYLs were predicted to be targeted into the chloroplast. All predicted and identified BnPYLs contained the conserved Polyketide_cyc2 (PF10604) domain along with the characteristic SGLP gate motif. The theoretical isoelectric points (pI) ranged from 4.96 to 8.91, indicating diversity in their charge properties. The 25 identified BnPYL genes were unevenly distributed across the A and C subgenomes, comprising 14 and 11 genes, respectively (Table 1; Figure 1). A relatively higher number of genes was observed on chromosomes A03, A04, A06, and C03; however, without duplication or synteny-based analyses, this pattern is interpreted only as non-uniform chromosomal distribution rather than evidence supporting regional expansion or gene retention. In addition, five genes were assigned to unanchored scaffolds (chrAnn_random and chrCnn_random), reflecting incomplete chromosomal placement in the current genome assembly (Figure 1). Overall, the distribution pattern indicates that BnPYL genes are broadly represented across both subgenomes of B. napus.

2.2. Phylogenetic Analysis of BnPYLs and Related PYL Family Members

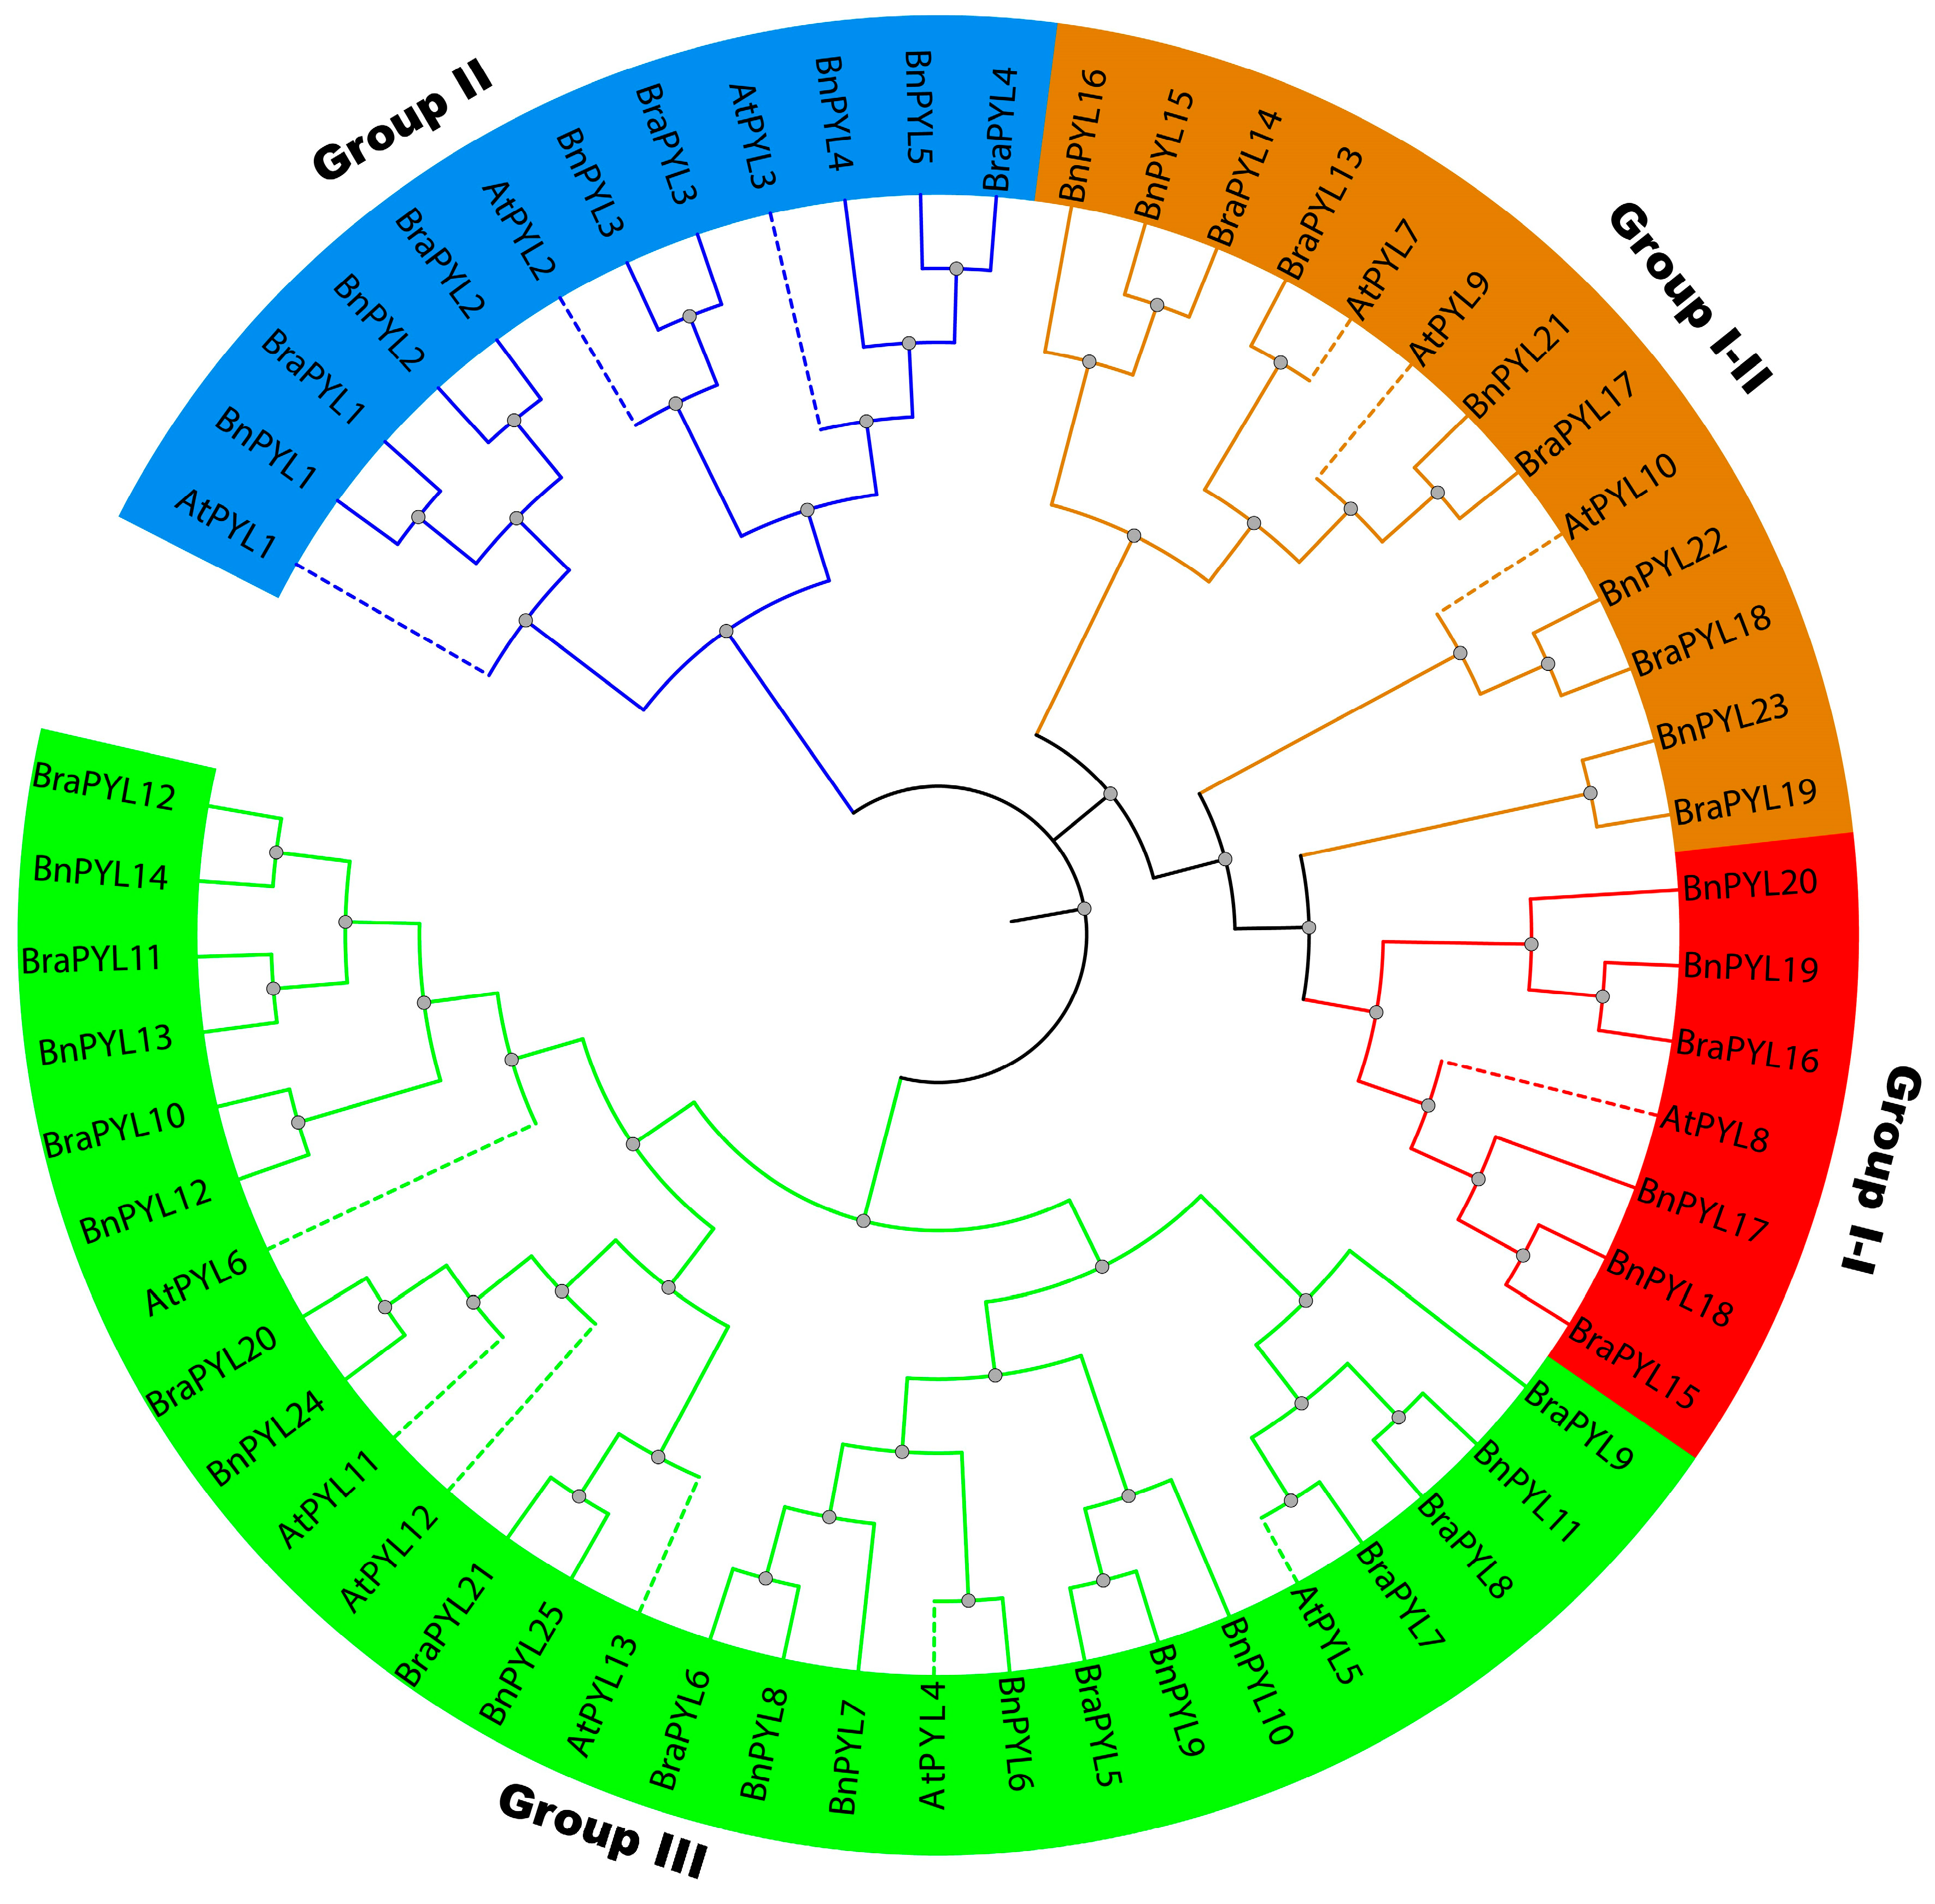
To examine the evolutionary relationships of the PYL family genes in B. napus, a maximum likelihood (ML) phylogenetic tree was constructed using PYL protein sequences from A. thaliana (13), B. napus (25), and B. rapa (20) (Figure 2). The resulting tree showed that BnPYL proteins clustered with their corresponding homologs from A. thaliana and B. rapa, indicating a high degree of evolutionary conservation. Despite this, differences in gene number and distribution among the three species are observed; however, without complementary gene family expansion analyses, these differences are described as variation in gene representation rather than evidence of lineage-specific expansion. Notably, the clade associated with AtPYL12 lacked corresponding members from both B. napus and B. rapa, which may reflect gene loss or functional divergence during evolution. Overall, these results indicate that the BnPYL gene family has undergone expansion and diversification, likely driven by genome duplication events and subsequent evolutionary adaptation following polyploidization in B. napus.

2.3. Conserved Domain and Gene Structure Analysis of BnPYLs

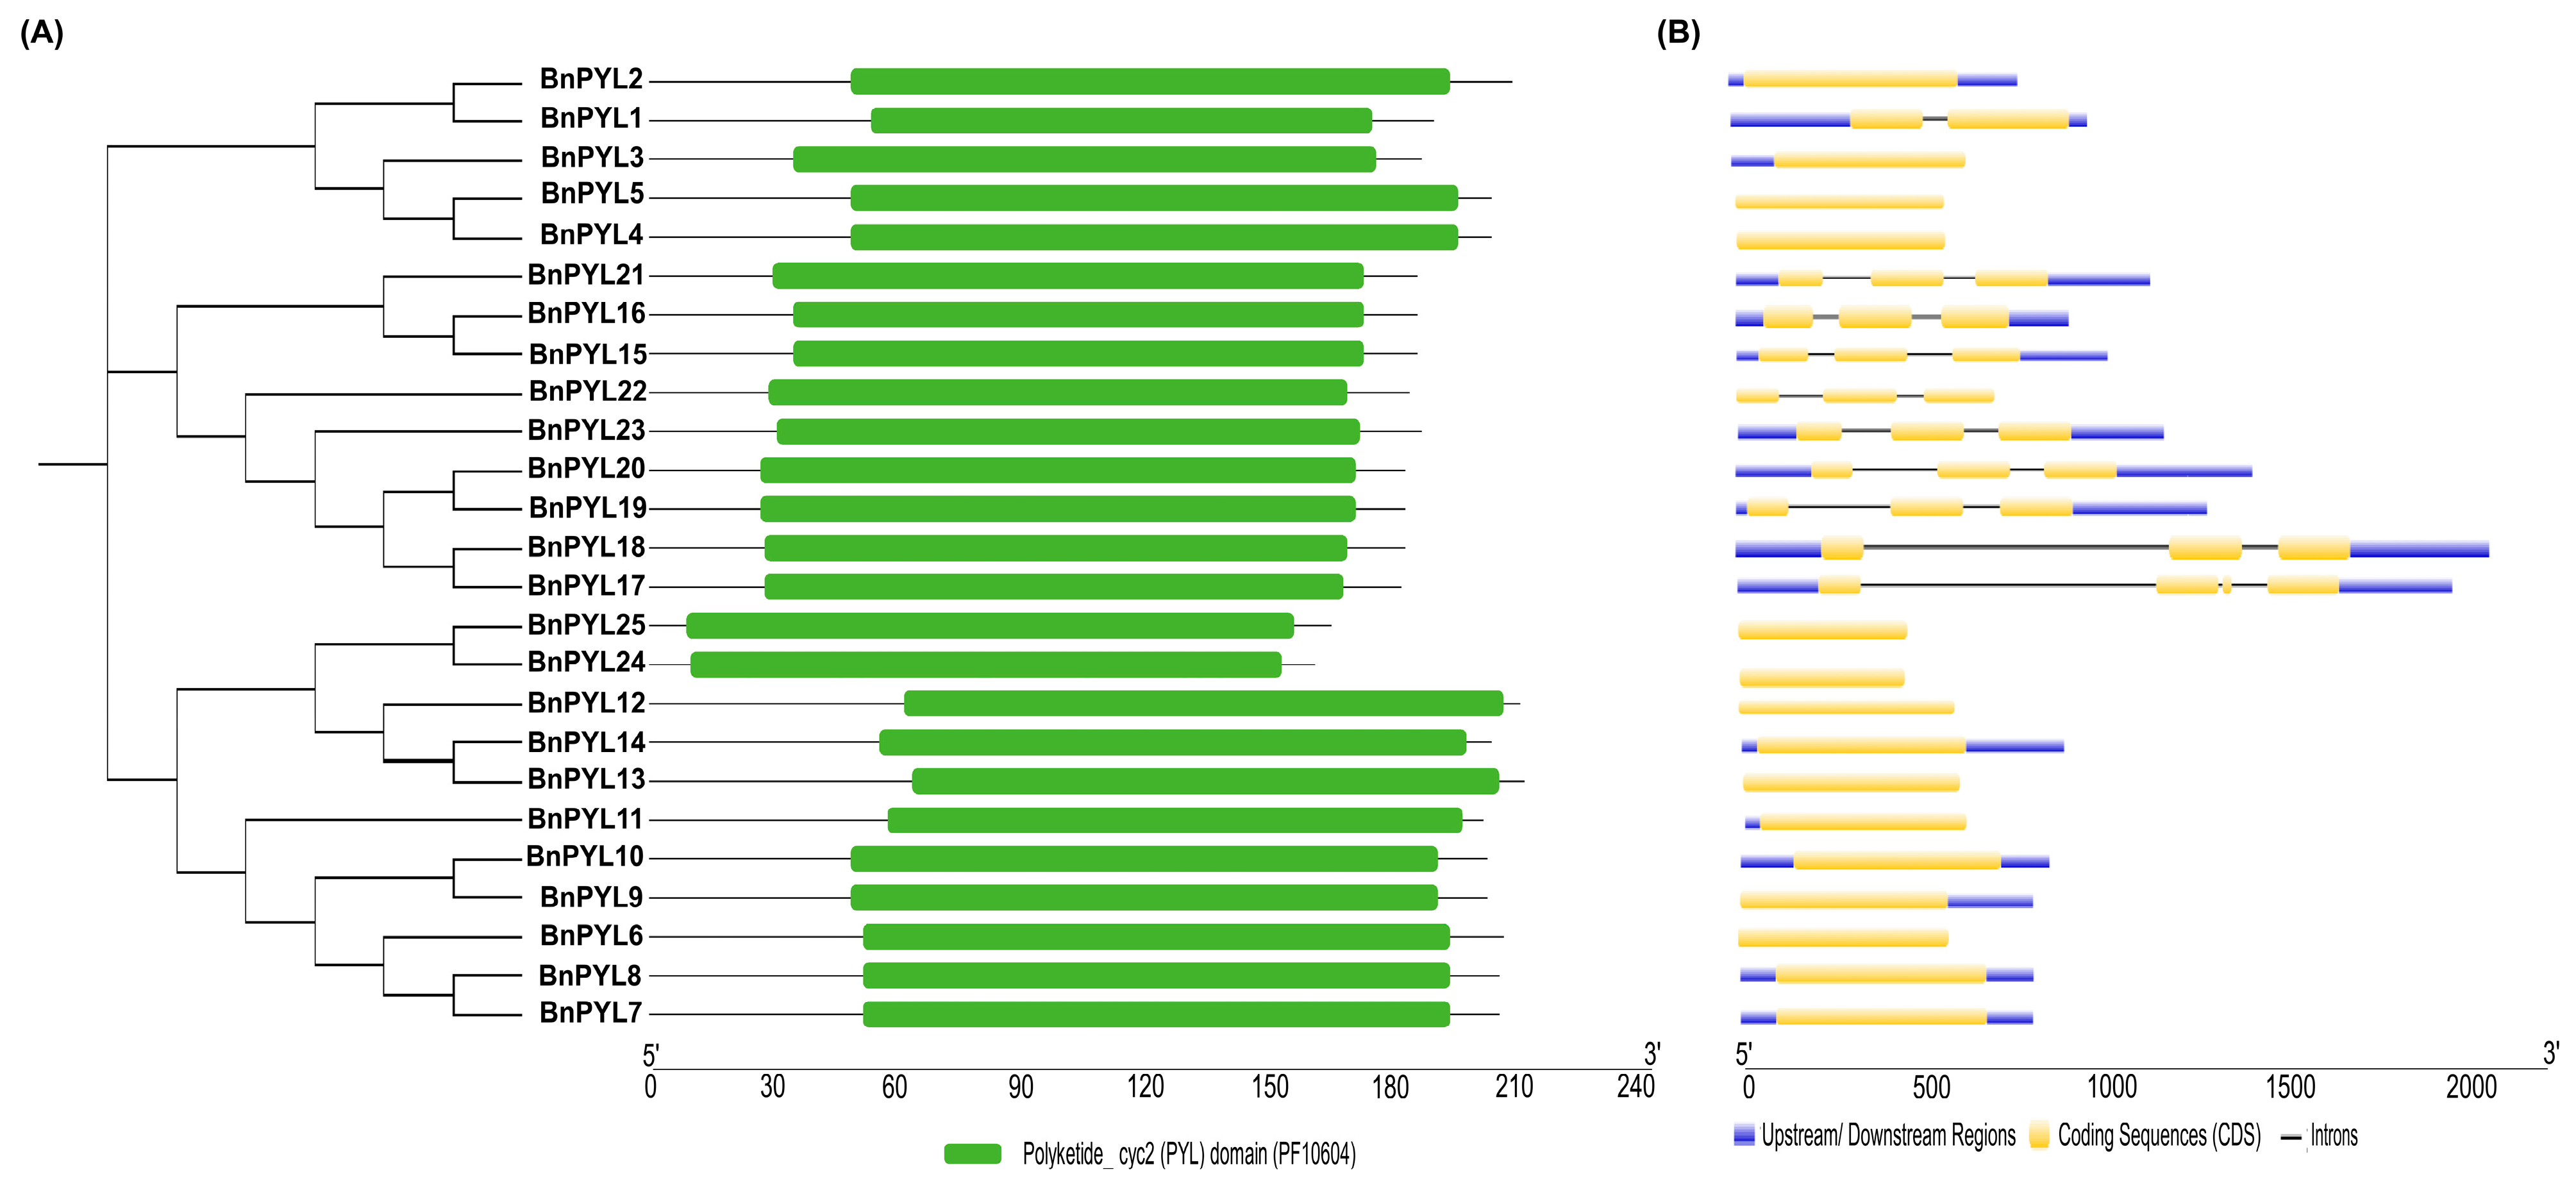
To find the functional domains in BnPYLs, prediction analysis was performed using the Pfam and NCBI CDD conserved databases. Domain composition analyses revealed that all BnPYLs contained the polyketide_cyc2 (PYL) domain (accession: PF10604), deciphering their functional potential in plant cells (Figure 3A). The identification of the conserved Polyketide_cyc2 domain further validates the annotation of these proteins as PYL family members, although the precise biological significance of this domain in BnPYL proteins remains to be experimentally clarified.
Gene structure prediction analysis revealed clear differences in exon–intron organization among the BnPYL subfamilies (Figure 3B). Genes grouped in group I-I (BnPYL17, BnPYL18, BnPYL19, and BnPYL20) generally showed more complex architectures, with most members containing three to four exons separated by multiple introns. A similar structural pattern was observed in group I-II (BnPYL15, BnPYL16, BnPYL21, BnPYL22, and BnPYL23), although minor variation in exon number and intron length was evident among individual genes. In contrast, group II members (BnPYL1, BnPYL2, BnPYL3, BnPYL4, and BnPYL5) displayed relatively simpler and more uniform structures, typically consisting of two to three exons with fewer introns. The remaining BnPYL genes, assigned to group III, were characterized by compact gene structures, with several members lacking introns and consisting of a single exon. Collectively, these patterns indicate that the exon–intron organization of BnPYL genes varies among subfamilies, reflecting structural divergence that may have contributed to functional specialization of this gene family during the evolution of B. napus.

2.4. Analysis of Motif and Their Corresponding Logo

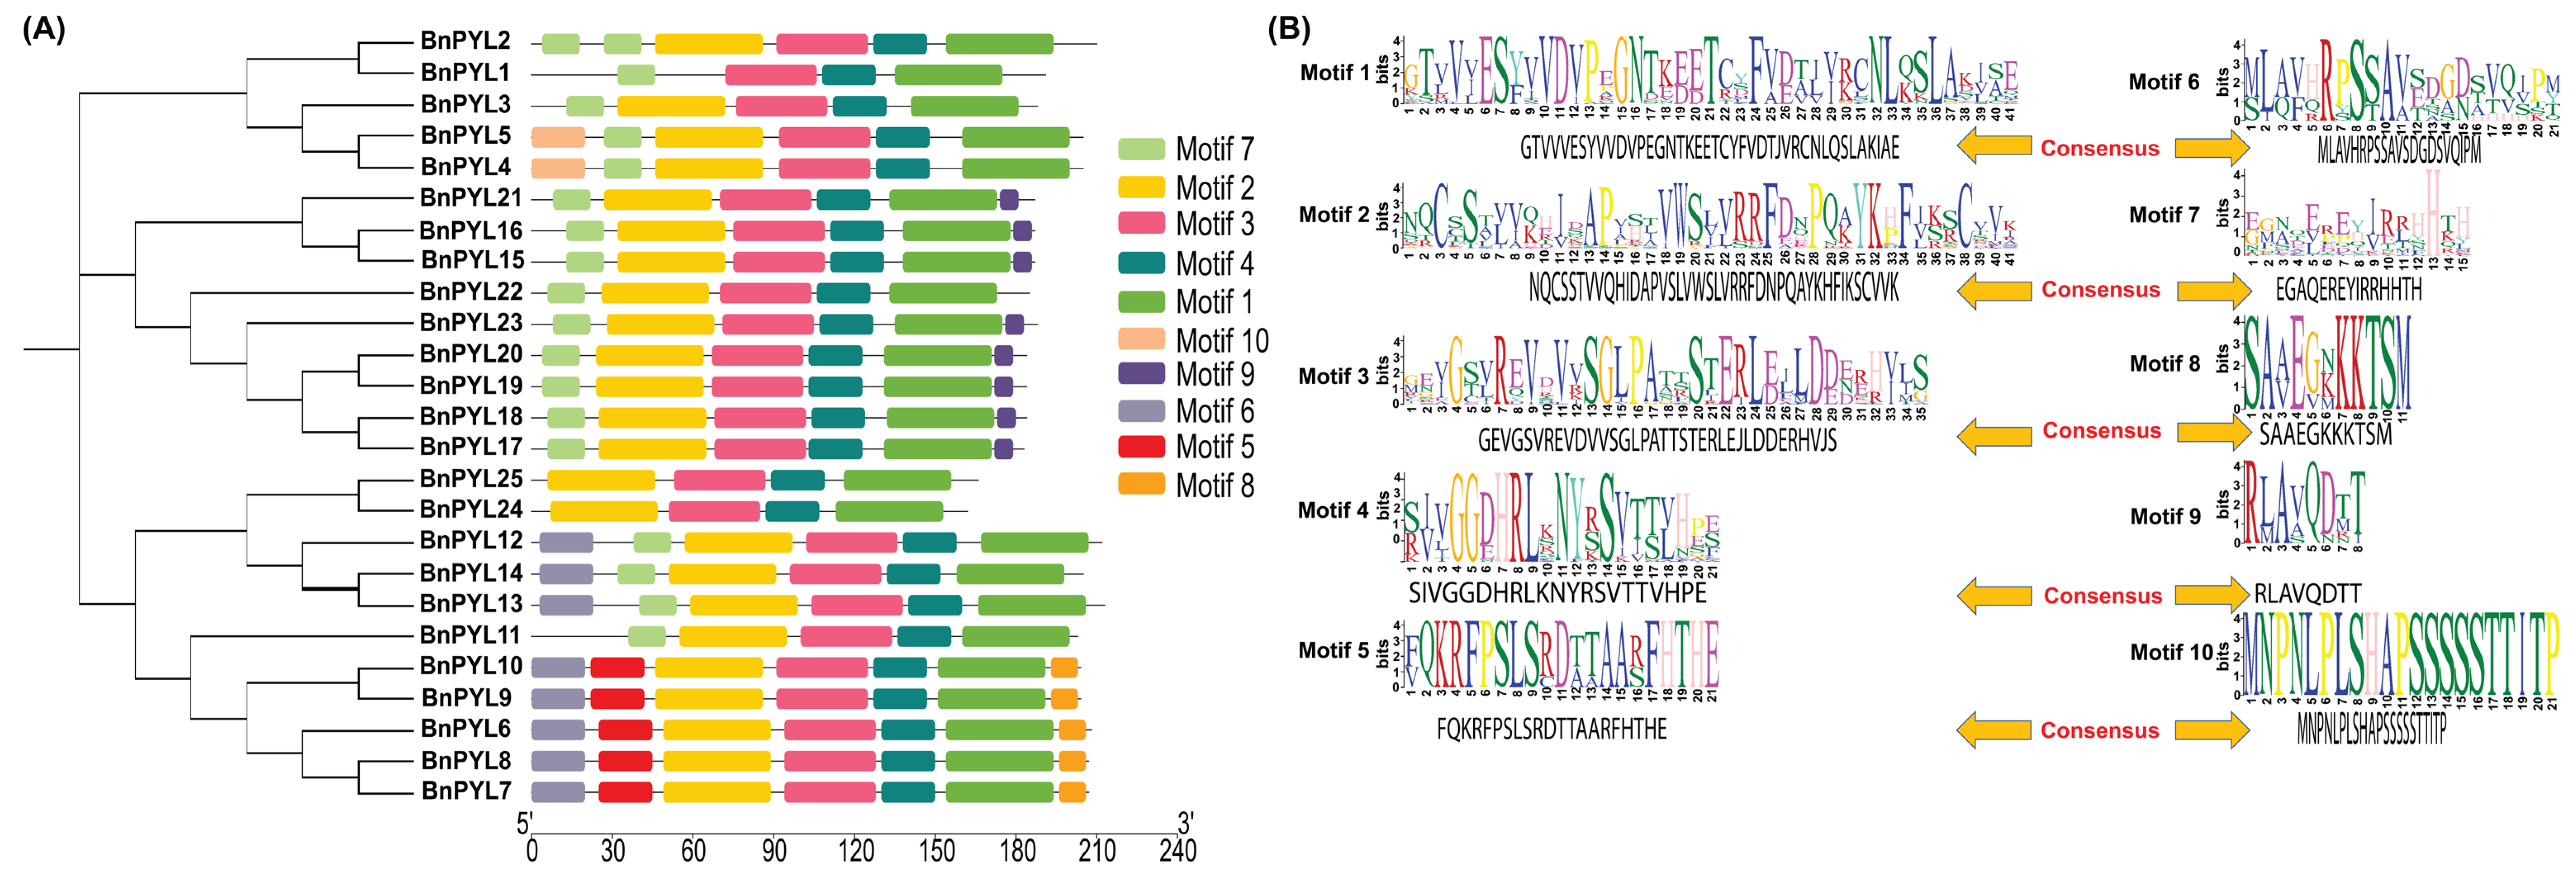
All BnPYL protein sequences were analyzed using the MEME tool identified 10 conserved motifs. These motifs varied in length, ranging from eight amino acids (Motif 9) to 41 amino acids (Motifs 1 and 2). Group I-I members (BnPYL17, -18, -19, and -20) had six motifs each, group I-II members (BnPYL15, -16, -21, -23) contained six motifs (1, 2, 3, 4, 7, and 9) each, except for BnPYL22, which contained five motifs (except motif 9). Moreover, group II members contained four to six motifs (motif 1, 2, 3, 4, 7, and 10) in BnPYL1, -2, -3, -4, -5. In group III, motif composition ranged from four motifs (1, 2, 3, and 4) in BnPYL24 and BnPYL25 to seven motifs (1, 2, 3, 4, 5, 6, and 8) in BnPYL6 to BnPYL10. Motif 5 was unique to these five members, whereas motif 6 was additionally conserved in BnPYL12 to BnPYL14, indicating structural divergence within group III. Overall, the members of group III contained two distinct motifs (motif 6 and 8) compared to other BnPYLs (Figure 4A). The logos of the respective motifs are also presented with their respective amino acid consensus (Figure 4B). These results suggested that all identified BnPYLs contained motif 3 (characteristic SGLP gate motif).

2.5. Sequence Alignment Analysis for BnPYLs

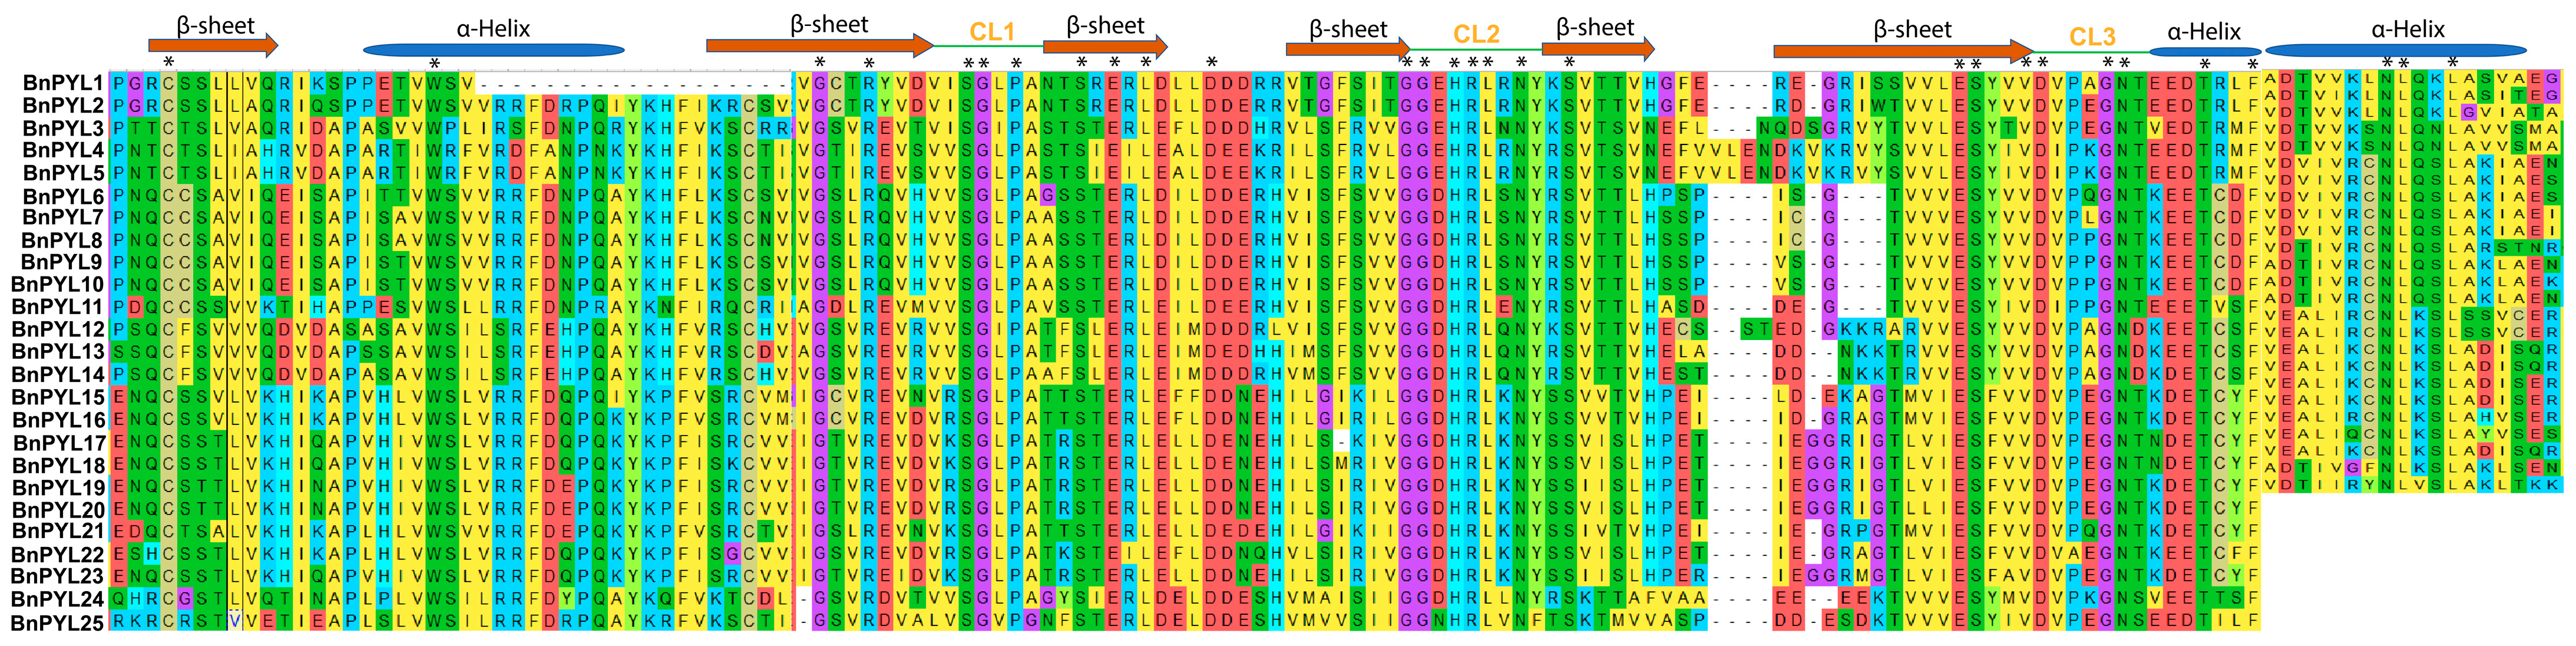
Multiple sequence alignment of BnPYL proteins revealed a high degree of sequence conservation, particularly within the core regions corresponding to the polyketide_cyc2 (START) domain (Figure 5). Several conserved residues were consistently observed across all members, indicating structural stability and functional conservation of the PYL family in B. napus. Notably, the characteristic SGLP gate motif and adjacent conserved amino acid residues were well preserved among most BnPYLs, suggesting their essential role in ABA binding and signal transduction. Moreover, three conserved loop regions (CL1–CL3) were also predicted in BnPYLs with their respective three alpha helix (α-helix) regions and six beta-sheets (β-sheets) regions. Importantly, CL1 and CL3 correspond to the N- and C-terminal associated flexible regions, respectively, whereas CL2 is embedded within the central structural framework of the protein. This distribution of conservation suggests that the central region is under stronger evolutionary constraint, while terminal-associated regions are more permissive to sequence variation, potentially contributing to functional diversification among BnPYL members.
Overall, the alignment highlights that BnPYL proteins maintain a conserved structural scaffold while exhibiting limited but meaningful sequence variability, which may contribute to their functional specialization in ABA-mediated stress responses.

2.6. Promoter Profiling Analysis in BnPYLs

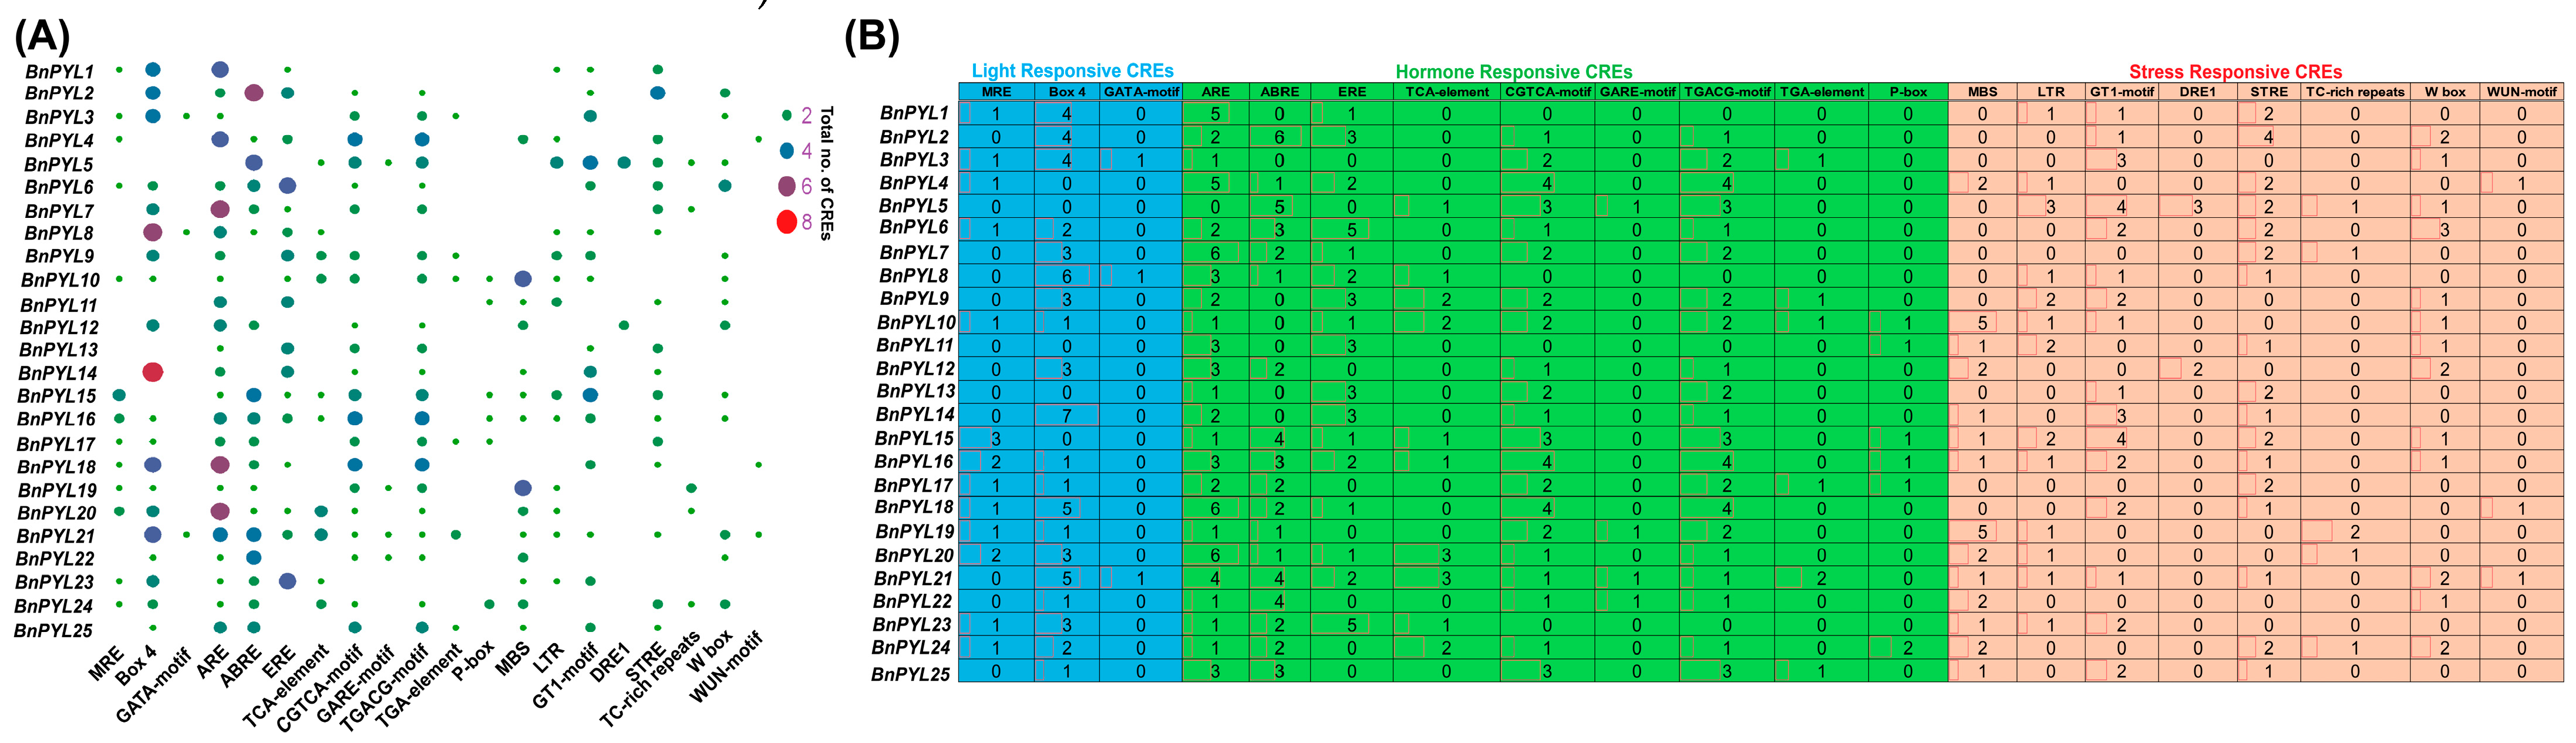
To infer putative functions of BnPYL genes, cis-acting regulatory elements (CREs), located within the 2 kb-upstream promoter regions were identified using the search scan program in the PlantCARE database. These predicted CREs should be considered potential regulatory motifs only and do not provide direct evidence of transcriptional regulation or stress inducibility. Most of the B. napus genes were enriched with hormone-, light-, and stress-related CREs, predicting their functions under multiple stresses in plants (Figure 6).
These CREs, including MRE, BOX4, and the GATA motif, were characterized as light-responsive CREs; ARE, ABRE, ERE, TCA-element, CGTCA-motif, GARE-motif, TGACG-motif, TGA element, and P-box were predicted as hormone-responsive CREs, and, lastly, MBS, LTR, GT1-motif, DRE1, STRE, TC-rich repeats, W-box, and Wun-motif were considered stress-responsive CREs. Box4 was found abundantly among light-responsive CREs (60); among all identified BnPYLs, BnPYL14 exhibited a maximum of seven Box4 elements. Furthermore, this analysis identified a substantial presence of ABA-responsive CREs, with ABRE motifs being particularly prevalent, suggesting that the expression of BnPYL genes is predominantly influenced by ABA-mediated signaling. Additionally, the detection of TGACG- and CGTCA-motifs indicates that these genes may also participate in broader stress-responsive hormonal networks, implying potential interactions between ABA signaling and other regulatory pathways. Among them, BnPYL2 exhibited a maximum of six ABRE elements, while BnPYL4, -16, and -18 had four (TGACG-motif and CGTCA-motif) each. Lastly, three CREs—including STRE (29), which was found in all identified BnPYLs, specifically in BnPYL2 (four), GT1-motif (32), which was found in BnPYLs (four were found in two BnPYLs, namely BnBYL5 and BnPYL15), and MBS elements (27)—were among the most frequently occurring, especially in BnPYL10 (5) and BnPYL19 (5), indicating that these genes are likely responsive to light and drought-stress conditions. DRE1 and WUN-motif elements were less common, suggesting more limited regulation by dehydration and wounding stimuli. The occurrence of multiple putative ABRE motifs in several BnPYL promoters may indicate a possible association with ABA-responsive pathways; however, additional experimental analyses are necessary to validate these predicted regulatory relationships (Figure 6A,B). Overall, the prediction of CREs suggests possible functions of BnPYLs, regulated through complex networks involving multiple stress or hormonal pathways.

2.7. Homology Modelling of PYL Proteins in B. napus

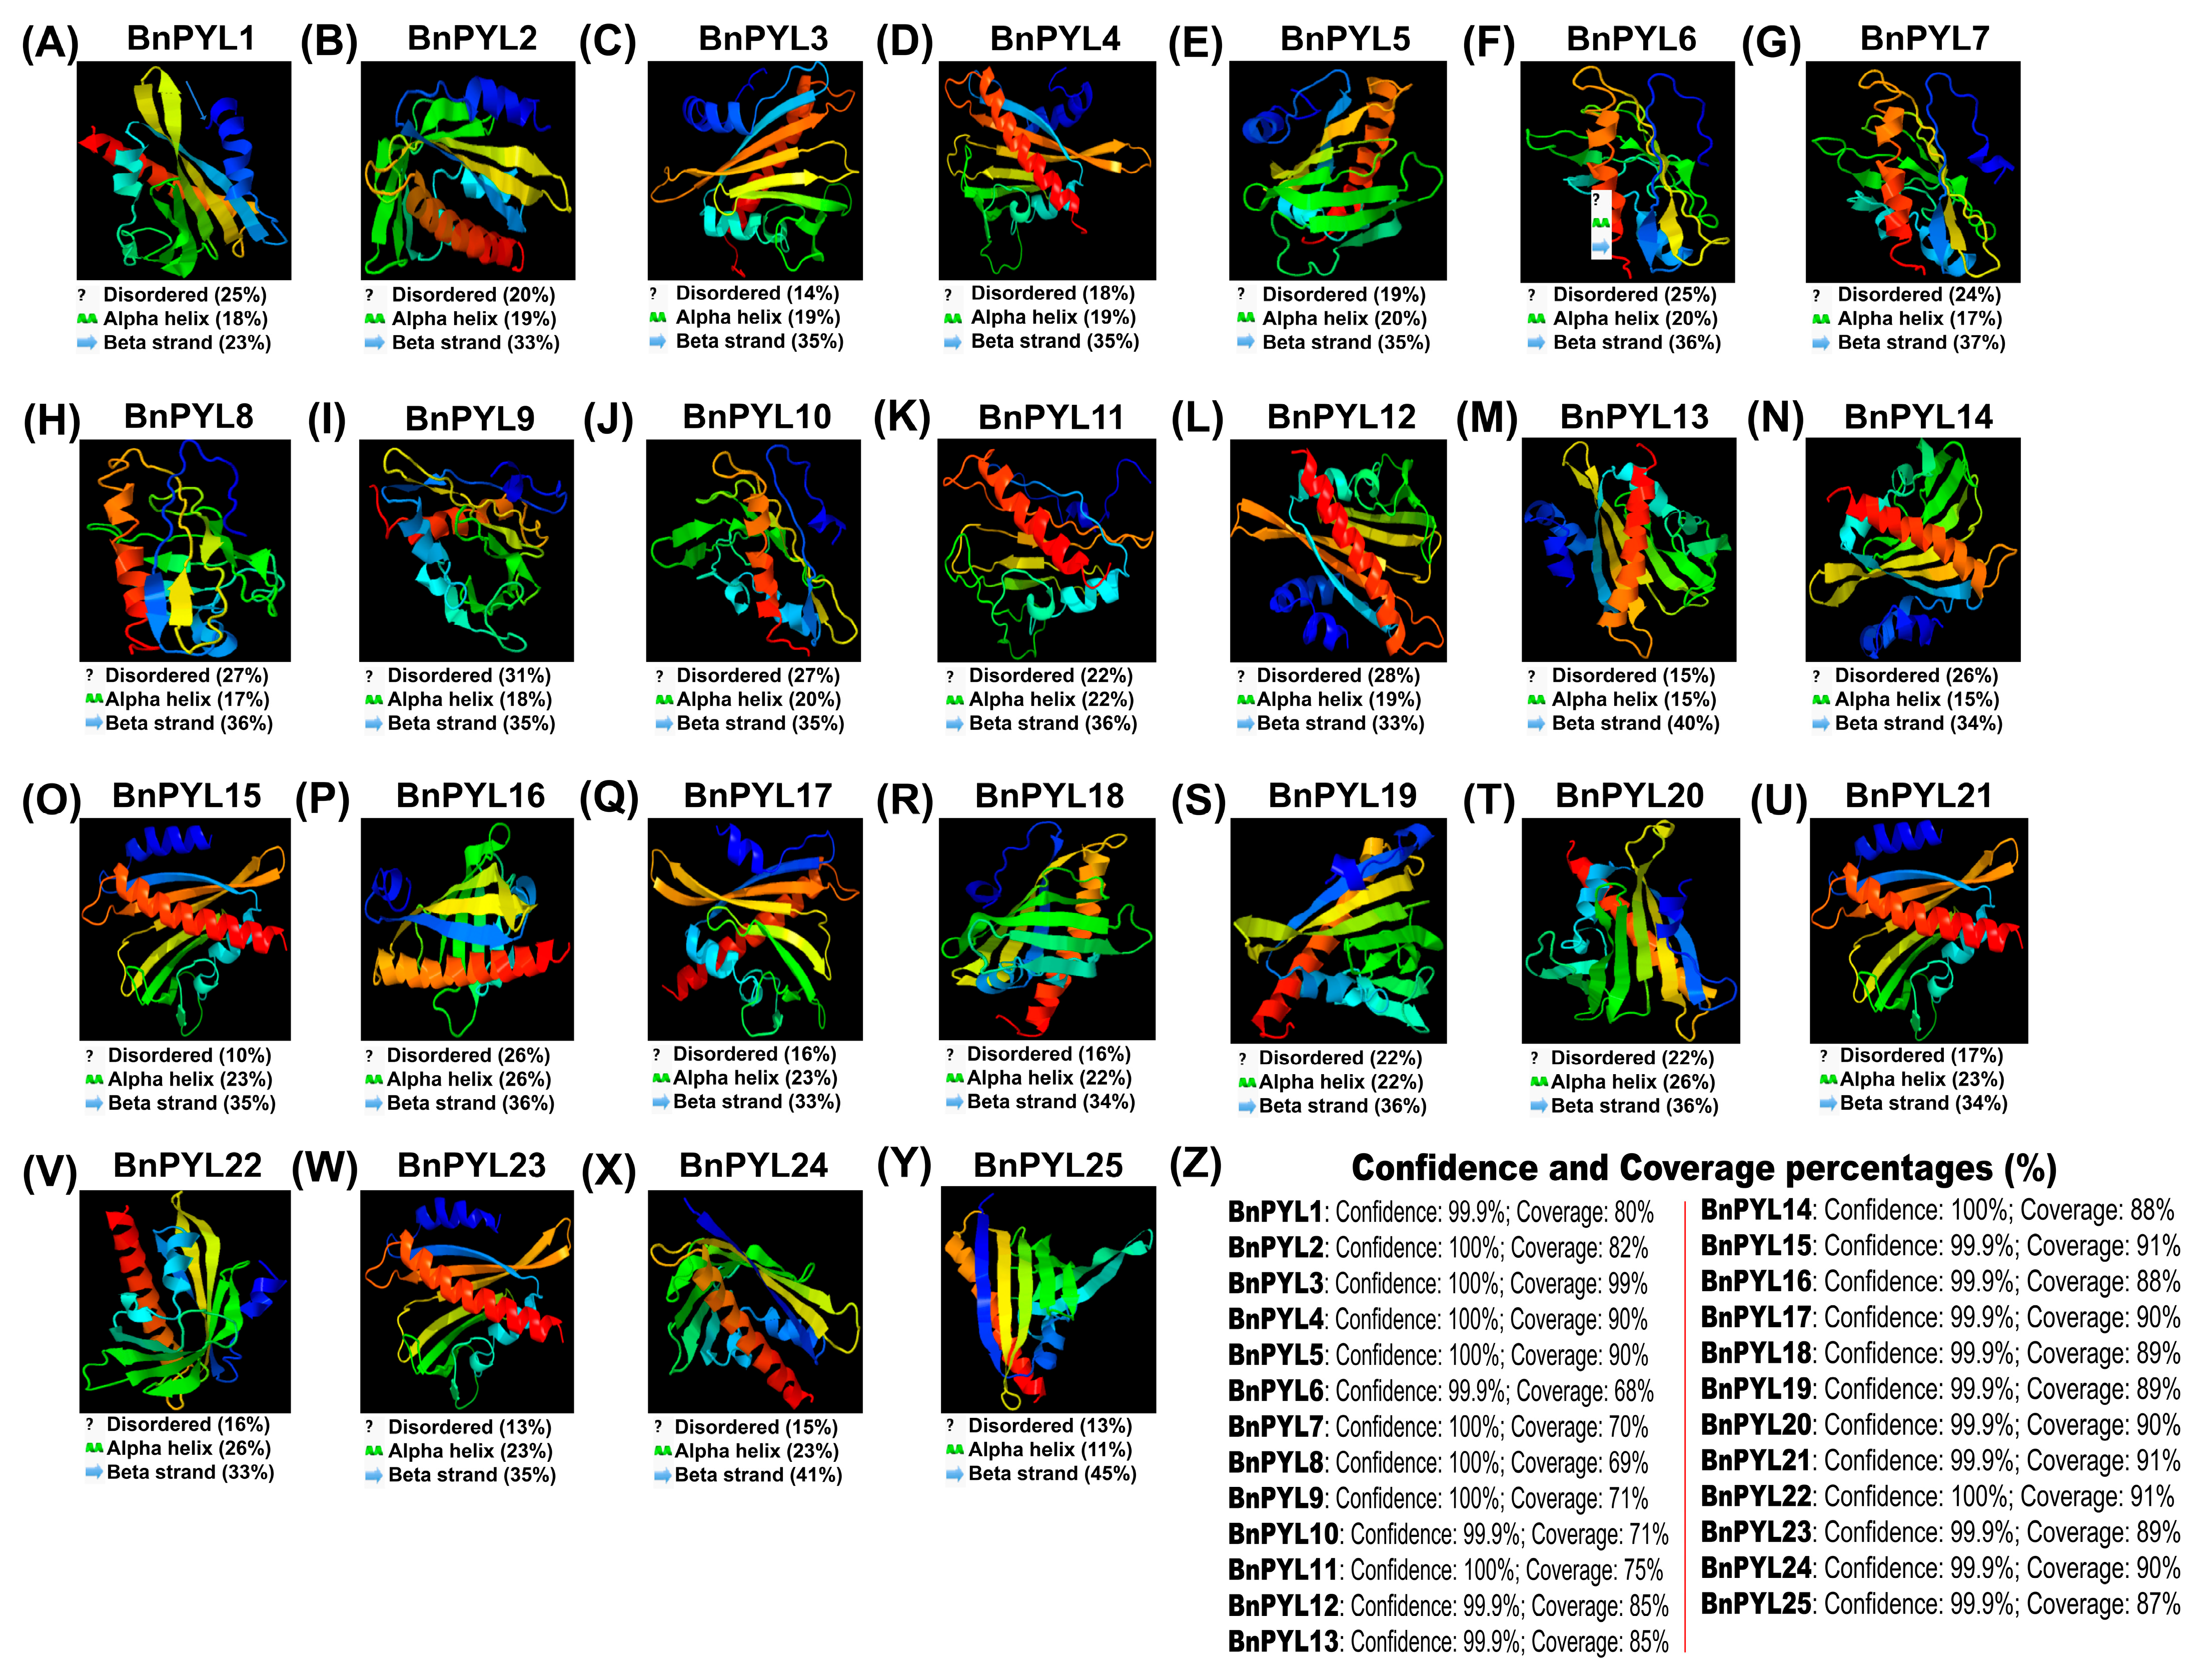
All B. napus PYL family members were computationally modelled in three dimensions using the Phyre2 server [27]. These structural models represent predicted protein structures rather than experimentally determined structures. Some differences in domains among members of PYL proteins in B. napus may lead to distinct responses to various stresses. We analyzed the protein folding patterns based on their secondary structure and predicted their functions from tertiary structure. The results showed that the 25 family members of BnPYL proteins contained a large number of α-helices, β-sheets, and disorders (Figure 7). Group I-I and I-II members exhibited higher α-helix content, with BnPYL16, BnPYL20, and BnPYL22 showing the highest proportion (up to 26%), indicating strong structural conservation within these subfamilies. In contrast, group III members displayed relatively higher proportions of β-sheets and disordered regions, reaching up to 45% and 31% in BnPYL25 and BnPYL9, respectively, suggesting greater structural flexibility and potential functional divergence. On the other hand, β-sheets and disordered sequences predicted maximum in group III members with maximum of 45% and 31% in BnPYL25 and BnPYL9, respectively. All of the predicted BnPYLs structures obtained with an overall confidence score of 99.9% and coverage ranging from 68% (BnPYL6) to 99% (BnPYL3), revealing group-dependent protein structures among BnPYLs. Importantly, proteins within group I-I and I-II were identified as the most structurally conserved members, sharing highly similar domain organization and secondary structure composition, which suggests closer functional similarity among them.

2.8. Protein Interaction Networks Analysis of BnPYLs

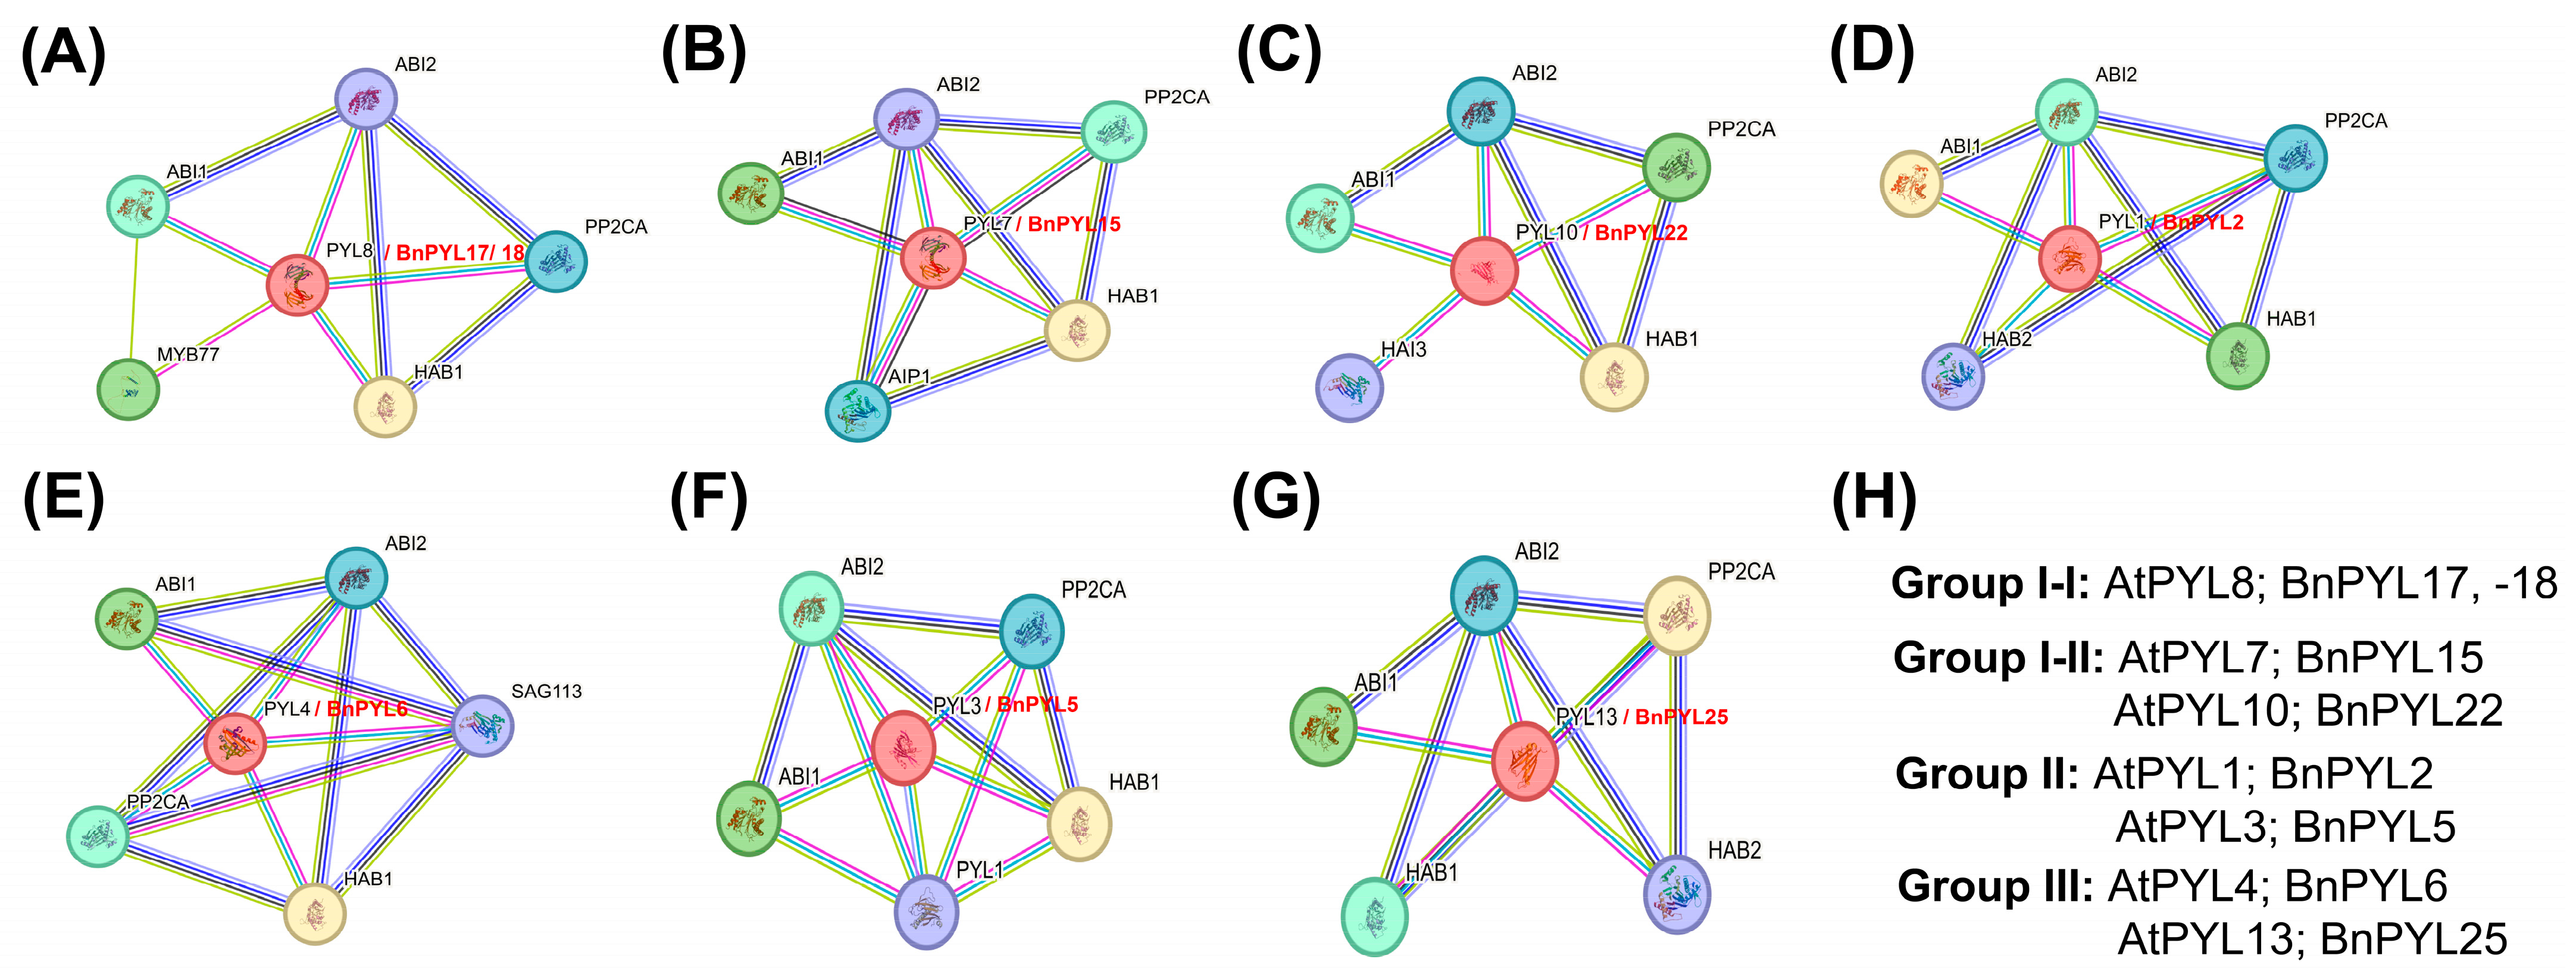
The STRING database was used to predict the protein–protein interactions (PPI) of the BnPYLs, which enhanced our understanding of the biological function and regulatory network associated with them. The results showed that seven AtPYLs interacted (homologs of some highly expressed BnPYLs under drought stress via RT-qPCR) with 10 functional proteins, including ABI2, PP2CA, HAB1, HAB2, MYB77, ABI1, AIP1, HAI3, SAG113, and PYL1 (Figure 8). Due to PYL protein involvement in ABA signaling, their interacting proteins were expected to be involved in the ABA signaling complex. As expected, most of the predicted interacting proteins are key and functionally validated components of the ABA signaling pathway. Notably, two E-clade protein phosphatase 2Cs, ABI1 and ABI2, have been reported to perform partially redundant roles in ABA signaling, which may contribute to maintaining signaling homeostasis [28,29]. Additionally, PP2Cs and HAB1/HAB2 played a major role in regulating ABA signaling under both stress and normal growth conditions [30,31], and MYB77 enhanced K+ uptake and improved tolerance to low K+ stress [32]. Additionally, AIP1 achieved an optimal balance between resistance to tissue tension and morphogenesis [33]; the functional involvement of HIGHLY ABA-INDUCED (HAI) PP2Cs, including AIP1/HAI2, HAI1, and HAI3, has been reported in cold stress-induced inhibition of germination [34]. Moreover, ABA inhibits stomatal closure through the AtNAP-SAG113 PP2C regulatory module during leaf senescence [35], and, finally, the wheat ABA receptor gene TaPYL1-1B plays a crucial role in enhancing drought tolerance [36]. Although our analysis offers predictions, experimental validation will be necessary in future studies to thoroughly explore the relevance of these findings.

2.9. PTM Sites Prediction in BnPYL Proteins

Phosphorylation sites involving the attachment of the phosphate group to serine, threonine, and tyrosine residues of BnPYL proteins. Generally, all BnPYL proteins contained the full set of the phosphorylation sites described above. Three BnPYLs, namely BnPYL7, -9, and -10, had the highest number of potential serine phosphorylation sites (22), BnPYL4 and BnPYL5 contained eleven potential threonine sites, and, lastly, five BnPYLs (BnPYL17, -18, -19, -20, and -22) had the maximum number of tyrosine sites (two) (Table 2). These findings suggest that BnPYL proteins are likely to be phosphorylated.
In addition, all analyzed BnPYL proteins, except BnPYL11 and BnPYL13, were predicted to possess lysine acetylation sites, ranging from one to two sites per protein. These computational predictions indicate that lysine acetylation may represent a common post-translational modification among BnPYL proteins. Moreover, among the BnPYL proteins, BnPYL14, -15, -16, -17, -18, -21, and -25 contained the highest number of glycosylation sites (two) and 40% of BnPYLs (10 BnPYLs) did not contain a single glycosylation site at the asparagine residue (Table 2). As a result, only 60% of the predicted PYLs contained the ‘Asn’ residue, implying that PYL proteins can also be glycosylated.
In addition, acetylation, ubiquitination, and SUMOylation PTM sites at lysine (K) residues have been predicted among all BnPYLs. More than 90% of BnPYLs exhibited acetylation sites, with a maximum two sites, except for BnPYLs (BnPYL11 and BnPYL13), indicating that BnPYLs are highly acetylated at the lysine residue. In the case of the ubiquitination PTM site, only seven BnPYLs (around 28%) contained a ubiquitination site at the lysine residue (K), suggesting that BnPYLs are much less ubiquitinated. Lastly, SUMOylation sites were also predicted in BnPYLs. Only three BnPYLs (BnPYL4, -5, and -22) contained SUMOylation sites at the lysine (K) residue, demonstrating that BnPYLs are poorly enriched in SUMOylated proteins. These predicted post-translational modification sites are based on computational analyses only and require experimental validation to confirm their occurrence and biological relevance in vivo.

2.10. Expression Profiling of BnPYLs via RT-qPCR Analysis

2.10.1. Expression Patterns in Plant Roots and Leaves

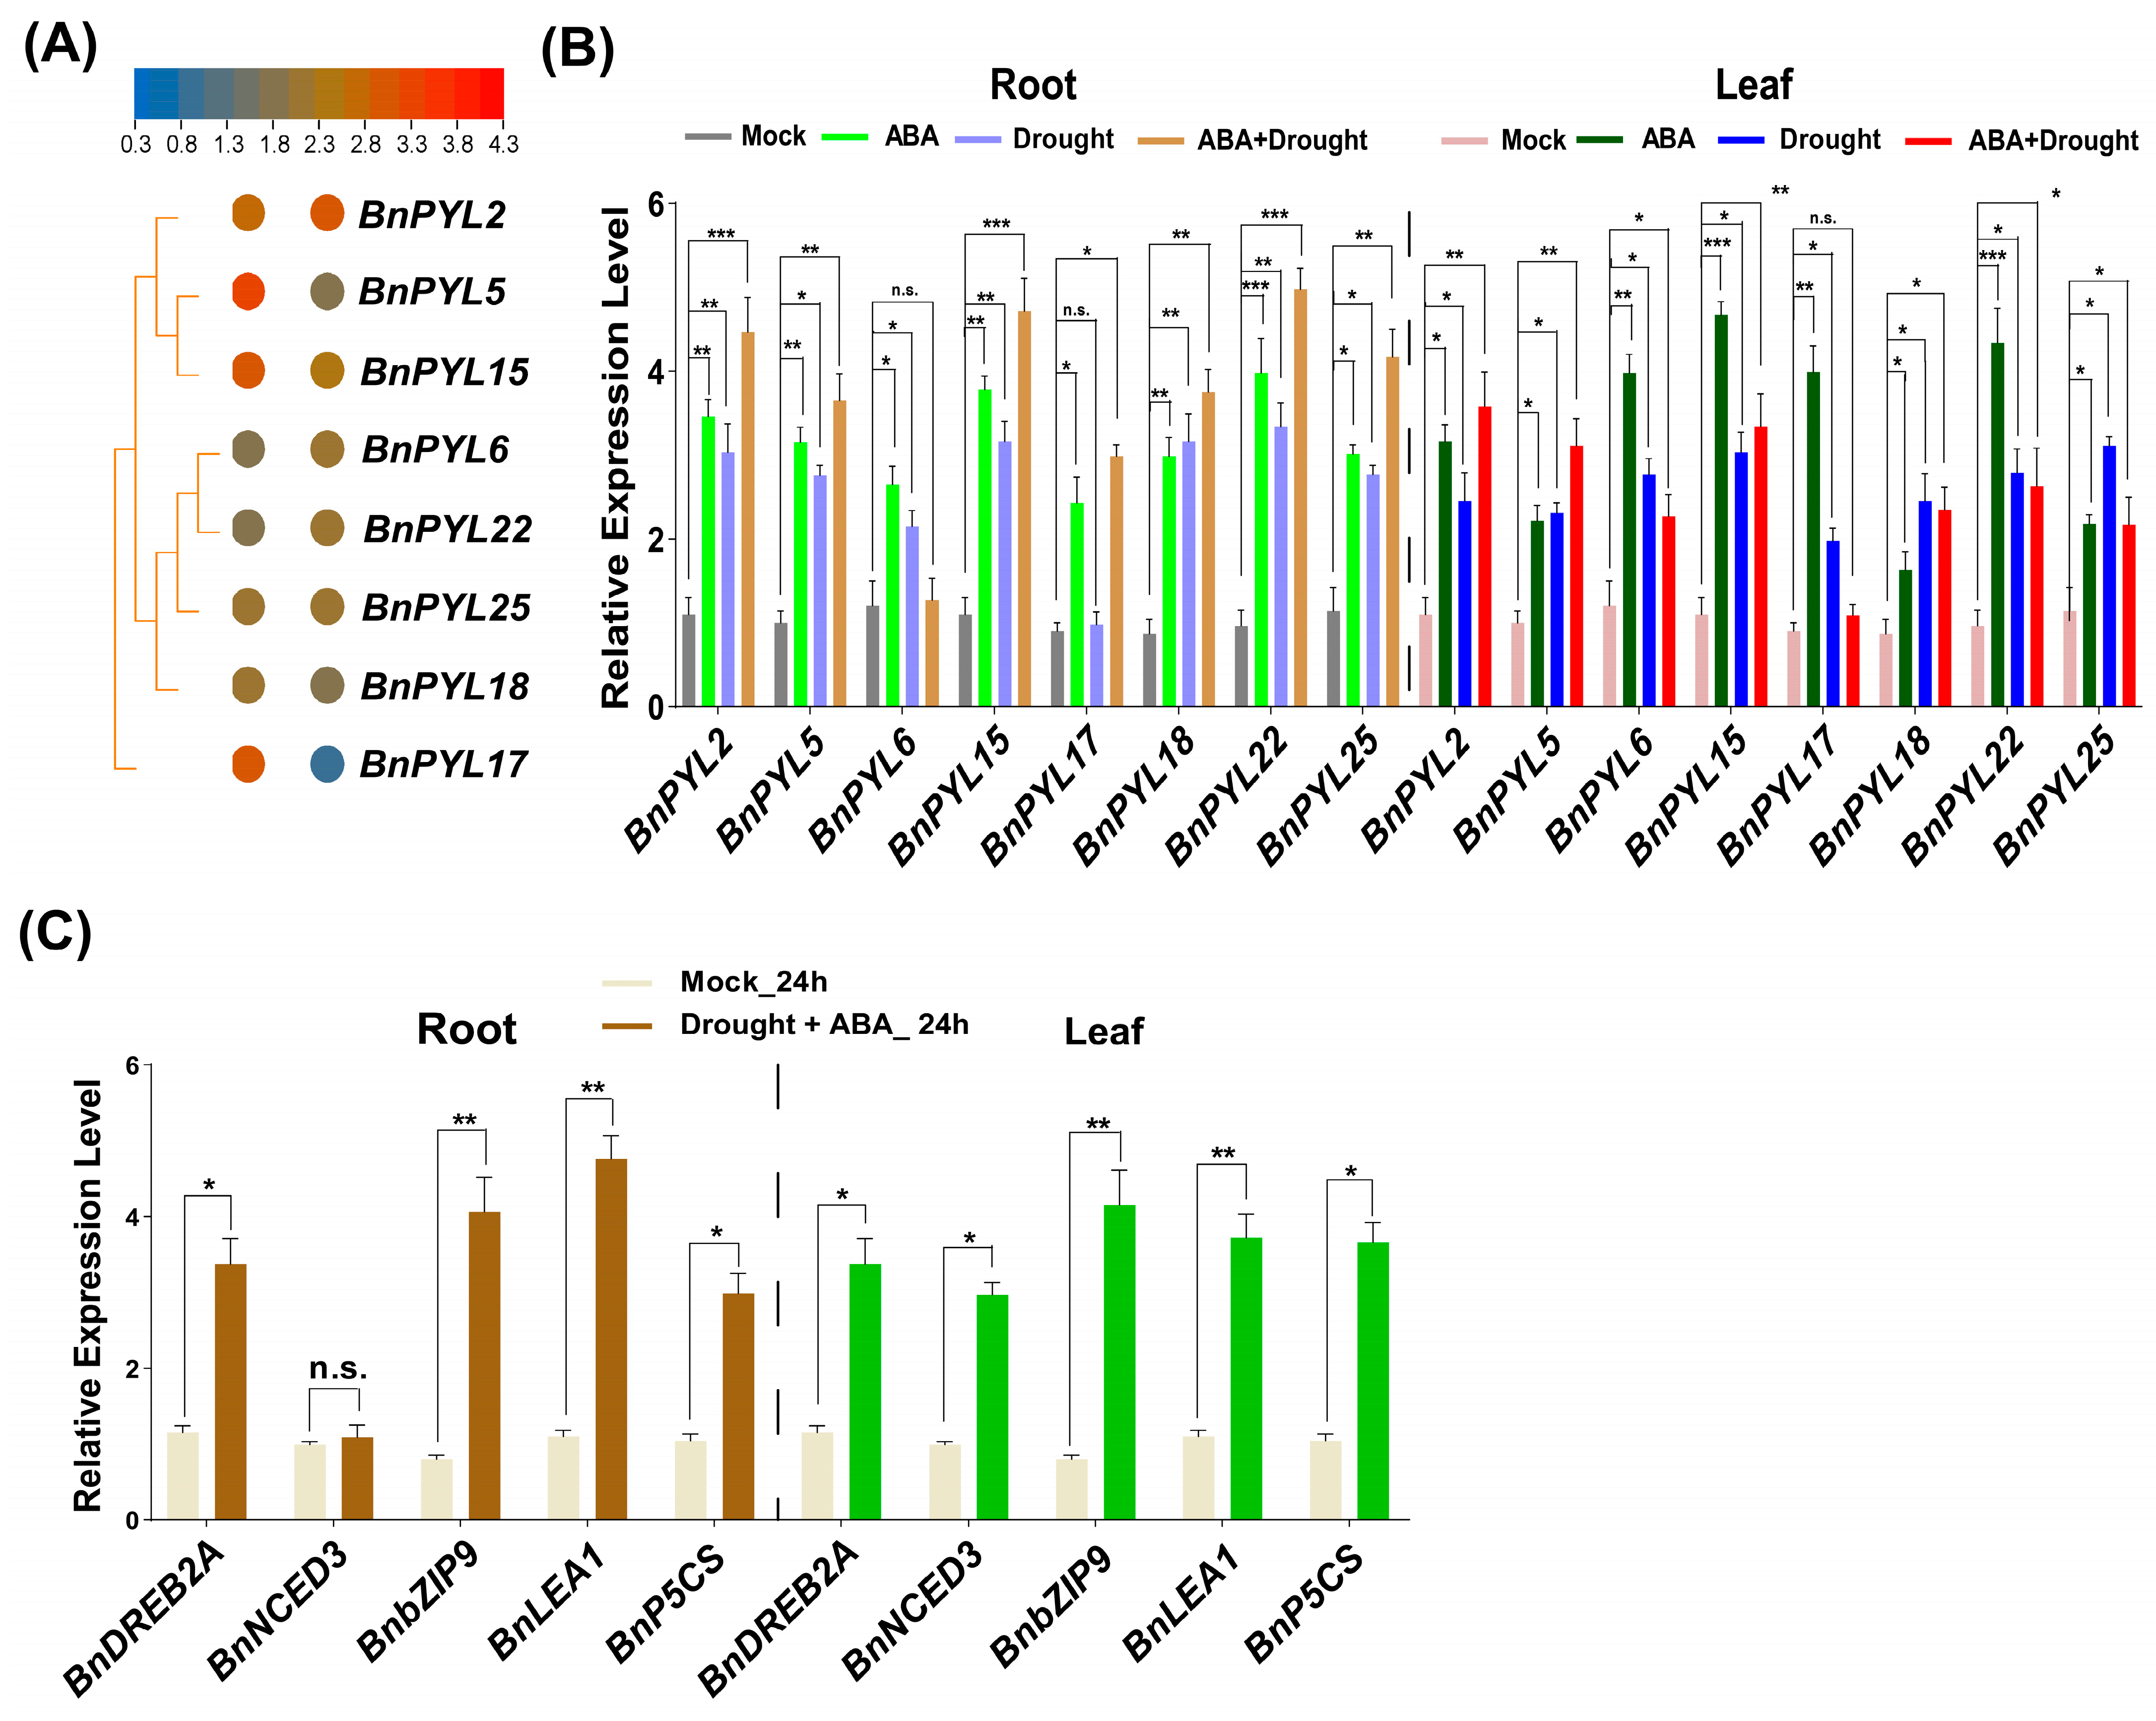
The RT-qPCR results demonstrate distinct expression patterns of BnPYL genes in leaves and roots. Several genes, including BnPYL2, BnPYL5, BnPYL15, and BnPYL17, showed relatively higher expression in roots (up to ~3.5-fold) compared with other analyzed genes, whereas overall expression levels were lower in leaves. Notably, BnPYL17 exhibited lower expression in leaf tissues, further highlighting tissue-dependent expression specificity (Figure 9A).

2.10.2. Expression Profiling of BnPYLs Following ABA Applications Under Drought Stress

The expression profiles of eight BnPYL genes, selected based on ABA- and drought-responsive cis-elements in their promoters, were analyzed under ABA and drought treatments, with two representative genes from each phylogenetic group assessed at 24 hpt. To evaluate the activation of early signaling pathways in response to drought stress, two genes (BnPYLs) from each group were selected, and relative expression was noted after 24 hpt. The transcriptional regulation of the selected BnPYL genes was significantly higher in plant roots as compared to plant leaves. The RT-qPCR analysis revealed a distinct pattern of ABA-induced gene expression. Genes from subfamilies I–II displayed the most pronounced transcriptional changes, whereas group III genes exhibited relatively modest alterations (Figure 9B). Among the I–II genes, BnPYL15 and BnPYL22 showed the strongest induction. In root tissues, these two genes were up-regulated by approximately 4-fold and 5-fold, respectively, relative to mock-treated controls. In leaves, the induction was ~3-fold for BnPYL15 and ~4-fold for BnPYL22, indicating a stronger root-specific response. These findings underscore a tissue-specific activation of ABA signaling pathways during drought stress, with BnPYL15 and BnPYL22 playing key roles. The relative expression of BnPYL17 (group I-I) was noticeably relatively lower (~1.5-fold) following ABA application under drought stress, while its expression was not induced prominently under drought stress only in roots as compared to mock-treated control plants. On the other hand, BnPYL17’s expression was noticeably non-significant even after combined treatment (ABA and drought) in plant leaves. Moreover, BnPYL2 (group II) exhibited the highest expression after ABA application under drought stress (2~3.5-fold) in plant roots, while its expression was recorded as significantly lower (1~2.5-fold) in plant leaves. Lastly, BnPYL6 was transcriptionally induced significantly (1~3-fold) in plant roots; on the contrary, its expression was relatively lower (1~2-fold) in plant leaves (Figure 9B). Overall, the genes from group I-II had the highest relative expression level in plant roots as compared to other group genes after ABA application under drought stress, and this may depend on ABA or drought-stress treatment.

2.10.3. Expression Profiling of ABA-Mediating Drought Tolerance-Marker Genes

To examine the transcriptional response of drought-associated marker genes during the early stages of drought-responsive signaling following ABA treatment under drought stress conditions, the expression patterns of BnDREB2A, BnP5CS, BnLEA1, BnNCED3, and BnbZIP9 were analyzed using RT-qPCR. The results showed that all examined genes were transcriptionally induced in both roots and leaves compared with mock-treated plants. Notably, BnLEA1 and BnbZIP9 (3.5~4.5-fold) showed the strongest expression in ABA- and drought-stress-treated plant roots as compared to mock-treated plants. On the other hand, the transcriptional regulation of both genes showed relatively low expression patterns in plant leaves as compared to the plant roots. Except for one drought-tolerant marker gene (BnNCED3), all other analyzed genes showed an induction of about 1~3-fold (Figure 9C). All of these data, collected at 24 hpt, suggest that ABA treatment activates early drought-responsive transcriptional pathways in B. napus, particularly in root tissues.

3. Discussion

In the present study, we identified 25 BnPYL genes in the B. napus genome, including 11 genes distributed on the A-subgenome, nine genes on the C-subgenome, and five genes located on unanchored scaffolds. Among them, one chromosome, C03, contained a maximum of four BnPYL genes (BnPYL4, -7, -13, and -18). We also predicted the evolutionary relationships of BnPYLs with A. thaliana and B. rapa PYLs and found that these PYLs have quite similar evolutionary relationships with their other respective PYLs (Figure 2). The identified BnPYL proteins were assigned to the PYL family based on multiple lines of evidence, including the predicted presence of the conserved polyketide_cyc2 (PYL) or START domain in all members (Figure 3A). Gene structure analysis demonstrated that four genes from I-I (BnPYL17, BnPYL18, BnPYL19, and BnPYL20) and five members from I-II (BnPYL15, BnPYL16, BnPYL21, BnPYL22, and BnPYL23) generally showed more complex architectures, with most members containing three to four exons separated by multiple introns (Figure 3B). Our results are quite similar to the previous findings in which eggplant’s PYL (group I) contained a similar kind of architecture [19]. Moreover, the motif analysis results were quite similar (Figure 4A) to some previous findings [20,22,36] in which a highly conserved SGPL-gate motif (motif 3) was predicted as a functional motif for PYLs. Furthermore, sequence alignment analysis demonstrated the protein structures, including α-helix, β-sheets, and conserved loop regions (Figure 5), indicating structural conservation with previously characterized PYL proteins from other plant species [24,25].
Interestingly, in-silico promoter analysis revealed that most BnPYLs harbor stress-related cis-regulatory elements, including light-responsive, phytohormone-responsive, and stress-associated CREs, suggesting their potential involvement in phytohormone- and stress-responsive regulatory pathways in rapeseed (Figure 6). These results are well co-aligned with several previous studies on eggplant [19], pear [23], potato [37], sweet potato [38], and rice [24], in which PYL genes were predicted to be highly responsive to abiotic stresses and phytohormone application.
Protein tertiary structure predictions revealed high structural similarity among BnPYL proteins, with subtle variations observed within subfamilies (Figure 7), suggesting conserved evolutionary characteristics consistent with those reported in other plant gene families [39,40]. Protein–protein interaction predictions suggested that seven AtPYL homologs, corresponding to highly expressed BnPYLs identified through RT-qPCR under drought stress, are associated with ten key regulatory proteins, including ABI2, PP2CA, HAB1, HAB2, MYB77, ABI1, AIP1, HAI3, SAG113, and PYL1 (Figure 8). Due to PYL protein involvement in ABA signaling, their interacting proteins were expected to be involved in the ABA signaling complex. As anticipated, the majority of the proteins predicted to interact were crucial and functionally verified constituents of the ABA signaling complex, such as two E-clade protein phosphatase 2Cs (ABI1 and ABI2), which appear to assume partially redundant functions in ABA signaling, and this may provide a mechanism to maintain informational homeostasis [28,29]. Overall, the predicted interaction profiles are consistent with previously characterized ABA signaling components and suggest that BnPYLs may participate in conserved ABA-related regulatory networks. However, these predicted interactions require further experimental validation.
As a key regulator of protein function, PTM plays an important role in cellular activity. Here, we critically analyzed five PTM types, including phosphorylation, glycosylation, acetylation, ubiquitination, and SUMOylation, in BnPYLs. The in-silico prediction results indicated that BnPYL proteins possess multiple potential PTM sites (Table 2). CBL1/9–CIPK1 signaling complexes have been reported to modulate drought stress responses through phosphorylation of ABA receptors belonging to the PYL family [41]. In particular, a conserved serine residue located in the C-terminal region of PYL proteins has been identified as a phosphorylation site targeted by interacting CIPKs, which contributes to regulating the activity and substrate specificity of CBL–CIPK signaling complexes [42]. Collectively, these predictive observations suggest that B. napus PYL proteins are also likely to undergo phosphorylation at serine residues. Furthermore, it would be worthwhile to explore whether phosphorylation may additionally occur at threonine and tyrosine residues, as suggested by our computational predictions.
Our expression analyses revealed differential transcript accumulation patterns of several BnPYLs (BnPYL2, BnPYL5, BnPYL6, BnPYL15, BnPYL17, BnPYL18, BnPYL22, and BnPYL25) in roots and leaves, via RT-qPCR. Among them, BnPYL5, BnPYL15, and BnPYL17 showed significantly higher transcript accumulation, more than ~3-fold in plant roots, while showing a 1~2 fold increase in plant leaves (Figure 9A). Phytohormones, including SA and ABA, have been reported in several studies to play key roles in biotic and abiotic stresses in plants, respectively [43,44,45]. In this study, only eight BnPYL genes were selected for RT-qPCR analysis, as they had ABA- and stress-related CREs in their promoters. Regarding tissue-specific expression, our results for BnPYLs are well aligned with some previous studies, for example on eggplant, in which SmPYLs exhibited tissue-specific expression [19]. We also analyzed the expression of BnPYLs in response to ABA application on B. napus roots and leaves. To analyze the induction of early drought-responsive signaling mechanisms under combined ABA and drought stress treatment, BnPYL15 and BnPYL22 (group I–II) showed marked increases in transcript abundance in roots, reaching approximately ~4-fold and ~5-fold higher levels, respectively, than the mock treatment. In leaves, both genes also exhibited enhanced expression, although to a lesser extent (Figure 9B). These expression results are consistent with previous findings, in which SmPYLs [19] and GuPYLs [21] exhibited significant expression changes following ABA application under drought stress. Furthermore, the transcriptional induction of drought-associated marker genes, including BnDREB2A, BnP5CS, BnLEA1, BnNCED3, and BnbZIP9, following ABA treatment supports the activation of early drought-responsive signaling pathways in B. napus. As gene expression was assessed at 24 h post-treatment, these responses likely reflect the initiation of molecular adaptation mechanisms to water deficit and closely related to one of our latest studies, in which the expression of these genes was induced significantly [43].
Although the present study provides comprehensive genomic, structural, and transcriptional analyses of the BnPYL family genes, revealing their responsiveness to drought and ABA treatments, further functional studies, including transgenic approaches and protein activity assays, are required to validate their roles in ABA signaling and drought-stress responses.

4. Materials and Methods

4.1. Identification, Characterization, and Phylogenetic-Tree Construction Among PYLs

To identify PYL homologs, A. thaliana PYL protein sequences were employed as queries in BLASTP searches against fully sequenced green plant genomes available in the BRAD database (http://brassicadb.cn; accessed on 31 December 2025) [46]. Candidate sequences were selected based on significant sequence similarity (E-value ≤ 1 × 10⁻⁵), and redundant or incomplete entries were removed manually to ensure non-redundant datasets. To improve the reliability of gene family identification, only sequences exhibiting at least 90% conserved domain coverage and containing a complete PYL-associated domain were retained for subsequent analyses. The remaining sequences were further validated for the presence of the conserved PYL-associated domain (PF10604) using the Pfam and SMART databases (https://web.expasy.org/protparam/ and https://smart.embl-heidelberg.de/; accessed on 15 January 2026). Physicochemical properties of the confirmed proteins, including molecular weight and isoelectric point (pI), were predicted using the ExPASy ProtParam tool [47].
For phylogenetic analysis, complete PYL protein sequences obtained from A. thaliana, B. napus, and B. rapa were comparatively analyzed to determine their evolutionary relationships within the Brassicaceae family. Sequence alignment was carried out using the ClustalW algorithm implemented in MEGA X (v10.2.2). The phylogenetic tree was generated using the Maximum Likelihood approach under the Jones–Taylor–Thornton (JTT) amino acid substitution model, with pairwise deletion applied for gaps and missing data treatment. Branch reliability was evaluated using 1,000 bootstrap replications with a 95% site coverage threshold [48]. Finally, BnPYLs were annotated and classified according to their clustering patterns and sequence similarity with AtPYL proteins in the phylogenetic tree.

4.2. Domain, Motif, Gene Structure, and Location Prediction Analysis

To characterize the structural features of B. napus PYL proteins, conserved domains were identified using the NCBI Conserved Domain Database (CDD) with an E-value threshold of 1 × 10⁻⁵. Conserved motifs were detected using the MEME Suite (https://meme-suite.org/meme/; accessed on 20 January 2026) [49], with parameters set to identify a maximum of 10 motifs, motif widths ranging from 6 to 50 amino acids, and allowing only one occurrence per sequence [50]. Gene structure organization, including exon–intron distribution, was analyzed by aligning coding sequences with their corresponding genomic sequences using the Gene Structure Display Server (GSDS; https://gsds.gao-lab.org/Gsds_help.php) (accessed on 24 January 2026) [51]. Subcellular localization of PYL proteins was predicted using DeepLoc 2.0 (https://services.healthtech.dtu.dk/services/DeepLoc-2.0/) (accessed on 27 January 2026) [52], providing insights into their potential functional distribution within cellular compartments.

4.3. Sequence Alignment Analysis Among BnPYLs

Multiple sequence alignment of BnPYL protein sequences was carried out using the ClustalW algorithm in Molecular Evolutionary Genetics Analysis (MEGA X; v10.2.2) [53]. Default parameters were applied, including a gap opening penalty of 10, a gap extension penalty of 0.2, and the Gonnet substitution matrix, with all other settings retained as preset by the program.

4.4. Prediction of Cis-Acting Regulatory Elements (CREs)

Promoter regions (~2 kb upstream) for each B. napus PYL gene were retrieved from the NCBI genome database [54] and analyzed via PlantCARE (https://bioinformatics.psb.ugent.be/webtools/plantcare/html/; accessed on 2 February 2026).

4.5. Protein Tertiary Structure Prediction for BnPYLs

Tertiary structures of BnPYL proteins were predicted using the Phyre2 (Protein Homology/Analogy Recognition Engine) server (https://www.sbg.bio.ic.ac.uk/phyre2) (accessed on 18 February 2026) [25]. Protein models were generated based on homology modeling, and the most reliable structures were selected according to confidence scores and sequence coverage [48].

4.6. Protein Interaction Network Analysis

The protein–protein interaction (PPI) network of BnPYL proteins was analyzed in the STRING database (https://string-db.org/) (accessed on 20 February 2026) [47], using their corresponding orthologs from A. thaliana. Due to the limited availability of experimentally confirmed PPI data for B. napus in STRING, the extensively characterized Arabidopsis reference system was employed to predict the possible interaction profiles of BnPYL proteins.

4.7. PTM Site Prediction Analysis

To investigate potential post-translational regulatory mechanisms, various post-translational modifications (PTMs) in BnPYL proteins were predicted using multiple computational tools, including phosphorylation sites at Ser, Thr, and Tyr residues, glycosylation sites at the asparagine (Asn) residue, and acetylation, ubiquitination, and SUMOylation sites at the lysine (K) residue. Potential phosphorylation sites were determined using NetPhos (https://services.healthtech.dtu.dk/services/NetPhos-3.1/) (accessed on 1 February 2026), and N-linked glycosylation sites were identified using NetOGlyc (https://www.cbs.dtu.dk/services/NetOGlyc/) (accessed on 3 February 2026) [43]. Putative acetylation, ubiquitination, and SUMOylation sites at lysine residues were analyzed using MusiteDeep webserver (https://www.musite.net/) (accessed on 8 February 2026) [43]. These predicted modifications provide insights into the possible regulatory roles and functional dynamics of BnPYL proteins under varying conditions.

4.8. Plant Materials, Growth Conditions, and Treatments

Seeds of the B. napus cultivar Zhongshuang11 (ZS11) were obtained from the College of Agriculture and Biotechnology, Hangzhou, Zhejiang Province, China. ZS11 is a widely cultivated semi-winter rapeseed cultivar frequently used as a reference genotype in molecular and genomic studies because of its stable growth performance, high transformation efficiency, and availability of genomic resources. Previous studies have also reported that ZS11 exhibits moderate tolerance to abiotic stresses, making it suitable for investigating stress-responsive gene families [43,47].
Seeds were sown in 250 mL plastic pots containing a peat moss and perlite mixture (4:1) and grown in a controlled growth chamber at 22–23 °C under a 14 h light/10 h dark photoperiod for four weeks [55]. Plants were irrigated as required and supplied with a commercial fertilizer (“Kang Pu Jin” 20–20–20 N-P2O5-K2O, Mg and some trace elements (TE); COMPO Expert GmbH, Krefeld, Germany).
Drought-related treatment was imposed by withholding irrigation from four-week-old plants for 24 h under controlled growth chamber conditions. This treatment was designed to induce early water-deficit signaling responses for gene expression analysis rather than severe physiological drought stress. A 25% PEG-6000 treatment was included to provide an additional dehydration-related stimulus [56] and to evaluate the responsiveness of BnPYL genes under osmotic stress conditions, ensuring comparability of early drought response across experimental systems, based on previous studies [57,58]. Both treatments were maintained for 24 h consistently across all experimental sets, and leaf samples were collected immediately after drought exposure (24 hpt) for downstream gene expression analysis [42]. The first true leaf was collected from each plant, flash-frozen in liquid nitrogen and kept at −80 °C until the RNA extraction. Moreover, ABA treatment was applied using 150 µM as a single foliar spray [47]. For the combined treatment (drought and ABA), plants were pre-treated with 150 µM ABA prior to exposure to drought stress (water withholding), allowing assessment of ABA-mediated modulation of drought-responsive signaling pathways. Following treatment, leaf tissues were harvested immediately and stored at −80 °C for subsequent expression analysis of BnPYL genes. Each treatment included three independent biological replicates, with each biological replicate containing three technical replicates. Well-watered plants maintained under identical growth conditions served as controls. No drought stress was imposed on control plants, and no ABA was applied to control or single-stress treatments.

4.9. RNA Extraction and Gene Expression Analysis

Total RNA was extracted using TRIzol reagent (Vazyme, Nanjing, China) according to the manufacturer’s protocol. Real-time quantitative PCR (RT-qPCR) was performed using a StepOne Real-Time PCR system (Applied Biosystems, Waltham, MA, USA) with SYBR Green PCR Master Mix (TaKaRa, Dalian, China). Relative expression levels in two different plant parts (leaves and roots) were calculated using the 2^−ΔΔCT method [56]. Drought stress was imposed by controlled water withholding of four-week-old plants grown in soil under growth chamber conditions, while ABA treatment was performed using 150 µM abscisic acid (ABA). Both stress treatments were maintained for 24 h, and leaf tissues were harvested immediately after treatment (24 hpt) for RNA extraction.
To ensure the reliability and reproducibility of expression data, each experimental condition consisted of three independent biological replicates, and each biological replicate included two technical replicates. Differential expression analysis was performed by comparing treated samples with their corresponding mock-treated samples. Prior to statistical analysis, Ct data were evaluated for normal distribution to confirm the suitability of parametric testing [57].
Statistical significance was evaluated using a Student’s t-test, which was applied after confirming data normality and homogeneity of variance, thereby validating its appropriateness for the dataset. Genes exhibiting a fold change ≥ 2 were considered significantly differentially expressed [58]. In this study, “zero” was defined as the baseline expression level of target genes in control (untreated or well-watered) samples, which served as the reference condition for relative quantification [59]. BnActin was used as the internal reference gene, and its stability under the experimental conditions was assumed based on previous validation in B. napus expression studies [60]. Primer sequences used in this study are listed in Table S1.

4.10. Statistical Analysis

All experiments were carried out with three independent biological replicates, and results are presented as mean ± standard error (SE). Statistical analyses were performed using GraphPad Prism (v8.0) [61]. Prior to statistical analysis, data were assessed for normality using the Shapiro–Wilk test. Differences between two groups were evaluated using Student’s t-test, which was applied only after confirming that the data satisfied the assumptions of normality and homogeneity of variance, while comparisons involving more than two groups were assessed using one-way analysis of variance (ANOVA) followed by appropriate post hoc tests. A significance threshold of p ≤ 0.05 was applied [62].

5. Conclusions

This study presents a genome-wide identification of 25 PYL genes in the B. napus cultivar ZS11, which were phylogenetically grouped into four subfamilies corresponding to A. thaliana homologs. The BnPYL genes displayed group-specific patterns in chromosomal localization, conserved motifs, gene organization, protein tertiary structures, cis-element analysis, PPI interaction analysis, and predicted post-translational modification sites, supporting their roles in ABA-mediated signaling pathways. These expression patterns were consistent with the enrichment of ABA- and stress-related cis-regulatory elements in their promoter regions and with predicted interactions involving key components of the ABA signaling pathway based on previously reported protein interaction data and in silico predictions rather than experimentally validated protein–protein interaction assays. Expression profiling analysis indicated that several BnPYL genes respond to ABA and drought stress, and their expression was induced after ABA application in drought-stressed rapeseed plants. Collectively, these findings suggest that BnPYL15 and BnPYL22 are promising candidate genes, but their roles require functional validation in future studies through overexpression, knockout, subcellular localization, or ABA/drought tolerance assays.

Supplementary Materials

The following supporting information can be downloaded at: https://www.mdpi.com/article/10.3390/stresses6030041/s1, Table S1: Primers used in this study.

Author Contributions

Conceptualization, I.H. and M.M.N.; methodology, R.M.A.G.; software, R.M. and M.H.J.; validation, T.Z., R.M.A.G., and I.H.; formal analysis, R.M.A.G., X.Z., and H.Y.; investigation, J.Z. and R.M.A.G.; data curation, M.M.N. and N.A., writing—original draft preparation, R.M.A.G.; writing—review and editing, N.A. and I.H.; visualization, R.M.A.G., T.Z., and I.H.; supervision, M.M.N. and I.H.; funding acquisition, I.H. All authors have read and agreed to the published version of the manuscript.

Funding

This research received no external funding.

Institutional Review Board Statement

Not applicable.

Informed Consent Statement

Not applicable.

Data Availability Statement

The data presented in this study are available in the BRAD database (http://www.brassicadb.cn/#/) (accessed on 2 December 2025). These data were derived from the following resources available in the public domain: the BRAD database (https://www.brassicadb.cn/) (accessed on 16 December 2025); ClustalW (https://www.genome.jp/tools-bin/clustalw) (accessed on 19 December 2025); GeneDoc (v2.7.000) (accessed on 20 December 2025); Expasy ProtParam (https://web.expasy.org/protparam/) (accessed on 23 December 2025).

Acknowledgments

We gratefully acknowledge the College of Agriculture and Biotechnology, Zhejiang University, Hangzhou, China, for providing the seeds of the Brassica napus cultivar. We also acknowledge Nazir Ahmad and Muhammad Mudassir Nazir for their valuable guidance, suggestions, assistance with manuscript proofreading, and thorough language editing, which greatly enhanced the readability and scientific rigor of this work.

Conflicts of Interest

The authors declare no conflicts of interest.

Abbreviations

The following abbreviations are used in this manuscript:
PYLPyrabactin resistance1/pyr1-like
PTMsPost-translational modifications
CREsCis-acting regulatory elements
ThrThreonine
AsnAsparagine
SerSerine
ABAAbscisic acid
BnBrassica napus
ZS11Zhongshuang11
pIIsoelectric point

References

  1. Secchi, M.A.; Fernandez, J.A.; Stamm, M.J.; Durrett, T.; Prasad, P.V.V.; Messina, C.D.; Ciampitti, I.A. Effects of heat and drought on canola (Brassica napus L.) yield, oil, and protein: A meta-analysis. Field Crops Res. 2023, 293, 108848. [Google Scholar] [CrossRef]
  2. Chalhoub, B.; Denoeud, F.; Liu, S.; Parkin, I.A.; Tang, H.; Wang, X.; Chiquet, J.; Belcram, H.; Tong, C.; Samans, B.; et al. Plant genetics. Early allopolyploid evolution in the post-Neolithic Brassica napus oilseed genome. Science 2014, 345, 950–953. [Google Scholar] [CrossRef] [PubMed]
  3. Hu, Q.; Hua, W.; Yin, Y.; Zhang, X.; Liu, L.; Shi, J.; Zhao, Y.; Qin, L.; Chen, C.; Wang, H. Rapeseed research and production in China. Crop J. 2017, 5, 127–135. [Google Scholar] [CrossRef]
  4. Batool, M.; El-Badri, A.M.; Hassan, M.U.; Haiyun, Y.; Chunyun, W.; Zhenkun, Y.; Jie, K.; Wang, B.; Zhou, G. Drought stress in Brassica napus: Effects, tolerance mechanisms, and management strategies. J. Plant Growth Regul. 2023, 42, 21–45. [Google Scholar]
  5. Cutler, S.R.; Rodriguez, P.L.; Finkelstein, R.R.; Abrams, S.R. Abscisic acid: Emergence of a core signaling network. Annu. Rev. Plant Biol. 2010, 61, 651–679. [Google Scholar] [CrossRef] [PubMed]
  6. Raghavendra, A.S.; Gonugunta, V.K.; Christmann, A.; Grill, E. ABA perception and signalling. Trends Plant Sci. 2010, 15, 395–401. [Google Scholar] [CrossRef] [PubMed]
  7. Singh, A.; Roychoudhury, A. Abscisic acid in plants under abiotic stress: Crosstalk with major phytohormones. Plant Cell Rep. 2023, 42, 961–974. [Google Scholar] [CrossRef] [PubMed]
  8. Wu, C.; Munir, R.; Li, F.; Li, P.; Cai, Y.; Shi, K. From biosynthesis to signaling: Unveiling the multifaceted roles of phytosulfokine peptide in plants. J. Exp. Bot. 2025, 76, 5682–5697. [Google Scholar] [CrossRef] [PubMed]
  9. Hu, S.; Wang, F.Z.; Liu, Z.N.; Liu, Y.P.; Yu, X.L. ABA signaling mediated by PYR/PYL/RCAR in plants. Yi Chuan 2012, 34, 560–572. [Google Scholar] [CrossRef] [PubMed]
  10. Park, S.-Y.; Fung, P.; Nishimura, N.; Jensen, D.R.; Fujii, H.; Zhao, Y.; Lumba, S.; Santiago, J.; Rodrigues, A.; Chow, T.-F.F.; et al. Abscisic acid inhibits type 2C protein phosphatases via the PYR/PYL family of START proteins. Science 2009, 324, 1068–1071. [Google Scholar] [CrossRef] [PubMed]
  11. Fidler, J.; Graska, J.; Gietler, M.; Nykiel, M.; Prabucka, B.; Rybarczyk-Płońska, A.; Muszyńska, E.; Morkunas, I.; Labudda, M. PYR/PYL/RCAR receptors play a vital role in the abscisic-acid-dependent responses of plants to external or internal stimuli. Cells 2022, 11, 1352. [Google Scholar] [CrossRef] [PubMed]
  12. Castillo, M.-C.; Lozano-Juste, J.; González-Guzmán, M.; Rodriguez, L.; Rodriguez, P.L.; León, J. Inactivation of PYR/PYL/RCAR ABA receptors by tyrosine nitration may enable rapid inhibition of ABA signaling by nitric oxide in plants. Sci. Signal. 2015, 8, ra89. [Google Scholar] [CrossRef] [PubMed]
  13. Gonzalez-Guzman, M.; Pizzio, G.A.; Antoni, R.; Vera-Sirera, F.; Merilo, E.; Bassel, G.W.; Fernández, M.A.; Holdsworth, M.J.; Perez-Amador, M.A.; Kollist, H.; et al. Arabidopsis PYR/PYL/RCAR receptors play a major role in quantitative regulation of stomatal aperture and transcriptional response to abscisic acid. Plant Cell 2012, 24, 2483–2496. [Google Scholar] [CrossRef] [PubMed]
  14. Belda-Palazon, B.; Gonzalez-Garcia, M.-P.; Lozano-Juste, J.; Coego, A.; Antoni, R.; Julian, J.; Peirats-Llobet, M.; Rodriguez, L.; Berbel, A.; Dietrich, D.; et al. PYL8 mediates ABA perception in the root through non-cell-autonomous and ligand-stabilization–based mechanisms. Proc. Natl. Acad. Sci. USA 2018, 115, E11857–E11863. [Google Scholar] [CrossRef] [PubMed]
  15. Zhang, R.; Luo, S.; Li, L.; Mu, T.; Wang, P.; Zhang, G. The role of PYL genes as core components of abscisic acid signaling in plant abiotic stress response. Hortic. Plant J. 2025; in press. [CrossRef]
  16. Sah, S.K.; Reddy, K.R.; Li, J. Abscisic acid and abiotic stress tolerance in crop plants. Front. Plant Sci. 2016, 7, 571. [Google Scholar] [CrossRef] [PubMed]
  17. Wang, Y.; Wang, L.; Wang, Y.; Xia, L.; Li, S.; Dai, K.; Shi, W.; Cheng, J.; Guo, J. Genome-wide characterization of the Pyrabactin Resistance 1-like (PYL) gene family in wheat and functional identification of TaPYL2D. Plant Sci. 2025, 359, 112681. [Google Scholar] [CrossRef] [PubMed]
  18. He, Z.; Zhong, J.; Sun, X.; Wang, B.; Terzaghi, W.; Dai, M. The Maize ABA receptors ZmPYL8, 9, and 12 facilitate plant drought resistance. Front. Plant Sci. 2018, 9, 422. [Google Scholar] [CrossRef] [PubMed]
  19. Gong, F.; Lan, Y.; Zhang, T.; Li, C.; Li, Y.; Xia, F.; Liu, X.; Liu, D.; Liang, G.; Fang, C.; et al. Genome-wide identification and expression analysis of the PYL gene family in response to salt, drought and cold stresses in Solanum melongena L. BMC Genom. 2025, 26, 1007. [Google Scholar] [CrossRef]
  20. Xue, G.; He, A.; Yang, H.; Song, L.; Li, H.; Wu, C.; Ruan, J. Genome-wide identification, abiotic stress, and expression analysis of PYL family in Tartary buckwheat (Fagopyrum tataricum (L.) Gaertn.) during grain development. BMC Plant Biol. 2024, 24, 725. [Google Scholar] [CrossRef] [PubMed]
  21. Cui, Y.-X.; Xu, Z.-C.; Chen, X.-L.; Nie, L.-P.; Wu, L.-W.; Wang, Y.; Song, J.-Y.; Yao, H. Genome-wide identification of abscisic acid (ABA) receptor pyrabactin resistance 1-like protein (PYL) family members and expression analysis of PYL genes in response to different concentrations of ABA stress in Glycyrrhiza uralensis. Chin. J. Nat. Med. 2020, 18, 606–611. [Google Scholar] [CrossRef] [PubMed]
  22. Mi, W.; Liu, K.; Liang, G.; Jia, Z.; Ma, X.; Ju, Z.; Liu, W. Genome-wide identification and characterization of ABA receptor pyrabactin resistance 1-like protein (PYL) family in oat. PeerJ 2023, 11, e16181. [Google Scholar] [CrossRef] [PubMed]
  23. Wang, G.; Qi, K.; Gao, X.; Guo, L.; Cao, P.; Li, Q.; Qiao, X.; Gu, C.; Zhang, S. Genome-wide identification and comparative analysis of the PYL gene family in eight Rosaceae species and expression analysis of seeds germination in pear. BMC Genom. 2022, 23, 233. [Google Scholar] [CrossRef]
  24. Yadav, S.K.; Santosh Kumar, V.V.; Verma, R.K.; Yadav, P.; Saroha, A.; Wankhede, D.P.; Chaudhary, B.; Chinnusamy, V. Genome-wide identification and characterization of ABA receptor PYL gene family in rice. BMC Genom. 2020, 21, 676. [Google Scholar] [CrossRef]
  25. Zhang, Z.; Luo, S.; Liu, Z.; Wan, Z.; Gao, X.; Qiao, Y.; Yu, J.; Zhang, G. Genome-wide identification and expression analysis of the cucumber PYL gene family. PeerJournal 2022, 10, e12786. [Google Scholar] [CrossRef]
  26. Yan, X.; Liang, C.; Mou, G.; Zuo, R.; Huang, M.; Zhang, B. Genome-wide identification and expression analysis of the PYL gene family in Eucalyptus grandis. J. Plant Biochem. Biotechnol. 2026, 35, 635–647. [Google Scholar] [CrossRef]
  27. Powell, H.R.; Islam, S.A.; David, A.; Sternberg, M.J.E. Phyre2.2: A community resource for template-based protein tructure prediction. J. Mol. Biol. 2025, 437, 168960. [Google Scholar] [CrossRef] [PubMed]
  28. Leung, J.; Merlot, S.; Giraudat, J. The Arabidopsis ABSCISIC ACID-INSENSITIVE2 (ABI2) and ABI1 genes encode homologous protein phosphatases 2C involved in abscisic acid signal transduction. Plant Cell 1997, 9, 759–771. [Google Scholar] [CrossRef] [PubMed][Green Version]
  29. Zhang, Y.; Han, L.; Liu, J.; Chang, M.; Li, C.; Shang, J.-X.; Deng, Z.; Tang, W.; Sun, Y. Two E-clade protein phosphatase 2Cs enhance ABA signaling by dephosphorylating ABI1 in Arabidopsis. Mol. Plant 2025, 18, 783–796. [Google Scholar] [CrossRef] [PubMed]
  30. Rubio, S.; Rodrigues, A.; Saez, A.; Dizon, M.B.; Galle, A.; Kim, T.-H.; Santiago, J.; Flexas, J.; Schroeder, J.I.; Rodriguez, P.L. Triple loss of function of protein phosphatases type 2C leads to partial constitutive response to endogenous abscisic acid. Plant Physiol. 2009, 150, 1345–1355. [Google Scholar] [CrossRef] [PubMed]
  31. Hao, Q.; Yin, P.; Li, W.; Wang, L.; Yan, C.; Lin, Z.; Wu, J.Z.; Wang, J.; Yan, S.F.; Yan, N. The molecular basis of ABA-independent inhibition of PP2Cs by a subclass of PYL Proteins. Mol. Cell 2011, 42, 662–672. [Google Scholar] [PubMed]
  32. Feng, C.-Z.; Luo, Y.-X.; Wang, P.-D.; Gilliham, M.; Long, Y. MYB77 regulates high-affinity potassium uptake by promoting expression of HAK5. New Phytol. 2021, 232, 176–189. [Google Scholar] [PubMed]
  33. Ikawa, K.; Sugimura, K. AIP1 and cofilin ensure a resistance to tissue tension and promote directional cell rearrangement. Nat. Commun. 2018, 9, 3295. [Google Scholar] [CrossRef] [PubMed]
  34. Lim, C.W.; Lee, S.C. Functional involvement of highly abscisic acid-induced clade A protein phosphatase 2Cs in delayed seed germination under cold stress. J. Plant Biol. 2021, 64, 543–553. [Google Scholar] [CrossRef]
  35. Wang, G.; Liu, X.; Gan, S.-S. The ABA–AtNAP–SAG113 PP2C module regulates leaf senescence by dephoshorylating SAG114 SnRK3.25 in Arabidopsis. Mol. Hortic. 2023, 3, 22. [Google Scholar] [CrossRef] [PubMed]
  36. Mao, H.; Jian, C.; Cheng, X.; Chen, B.; Mei, F.; Li, F.; Zhang, Y.; Li, S.; Du, L.; Li, T.; et al. The wheat ABA receptor gene TaPYL1-1B contributes to drought tolerance and grain yield by increasing water-use efficiency. Plant Biotechnol. J. 2022, 20, 846–861. [Google Scholar] [PubMed]
  37. Gul, S.; Gul, H.; Shahzad, M.; Ullah, I.; Shahzad, A.; Khan, S.U. Comprehensive analysis of potato (Solanum tuberosum) PYL genes highlights their role in stress responses. Funct. Plant Biol. 2024, 51, FP24094. [Google Scholar] [CrossRef] [PubMed]
  38. Zhang, L.; Song, W.; Xin, G.; Zhu, M.; Meng, X. Comparative analysis of the PYL gene family in three ipomoea species and the expression profiling of IbPYL genes during abiotic stress response in sweetpotato. Genes 2023, 14, 1471. [Google Scholar] [CrossRef] [PubMed]
  39. Jiang, M.; Chu, Z. Comparative analysis of plant MKK gene family reveals novel expansion mechanism of the members and sheds new light on functional conservation. BMC Genom. 2018, 19, 407. [Google Scholar] [CrossRef]
  40. Choi, I.-G.; Kim, S.-H. Evolution of protein structural classes and protein sequence families. Proc. Natl. Acad. Sci. USA 2006, 103, 14056–14061. [Google Scholar] [CrossRef] [PubMed]
  41. You, Z.; Guo, S.; Li, Q.; Fang, Y.; Huang, P.; Ju, C.; Wang, C. The CBL1/9-CIPK1 calcium sensor negatively regulates drought stress by phosphorylating the PYLs ABA receptor. Nat. Commun. 2023, 14, 5886. [Google Scholar] [CrossRef] [PubMed]
  42. Zhang, R.; Liang, K.; Qiu, Z.; Shi, D.; He, S.; Zhu, G.; Xu, B.; Hussain, I.; Huang, J.; Gulzar, R.M.A. CBL gene family in Brassica napus: Genome-wide and expression profiling in response to phytohormones under diverse stress conditions. Agriculture 2026, 16, 1088. [Google Scholar] [CrossRef]
  43. Zhang, X.; Ghishkori, Z.G.N.; Hussain, I.; Javaid, M.H.; Zhu, G.; Huang, J.; Gulzar, R.M.A. Genome-wide identification of PSK gene family and effects of abscisic acid (ABA) in regulating antioxidant activity and ROS signaling under drought stress in Brassica napus. Int. J. Mol. Sci. 2026, 27, 1064. [Google Scholar] [CrossRef] [PubMed]
  44. Gulzar, R.M.A.; Rehman, A.U.; Umar, U.-U.-D.; Shahid, M.; Khan, M.F. Evaluation of genetic and induced resistance phenomena in cucumbers against the root-knot nematode (Meloidogyne incognita). Plant Prot. Sci. 2022, 58, 338–350. [Google Scholar] [CrossRef]
  45. Hussain, I.; Zhao, T.; Wang, Y.; Lei, N.; Liu, K.; Yu, H.; Zhang, Y.; Muhammad, U.; Ullah, H.; Yu, X. Melatonin and copper oxide nanoparticles synergistically mitigate clubroot disease and enhance growth dynamics in Brassica rapa. Plant Physiol. Biochem. 2024, 215, 109020. [Google Scholar] [CrossRef] [PubMed]
  46. Zhao, T.; Miao, L.; Zou, M.; Hussain, I.; Yu, H.; Li, J.; Sun, N.; Kong, L.; Wang, S.; Li, J.; et al. Development of SSRs based on the whole genome and screening of bolting-resistant SSR marker in Brassica oleracea L. Horticulturae 2024, 10, 443. [Google Scholar] [CrossRef]
  47. Gulzar, R.M.A.; Munir, R.; Yi, Z.R.; Jan, N.; Rauf, A.; Kaleem, Z.; Javaid, M.H.; Saand, M.A.; El-Keblawy, A.; Sheteiwy, M.S.; et al. Genome-wide identification of NHX gene family and effects of salicylic acid in regulating antioxidant activity as well as nutrients deposition under salt stress in three Brassica species. BMC Plant Biol. 2025, 25, 740. [Google Scholar] [CrossRef] [PubMed]
  48. Gulzar, R.M.A.; Ren, C.X.; Fang, X.; Xu, Y.P.; Saand, M.A.; Cai, X.Z. Glutamate receptor-like (GLR) family in Brassica napus: Genome-wide identification and functional analysis in resistance to Sclerotinia sclerotiorum. Int. J. Mol. Sci. 2024, 25, 5670. [Google Scholar] [CrossRef] [PubMed]
  49. Ahmad, F.; Abdullah, M.; Khan, Z.; Stępień, P.; Rehman, S.U.; Akram, U.; Rahman, M.H.U.; Ali, Z.; Ahmad, D.; Gulzar, R.M.A.; et al. Genome-wide analysis and prediction of chloroplast and mitochondrial RNA editing sites of AGC gene family in cotton (Gossypium hirsutum L.) for abiotic stress tolerance. BMC Plant Biol. 2024, 24, 888. [Google Scholar] [CrossRef] [PubMed]
  50. Zhang, Y.; Zhao, T.; Wang, Y.; Yang, R.; Li, W.; Liu, K.; Sun, N.; Hussain, I.; Ma, X.; Yu, H.; et al. Expression characterization of ABCDE class MADS-box genes in Brassica rapa with different pistil types. Plants 2023, 12, 2218. [Google Scholar] [CrossRef] [PubMed]
  51. Saand, M.A.; Xu, Y.-P.; Munyampundu, J.-P.; Li, W.; Zhang, X.-R.; Cai, X.-Z. Phylogeny and evolution of plant cyclic nucleotide-gated ion channel (CNGC) gene family and functional analyses of tomato CNGCs. DNA Res. 2015, 22, 471–483. [Google Scholar] [CrossRef] [PubMed]
  52. Thumuluri, V.; Almagro Armenteros, J.J.; Johansen, A.R.; Nielsen, H.; Winther, O. DeepLoc 2.0: Multi-label subcellular localization prediction using protein language models. Nucleic Acids Res. 2022, 50, W228–W234. [Google Scholar] [CrossRef] [PubMed]
  53. Kumar, S.; Stecher, G.; Li, M.; Knyaz, C.; Tamura, K. MEGA X: Molecular evolutionary genetics analysis across computing platforms. Mol. Biol. Evol. 2018, 35, 1547–1549. [Google Scholar] [CrossRef] [PubMed]
  54. Li, W.; Ping, F.; Jiang, H.; Zhang, S.; Zhao, T.; Liu, K.; Yu, H.; Hussain, I.; Ren, X.; Yu, X. Genome-wide identification of the NAC gene family in Brassica rapa (L.) and expression pattern analysis of BrNAC2s. Plants 2025, 14, 834. [Google Scholar] [CrossRef] [PubMed]
  55. Ali, B.; Javaid, M.H.; Rehman, M.; Munir, R.; Yasin, M.U.; Haider, Z.; Ahmad, I.; Yang, C.; Ali, A.; Ali, Q.S.; et al. Indium-induced toxicity disrupts redox balance, impairs photosynthesis, and induces cell wall lignification in Brassica napus. Environ. Sci. Technol. 2025, 59, 15623–15636. [Google Scholar] [CrossRef] [PubMed]
  56. Batool, M.; El-Badri, A.M.; Wang, Z.; Mohamed, I.A.A.; Yang, H.; Ai, X.; Salah, A.; Hassan, M.U.; Sami, R.; Kuai, J.; et al. Rapeseed morpho-physio-biochemical responses to drought stress induced by PEG-6000. Agronomy 2022, 12, 579. [Google Scholar] [CrossRef]
  57. Lee, J.S.; Adams, K.L. Global insights into duplicated gene expression and alternative splicing in polyploid Brassica napus under heat, cold, and drought stress. Plant Genome 2020, 13, e20057. [Google Scholar] [CrossRef] [PubMed]
  58. Luo, D.; Huang, Q.; Chen, M.; Li, H.; Lu, G.; Feng, H.; Lv, Y. ABA enhances drought resistance during rapeseed (Brassica napus L.) seed germination through the gene regulatory network mediated by ABA insensitive5. Plants 2025, 14, 1276. [Google Scholar] [CrossRef] [PubMed]
  59. Kaleem, Z.; Shahbaz, H.; Ali, S.; Albert, A.; He, D.; Gulzar, R.M.A.; Asad, M.A.U.; Zhou, W.; Zhang, K.; Ulhassan, Z. Melatonin and nanocopper synergistically regulate cadmium toxicity in Brassica napus: Evidences from photosynthesis phenomics, oxidative metabolism, and multiple defense responses. Environ. Sci. Nano 2025, 12, 3714–3730. [Google Scholar] [CrossRef]
  60. Javaid, M.H.; Ali, B.; Neelam, A.; Bukhari, S.A.H.; Munir, R.; Haider, Z.; Rehman, M.; Razzaq, H.A.; Majeed, A.; Gan, Y. Green-engineered calcium-doped carbon nanospheres enhance salt tolerance and growth in maize by modulating gene expressions and antioxidant defense mechanisms. J. Environ. Chem. Eng. 2025, 13, 117061. [Google Scholar] [CrossRef]
  61. Hussain, I.; Gulzar, R.M.A.; Ghishkori, Z.G.N.; Yu, H.; Javaid, M.H.; Munir, R.; Azhar, R.; Liu, K.; Zhao, T.; Li, Z.; et al. Genome-wide characterization of OSCA genes in Brassica rapa highlights ABA-mediated antioxidant and ROS responses under drought stress. Sci. Hortic. 2026, 363, 114930. [Google Scholar] [CrossRef]
  62. He, Y.H.; Zhang, Z.R.; Xu, Y.P.; Chen, S.Y.; Cai, X.Z. Genome-wide identification of rapid alkalinization factor family in Brassica napus and functional analysis of BnRALF10 in immunity to Sclerotinia sclerotiorum. Front. Plant Sci. 2022, 13, 877404. [Google Scholar] [CrossRef] [PubMed]
Figure 1. Chromosomal mapping of BnPYL genes. Black lines on each chromosome indicate the positions of genes, and gene name are indicated in red. Subgenome A is shown in blue, subgenome C is shown in green, and unanchored scaffolds are shown in orange.
Stresses 06 00041 g001
Figure 2. Phylogenetic analysis between A. thaliana, B. napus, and B. rapa PYL proteins. Maximum likelihood (ML) phylogenetic tree of AtPYL, BnPYL, and BraPYL proteins. The phylogenetic tree was constructed using the MEGA X software with 1000 bootstrap replicates and was optimized with the iTOL online tool (v6). Distinct colors indicate classification of PYL proteins in A. thaliana, B. napus, and B. rapa. AtPYLs are indicated as dotted lines, while BnPYLs and BraPYLs are designated as straight lines. Internal nodes are represented as grey circles. AtPYLs with their corresponding orthologs are presented groupwise. Group I-I contained one AtPYL (AtPYL8), four BnPYLs, and two BraPYLs; group I-II had three AtPYLs, five BnPYLs, and five BraPYLs; group II exhibited three AtPYLs, five BnPYLs, and four BraPYLs; and group III contained six AtPYLs, 11 BnPYLs, and 10 BraPYLs.
Stresses 06 00041 g002
Figure 3. Conserved domain composition and gene structure of BnPYL genes. (A) Dendrogram of BnPYL proteins constructed in TBtools (v2.084) using the Neighbor-Joining method based on full-length protein sequences. The dendrogram was used to illustrate evolutionary relationships among BnPYL members and to facilitate comparison of conserved domain organization. Green boxes indicate the Polyketide_cyc2_PYL domain (PF10604). (B) Exon–intron organization of BnPYL genes visualized using the Gene Structure Display Server (GSDS). Yellow boxes indicate coding sequences (CDS), blue boxes represent untranslated regions (UTRs), and black lines indicate introns.
Stresses 06 00041 g003
Figure 4. Motif profiling of BnPYL proteins. (A) Distribution of conserved motifs identified in BnPYL protein sequences, showing motif composition and positional organization along each protein. Motifs predicted using the MEME online tool (v5.5.9) and represented by distinct colors and mapped onto individual protein sequences using TBtools (v2.084). (B) Sequence logos of the identified conserved motifs illustrating amino acid conservation patterns and corresponding consensus sequences for each motif generated using WebLogo3 (v3.7).
Stresses 06 00041 g004
Figure 5. Amino acid sequence alignment of BnPYL proteins showing three conserved loop regions (CL1–CL3), three α-helices, and six β-sheets identified in this study. A total of 29 amino acids were fully conserved (100%) and are indicated by an asterisk (*). The conserved SGLP gate motif, critical for ABA binding, is highlighted in the CL1 regions. CL2 shows higher conservation than CL1 and CL3, whereas CL1 and CL3 display greater variability, including substitutions and indels, corresponding to N- and C-terminal associated regions. Overall, the alignment indicates a conserved structural core with limited terminal variation, suggesting potential functional diversification among BnPYL members.
Stresses 06 00041 g005
Figure 6. Prediction of cis-regulatory elements (CREs) within the 2 kb upstream promoter region of BnPYL genes. (A) Distribution of major CRE categories presented as a circular heatmap with a color gradient ranging from green to red. CREs are grouped into light-responsive elements (MRE, Box4, and GATA-motif), hormone-responsive elements (ARE, ABRE, ERE, TCA element, CGTCA-motif, GARE-motif, TGACG-motif, TGA-element, and P-box), and stress-responsive CREs (MBS, LTR, GT1-motif, DRE1, STRE, TC-rich repeats, W-box, and WUN-motif). An enlarged color legend corresponding to the heatmap scale is provided on the right side of the figure. (B) Quantitative distribution of major CREs. Blue indicates light-responsive CREs, green indicates hormone-responsive CREs, and red indicates stress-responsive CREs. The red boxes in each column indicated the number of cis-elements. Actual numbers of each CRE type are shown within the figure for improved readability.
Stresses 06 00041 g006
Figure 7. Predicted 3D models of BnPYL proteins. Models were generated using Phyre2 server. Models were visualized using a rainbow color gradient from N to C terminus. The alignment coverage, identity, disorder, α-helix, and β-sheet (%) content, along with the confidence score of the predicted model with the template, are shown below each model.
Stresses 06 00041 g007
Figure 8. Prediction of protein-protein interactions (PPIs) between BnPYLs and other drought/ABA-related proteins. (A) PPI network of AtPYL8 (homolog of BnPYL17 and BnPYL18). (B) AtPYL7 (homolog of BnPYL15). (C) AtPYL10 (homolog of BnPYL22). (D) AtPYL1 (homolog of BnPYL2). (E) AtPYL4 (homolog of BnPYL6). (F) AtPYL3 (homolog of BnPYL5). (G) AtPYL13 (BnPYL25) and other stress-responsive proteins. (H) Groupwise demonstration of AtPYLs and their respective orthologs in BnPYLs.
Stresses 06 00041 g008
Figure 9. Relative expression level of B. napus PYL genes in plant parts and following abscisic acid (ABA) application under drought stress via RT-qPCR analysis. (A) Relative expression level of BnPYLs in plant roots and leaves. Samples were collected at 24 h post-treatment (hpt) after exposure to ABA (150 µM), drought stress, and combined ABA + drought stress treatments, as well as corresponding mock applications. (B) Expression profiling of eight BnPYLs after ABA application under drought stress at 24 hpt. Comparisons were made among four treatment groups (Mock, ABA, drought, and ABA + drought) for both root and leaf tissues and representing in different colors. (C) Expression patterns represent a separate analysis of drought-responsive marker genes under mock and ABA + drought treatments in root and leaf tissues at 24 hpt and presented in distinct colors. All values were expressed relative to the expression levels of reference genes using the formula 2−ΔΔCt. BnActin was used as a marker or reference gene for B. napus. The graph was generated using GraphPad Prism (v8.0.2). Data represent three biological replicates. Asterisks denote statistical significance (* p ≤ 0.05, ** p ≤ 0.01, *** p ≤ 0.001; n.s., not significant; Student’s t-test).
Stresses 06 00041 g009
Table 1. Identifications of BnPYLs and their predicted physicochemical characteristics.
Gene IDsPYLsChromosomeStartEndStrandNo. of AApIM.W (KD)GRAVYLocalization
BnaAnng26820DBnPYL1chrAnn_random3079912130800174-1914.9621.285−0.469Chloroplast
BnaA06g40360DBnPYL2A0620026142003467-2105.223.914−0.551Chloroplast
BnaA09g40690DBnPYL3A092856505428565746+1885.4920.834−0.298Chloroplast
BnaC03g23260DBnPYL4C031292562612926243-2058.8822.91−0.237PM
BnaA02g16230DBnPYL5A0296827519683368+2058.9122.884−0.246PM
BnaAnng13200DBnPYL6chrAnn_random1417242214173048+2087.0822.567−0.11Chloroplast
BnaC03g21240DBnPYL7C031147388511474748+2076.4322.286−0.033Chloroplast
BnaA03g17720DBnPYL8A0383534478354313+2076.4322.24−0.047Chloroplast
BnaA04g21960DBnPYL9A041665122616652092+2046.2221.989−0.113Chloroplast
BnaC04g56560DBnPYL10C0441918794192790+2046.0421.936−0.079Chloroplast
BnaAnng40650DBnPYL11chrAnn_random4655393046554584+2035.822.706−0.375Chloroplast
BnaC04g04830DBnPYL12C0435263713527009+2126.6623.502−0.309Chloroplast
BnaC03g22610DBnPYL13C031249941012500051-2136.3823.713−0.347Chloroplast
BnaA04g29300DBnPYL14A0413031601304112-2056.0922.765−0.403Chloroplast
BnaA07g38130DBnPYL15A0714831031484199+1876.1620.743−0.155Chloroplast
BnaC06g17940DBnPYL16C062041586620416850-1876.6520.854−0.19Chloroplast
BnaA03g12450DBnPYL17A0356679355670048-1836.2420.666−0.379Chloroplast
BnaC03g15210DBnPYL18C0375392367541464-1846.2420.797−0.367Chloroplast
BnaA10g06520DBnPYL19A1049677674969159+1846.0721.032−0.508Chloroplast
BnaCnng37890DBnPYL20chrCnn_random3642546336426990+1846.0720.933−0.462Chloroplast
BnaC05g00620DBnPYL21C05331808333031-1875.9821.034−0.332Chloroplast
BnaCnng68710DBnPYL22chrCnn_random6836315768363922+1855.7120.735−0.146Chloroplast
BnaA02g10420DBnPYL23A0253491365350394-1886.2421.264−0.452Chloroplast
BnaA06g40220DBnPYL24A0619288711929359-1625.417.822−0.304Chloroplast
BnaC07g48850DBnPYL25C0714779831478483-1665.2618.414−0.248Chloroplast
Abbreviations: BnPYLB. napus Pyrabactin resistance 1-like genes; Chr—chromosome; PM—Plasma membrane; AA—Amino Acids; pI—Iso-electric point; MW—Molecular weight; GRAVY—Grand average of hydropathy.
Table 2. Predicted post-translational modification sites identified in BnPYLs.
PYLsPhosphorylation (1)Glycosylation (2)Acetylation (3)Ubiquitination (4)SUMOylation (5)
Serine (Ser)Threonine (Thr)Tyrosine (Tyr)Asparagine (Asn)Lysine (K)Lysine (K)Lysine (K)
BnPYL115911220
BnPYL215911110
BnPYL311900210
BnPYL4151110201
BnPYL5151110201
BnPYL620900100
BnPYL722700100
BnPYL821500100
BnPYL922700100
BnPYL1022600100
BnPYL1110700000
BnPYL1217701200
BnPYL1314601000
BnPYL1415602100
BnPYL1510312110
BnPYL168412100
BnPYL178722120
BnPYL187722200
BnPYL195621100
BnPYL206621100
BnPYL2110512110
BnPYL2210521101
BnPYL238611100
BnPYL2415710110
BnPYL2513502100
PTM site prediction in BnPYLs. (1). Phosphorylation sites at serine (Ser), threonine (Thr), and tyrosine (Tyr). (2). Glycosylation sites at the asparagine residue (Asn). (3). Acetylation sites at the lysine residue (K). (4). Ubiquitination sites at the lysine residue (K). (5). SUMOylation site prediction at the lysine residue (K).
Disclaimer/Publisher’s Note: The statements, opinions and data contained in all publications are solely those of the individual author(s) and contributor(s) and not of MDPI and/or the editor(s). MDPI and/or the editor(s) disclaim responsibility for any injury to people or property resulting from any ideas, methods, instructions or products referred to in the content.