1. Introduction
This study aims to evaluate the utilization of post-consumer plastic in mortar and concrete to contribute to the solution of the environmental problems associated with plastic waste. This process targets facilitating the removal of large volumes of end-of-life plastics from landfills and the environment. Plastics have many beneficial properties that made them tremendously popular. Plastic is easy to form and shape, lightweight material, and it is water and chemical resistant with hygiene properties [
1].
Plastics are classified into seven different types depending on their chemical compound: Type #1: Polyethylene terephthalate (PET), Type #2: High-Density Polyethylene (HDPE), Type #3: Polyvinyl Chloride (PVC), Type #4: Low-Density Polyethylene (LDPE), Type #5: Polypropylene (PP), Type #6: Polystyrene (PS), and Type #7: miscellaneous plastics. Miscellaneous plastics include all other types of plastics such as polycarbonate, polylactide, acrylic, acrylonitrile butadiene, styrene, fiberglass reinforced plastic, and nylon [
1].
Even though plastic is a durable material and has a long life, most plastics are used one time such as for packaging purposes and then disposed of in the environment [
2]. In 2012, a total of 251 million tons of municipal solid waste (MSW) was generated in the U.S. Plastics were found to make up 12.7% of the total waste, and only 8.8% of the total plastic waste is recovered [
3]. This research study concentrates on the promotion of the usage of some plastic products that are not accepted for curbside recycling and are discarded in landfills or incinerated.
The bulk of investigations on using plastic waste in concrete concentrated on using the waste material as artificial aggregate, e.g., [
4,
5,
6,
7] or as fibers, e.g., [
8,
9,
10,
11]. When plastic particles were used to replace aggregate in concrete, the compressive strength was generally found to decrease with plastic content increment [
12,
13,
14,
15]. The reason for the reduction was explained by the different mechanical properties of plastic compared to natural aggregate and the hydrophobic nature of plastic particles. The hydrophobic phenomenon, along with the smooth surfaces of the plastic particles, inhibits the hydration of the cement near their surfaces. The interfacial transition zone (ITZ) acts as a wall between the plastic aggregate phase and the matrix phase in concrete, causing the wall effect phenomenon. This phenomenon causes a weak bond between the cement matrix and the plastic surface and increases the air content of mixtures containing plastic [
4].
In another study by [
16], when mixtures with plastic contribution and a higher water-to-cement ratio were used, even more reduction in compressive strength was recorded as the water bleeding between cement paste and plastic aggregate was found to produce a weaker bond and prevent the hydration products from effectively filling the spaces around the plastic particles. This increases the tendency of Ca (OH)
2 (indicated as CH) and Calcium Sulphoaluminate (known as ettringite) to form in those spaces.
A study by [
17] incorporated scraped PVC as a replacement for fine aggregate in lightweight aggregate concrete. The volumetric replacement ranged between 0% and 45%, and compressive strength was found to be adversely affected by the replacement of fine aggregate. In addition, ref. [
17] reported that concrete with PVC waste replacement has a lower density than conventional concrete.
A decrease in the bulk density of concrete containing post-consumer plastic as an aggregate replacement was reported as plastic content increased [
18,
19,
20]. The reduction of the concrete density was caused by the low density of plastic particles compared to the replaced sand or aggregate. In addition to its low density, plastic was found to have flat surfaces with sharp edges, which allowed more air to be entrapped [
21]. The reduction in density and increase in air content was found to be advantageous in applications that require lightweight concrete and for thermal insulation [
22].
A gradual decrease in workability of concrete was observed as the percentage of PET replacement in the cementitious matrix increased [
23]. This was justified by the fact that the flaky PET aggregate had an irregular shape and rough edges. The presence of edges and rough surfaces contributed to the increased friction existing between the aggregates by reducing their movement within the cementitious matrix and resulting in less workability of the entire mixture. On the other side, other research work, such as in the case of [
24], the workability was found to increase as the PET particles used had smoother exterior surfaces compared to the replaced sand.
The shape of the plastic particles was also found to affect the interaction existing between the PET plastic aggregate and the cement matrix. More regular shapes of plastic particles with small sizes and less than 5% of replacement can eliminate the adverse effect on the compressive strength of the concrete.
While plastic used as fibers in mortar and concrete is found to be advantageous, this research work concentrated on using plastic as aggregate replacement. Plastic fibers are found to increase the ductility of the concrete and enhance the ability of the cementitious matrix to resist shrinkage. In addition, the fibers were found to enhance the performance of steel-reinforced concrete beams by promoting the initial stiffness, the inelastic absorbed energy, and the overall ductility [
25]. In another study, the aging of fiber-reinforced concrete incorporating macro-synthetic fibers was found to be eliminated when FRC is exposed to different temperature ranges between −15 and 60 °C [
26].
While most research concentrated on utilizing one or two types of plastic in mortar or concrete, this study expanded the investigation to include five different types of plastic with different particle shapes to better understand the effect of those factors on cement mortar and concrete.
2. Materials and Methods
The sections to follow summarize the mechanical processing of the plastic products into fine aggregate-sized particles, the physical properties of the plastics used in the experimental study, and the methods used to prepare and test mortar cubes to determine the effect of utilizing plastic in cement mortar.
2.1. Mechanical Processing
A significant portion of plastic products is not accepted by curbside recycling companies and goes to landfills or incineration. Reusing such non-recyclable plastic products in the production of construction materials creates a market for their collection and use. This study concentrated on utilizing plastic products that are not usually collected by curbside companies for recycling purposes. The reasons for choosing specific plastic products to represent the different types of plastics in this study can be found in [
27].
The following describes the different products used in this study. Second-hand lawn chairs with plastic Type #5 (Polypropylene, PP) that were collected from the bulk trash of a residential compound. The lawn chairs were cut using a band saw into a maximum of 5 in. (125 mm) × 5 in. (125 mm) sized pieces before being ground using a Cincinnati Milacron mechanical granulator. Plastic grocery bags with plastic Type #2 (High-density Polyethylene, HDPE) were used. The bags were first melted in an oven at 150 °C before being cut using a band saw and then processed in the granulator to a fine aggregate size. Plastic utensils (i.e., knives, forks, and spoons) with plastic Type #6 (Polystyrene, PS) and the transparent clamshell containers with plastic Type #1 (Polyethylene Terephthalate, PET) were separately ground using the granulator directly without any previous processing. The utensils and the containers used were clean and not contaminated. Computer keyboards were used in this study, and they are made of different components and materials. The frame and keycaps are made of Acrylonitrile Butadiene Styrene (ABS) plastic and used in this study. The flexible rubber underneath each keycap, and a few thick aluminum wires, a cable, and a small circuit board were manually removed before grinding the keyboards’ plastic using the Cincinnati Milacron mechanical granulator. Acrylonitrile Butadiene Styrene (ABS) plastic is classified as plastic Type #7.
The Cincinnati Milacron mechanical granulator in the Integrated Systems Engineering (ISE) laboratories at the Ohio State University was used to separately grind the several types of recycled plastic products in this study to an artificial fine aggregate size—less than 0.187 in. (4.76 mm). The fineness modulus of the plastic particles ground using the mechanical granulator was found to range between 3.85 and 3.95, which required further sieving to the sand size used in the mortar mixtures.
The 20–30 standard testing sand was used to cast the mortar cubes in this study, which is a one-sized natural silica sand. The 20–30 testing sand has all its particles passed through sieve No. 20 (850 µm) and retained on sieve No. 30 (600 µm). The ground plastic was sieved, and particles retained on each sieve were stored separately. From each type of plastic used, particles passed through sieve No. 20 (850 µm) and retained on sieve No. 30 (600 µm) were used to cast the mortar cubes for this particular part of the study. More details about the mechanical processing of the plastics can be found in [
27].
2.2. Physical Properties of the Materials Used in the Mortar Mixtures
The same methods used for determining the physical properties of fine aggregate, such as specific gravity and absorption, can also be used to evaluate the properties of artificial plastic aggregate [
28]. To determine the specific gravity of the fine materials in this study, a pycnometer calibrated at one liter was used as per ASTM C128 [
29]. While 500 g of saturated surface dry sand is required for the test as per ASTM C128 [
29], the plastic used for this test was determined to have approximately the same size as 500 g of sand. Approximately 150 g of plastic particles were used.
The pycnometer was filled with the pre-weighed plastic waste sample and liquid up to the one-liter mark on the neck of the pycnometer. Kerosene with a specific gravity of less than 1.00 was used to determine the specific gravity of plastic. The pycnometer was then manually agitated and rolled to eliminate any entrapped air in the sample. Any drop in the liquid level was adjusted by adding more liquid. The pycnometer with the liquid and sample was then weighed.
As a following step, the pycnometer was emptied and filled just with the liquid up to the calibration mark and weighed. The density was calculated by dividing the mass of the dry sample by the volume of the sample. The volume of the sample was determined by subtracting the mass of the pycnometer filled with liquid and the sample from the sum of both the mass of the dry sample and the mass of the pycnometer filled with liquid. The specific gravity was calculated by dividing the density of the sample by the density of water (1 g/mL).
Table 1 summarizes the measured specific gravity of the plastics used in this study.
The 20–30 testing sand used in this study follows the specifications for the standard sands as per ASTM C778 [
30]. The specific gravity of the sand was found to be 2.65, as also specified by the producer “Humboldt”. The absorption of the plastic particles was evaluated as per ASTM C128 [
29], and it was found to be negligible for both the graded sand and the plastic particles and hence was considered to equal zero. Type I/Type II cement was used for mortars from the producer “Quickrete”.
2.3. Mixture Proportions of the Mortar
The control mortar cubes were prepared by mass proportioning the cement to the graded sand ratio of 1:2.75. The water-to-cement ratio used in this case was 0.485. The mixture proportions for the prepared mortars are shown in
Table 2, with plastic partially replacing sand.
2.4. Testing Workability
To evaluate the effect of using plastic on the flow of the cement mortar, the workability using the flow test described as per ASTM C1437 [
31] was used. The spread of the control mix (0% replacement) and the cement mortar prepared using plastic particles were evaluated. The standard brass flow mold, flow table, and caliper specified as per ASTM C230 [
32] were used in the flow test.
For determining the flow of the mortars, the flow tabletop surface and the interior face of the flow mold were wiped with a wet paper towel. The flow mold was then placed in the center of the flow table and filled in two layers. Each layer was tamped 20 times using a rubber tamping rod. For each layer, the tamping was uniformly distributed over the cross-section of the flow mold. The surface of the filled flow mold was then troweled with a straight edge, and the top of the table was cleaned. The flow mold was then left vertically, and the table immediately dropped 25 times. Using the caliper, the diameter of the mortar was measured along the four lines at the top of the flow table, and the number of caliper divisions was recorded. The average flow value represents the increment in the average diameter of the mortar, expressed as a percentage of the original diameter of the bottom opening of the flow mold, which is typically 4 inches (100 mm).
2.5. Methods for Cube Specimen Preparation and Testing
To determine the compressive strength development of the cement mortar, 2 in. (50 mm) cube specimens were prepared and tested as per ASTM C109 [
33]. The plastic particles were used for volumetric replacement of sand. The plastic fine aggregate was incorporated in proportions of 5%, 10%, and 15% by volume.
Rigid molds were used to cast the mortar cubes. A Hobart mixer was used to mix the fresh mortar to prepare the cubes. A quantity of material enough to fill nine cube specimens was mixed per batch. Some images for mortar cube mixing and testing are shown in
Figure 1.
The 2 in. (50 mm) cubes were filled in two layers and compacted by tamping using a rubber rod with a rectangular cross-section as per ASTM C109 [
33]. To fill the cubes, a layer of cement mortar was placed in about one-half of the three cubes in one mold, then tamped using the rubber tamping rod. Each layer was tamped 32 times in the order specified in ASTM C109 [
33]. The full tamping using 32 strokes was completed before moving to tamp the next cube. When the tamping of the first layer was completed for all three cubes in one mold, the second layer of mortar was applied and tamped as specified for the first layer. The top surface of the mortar in cubes was then troweled using a flat surface. After casting, the mortar cube molds were top-covered using plastic wrap and placed in the curing room in standard ambient curing conditions. The moist curing room had no less than 95% relative humidity and 73 ± 3 °F (23 ± 1.7 °C).
The hardened mortar cubes were demolded after 24 h of casting and were tested under compressive loading at the ages of 7 and 28 days. At least three cubes were evaluated for each percentage of replacement (5%, 10%, and 15%) at each age. After demolding, all mortar cubes were left in the moist curing room under standard ambient curing conditions until tested. Before compressive strength testing, the dimensions and mass of each mortar cube was measured and recorded to calculate density. Mortar cubes were tested directly after moving from the curing room, and the surfaces of the cubes were wiped to surface dry condition before testing.
A hydraulic compressive testing machine applying a uniaxial load with a maximum load capacity of 250 lb (113.398 kg) was used. A rate of compressive loading of 75 psi/s (0.517 MPa/s) was used to test the hardened cement mortar cubes. To achieve a uniformly distributed loading, the load was applied to the flat surfaces that were in contact with the interior surfaces of the cube mold. More details about the preparation and testing of the specimens can be found in [
27].
The strength of the cement mortar was calculated by dividing the maximum axial load recorded by the testing machine at specimen failure by the measured cross-sectional area of the cube specimen. Three cubes were evaluated at each age to determine the average strength of cement mortar at that specified age. The box and whiskers plot was used in robustness analysis for the purpose of detecting anomalous data (outliers).
3. Results and Discussion
Sections to follow summarize the main results and discuss the main findings of this research study.
3.1. Workability of Mortar
Figure 2 shows the average flow of fresh mortar mixtures incorporating different plastic particles at various percentages of volumetric replacement of sand.
Figure 3 shows the reduction in the average flow of fresh mortar incorporating different types of plastic particles at different percentages compared to the control mortar mix.
Using plastic particles with different shapes is expected to affect workability. The 20–30 testing sand used in this study for the mortar has a round shape, unlike the shape of the plastic particles. The PP, PS, and ABS particles have more angular shapes than the sand, while HDPE and PET particles were flaky. In addition to that, PET particles were hard while HDPE particles were flexible and easy to fold, which can highly affect their ease of movement in the fresh mortar, causing a reduction in the flow.
3.2. Compressive Strength Development of Mortar
Table 3,
Table 4,
Table 5,
Table 6 and
Table 7 summarize the average compressive strength of the mortar cubes at the age of 28 days with plastic particles partially replacing sand for the different types of plastics used in this study: PP, PS, ABS, HDPE, and PET.
Table 3,
Table 4,
Table 5,
Table 6 and
Table 7 and
Figure 2 show the reduction in average compressive strength at the age of 28 days of mortar cubes, incorporating various types of plastics at different percentages of replacement. The results showed a reduction in the compressive strength of the mortar incorporating plastic with the increase of the percentage replacement of sand.
Compared to the control specimen, the reduction in the compressive strength of the mortar cubes at 5% replacement ranged between 7–28% with an average reduction of 18%, and the range of reductions increased to be between 20–41% at replacement of 10% with an average reduction of 28%. The reduction ranged between 21–43%, with an average reduction of 32% at 15% replacement.
The highest compressive strengths were recorded for mortars incorporating PS, ABS, and PP particles as a replacement for sand, followed by HDPE and PET with the same percentage of replacement (
Figure 4 and
Figure 5). The reduction in strength most likely depends on the mechanical properties of the plastic used and its shape. The flaky shapes of the HDPE and PET particles are believed to cause more air content around the particles and, consequently, more reduction in the compressive strength, even though they have higher specific gravities compared to other types of plastics used in this study, as shown in
Table 1.
Generally, as discussed in the introduction, there is a weak bond between the cement matrix and the plastic surface, which contributes to increasing the air content of the mixtures containing plastic aggregates. As explained earlier, the main cause for the weak bond is the hydrophobic nature of plastic particles, which is along with the smooth surfaces of the plastic particles, inhibits the hydration of the cement near their surfaces. The interfacial transition zone (ITZ) acts as a wall between the plastic aggregate phase and the matrix phase in concrete, causing the wall effect phenomenon.
The plastic particles with higher specific gravities may have resulted in incorporating more mass of plastic in the mortar, which is believed also to adversely affect the compressive strength (quantities of plastic used are shown in
Table 2). It was also observed that the reduction in the compressive strength became slower with more stabilized compressive strength values as the percentage of plastic particles incorporated in the mortar was increased. The further average reduction in compressive strength was 3% for mortar cubes with 15% replacement compared to mortar cubes with 10% reduction, while the average reduction was 17.9% when the 5% replacement was incorporated and compared to the control.
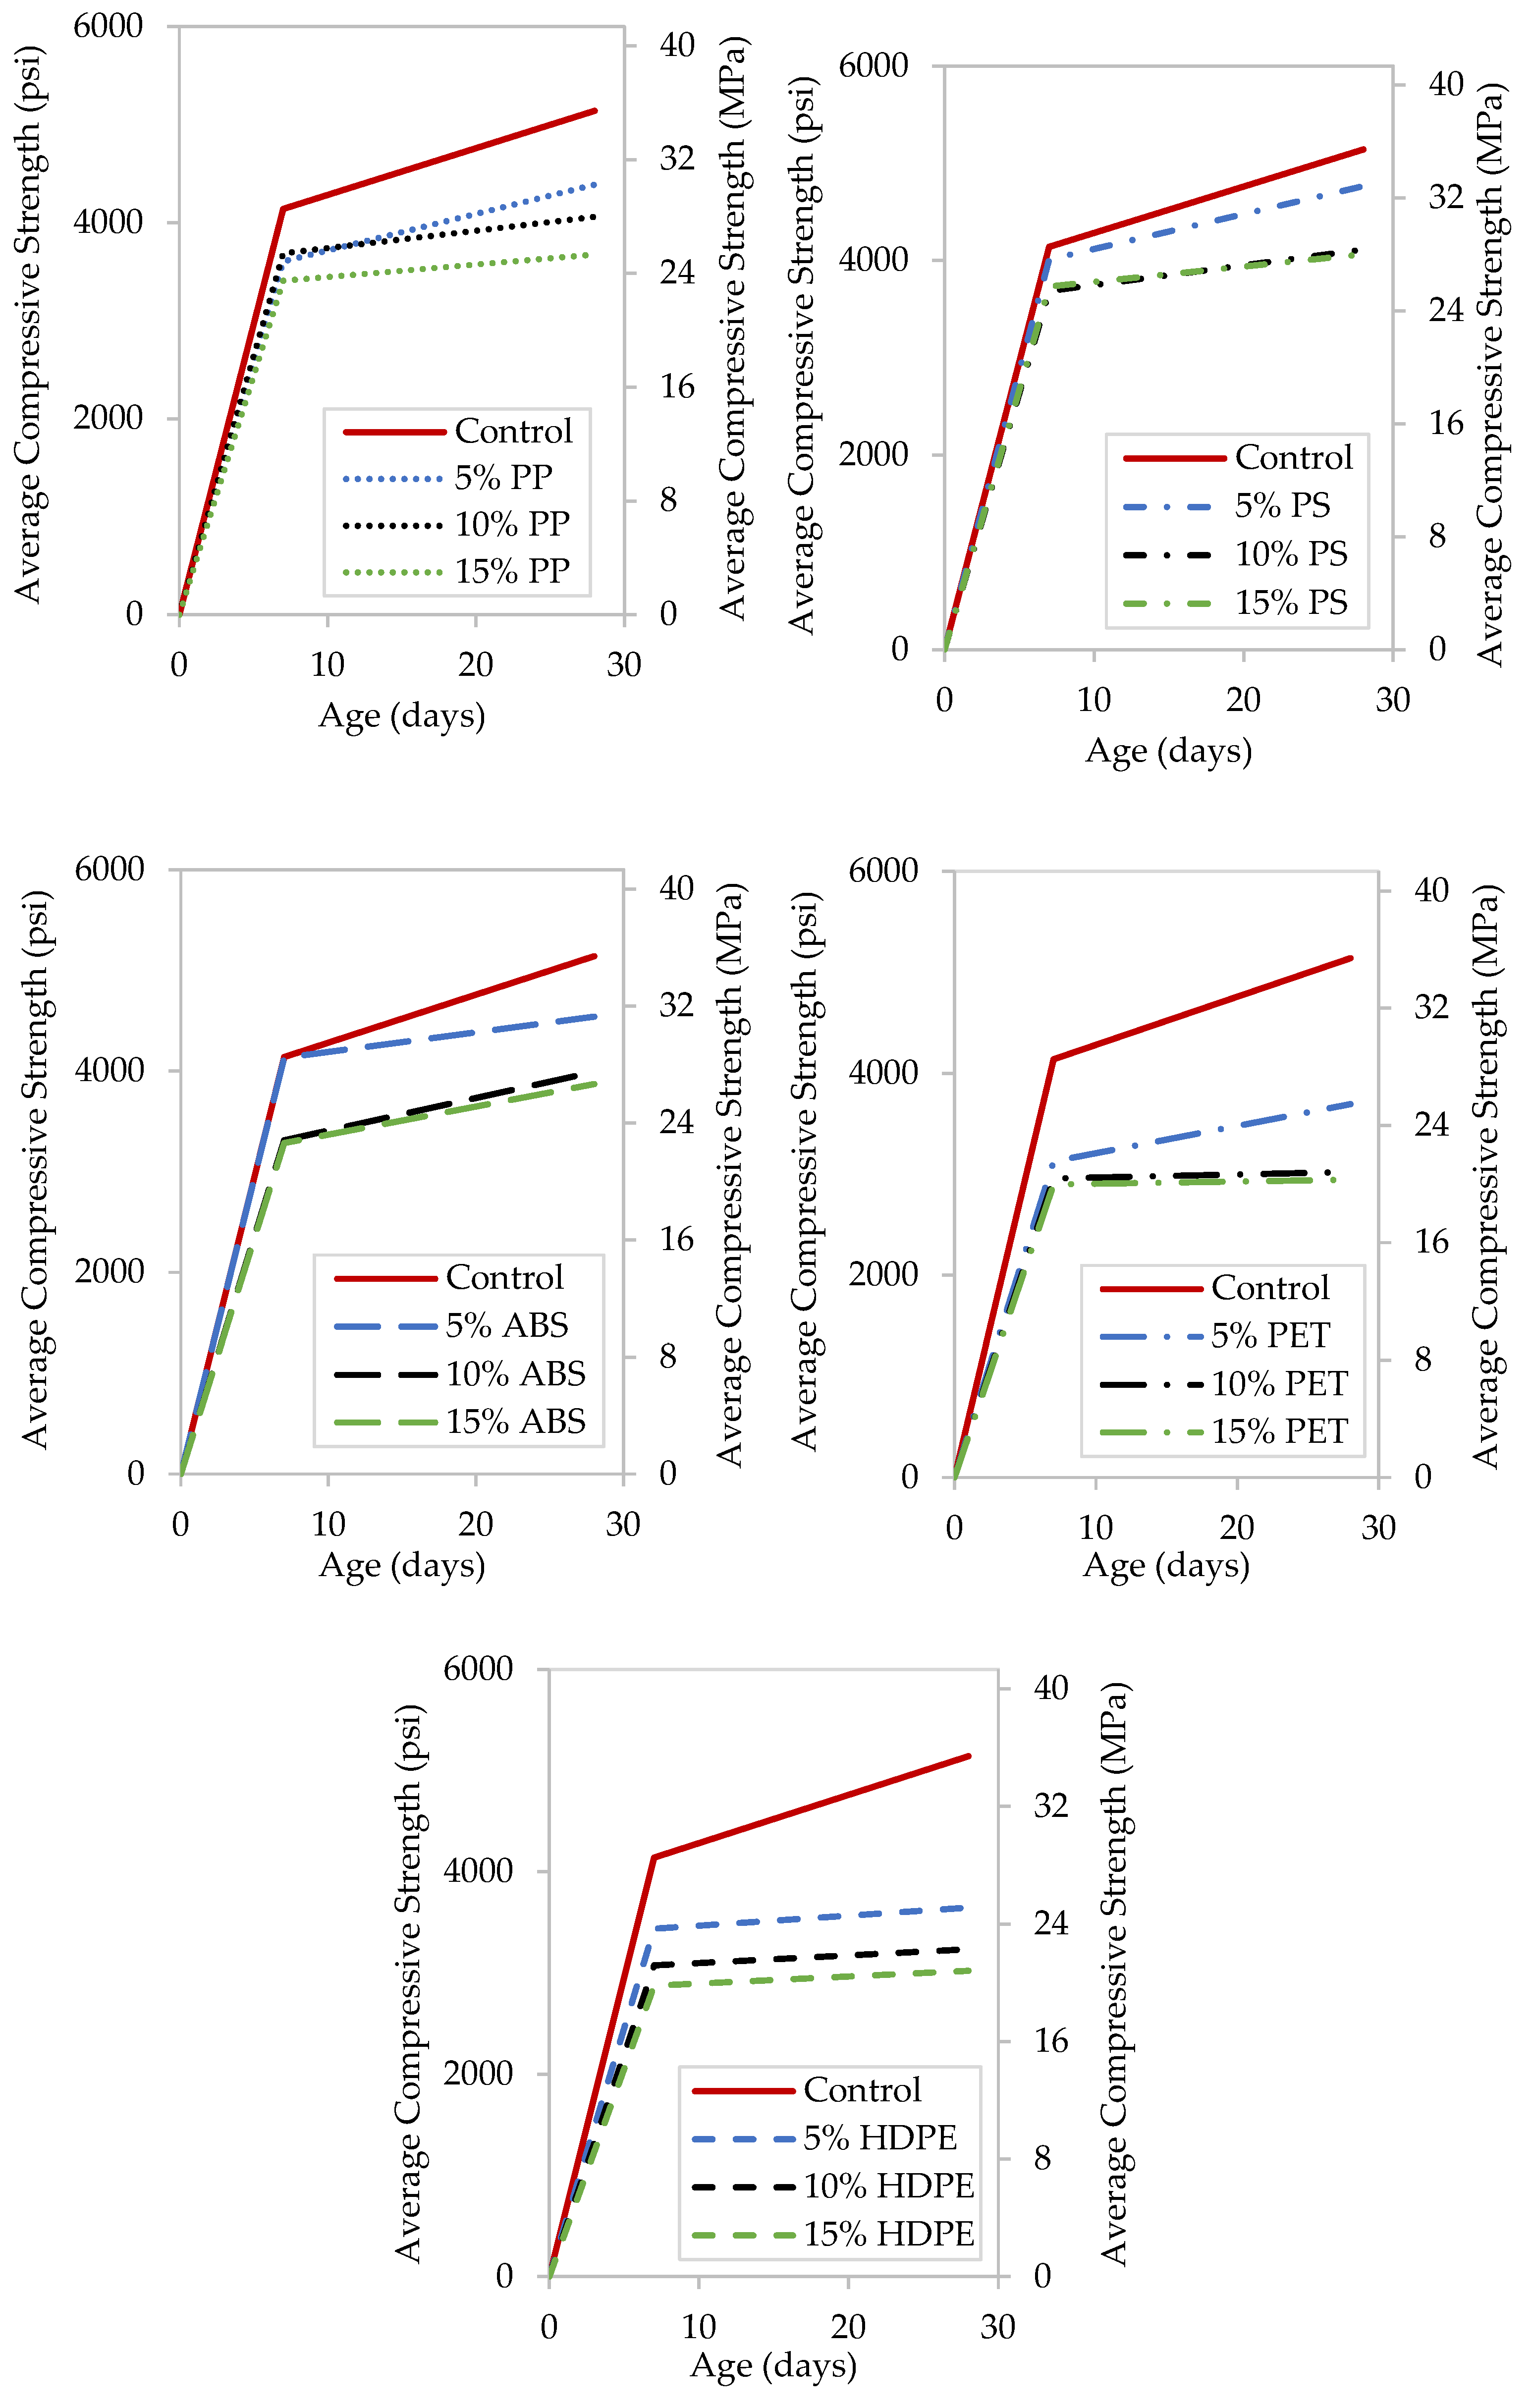
Figure 6 shows the strength development of mortar cubes incorporating various types of plastic used in this study with different sand replacements at both 7 and 28 days. At least three mortar cubes were tested for each percentage replacement for every type of plastic at both specified ages.
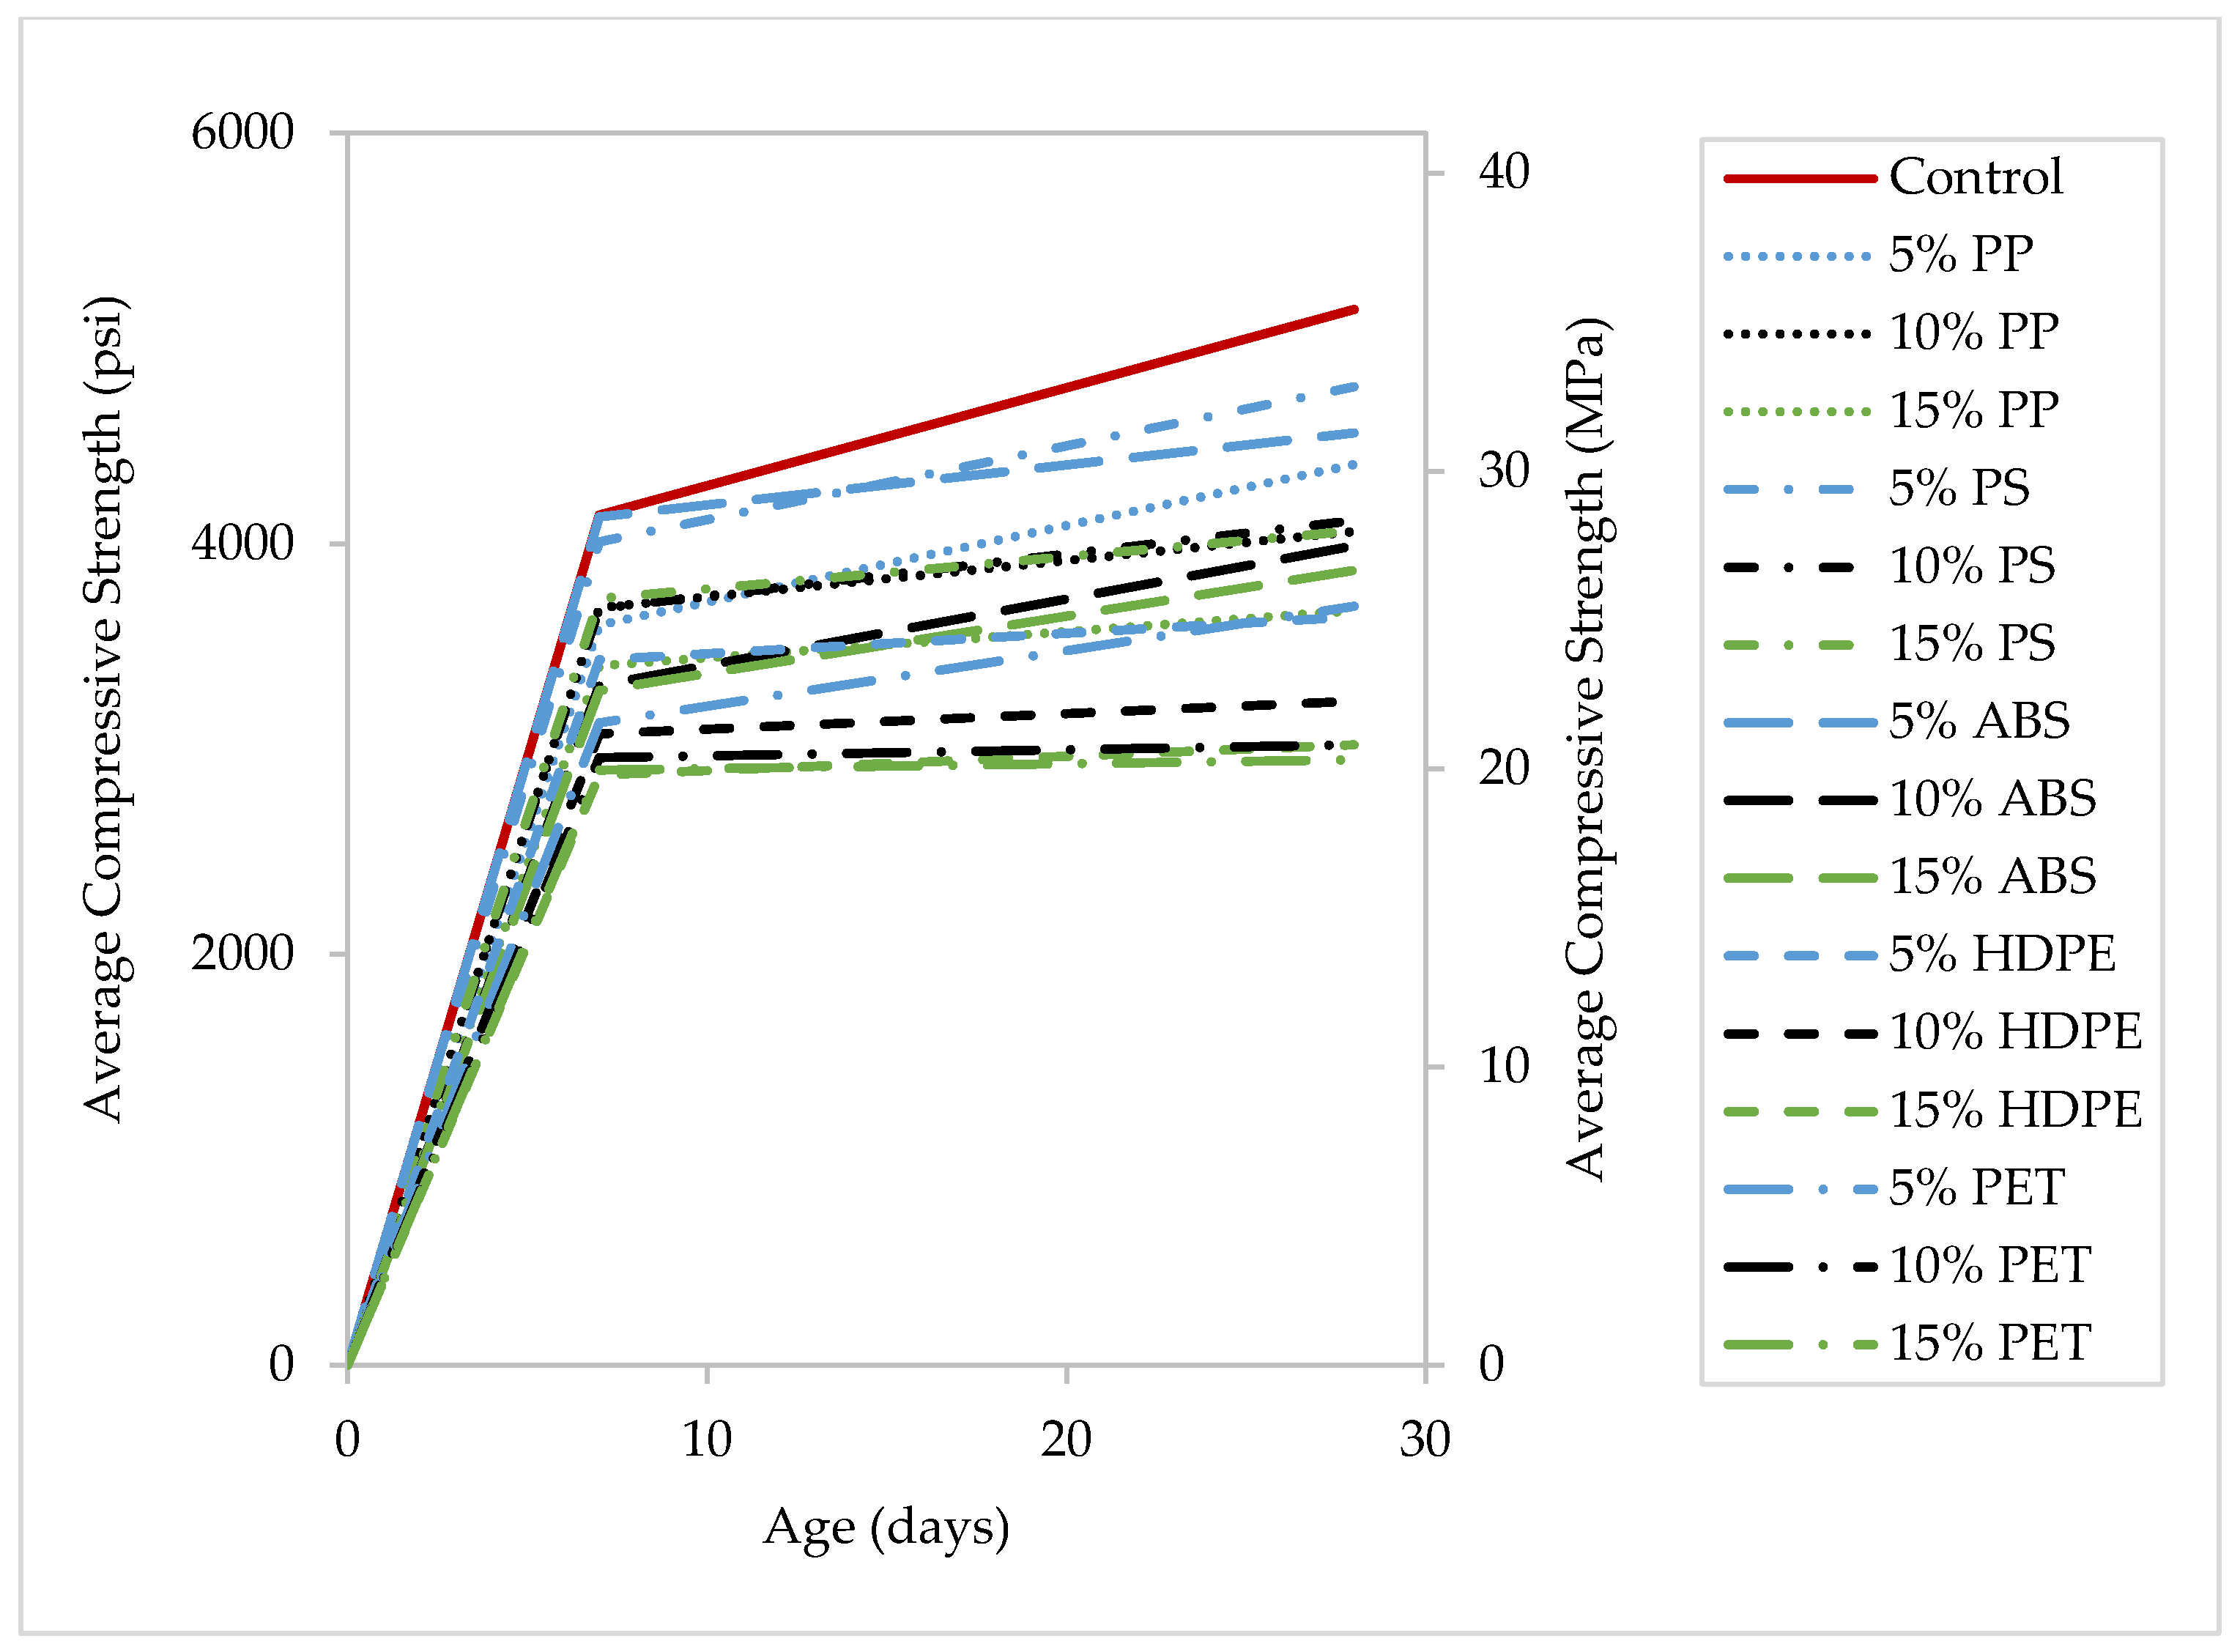
Figure 7 shows the compressive strength development for all mixes at the ages of 7 and 28 days.
The compressive strength development of the mortars incorporating plastic particles showed a general trend of a higher percentage of strength development between days 7 and 28, with less utilization of plastic particles in the mortar. Control specimens had a 19% average increase in compressive strength at 28 days compared to the results at the 7-day testing. The increment in compressive strength between days 7 and 28 was observed to decrease as the percentage of plastic particles replacing sand increased. An average increase in compressive strength of 13% was recorded when plastic particles incorporated in mortar cubes were 5% of the sand content. The compressive strength recorded a 9% increment when the percentage of replacement was 10%, and, even more, decreased to reach 7% at 15% replacement.
3.3. Density of the Mortar
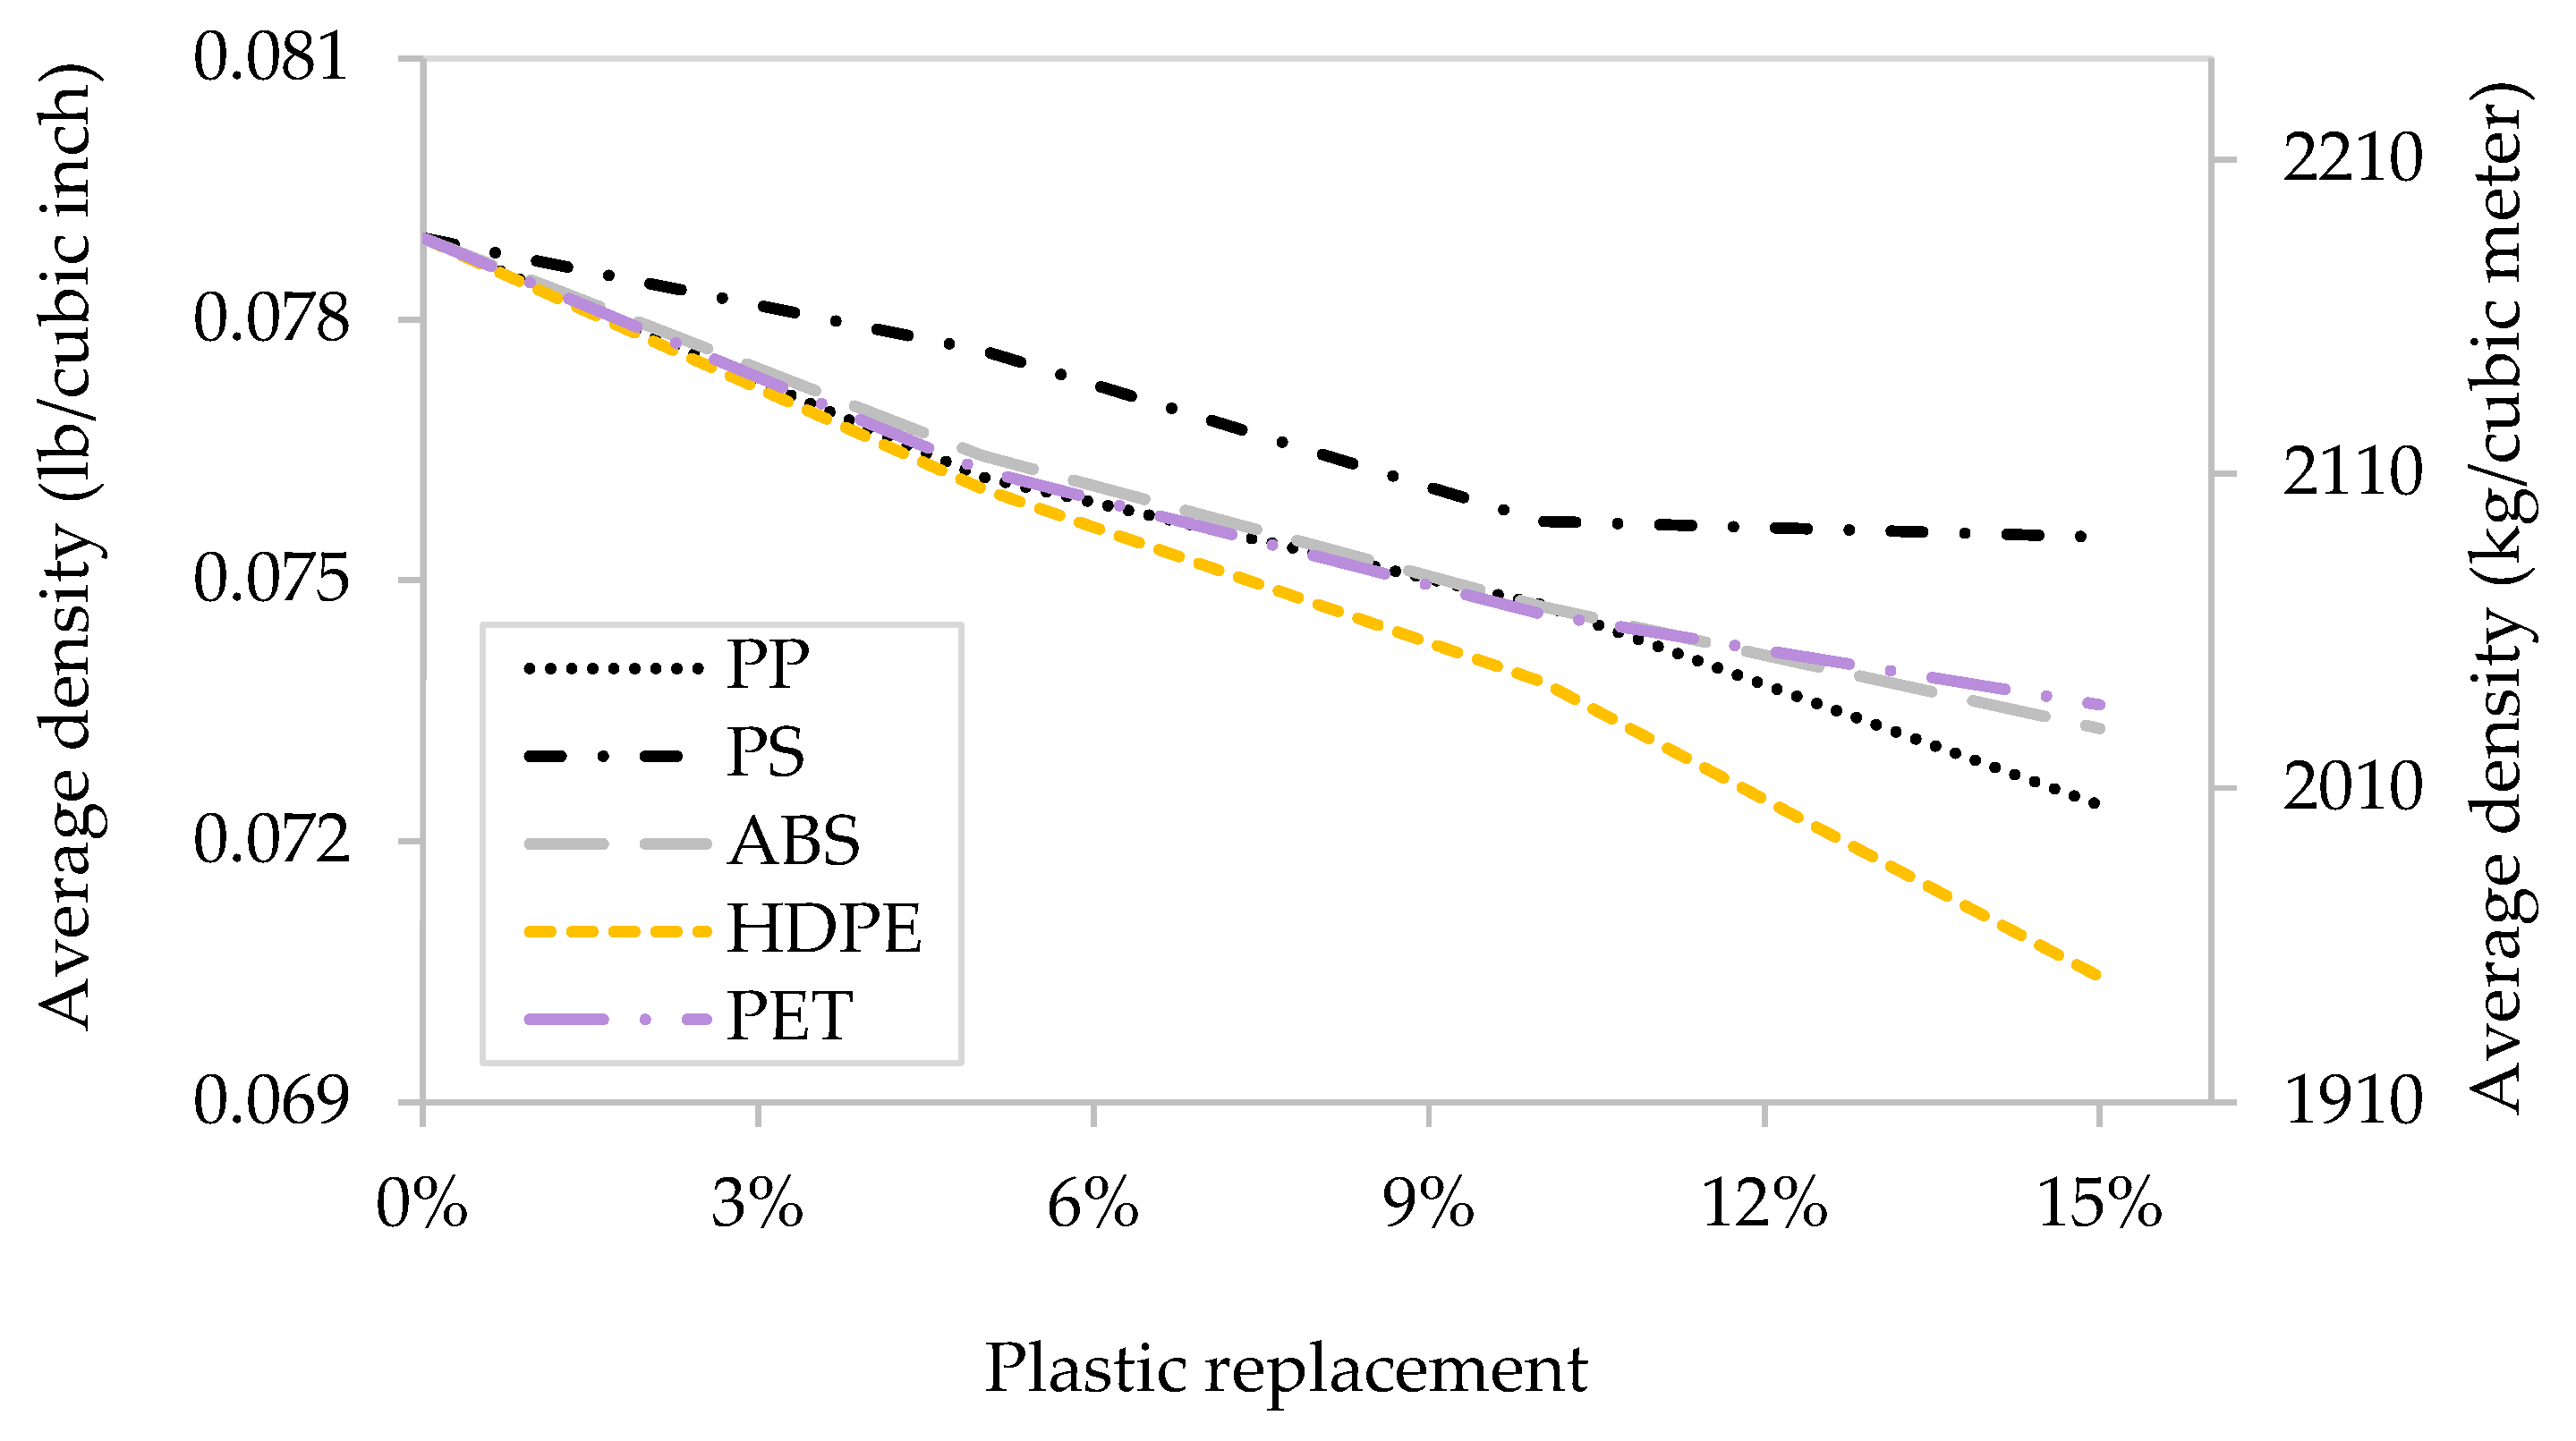
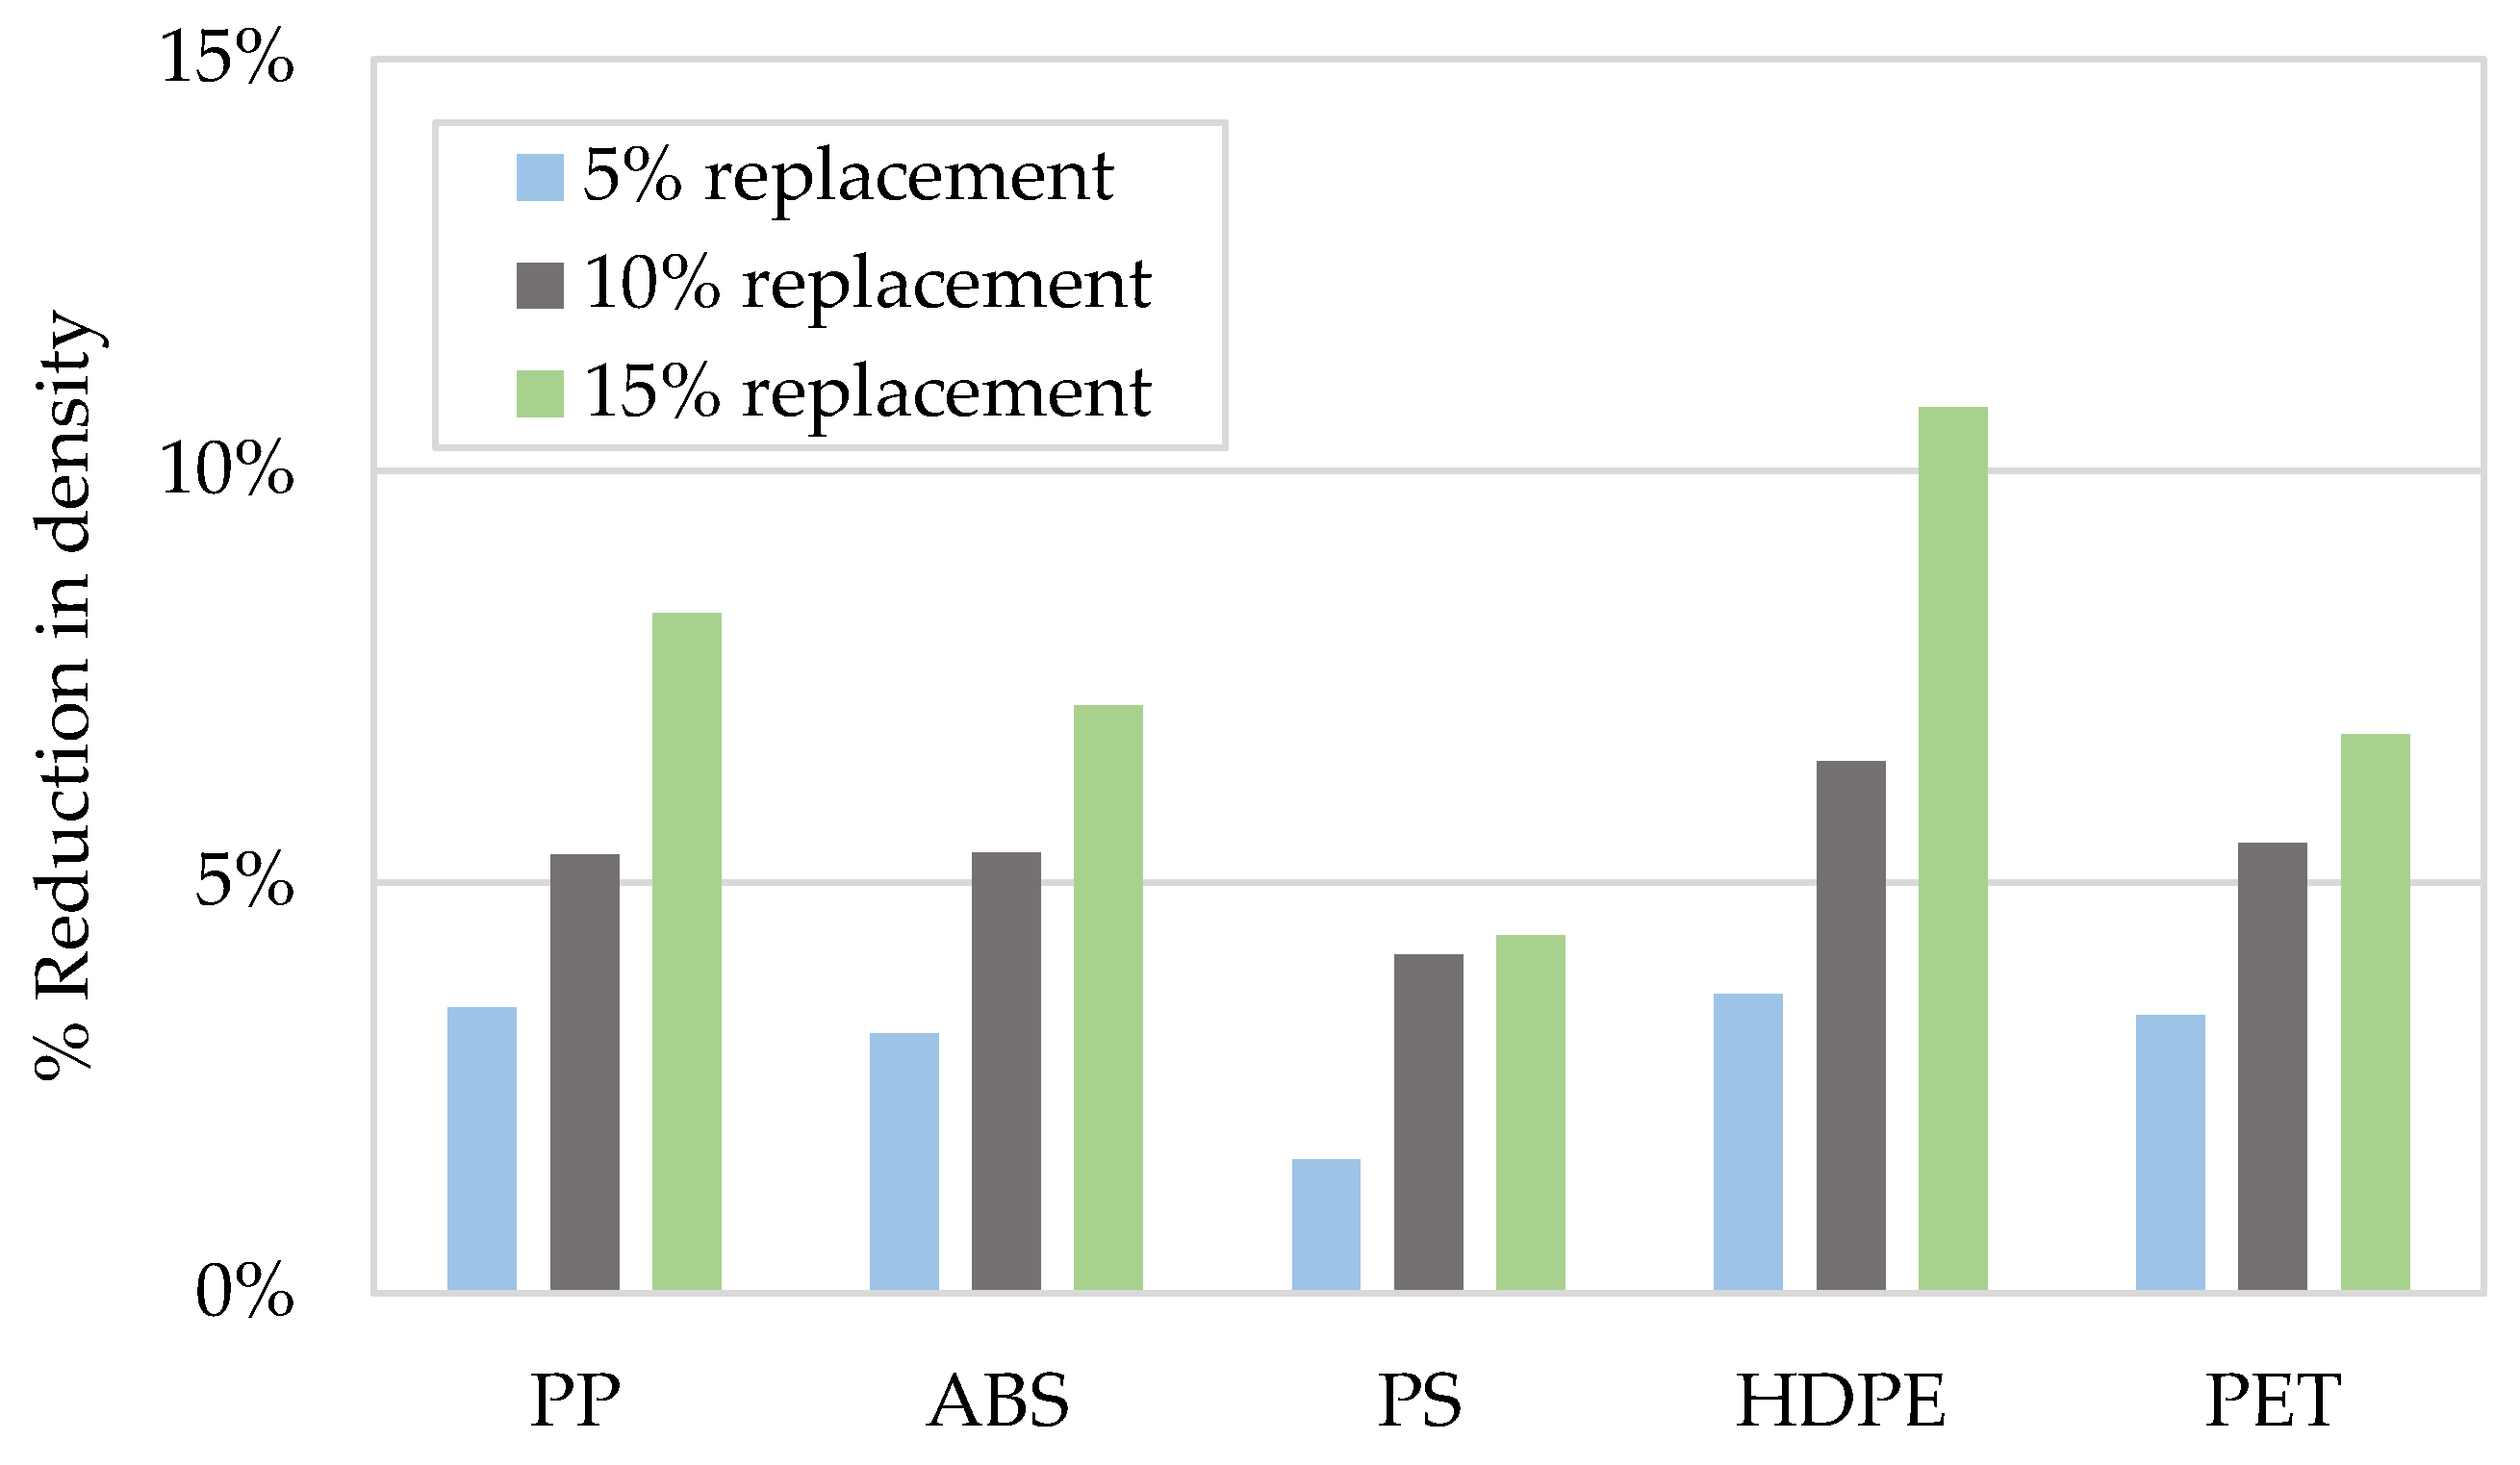
Figure 8 and
Figure 9 show the reduction in average density at the age of 28 days for mortar cubes incorporating different types of plastic particles at different percentages. At least three mortar cubes were weighed at each percentage replacement for the several types of plastics for density determination purposes. The observed reduction in the density can be referred to as the low density of the plastic particles incorporated in the mortar cubes. The further reduction observed in the HDPE particles is believed to be caused by the flexible and flaky shape of its particles, which most probably caused an increase in air content in the mortar.
3.4. The Predicted Compressive Strength Model
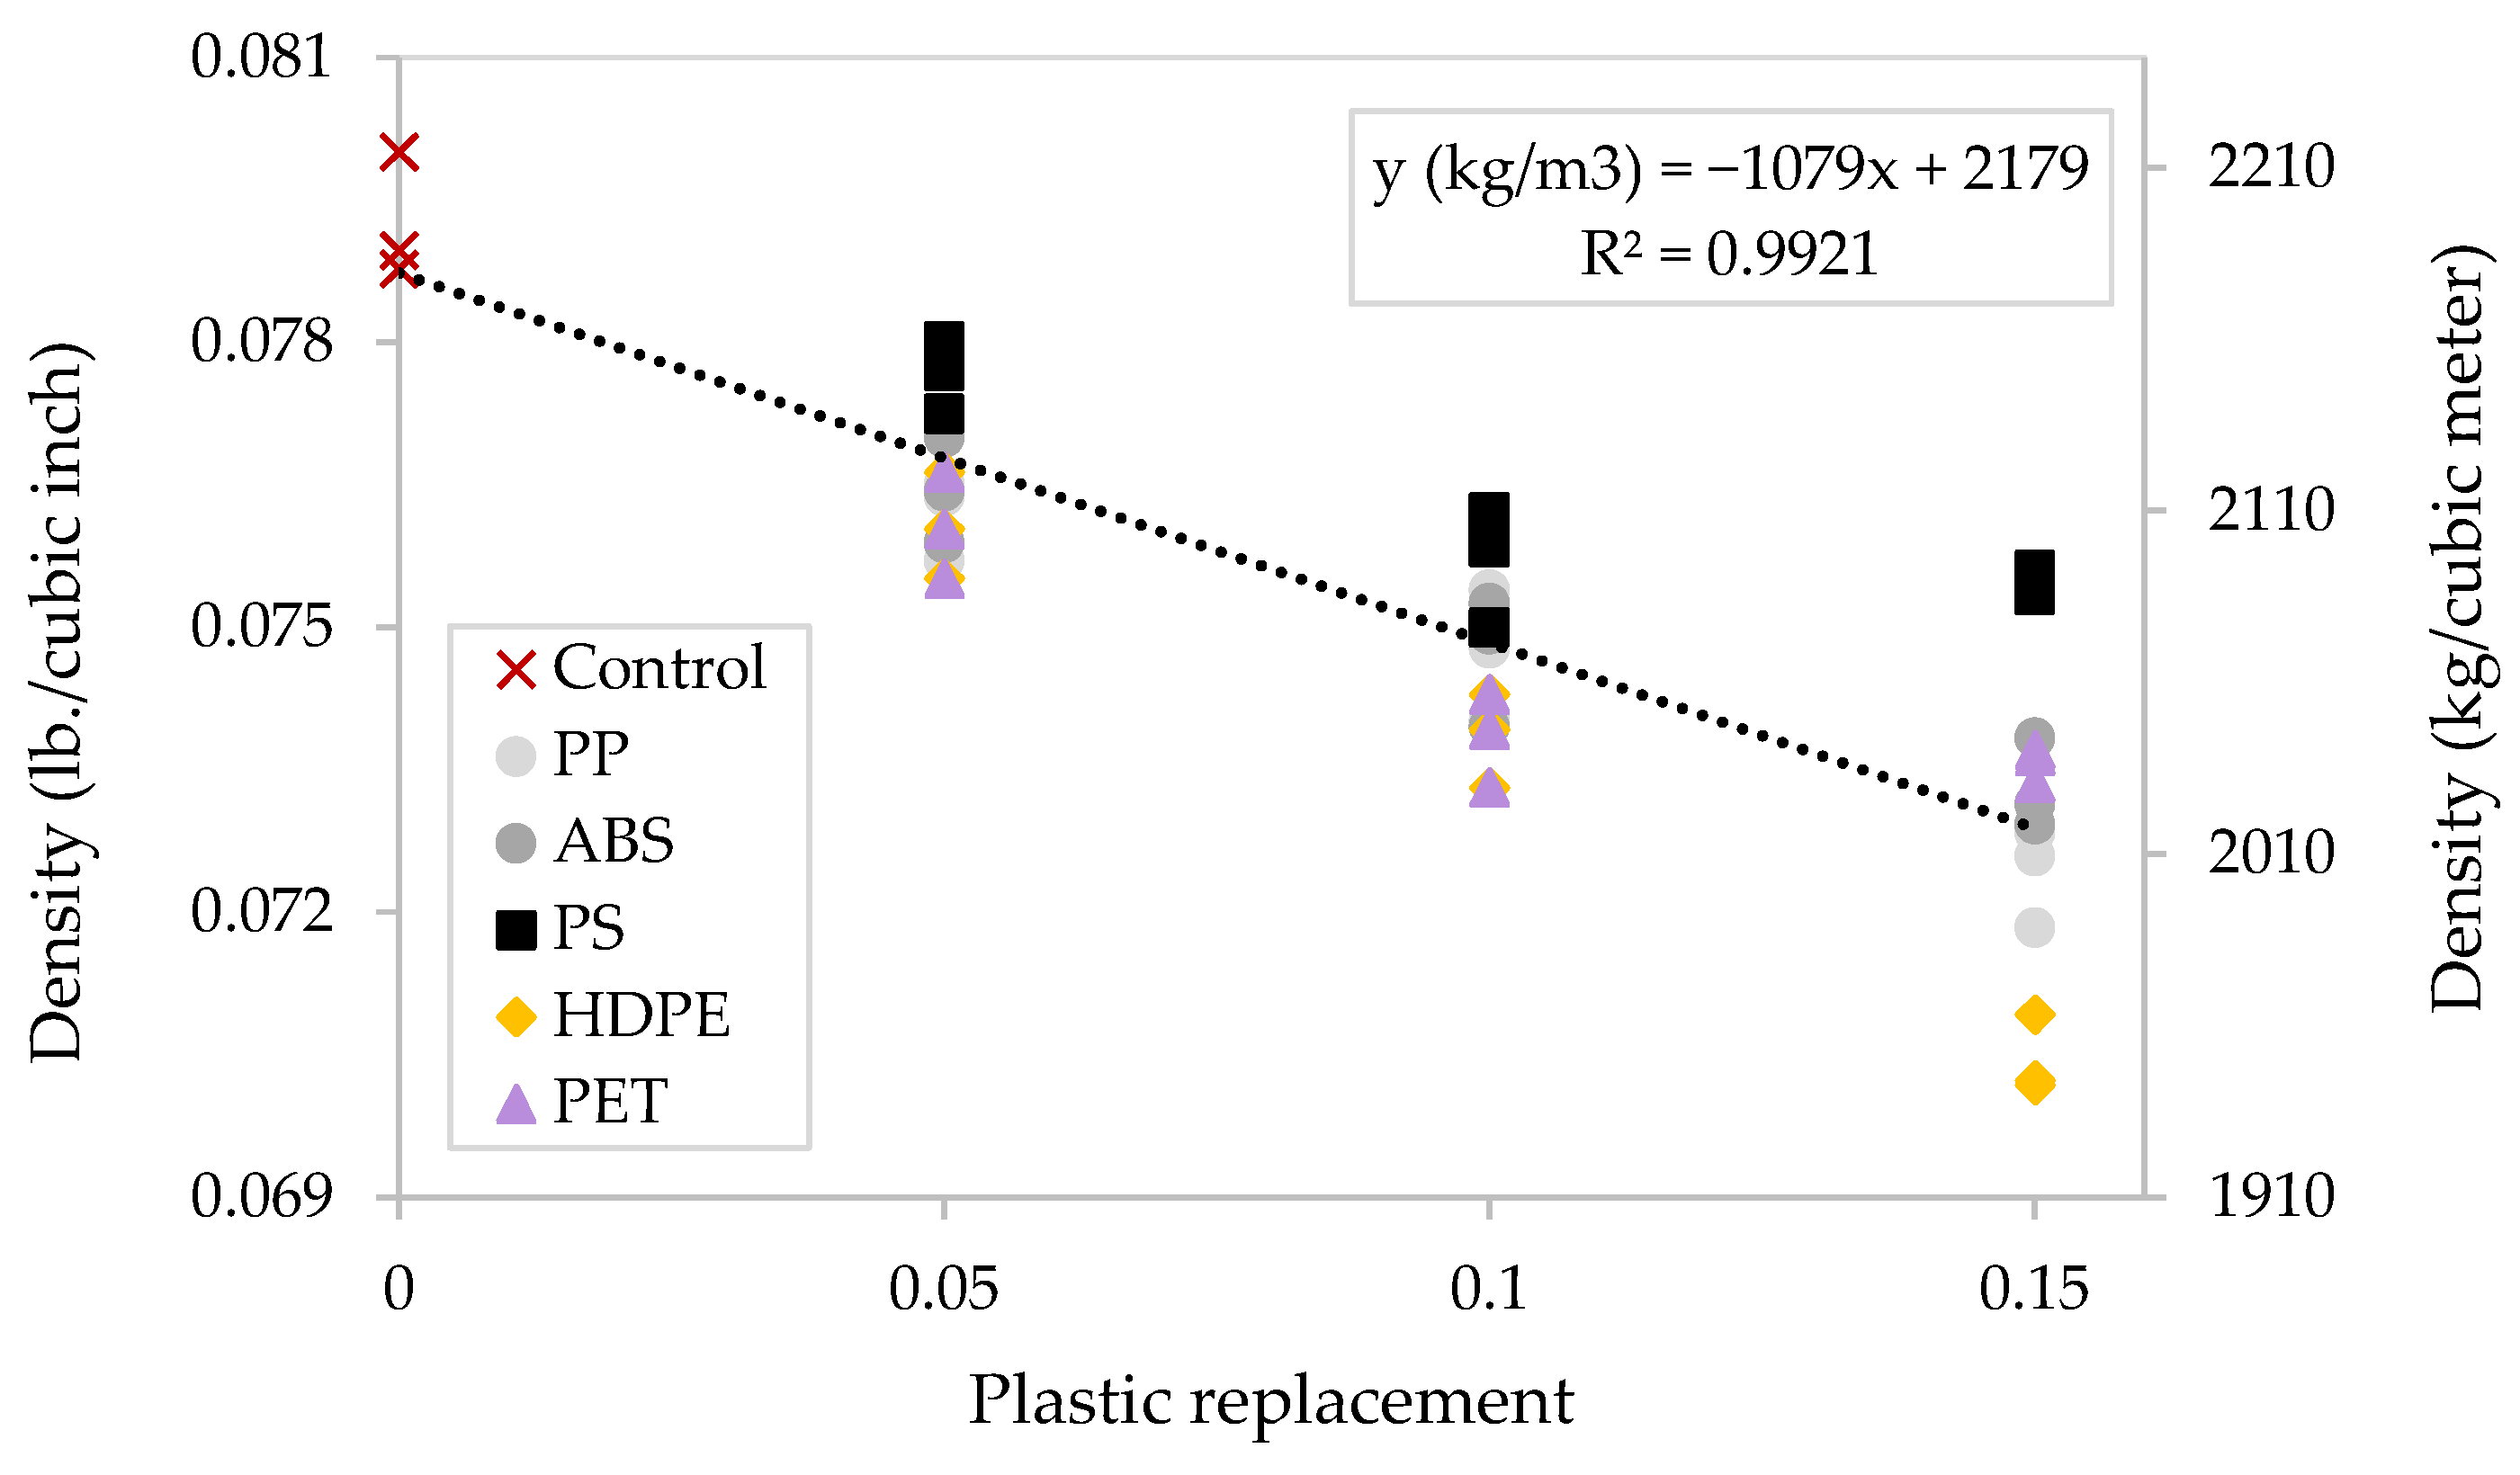
Based on the total experimental data collected from mortar cubes incorporating plastics as a partial replacement of sand, a linear model was suggested to predict the compressive strength of mortar cubes at the age of 28 days as a function of both the control compressive strength (0% replacement) and the percentage of sand replacement, as shown in
Figure 10.
The compressive strengths of 15 cubes incorporating different types of plastic for each percentage of replacement were graphed for the model development. The best linear regression fit was used for the average of the total compressive strength of the data collected from each of the different types of plastic at each replacement of 0%, 5%, 10%, and 15%. The linear equation used for the model is shown in Equation (1).
where
is the predicted compressive strength of mortar incorporating plastic particles as a sand replacement at the age of 28 days (MPa),
is the percentage of plastic particles replacing sand (%), and
is the compressive strength of mortar with 0% replacement at the age of 28 days (MPa).
Figure 11 shows the results for the box and whiskers plot that was used for detecting anomalous data and created by DATAtab. The box and whisker graphs showed no outliers, therefore, all the collected data were incorporated in the analysis.
The one-way analysis of variance (ANOVA) for the total experimental data collected on the 28-day compressive strengths of mortar cubes incorporating plastics as a partial replacement for sand in different volumetric percentages is reported in
Table 8.
The results of the ANOVA, with a recommended significance level of 5% [
34], indicate a significant difference in the compressive strengths for mortars incorporating different types of plastic particles as replacements for sand. Mainly, two factors, the type of plastic and its shape, can contribute to the distribution of the results of the compressive strength of the mortar. Different types of plastics will have different strengths and properties that would affect the compressive strength of the cementitious material. Additionally, the flaky shapes of the particles would contribute to trapping air underneath, resulting in a further reduction in the compressive strength of the mortar.
This conclusion leads to the recommendation to investigate the compressive strength of the mortar or concrete involving plastic before proceeding to use it in any application. Different plastic products and the mechanical processing used for grinding can lead to different particle shapes. The plastic products collected for curbside recycling can also experience environmental conditions that can affect their properties.
3.5. The Predicted Density of Mortar Model
Based on the total experimental data collected from mortar cubes incorporating plastics as a partial replacement for sand, a linear model was suggested to predict the density of mortar at the age of 28 days, as a function of both the density of the control specimen (0% replacement) and the percentage of sand replacement as shown in
Figure 12.
The densities of 15 cubes incorporating different types of plastic for each percentage of replacement were graphed for the model development. The best linear regression fit was used for the average of the total densities of the data collected from each of the different types of plastic at each replacement of 0%, 5%, 10%, and 15%. A linear equation was used for the model as shown in Equation (2).
where
is the predicted density of mortar incorporating plastic particles as a sand replacement at the age of 28 days (kg/m
3),
is the percentage of plastic particles replacing sand (%), and
is the density for mortar with 0% replacement at the age of 28 days (kg/m
3).
Because of the challenge in grinding and sieving plastic particles from different types and products into the desired size, this study was performed using 2 in. (50 mm) mortar cubes. More experimental work, including the replacement of sand in concrete using specific types of plastics, can be found in [
27]. In addition, this article concentrates merely on reporting the mechanical properties. Testing the mortar and concrete, including plastic particles as a replacement for aggregate, can be extended in future publications to include durability and long-term properties.
4. Conclusions
This paper concentrated on the utilization of five different types of post-consumer plastics in concrete. Products made from plastics were mechanically ground into artificial fine aggregate. They were used to prepare a standard cube specimens by partial volumetric replacement of the sand. The study evaluated the effects of using plastics on the density and compressive strength development of cement mortar. The plastic products used in this study are usually not collected by curbside recycling facilities and are discarded in landfills or incinerated.
Generally, a reduction in the density of the hardened mortar was observed as the percentage of replacement increased, with an average density reduction of 7.5% with 15% plastic replacement. A reduction in the compressive strength of the hardened mortar was observed as the percentage of replacement increased. The maximum reduction in the average compressive strength reached 32% at 15% plastic replacement. The workability of the fresh mortar decreased as the percentage of replacement increased, with a greater decrement observed for flaky-shaped plastic particles. The maximum reduction in workability was 38% for the replacement using 15% of the flaky-shaped HDPE particles.
Linear models were proposed to predict each of the density and the compressive strength of the mortar incorporating plastic particles as a function of both the control compressive strength or density (0% replacement) and the percent of sand replacement up to 15%.
The density and the shape of the particles for the plastic used as a sand replacement were found to influence the density and compressive strength of hardened mortar. Among the plastic types that were used in this study, using PS, ABS, and PP in mortar caused an average reduction in compressive strength of 25% at 15% replacement. Those three different types of plastics shared similar angular particle shapes. On the other hand, while HDPE and PET have higher specific gravity, mortar cubes prepared using those plastic types experienced an average reduction in compressive strength of 42% at 15% replacement. It is believed that the flaky shape of their particles caused a higher reduction in the strength of the cubes.


