Article

Evaluation of Touchdown Loop-Mediated Isothermal Amplification for the Detection of Giardia duodenalis

Biomicrofluidics Laboratory, Faculty of Information Technology and Bionics, Pázmány Péter Catholic University, Práter Str. 50/A, 1083 Budapest, Hungary
*
Author to whom correspondence should be addressed.
Parasitologia 2025, 5(2), 25; https://doi.org/10.3390/parasitologia5020025
Submission received: 24 March 2025 / Revised: 30 April 2025 / Accepted: 7 May 2025 / Published: 16 May 2025
(This article belongs to the Special Issue The Molecular Epidemiology of Parasites)

Abstract

:
Giardia duodenalis is a flagellated protozoan pathogen causing parasitic enteric disease outbreaks worldwide. Among detection methods, loop-mediated isothermal amplification (LAMP) has high selectivity and sensitivity, and the detection time is lower than that of conventional molecular methods. In this study, three published Giardia LAMP primer sets were tested and adapted to touchdown LAMP conditions. The measurement time, the volume of reagents, the effect of the denaturation step, different kinds of polymerases, and the presence or absence of betaine on the reaction were tested and evaluated. Based on the results of this study, the 66–60 °C range touchdown LAMP with the use of betaine, 90 °C denaturation step, Bst 2.0 WarmStart® DNA Polymerase, and the primer set of Momoda et al. were the optimal conditions. We increased the analytical sensitivity of the LAMP reaction to 7.8- and 8-fold higher than the previously published methods for G. duodenalis assemblages A and B, with detection limits of 20 and 19.5 fg/assay, respectively, instead of 156 fg/assay. The detection time was less than 49 min for G. duodenalis assemblage A and less than 35 min for assemblage B, compared to the previously published 60 min. Our optimized LAMP protocol can be directly applied to improve Giardia LAMP tests in routine testing laboratories, could be implemented in standard diagnostic or environmental monitoring workflows, and can be used for the development of Giardia LAMP point-of-care devices or high-throughput systems.

1. Introduction

Giardia is a eukaryotic, flagellated, binuclear parasitic protozoan, of which at least six species have been distinguished to date that infect mainly mammals, birds, and humans [1]. Five of these species are represented by isolates from amphibians (G. agilis), birds (G. ardeae, G. psittaci), muskrats and voles (G. microti), and rodents (G. muris), while the sixth can be found in a large range of other mammalian hosts (G. duodenalis) (syn. G. intestinalis) [2]. There are eight major assemblages (A–H) of G. duodenalis, but mainly assemblages A and B have been found in humans to cause a generally self-limited clinical illness (i.e., giardiasis) characterized by diarrhea, bloating, weight loss, abdominal cramps, and malabsorption [3]. Giardia is among the six parasites under surveillance by the European Centre for Disease Prevention and Control and has a morbidity rate of 6–8/100,000 per year in Europe and the USA [4]. The World Health Organization Foodborne Disease Burden Epidemiology Reference Group (WHO/FERG) quantified the global and regional burden in 2010 of 31 foodborne hazards, including four protozoa and ten helminths. Intestinal protozoa were responsible for nearly 90% of illnesses, including Giardia spp. [5]. In 2016, Giardia duodenalis was ranked among the top 10 foodborne parasites in Europe [6]. Among foodborne diseases, giardiasis causes a considerable burden at the global level, and in a One Health context, the estimates of disease burden include reduced human and animal health, economic losses, environmental contamination, and the impact on biodiversity [7].
Giardia has a complex epidemiology and can be transmitted through water, food, and feces; furthermore, there is no preventive vaccination for human giardiasis, and prevention and early detection are therefore critical ([8,9]). Nowadays, we have several possible diagnostic tools for the detection of Giardia: microscopic, immunological, and molecular methods, and these diagnostic modalities vary in their reliability and applicability [10]. Currently, ISO standards 18744 and 15553 are used for the detection of both Cryptosporidium and Giardia on leafy greens and berry fruits and in water samples. The standards rely on the elution of parasites from food matrices or the concentration of high amounts of water by filtration, followed by immunomagnetic capture and visual detection by immunofluorescence microscopy. The procedure is expensive and time-consuming and cannot identify the parasites at the genetic level [11,12].
Microscope-based detection methods for fecal samples, such as the immunofluorescent test (IFT) and direct examination after the zinc sulfate centrifugal flotation technique and sucrose gradient centrifugation, have limitations since they require a skilled parasitologist, and the diagnostic yield is dependent on proper stool collection [13].
Molecular methods (e.g., polymerase chain reaction (PCR)) and immunological assays (enzyme-linked immunosorbent assay (ELISA), immunodiagnostic tests, or immunochromatographic tests) can effectively complement or replace microscopic approaches [7,14]. PCR-based reactions require precise temperature control; therefore, isothermal DNA amplification methods are becoming more widespread.
One of the most widely used isothermal methods is loop-mediated isothermal amplification (LAMP), which can achieve ten times higher sensitivity and greater specificity than standard PCR-based reactions [15]. The first LAMP assay developed for G. duodenalis detection was published based on the EF1α gene sequences [3]. Then, a new LAMP assay was developed that targeted the 18S rRNA gene [16]. Recently, a LAMP assay was published based on the EF1α gene sequences for the detection of G. duodenalis in dogs [17]. The 18S ribosomal RNA is an SSU rRNA, a component of the eukaryotic ribosomal small subunit (40S), which is one of the most frequently used genes in phylogenetic studies and an important marker for random target PCR in environmental biodiversity screening [18]. The 18S gene is highly conserved, rendering distinction between different subassemblages difficult [19]. EF1α is a protein-coding gene that encodes an isoform of the alpha subunit of the eukaryotic elongation factor 1-complex, which is responsible for the enzymatic delivery of aminoacyl tRNAs to the ribosome [20]. This gene also has discriminative value for assemblages. Lass et al. demonstrated, for G. duodenalis assemblages A and B, that the LAMP assay was the most sensitive of three molecular detection methods (real-time PCR, nested PCR, and LAMP) for water samples collected from natural water reservoirs and wells [21]. Lass et al. also analyzed 36 environmental water samples using three molecular detection methods (LAMP, real-time PCR, and nested PCR), and for the LAMP reaction, they used the primer set of Plutzer et al., which proved to be suitable for the detection of Giardia in environmental water samples. For Listeria monocytogenes, it has been shown that, compared to the conventional LAMP method, touchdown LAMP increases the overall sensitivity [22]. Touchdown LAMP is a modification of LAMP in which the initial reaction temperature is higher than the optimal melting temperature of the primers and is gradually reduced over subsequent cycles until the melting temperature is reached. With this method, nonspecific amplifications can be avoided, and shorter detection time can be also achieved.
Here, we report the evaluation of a touchdown LAMP assay for the detection of G. duodenalis assemblage A and B with the three primer sets available in the international literature. The aim of this study was to optimize and evaluate a touchdown LAMP protocol using the published primer sets for G. duodenalis assemblages A and B, with the goal of improving sensitivity, speed, and reproducibility for future diagnostic applications. The optimal reaction conditions, including the temperature range and the effects of denaturation, betaine, polymerases, and the reaction mixture composition, were also evaluated. We also provide a methodological summary and practical recommendations for laboratories using Giardia LAMP in a standard laboratory environment.

2. Materials and Methods

2.1. LAMP Primers

The three primer sets currently available for the detection of G. duodenalis by LAMP were designed by three research teams [3,16,17] based on GenBank sequences using Primer Explorer V5 Software (http://primerexplorer.jp (accessed on 2 February 2019)). The software considers the melting temperature, GC content, distance between possible primer regions, and stability of the primer ends. The primer sets of Plutzer and Li et al. were designed using the EF1α DNA sequence of G. duodenalis assemblage B (Accession No. AF069570) and assemblage D (Accession No. not available), respectively, while Momoda et al. targeted the 18S rRNA gene (Accession No. AF473852). The primer sequences used are shown in Table 1, and the alignment of the reference sequences of the 18S rRNA and EF1α DNA of Giardia are shown in Tables S3 and S4. The primer sets used in this study were previously published and validated for specificity. Plutzer et al., Momoda et al., and Li et al. each tested their primer sets against non-target Giardia assemblages or other intestinal protozoa and reported no significant cross-reactivity. These primers were selected based on their demonstrated specificity; therefore, the authors of this paper did not perform specificity tests of different Giardia assemblages or related organisms.

2.2. DNA Preparation and Analytical Sensitivity Measurements

Genomic DNA of G. duodenalis assemblage A (Portland-1 isolate) was purchased from American Type Culture Collection (ATCC® 30888DTM). The amount of lyophilized genomic DNA obtained was 2 µg, with an OD260/OD280 ratio of 1.6 to 2.0. The DNA was rehydrated with 50 µL 1× TE buffer and was placed at 55 °C for 45 min according to the manufacturer’s suggestion. From the DNA stock solution, a tenfold dilution series was made, which resulted in a working solution of 200 fg/µL, which differs minimally from the theoretical estimated 195 fg Giardia DNA content for one cyst [23]. To determine the sensitivity of the LAMP assay, a further dilution series was prepared from the working solution, resulting in concentrations of 100 fg/µL, 20 fg/µL, and 2 fg/µL, and these working solutions were used for LAMP technical replicates.
The EasySeedTM suspension, in which each tube contained between 98 and 102 inactivated Cryptosporidium oocysts and Giardia cysts, was centrifuged at 1100 g for 15 min, and the sediment was used for DNA extraction [12] by the QIAmp DNA Mini Kit (QIAGEN, Hilden, Germany), as suggested by the manufacturer. Ten freeze–thaw cycles were performed after resuspension in lysis solution to rupture the wall of the Giardia cyst [3]. Liquid nitrogen was used for freezing, and thawing was carried out at 60 °C in a water bath (Grant Instruments, JB Aqua 12, Cambridge, UK). Giardia DNA was eluted in 100 µL elution buffer, resulting in a theoretical concentration of 195 fg/µL Giardia DNA (assuming an average of 100–100 oocysts and cysts in the EasySeedTM suspension), i.e., the amount of Giardia DNA was not quantified by UV spectrophotometer or fluorometric assay. For the analytical sensitivity test, this Giardia DNA stock solution was further diluted to concentrations of 97.5 fg/µL, 19.5 fg/µL, and 1.95 fg/µL. DNA stock solutions from another EasySeedTM were also prepared, and these distinct solutions were used for technical replicates. The minimal value of concentrations where all the replicates of the LAMP reaction had a positive amplification plot and were confirmed by gel electrophoresis was defined as the detection limit.

2.3. Reaction Components and LAMP Parameters

The published and commercially available materials of the LAMP assay are shown in Table 2.
Some LAMP reaction conditions are common to all published methods and were used in this study: reaction mixture of 25 µL containing 1.6 µM each of FIP and BIP, 0.2 µM each of F3 and B3 (HPLC-purified), 8 mM MgSO4 (6 mM magnesium sulfate solution + 2 mM in the buffer), and 8 U of DNA polymerase (which was also the manufacturer’s recommendation). Although all previously published G. duodenalis LAMP reactions [3,16,17] were performed with the Bst DNA polymerase large fragment (New England Biolabs, Beverly, MA, USA), in this study, we tested two new types of polymerases, the Bst 2.0 WarmStart ® DNA Polymerase and Bst 3.0 DNA Polymerase, because of their improved amplification speed, yield, salt tolerance, and thermostability. All the polymerases used are moderately thermostable DNA polymerases with strand displacement activity that can perform isothermal amplification reactions, such as LAMP. However, the Bst 2.0 Warmstart DNA Polymerase is an in silico designed homolog of the Bst DNA Polymerase Large Fragment engineered for improved amplification reaction properties. The LAMP reaction was performed with 1× isothermal amplification buffer (20 mM Tris-HCl, 10 mM (NH4)2SO4, 50 mM KCl, 0.1% Tween® 20 (pH 8.8 at 25 °C) and 2 mM MgSO4) for Bst 2.0 or 1× isothermal amplification buffer II (20 mM Tris-HCl, 10 mM (NH4)2SO4, 0.1% Tween® 20 (pH 8.8 at 25 °C) and 2 mM MgSO4) for Bst 3.0. The amount of dNTPs used was different in each of the three published works (2.8 µM; 2.5 µM; 2.5 mM). Therefore, the recommendations for the typical LAMP protocol [24] were followed, and 1.4 mM dNTP was added to the reaction mixture. In the protocol of Momoda et al., the concentrations of FLP and BLP are not available; in the protocols of Plutzer et al. and Li et al., 0.8 µM FLP and BLP were used. For these reasons, the typical LAMP protocol recommendations by New England Biolabs 2019 [24] were also followed, and 0.4 µM FLP and BLP were used in this study. Plutzer et al. used 1.6 M betaine, and Li et al. and Momoda et al. used 0.8 M betaine, while several other LAMP protocols (Inc., 2019) do not require betaine. Therefore, the effect of the presence and absence of betaine at 1.2 M (the average of Plutzer et al. and Momoda et al.) was also investigated. The LAMP reaction was performed on 1 µL of DNA. SYBR Green I (SYBRTM Green I Nucleic Acid Gel Stain, 10,000× concentrate in dimethyl sulfoxide (DMSO), ThermoFisher Scientific, Waltham, MA, USA) was also added at a final concentration of 1×, as recommended for the 7300 154 Fast Real-Time PCR System (ThermoFisher Scientific, USA). SYBR Green is a commonly used fluorescent dye that binds double-stranded DNA molecules by intercalating between the DNA bases. The fluorescence can be measured at the end of each amplification cycle to determine at which cycle the amplification started and relatively how much DNA was amplified. Based on the optimal reaction temperature range of the polymerases (from 60–72 °C) and the principle of the touchdown LAMP method, the temperature range was divided into four equal parts (Touchdown LAMP Set—TLS1-4) to determine the optimal reaction conditions for all primer sets (Table 3), namely, those conditions where the lowest detection limit and minimum threshold time with no nonspecific product formation were attainable.
Each serial dilution was tested, and the lowest dilution at which DNA was amplified was deemed the detection limit. The threshold time was defined as the lower inflection point of the amplification curve. The effect of denaturation was also measured for the possibility of further simplifying the reaction, i.e., omitting the denaturation step can further simplify the protocol, while the denaturation step can reduce the number of nonspecific bindings and amplifications, and nonspecific secondary structures.

2.4. LAMP Protocol

LAMP reactions were performed in a 7300 Fast Real-Time PCR System (ThermoFisher Scientific, USA). In the case of denaturation, the mixture was heated to 95 °C for 2 min and then chilled on ice. Next, 8 U Bst 2.0 WarmStart® DNA Polymerase or Bst 3.0 DNA Polymerase was added. In the case of touchdown LAMP set 1 (TLS1), the reaction mixture was kept at 64 °C for 5 min, 62 °C for 5 min, 60 °C for 5 min, and 58 °C for 60 min. In the TLS2 heating protocol, all the temperatures were increased by 2 °C; in the case of the TLS3 protocol, all the temperatures were further increased by 2–2 °C; and finally, in the TLS4 protocol, we reached the polymerase recommended upper temperature limit (72 °C). To terminate the reaction, heating at 95 °C for 15 s, 60 °C for 60 s, and 95 °C for 15 s was used.

2.5. Gel Electrophoresis and Evaluation of the LAMP Products

The amplified products were analyzed using an AlphaImager Mini gel imaging analysis system (ProteinSimple, Santa Clara, CA, USA) following electrophoresis on a 2% agarose gel (MetaPhorTM Agarose, Lonza, Durham, NC, USA), which was stained with GelRed® nucleic acid gel stain (Biotium, Fremont, CA, USA); a GeneRuler Low Range DNA Ladder (ThermoFisher Scientific, USA) was also used. Both nontemplate amplification from LAMP primers and carryover contamination from the previous reaction product can result in false-positive results in LAMP. To check carryover contamination, negative (no-template) controls were added to each reaction cycle. Nontemplate amplicons were visualized by electrophoresis in an agarose gel of the LAMP product. The positive LAMP products showed ladder-like patterns, indicating the formation of stem–loops with inverted repeats. Consistent patterns were recorded for true positive samples; furthermore, the lowest molecular weight band produced by the outer primers (F3 and B3) matched the target DNA fragment size. In the case of nonspecific product formation, the above-described structure was missing, and several small fragments were also produced.

2.6. LAMP Repeatability

For preliminary repeatability tests, the LAMP reactions were performed in duplicate for all reaction combinations of TLS1-4, betaine, Bst 2.0 WarmStart®, and Bst 3.0 DNA polymerases and the denaturation step, in which negative controls were always included (Table S2). Based on the results, the optimal conditions were determined. Optimal conditions were selected based on the following criteria: no false-positive reactions, shortest reaction time, and highest analytical sensitivity. With the optimal conditions, a total of three or four technical replicates were implemented for assemblages A and B. All the results (threshold times of the amplification plot) of repeatability tests under optimal conditions were used for statistical analysis.

2.7. Statistical Methods

For G. duodenalis assemblages A and B, the mean values of all measured threshold times were calculated for every concentration value (200, 100, and 20 fg/assay and 195, 97.5, and 19.5 fg/assay for assemblages A and B, respectively), and then the standard deviation (SD- the square root of the variance of threshold times) was determined. The coefficient of variation (CV) was defined as the ratio of the SD to the mean.

3. Results

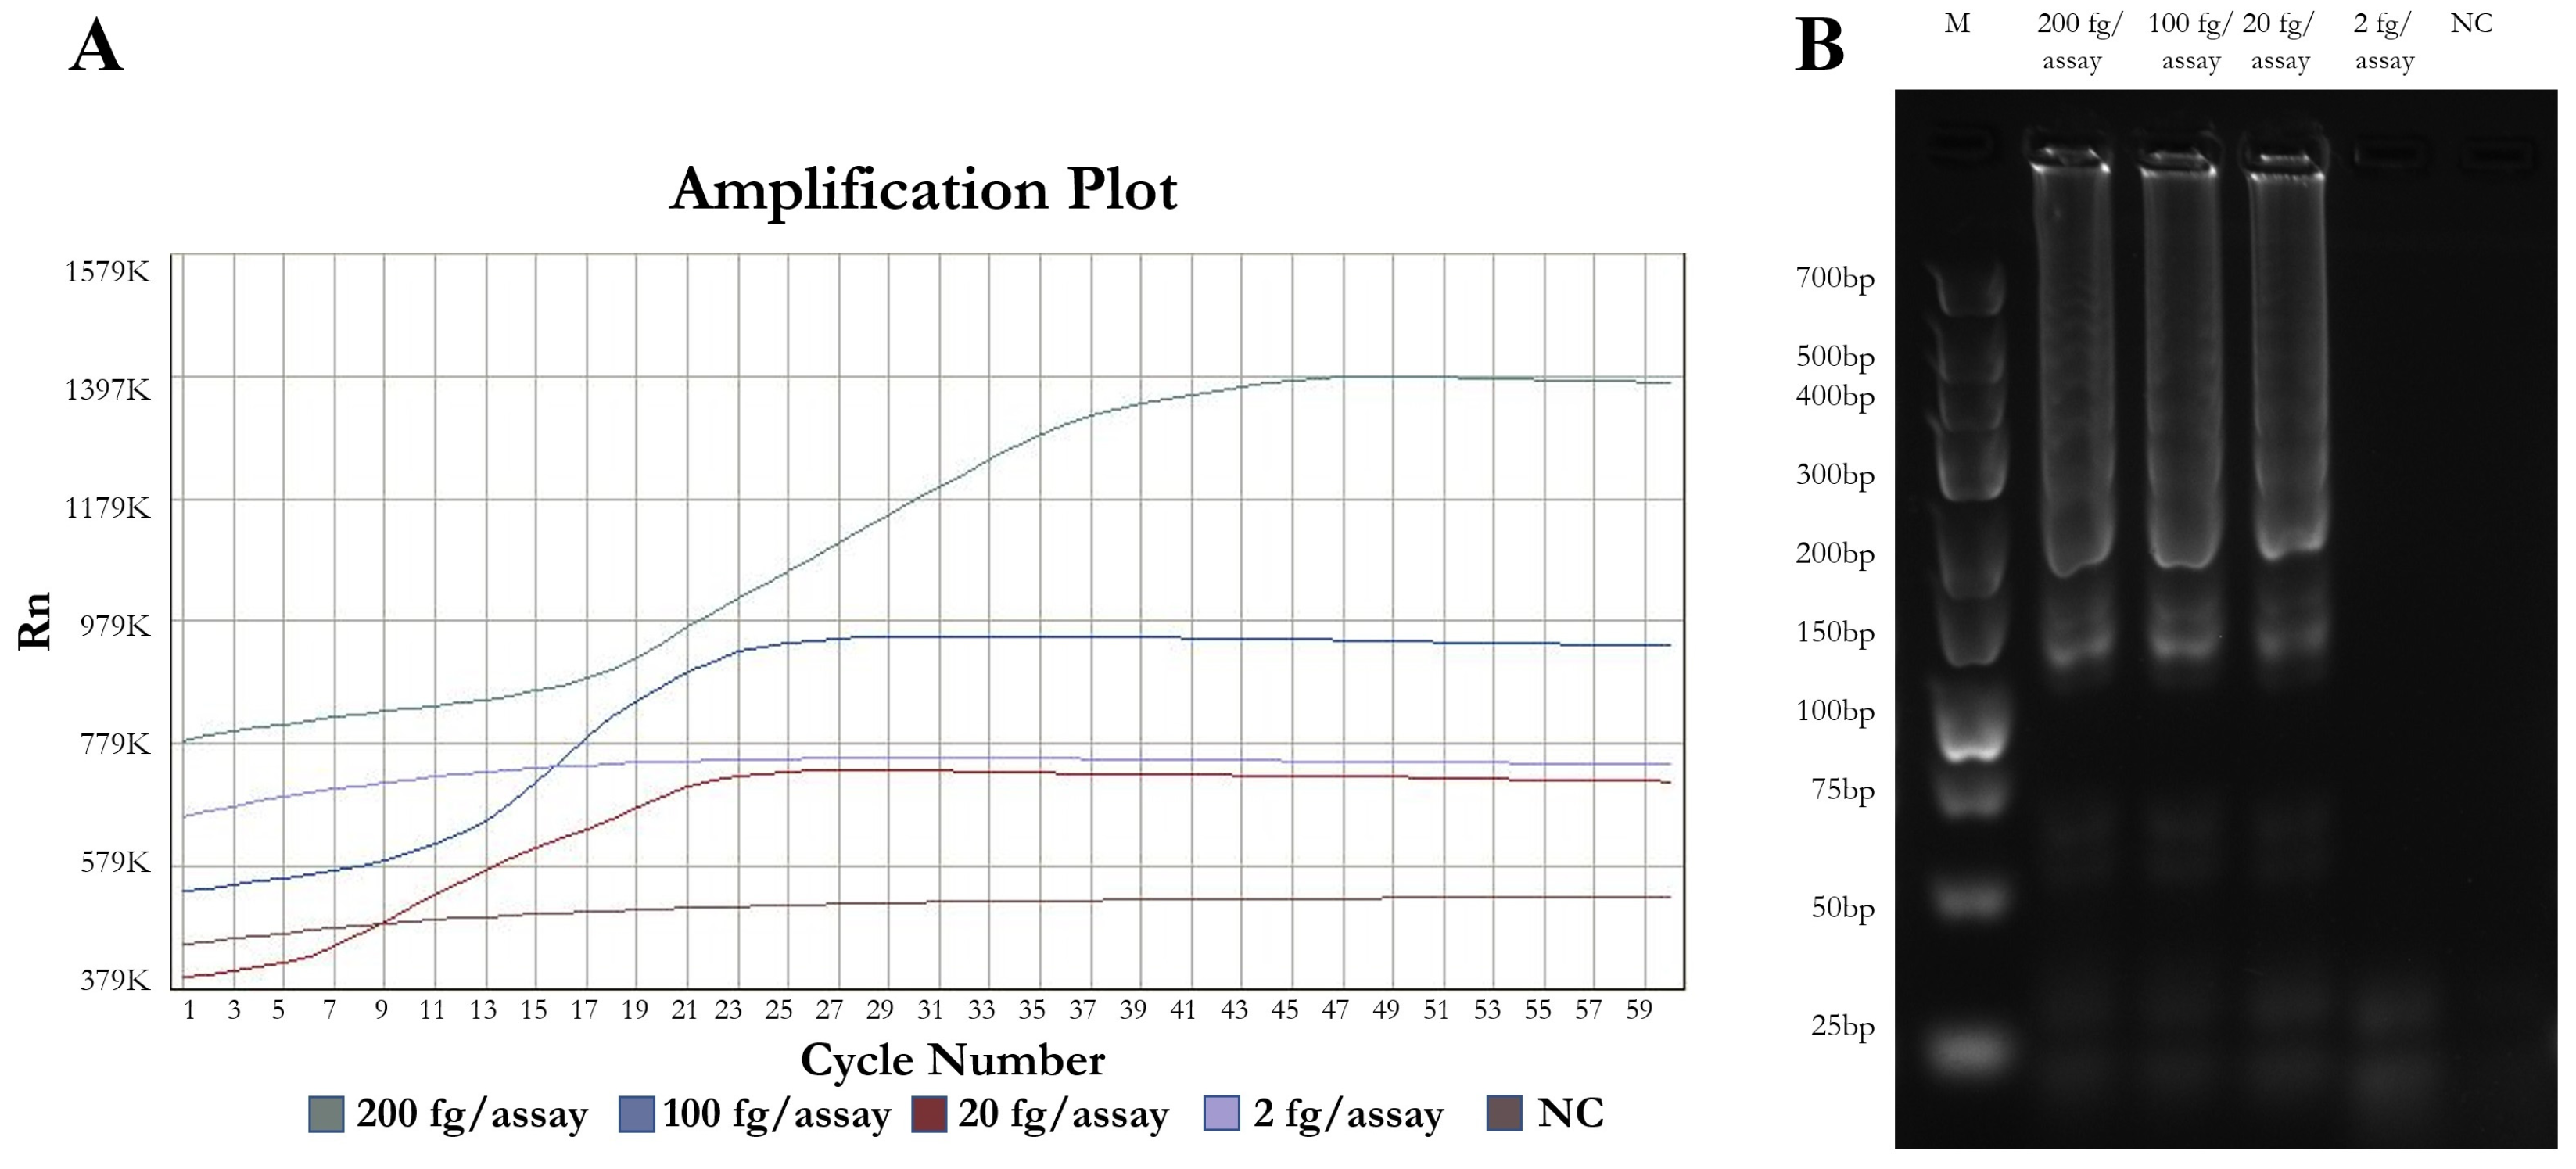
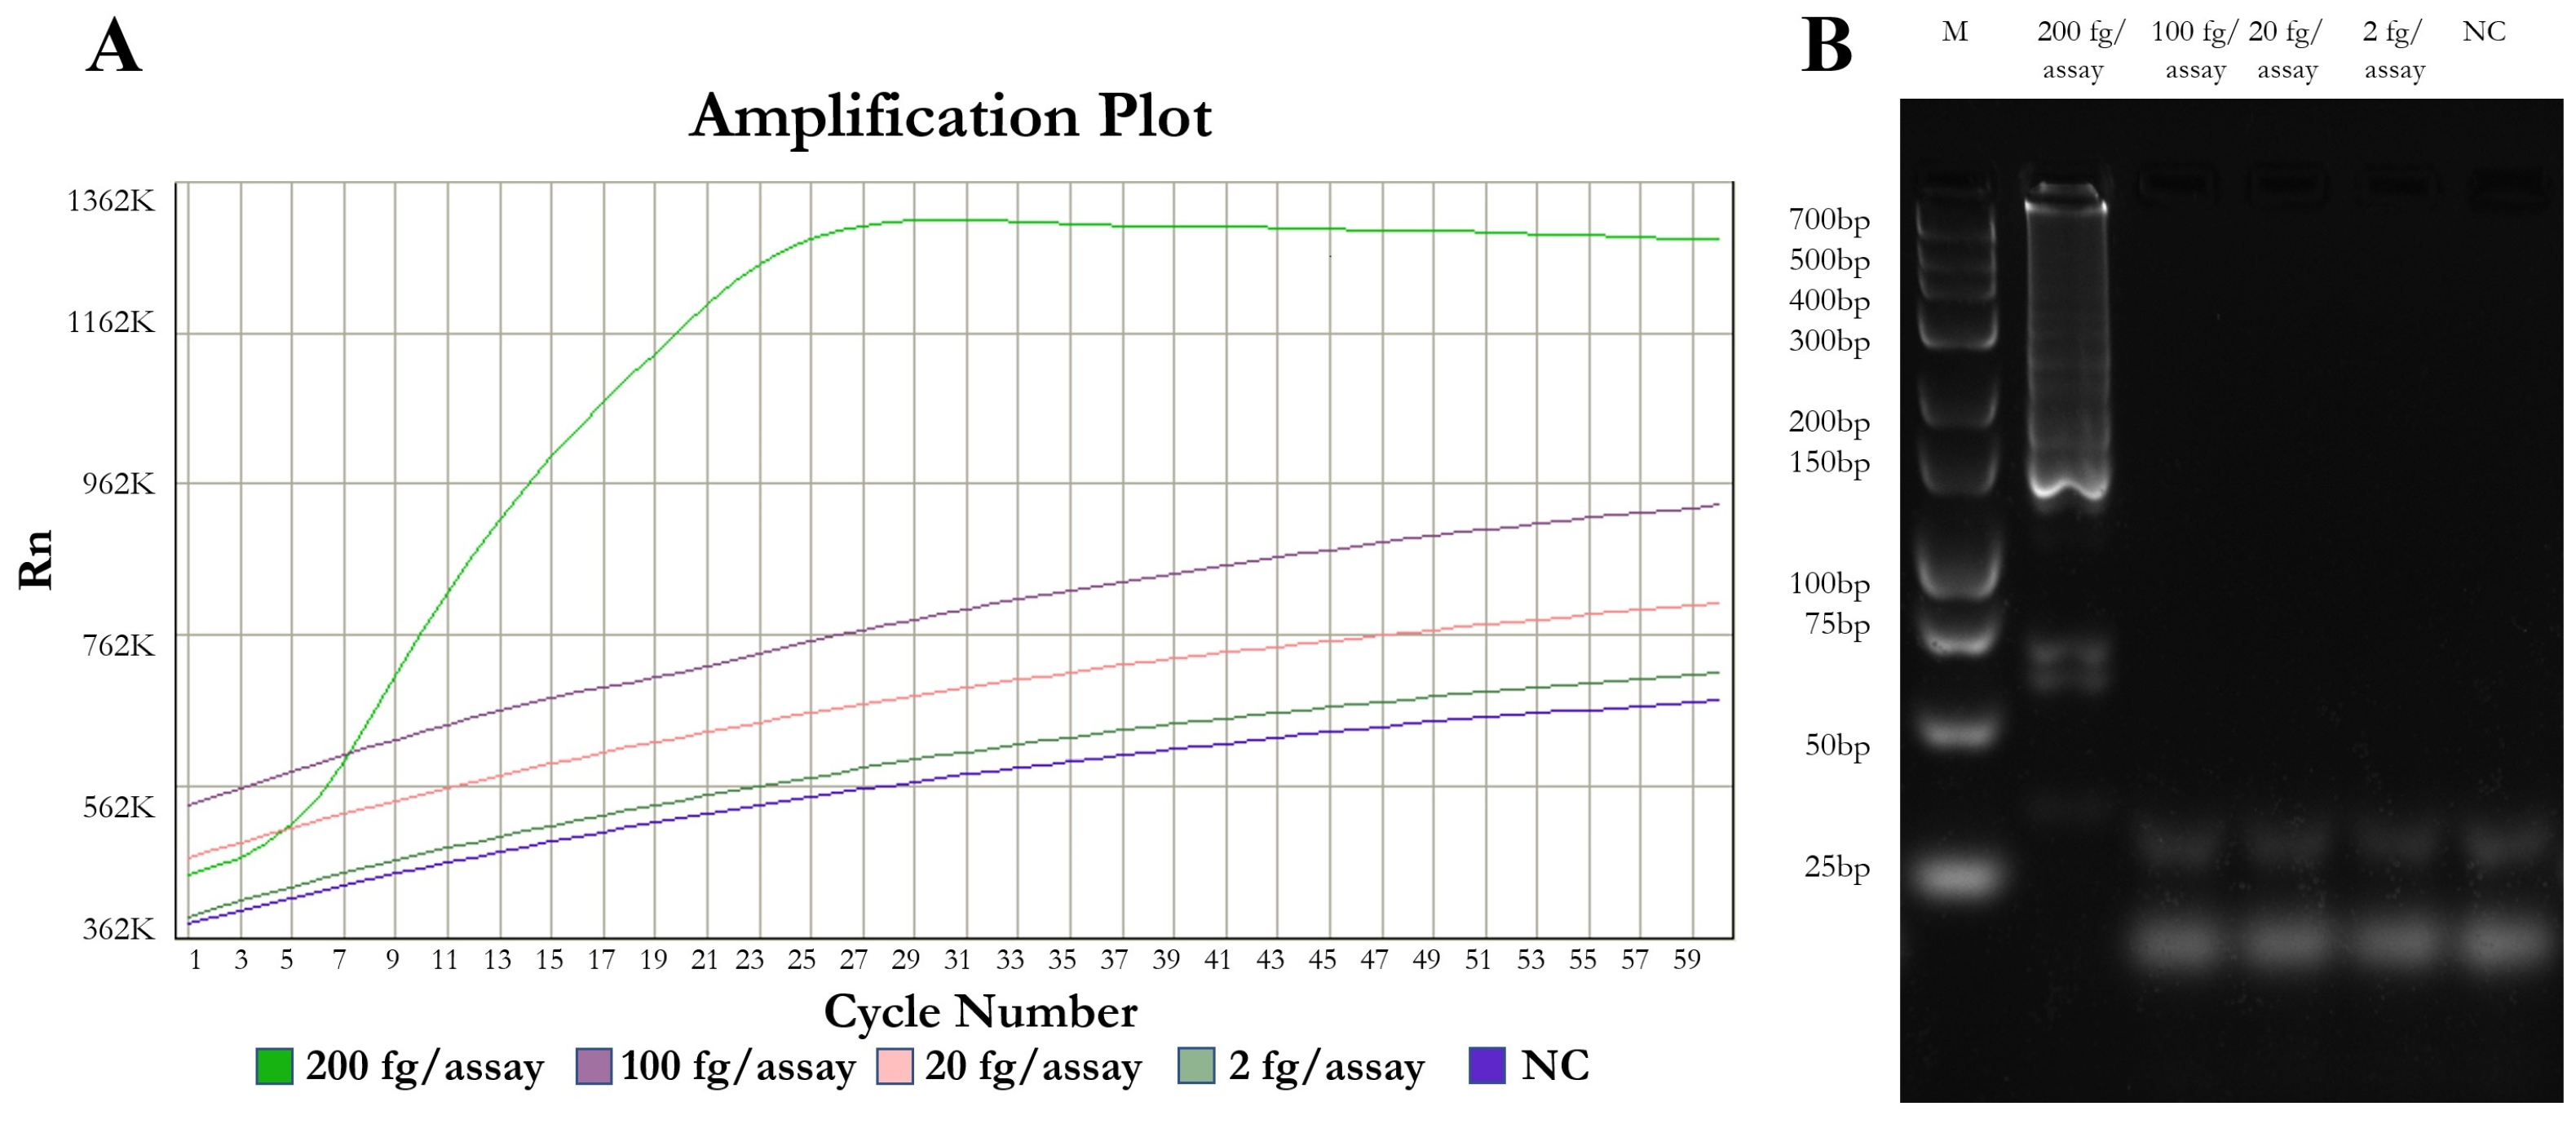
3.1. Optimal Parameters, Analytical Sensitivity

Using Bst 3.0 DNA Polymerase, we observed nonspecific product formation independent of the temperature range, denaturation, and betaine use. This observation was unexpected, as Bst 3.0 features further improvements in amplification speed, inhibitor tolerance, thermostability, and dUTP incorporation. Bst 3.0 also displays significantly higher reverse transcriptase activity up to 72 °C and can be used for single-enzyme RT-LAMP reactions.
For the primer sets from the work of Momoda et al., we found that the use of betaine, the temperature range of TLS1 (including the denaturation step before the reaction), and Bst 2.0 WarmStart® DNA Polymerase were optimal without nonspecific product formation. Under these reaction conditions, this LAMP assay could detect 20 fg or 19.5 fg DNA sample/tube within 46 or 35 min for G. duodenalis assemblages A and B, respectively (Table 4, Figure 1 and Figure S1).
The sensitivity analysis showed that the detection limit of the optimized LAMP assay could be increased approximately 8 times and that the reaction time was reduced to 0.76 and 0.58 times compared to the previously reported 0.8 cyst/assay (equivalent to 156 fg/assay) for assemblage A and B, respectively. The optimal analytical sensitivity and threshold values are shown in Table 4. Under the conditions used by the authors in this paper and as described in the Materials and Methods section, amplification of G. duodenalis assemblages A and B DNA failed when using the primer set of Li et al. The authors of this paper did not perform specificity tests on different Giardia assemblages; however, Li et al. tested the designed primers only on dog Giardia isolates; consequently, this result was expected. The ideal reaction conditions of the primer set of Plutzer et al. were at the temperature range TLS2, where the minimum detectable DNA concentration was 200 fg or 195 fg in 43 and 41 min for assemblage A or B, respectively (Table 4, Figure 2 and Figure S2), compared to the previously published 129 min.
We found that a denaturation step was also needed, and in the presence of betaine, the nonspecific reaction in the negative control could be avoided. The analytical sensitivity of our optimized touchdown LAMP protocol for G. duodenalis assemblage A was at least 4 times higher than the previously published 800 fg/assay [3]. Similarly, in the case of G. duodenalis assemblage B, the improved protocol was 2.8 times more sensitive than the previously published 548 fg/assay [3]. The sensitivity differences between the primer sets targeting the SSU rRNA and EF1A genes could be the result of the gene copy number, since SSU rDNA is present in multiple copies, while the EF1A gene is present in a single copy in the Giardia genome [25].

3.2. Repeatability

To determine the repeatability of the LAMP method for G. duodenalis assemblages A and B, LAMP reactions for optimal conditions were performed with at least three repetitions. Reactions were performed with the primer sets of Momoda et al. and Plutzer et al. under the optimal reaction conditions defined for the two primer sets. For assemblage A using the primer set of Momoda et al., the coefficient of variation of the threshold time was 25.37, 18.87, and 25.98 for samples containing 195 fg, 97.5 fg, and 19.5 fg genomic DNA, respectively. For assemblage B, the coefficient of variation of the threshold time was 13.23, 16.46, and 14.54, where the initial concentration of genomic DNA was 200 fg/assay, 100 fg/assay and 20 fg/assay, respectively. Because Plutzer’s primer set had a lower analytical sensitivity, the variation coefficients of threshold time for only the 200 fg/assay and 195 fg/assay samples were determined, namely, 51.32 and 33.26 for assemblages A and B, respectively. Table 5 summarizes the results of the calculated coefficients of variability.

4. Discussion

For all the parameter sets, it can be stated that the use of Bst 2.0 WarmStart® DNA Polymerase favors correct DNA amplification; the presence of betaine might enhance amplification of GC rich sequences; and the denaturation step is also recommended for all reactions. Since the specificity of the three primer sets was discussed in the original articles (Momoda et al., Li et al. and Plutzer et al.), no separate specificity test was conducted in this study; however, testing specificity for different assemblages may still be necessary when testing non-human specific samples. From our practical experience, it can be stated that handling and working with the primer sets described in the work of Momoda et al. requires serious attention due to its high sensitivity. Therefore, for routine laboratory measurements, we suggest using well-separated rooms for the preparation of the LAMP reaction mixture, the addition of the nucleic acids to the mixture, and the LAMP reaction itself.
Additionally, we recommend a change of lab coats and gloves between rooms. Additional measures include the use of a uracil-DNA glycosylase (UDG) system to degrade carryover amplicons, strict unidirectional workflow in separate rooms, the implementation of regular chemical and UV decontamination steps, and the use of disposable filter tips and sealed reaction plates or tubes. The use of automated, closed-system platforms can further reduce contamination risks and is highly recommended for high-throughput applications. Based on the above results, the primers from Momoda et al. are ideal for microfluidic environments that are closed systems. These devices are the optimal solutions to miniaturize and automate standard DNA amplification methods. In addition to its high sensitivity and specificity, the advantages of the LAMP method include a significant reduction in the quantity of expensive reagents, shorter reaction times, and fewer manual steps. Furthermore, microfluidic systems are closed systems with minimal risk of contamination [26,27]. These make it possible to develop cheaper tests while increasing the throughput of testing laboratories. For G. duodenalis cysts, a high-throughput concentration and separation microfluidic system with 86% maximum recovery rate from drinking or distilled water has been presented [28]. Therefore, after DNA extraction, if the LAMP reaction can be performed in microfluidic environment, it will be a cheap solution for the rapid detection of giardiasis [29,30,31]. In case of a large number of samples (epidemic, mass infection, etc.), it is possible to fully automate the method for high-throughput testing on automated liquid handling workstations of different manufacturers, whereas for its implementation only a pipetting head unit, an internal plate manipulator, and an integrable RT-PCR device or a temperature controller with a reading unit are required. The disadvantage of the method is that, compared to the LAMP protocols, the denaturation and touchdown LAMP steps require a more complex temperature control system or a separate PCR device. The primer set of Plutzer et al. is not as sensitive; nevertheless, it may be ideal for routine laboratory measurements, where the strict separation of working steps is not possible but simple, rapid, and sensitive DNA-based molecular detection is needed. Our optimized LAMP protocol can be directly applied to improve Giardia LAMP tests in routine testing laboratories, although validation with clinical and environmental samples may still be necessary. The repeatability data showed relatively high coefficients of variation in threshold times: Factors such as pipetting errors, minor inconsistencies in thermal ramping, and manual denaturation steps may contribute to the variability. The use of automated liquid handling, pre-aliquoted reagents, and closed-system microfluidics are recommended to enhance reproducibility.

5. Conclusions

The aim of this study was to select the temperature range and adjust the concentration of reaction components in the reaction mixture to obtain the lowest detection limit and shortest reaction time of G. duodenalis LAMP detection for standard laboratory protocols. In this study, we improved the analytical sensitivity of the primer sets of Plutzer et al. and Momoda et al. The highest sensitivity was achieved by the primer set of Momoda et al.; namely, a 7.8- and 8-fold higher analytical sensitivity of the LAMP reaction was achieved compared to the previously published methods for G. duodenalis assemblages A and B, and the detection limit was reduced to 20 and 19.5 fg/assay, respectively. For G. duodenalis assemblages A and B, the detection time was also reduced to 46 and 35 min, respectively.

Supplementary Materials

The following supporting information can be downloaded at: https://www.mdpi.com/article/10.3390/parasitologia5020025/s1, Figure S1: Sensitivity of touchdown LAMP assay of G. duodenalis assemblage B for Momoda et al. primer set; Figure S2: Sensitivity of touchdown LAMP assay of G. duodenalis assemblage B for Plutzer et al. primer set.; Table S1: The published specificity tests for Giardia LAMP method for different primer sets.; Table S2: The results of preliminary repeatability tests; Table S3: Alignment of reference sequences EF1A gene of Giardia.; Table S4: Alignment of reference sequences of 18S RNA gene of Giardia.

Author Contributions

Conceptualization, M.H. and J.P.; methodology, M.H., K.F., A.J.L., K.I. and J.P.; validation, M.H., K.F. and J.P.; writing—original draft preparation, M.H.; writing—review and editing, J.P., A.J.L. and K.I. All authors have read and agreed to the published version of the manuscript.

Funding

The funding for the publication, material, and cost of running these experiments by the internal KAP2019 and KAP2020 funding schemes of Pázmány Péter Catholic University is greatly appreciated, as is the funding NBP ED_17-1-2017-0009 from the Hungarian NRDI Office.

Institutional Review Board Statement

Not applicable.

Informed Consent Statement

Not applicable.

Data Availability Statement

No new data were created or analyzed in this study. Data sharing is not applicable to this article.

Acknowledgments

We would like to thank Csaba I. Pongor, Ádám Gy. Szélig, Márk Bense, Dániel Kolpaszky, and Máté Kálovics for their review and suggestions for the manuscript. The authors would also like to thank all the staff of the Biomicrofluidics Laboratory, Faculty of Information Technology and Bionics at Pázmány Péter Catholic University.

Conflicts of Interest

The authors declare no conflicts of interest.

Abbreviations

The following abbreviations are used in this manuscript:
LAMPLoop-mediated isothermal amplification

References

  1. Fever, B. Giardia Enteritis, Lambliasis. 2012. Available online: https://scholar.google.hu/scholar?hl=hu&as_sdt=0%2C5&q=fever+giardia+enteritis%2C+lambliasis+2012&btnG=https://abrakadabraenvironmental.com/wp-content/uploads/2021/05/Giardiasis.pdf (accessed on 23 March 2025).
  2. Heyworth, M.F. Giardia duodenalis genetic assemblages and hosts. Parasite 2016, 23, 13. [Google Scholar] [CrossRef]
  3. Plutzer, J.; Karanis, P. Rapid identification of Giardia duodenalis by loop-mediated isothermal amplification (lamp) from faecal and environmental samples and comparative findings by PCR and real-time PCR methods. Parasitol. Res. 2009, 104, 1527–1533. [Google Scholar] [CrossRef]
  4. Efstratiou, A.; Ongerth, J.; Karanis, P. Evolution of monitoring for Giardia and Cryptosporidium in water. Water Res. 2017, 123, 96–112. [Google Scholar] [CrossRef] [PubMed]
  5. Devleesschauwer, B.; Bouwknegt, M.; Dorny, P.; Gabriël, S.; Havelaar, A.H.; Quoilin, S.; Robertson, L.J.; Speybroeck, N.; Torgerson, P.R.; van der Giessen, J.W.; et al. Risk ranking of foodborne parasites: State of the art. Food Waterborne Parasitol. 2017, 8, 1–13. [Google Scholar] [CrossRef] [PubMed]
  6. Bouwknegt, M.; Devleesschauwer, B.; Graham, H.; Robertson, L.J.; van der Giessen, J.W.; The Euro-Fbp Workshop Participants. Prioritisation of food-borne parasites in Europe, 2016. Eurosurveillance 2018, 23, 17-00161. [Google Scholar] [CrossRef] [PubMed]
  7. Plutzer, J.; Lassen, B.; Jokelainen, P.; Djurković-Djaković, O.; Kucsera, I.; Dorbek-Kolin, E.; Šoba, B.; Sréter, T.; Imre, K.; Omeragić, J.; et al. Review of Cryptosporidium and Giardia in the eastern part of Europe, 2016. Eurosurveillance 2018, 23, 16-00825. [Google Scholar] [CrossRef]
  8. Olson, M.; Ceri, H.; Morck, D. Giardia vaccination. Parasitol. Today 2000, 16, 213–217. [Google Scholar] [CrossRef]
  9. Wolfe, M.S. Giardiasis. Clin. Microbiol. Rev. 1992, 5, 93–100. [Google Scholar] [CrossRef]
  10. Vicente, B.; De Freitas, A.; Freitas, M.; Midlej, V. Systematic review of diagnostic approaches for human giardiasis: Unveiling optimal strategies. Diagnostics 2024, 14, 364. [Google Scholar] [CrossRef]
  11. ISO 18744:2016; Microbiology of the Food Chain—Detection and Enumeration of Cryptosporidium and Giardia in Fresh Leafy Green Vegetables and Berry Fruits. International Organization for Standardization: Geneva, Switzerland, 2016.
  12. ISO 15553; Water Quality—Isolation and Identification of Cryptosporidium Oocysts and Giardia Cysts from Water. International Organization for Standardization: Geneva, Switzerland, 2006.
  13. Koehler, A.V.; Jex, A.R.; Haydon, S.R.; Stevens, M.A.; Gasser, R.B. Giardia/giardiasis-a perspective on diagnostic and analytical tools. Biotechnol. Adv. 2014, 32, 280–289. [Google Scholar] [CrossRef]
  14. Soares, R.; Tasca, T. Giardiasis: An update review on sensitivity and specificity of methods for laboratorial diagnosis. J. Microbiol. Methods 2016, 129, 98–102. [Google Scholar] [CrossRef] [PubMed]
  15. Notomi, T.; Okayama, H.; Masubuchi, H.; Yonekawa, T.; Watanabe, K.; Amino, N.; Hase, T. Loop-mediated isothermal amplification of DNA. Nucleic Acids Res. 2000, 28, e63. [Google Scholar] [CrossRef]
  16. Momoda, T.; Kojima, T.; Ikedo, M.; Izumiyama, S.; Endo, T. Sensitive and rapid detection of Cryptosporidium and Giardia by loop-mediated isothermal amplification. J. Jpn. Soc. Water Environ. 2009, 32, 321–324. [Google Scholar] [CrossRef]
  17. Li, J.; Wang, P.; Zhang, A.; Zhang, P.; Alsarakibi, M.; Li, G. Sensitive and rapid detection of Giardia lamblia infection in pet dogs using loop-mediated isothermal amplification. Korean J. Parasitol. 2013, 51, 237. [Google Scholar] [CrossRef] [PubMed]
  18. Meyer, A.; Todt, C.; Mikkelsen, N.T.; Lieb, B. Fast evolving 18S rRNA sequences from Solenogastres (Mollusca) resist standard PCR amplification and give new insights into mollusk substitution rate heterogeneity. BMC Evol. Biol. 2010, 10, 70. [Google Scholar] [CrossRef]
  19. Brynildsrud, O.; Tysnes, K.R.; Robertson, L.J.; Debenham, J.J. Giardia duodenalis in primates: Classification and host specificity based on phylogenetic analysis of sequence data. Zoonoses Public Health 2018, 65, 637–647. [Google Scholar] [CrossRef]
  20. Lund, A.; Knudsen, S.; Vissing, H.; Clark, B.; Tommerup, N. Assignment of Human Elongation Factor 1α Genes: EEF1AMaps to Chromosome 6q14 andEEF1A2to 20q13. 3. Genomics 1996, 36, 359–361. [Google Scholar] [CrossRef]
  21. Lass, A.; Szostakowska, B.; Korzeniewski, K.; Karanis, P. Detection of Giardia intestinalis in water samples collected from natural water reservoirs and wells in northern and north-eastern Poland using lamp, real-time PCR and nested PCR. J. Water Health 2017, 15, 775–787. [Google Scholar] [CrossRef] [PubMed]
  22. Wang, D.-G.; Brewster, J.; Paul, M.; Tomasula, P. Two methods for increased specificity and sensitivity in loop-mediated isothermal amplification. Molecules 2015, 20, 6048–6059. [Google Scholar] [CrossRef]
  23. Guy, R.A.; Payment, P.; Krull, U.J.; Horgen, P.A. Real-time PCR for quantification of Giardia and Cryptosporidium in environmental water samples and sewage. Appl. Environ. Microbiol. 2003, 69, 5178–5185. [Google Scholar] [CrossRef]
  24. [Dataset] Inc., New England Biolabs. Typical Lamp Protocol (M0275). 2019. Available online: https://international.neb.com/protocols/2014/11/21/typical-lamp-protocol-m0275 (accessed on 14 March 2019).
  25. Thompson, R.C.A.; Ash, A. Molecular epidemiology of Giardia and Cryptosporidium infections. Infect. Genet. Evol. 2016, 40, 315–323. [Google Scholar] [CrossRef] [PubMed]
  26. Zhang, Y.; Ozdemir, P. Microfluidic DNA amplification—A review. Anal. Chim. Acta 2009, 638, 115–125. [Google Scholar] [CrossRef] [PubMed]
  27. Zhang, H.; Xu, Y.; Fohlerova, Z.; Chang, H.; Iliescu, C.; Neuzil, P. LAMP-on-a-chip: Revising microfluidic platforms for loop-mediated DNA amplification. TrAC Trends Anal. Chem. 2019, 113, 44–53. [Google Scholar] [CrossRef] [PubMed]
  28. Jimenez, M.; Bridle, H. Microfluidics for effective concentration and sorting of waterborne protozoan pathogens. J. Microbiol. Methods 2016, 126, 8–11. [Google Scholar] [CrossRef]
  29. Fang, X.; Chen, H.; Xu, L.; Jiang, X.; Wu, W.; Kong, J. A portable and integrated nucleic acid amplification microfluidic chip for identifying bacteria. Lab A Chip 2012, 12, 1495–1499. [Google Scholar] [CrossRef]
  30. Hsieh, K.; Patterson, A.S.; Ferguson, B.S.; Plaxco, K.W.; Soh, H.T. Rapid, sensitive, and quantitative detection of pathogenic DNA at the point of care through microfluidic electrochemical quantitative loop-mediated isothermal amplification. Angew. Chem. Int. Ed. 2012, 51, 4896–4900. [Google Scholar] [CrossRef]
  31. Wang, C.-H.; Lien, K.-Y.; Wang, T.-Y.; Chen, T.-Y.; Lee, G.-B. An integrated microfluidic loop-mediated-isothermal-amplification system for rapid sample pre-treatment and detection of viruses. Biosens. Bioelectron. 2011, 26, 2045–2052. [Google Scholar] [CrossRef]
Figure 1. Sensitivity of touchdown LAMP assay of G. duodenalis assemblage A for the Momoda et al. primer set. (A) The amplification plot. The plot type was Rn (the fluorescence of the reporter dye divided by the fluorescence of a passive reference dye) vs. Cycle, and the graph type was logarithmic; 1× SYBR Green I (SYBRTM Green I Nucleic Acid Gel Stain, 10,000× concentrate in DMSO, ThermoFisher Scientific, USA) was used. (B) Agarose gel electrophoresis. Lane M represents the ladder (Thermo Scientific, GeneRuler Low Range DNA Ladder), 200 fg/assay–2 fg/assay represents serial G. duodenalis assemblage A DNA concentrations with betaine and denaturation at TLS1. NC represents the negative control.
Parasitologia 05 00025 g001
Figure 2. Sensitivity of touchdown LAMP assay of G. duodenalis assemblage A for the Plutzer et al. primer set. (A) The amplification plot. The plot type was Rn vs. Cycle, and the graph type was logarithimic; 1× SYBR Green I (SYBRTM Green I Nucleic Acid Gel Stain, 10,000× concentrate in DMSO, ThermoFisher Scientific, USA) was used. (B) Agarose gel electrophoresis. Lane M represents the ladder (Thermo Scientific, GeneRuler Low Range DNA Ladder), 200 fg/assay-2 fg/assay represents serial G. duodenalis assemblage A DNA concentrations with betaine and denaturation at TLS2. NC represents the negative control.
Parasitologia 05 00025 g002
Table 1. Sequences of the LAMP primers for the amplification of G. duodenalis. F3 forward outer primer; B3, backward outer primer; FIP, forward inner primer; BIP, backward inner primer; FLP, forward loop primer, BLP, backward loop primer.
Giardia Target GeneGiardia Species and Assemblage Accession NumberPrimer NamePrimer Sequences (5′-3′)The Size of the Product
Plutzer et al. (2009) [3]EF1α (elongation factor 1 Alfa)G. duodenalis assemblage B, accession number: AF069570F3
B3
FIP

BIP

FLP
BLP
GCCGGGATCTCGAAGGAC
TCGGGATGTAGTCGAACTCC
TGACCTGGCCGTCGTCCATC
TTGCGACGCTCGCGAACA
GTACTCGAAGGAGCGCTACG
ACGCCTTCTTCCAGCCGATG
GACGGCCAGACGCGCGAG
GCGGAGGGGCTTGTCGGTC
18
20
38

40

18
19
sum:153
Momoda et al. (2009) [16]18S rRNA geneG. intestinalis assemblage n.a., accession number: AF473852F3
B3
FIP

BIP

FLP
BLP
GCCGGGGGCTAGAAGG
CGCGTTGAGTCAGATTGAGC
CGGTTTCCCTGGGCGGCAGA
CACCACCGTATTCCCG
CTCTGGGGGGAGTATGGCCC
ACGTCTGGTGGTACCC
GGCGGCACCGTTTACG
AGGCTGAAACTTGAAGGCAT
16
20
36

36

16
20
sum:144
Li et al. (2013) [17]EF1α (elongation factor 1 Alfa)G. duodenalis assemblage D, accession number: n.a.F3
B3
FIP


BIP

FLP
BLP
ATGGACGACGGCCAGG
CCCTCGTACCAGGGCATC
AGCCGATGTTCTTGAGCTGC
TTGTACTCGAAGGAGCGCTA
CG
GAAGAAGGCCGAGGAGTTCG
TTGTCGGACCTCTCCATGA
CTGGACCGGGGACAACA
ATCATCTCGCCCTTGATCTCG
16
18
42


39

17
21
sum:153
n.a. = not available.
Table 2. Composition of the three published primer set protocols, the manufacturer’s typical LAMP protocol, and the reaction mixtures used for the LAMP reaction. Plutzer and Momoda et al. produced the buffer required for optimal enzyme function themselves, while in Li et al., the commercially available Bst DNA polymerase buffer was used, and SYBR Green I dye was added to the reaction mixture. The concentrations of the primers used by Momoda et al. were not published.
Reaction ComponentsPlutzer et al., 2009 [3]Li et al., 2013 [17]Momoda et al., 2009 [16]Typical LAMP ProtocolPresent Study
FIP/BIP1.6 µM1.6 µMn.a.1.6 µM1.6 µM
FLP/BLP0.8 µM0.8 µMn.a.0.4 µM0.4 µM
F3/B30.2 µM0.2 µMn.a.0.2 µM0.2 µM
dNTP2.8 µM2.5 µM2.5 mM1.4 mM1.4 mM
Betaine1.6 M1.6 µM0.8 M-0.8 M or nothing
Tris-HCl (pH 8.8)20 mM-20 mM--
KCl10 mM-10 mM--
(NH4)2SO410 mM-10 mM--
Tween 200.2%-0.1%--
MgSO48 mM8 mM8 mM6 mM (8 mM total)6 mM (8 mM total in the 1× final)
SYBR Green I-400x--1× final
Bst DNA polymerase buffer-2.5 mM-1× (contains 2 mM MgSO4)1× (contains 2 mM MgSO4)
Bst DNA polymerase8 U8 U8 U8 U8 U
DNA template2 µL2 µL2 µL2 µL1 µL
n.a. = not available, (-) the reaction component was not used.
Table 3. A set of parameters was defined to optimize the LAMP method: the table represents the two novel polymerases, the presence or absence of betaine, and the reaction with or without denaturation in four temperature ranges (TLS1-TLS4) for the three currently published primer sets for Giardia duodenalis A and B.
Reaction StepTLS1 (°C)TLS2 (°C)TLS3 (°C)TLS4 (°C)TimeBetainePolymerase
Denaturation *902 min+/−Bst 2.0 Warmstart DNA Polymerase
and
Bst.3.0 DNA Polymerase (New England Biolabs Inc.)
Touchdown Activation 1666870725 min+/−
Touchdown Activation 2646668705 min+/−
Touchdown Activation 3626466685 min+/−
Incubation6062646660 min+/−
Dissociation measurement9515 s+/−
6060 s+/−
9515 s+/−
* The reactions were performed with or without denaturation. For betaine, (+) indicates the presence and (−) indicates the absence.
Table 4. Comparison of the published and optimized detection limits and times for the detection of G. duodenalis assemblages and the optimal reaction conditions of the different primer sets.
UnitPlutzer et al., 2009 [3]Plutzer et al., 2009 [3]Momoda et al.,
2009 [16]
Li et al., 2013 [17]
Assemblage ABunknownC/D
Detection limitfg DNA/tube800548156100
Detection timemin1291296070
After optimization:
Assemblage ABABA/B
Detection limitfg DNA/tube2001952019.5-
Detection timemin19–4323–4125–4625–35-
Optimal reaction conditions * TLS2TLS2TLS1TLS1
* All reactions were carried out with betaine and denaturation steps.
Table 5. Repeatability of the LAMP assays. The standard deviation (SD) is the square root of the variance of threshold times. The coefficient of variation (CV) is defined as the ratio of the SD to the mean.
Amount of DNA/LAMP AssayVariability of Threshold Time Value
G. duodenalis Assemblage A
Primer Setfg/AssayThreshold TimesMeanSDCV (%)
Momoda et al., 2009 [16]20026; 38;
22; 25
27.757.0425.37
10042; 43; n.a.; 3038.337.2318.87
2034; 46;
25; 31
348.8325.98
Plutzer et al., 2009 [3]20019; 43;
19
2713.8651.32
G. duodenalis Assemblage B
Primer setfg/assayThreshold timesMeanSDCV (%)
Momoda et al., 2009 [16]19519; 18; 23202.6513.23
97.518; 25; 2121.333.5116.46
19.529; 25;
35; 33
30.54.4314.54
Plutzer et al., 2009 [3]19523; 25; 4129.669.8733.26
n.a. = not available.
Disclaimer/Publisher’s Note: The statements, opinions and data contained in all publications are solely those of the individual author(s) and contributor(s) and not of MDPI and/or the editor(s). MDPI and/or the editor(s) disclaim responsibility for any injury to people or property resulting from any ideas, methods, instructions or products referred to in the content.

