Article

Novel Electrochemically Responsive Porous Glass Matrix Composites from a Printable Silicone-Based Emulsion


1
Department of Industrial Engineering, University of Padova, 35131 Padova, Italy
2
Department of Chemical Sciences, University of Padova, 35131 Padova, Italy
*
Author to whom correspondence should be addressed.
Solids 2026, 7(3), 32; https://doi.org/10.3390/solids7030032
Submission received: 20 March 2026 / Revised: 3 June 2026 / Accepted: 5 June 2026 / Published: 10 June 2026
(This article belongs to the Special Issue Young Talents in Solid-State Sciences)

Abstract

The present study addresses the fabrication of porous gyroid architectures by additive manufacturing from preceramic polymer feedstocks. Photocurable emulsions were engineered by combining a silicone powder with acrylate monomers and dispersing an emulsified secondary phase of calcium nitrate. The formulations showed light-curing behaviour compatible with digital light processing vat photopolymerization (DLP-VPP), enabling high-fidelity replication of triply periodic minimal surface (TPMS) gyroids (designed porosity: 85 vol.%). After pyrolysis in nitrogen at 700 °C, the lattices converted into CaO–SiO2-derived amorphous matrices embedding an in situ turbostratic/pyrolytic carbon fraction, as suggested by the photothermal response and preliminary impedance behaviour, although the latter was measured in liquid electrolyte and therefore does not isolate electronic transport. To improve robustness during polymer-to-ceramic conversion, pharmaceutical borosilicate waste glass (BASG) was added as a passive filler (30–70 wt.%). The waste-glass phase acts as a passive filler that improves processing robustness and can mitigate shrinkage-induced damage during pyrolysis, while remaining electrically insulating (dielectric) and therefore not directly contributing to electronic conduction. The resulting structures combine high surface-to-volume ratio, controlled open porosity, and structural integrity with electrochemical responsiveness under the adopted test conditions, making them promising architected platforms for electrochemical components where interconnected porosity is advantageous.

1. Introduction

Porous ceramics are increasingly investigated as architected material platforms in which permeability, surface-to-volume ratio, and mechanical integrity can be co-designed by controlling both chemistry and topology, enabling components that integrate transport, mechanical support, and additional functionalities within a single monolithic architecture [1,2,3]. Within this framework, triply periodic minimal surface (TPMS) lattices, including gyroids, are particularly attractive because they provide fully interconnected porosity with a periodic topology that can be reproduced with high fidelity by additive manufacturing, thus allowing systematic correlations among geometry, porosity, and property sets relevant to porous-ceramic applications [1,4,5,6,7,8].
Polymer-derived ceramics (PDCs) provide a unified route to advanced ceramics in which a preceramic polymer is shaped in the polymeric state and then converted into an inorganic residue via crosslinking and pyrolysis [9,10]. The PDC field spans multiple precursor families (e.g., polycarbosilanes, polysilazanes, silicones/polysiloxanes) and enables oxide-derived and non-oxide systems, with final composition and nanostructure governed by precursor chemistry and firing atmosphere [10,11,12,13,14]. This chemistry–process flexibility has historically supported the production of advanced ceramic forms including fibres and coatings and is increasingly translating polymer-shaping technologies to near-net-shape ceramic fabrication [10,13]. However, many established routes still require high-temperature treatments (often >1000 °C), which can hinder delicate porous architectures and increase conversion-induced defect sensitivity [10,15].
The integration of PDCs with digital light processing vat photopolymerization (DLP-VPP) is especially appealing for porous ceramics because it enables the generation of periodic lattices with controlled feature size and porosity in the green state, followed by conversion into an inorganic scaffold [9,16,17,18,19,20]. Stereolithography-based manufacturing of SiOC components has demonstrated that complex shapes can be obtained from photocurable polymer-derived feedstocks, yet it also exemplifies the need for carefully designed thermal cycles and formulations to preserve dimensional accuracy during ceramization [16]. In many PDC systems, polymer-to-ceramic transformation is intrinsically accompanied by mass loss, gas evolution, and shrinkage, which generate internal stresses that may induce cracking, warpage, or loss of topological fidelity, particularly when the characteristic thickness increases and gas release becomes spatially constrained [10,15,21,22].
To mitigate shrinkage-driven damage and to tailor phase evolution, fillers are commonly incorporated into preceramic polymers and are frequently classified as passive or active depending on whether they remain inert or react during pyrolysis [21]. Passive fillers mainly dilute the reactive polymer fraction, thereby reducing the volume undergoing decomposition and decreasing the amount of gas generated per unit volume, which can lower stress accumulation and crack formation [21,22,23,24]. Active fillers participate in chemical reactions with decomposition products and/or the surrounding atmosphere, often forming new phases and potentially providing volumetric compensation of shrinkage while also serving as a compositional design lever that governs final phase assemblage and microstructure [21,25]. Consequently, filler selection in PDC processing is not a secondary formulation step but a primary material-design variable that couples processability, phase development, microstructure, and the resulting functional property set [21].
When DLP-VPP is used, formulation constraints become coupled to optics and dispersion stability [9,17,18,19]. In powder-filled suspensions, refractive-index mismatch between particles and resin enhances light scattering, distorting exposure profiles and lowering curing accuracy [17,18,19]. This inaccuracy is critical for thin-walled porous architectures, where layer-by-layer errors accumulate [17,18,19]. Dispersion is challenged by sedimentation/agglomeration, which introduces local compositional gradients in green parts. In silicone-derived silicate systems, gradients can prevent homogeneous glass formation and instead promote phase separation and crystallization during ceramization [26,27]. These constraints are critical for CaO–SiO2 glass-derived networks, which require quasi-molecular oxide mixing to form a uniform glassy matrix, whereas powder-based routes may retain chemical heterogeneity within the limited thermal budget of low-temperature treatments as they start from discrete particle populations [1,26,27,28,29,30].
A key innovation addressing optical limits and chemical homogeneity is replacing powder-based Ca sources with an emulsified inorganic salt phase dispersed in a printable silicone-containing formulation [26]. In silicone–acrylate blends, calcium nitrate tetrahydrate is dispersed as nanoscale droplets via sonication and surfactant stabilization, yielding transparent/translucent nanoemulsions that reduce scattering relative to conventional powder-loaded suspensions and remain compatible with high-definition DLP-VPP [26]. This emulsion route converts printed parts into crack-free, X-ray-amorphous CaO–SiO2 glass-based composites after firing at only 700 °C in N2, while maintaining homogeneous Ca distribution without detectable CaO clustering and enabling a 70S30C-like matrix [1,26,28,30]. The low-temperature conversion is especially relevant for porous ceramics, preserving architecture by limiting viscous flow and distortion at higher thermal budgets, yet still achieving an amorphous, chemically homogeneous matrix [1,26].
In addition to enabling low-temperature CaO–SiO2-derived matrices, inert-atmosphere (e.g., N2) ceramization of silicone precursors produces a silica-rich amorphous matrix containing an in situ carbonaceous secondary phase with graphite-like/turbostratic character [11,26,31,32,33]. The dispersed free-carbon phase markedly enhances infrared absorption, yielding a photothermal response under IR irradiation that is intrinsic to the porous body rather than added as a coating or post-treatment [26,31,34,35,36]. It also provides an inherent basis for electrical functionality because charge-carrier transport in polymer-derived SiOC systems is controlled by the amount, ordering, and connectivity of the sp2-rich carbon phase [11,12,32,33,37,38,39,40,41,42]. When carbon percolation is coupled with interconnected porosity, these pathways can be probed by impedance spectroscopy, and architected lattices can be viewed as glass–carbon nanocomposites where topology and geometry complement emergent thermal and electrical responses [1,11,12,26,37,38]. However, in the present study, the measurements were performed in liquid electrolyte and therefore reflect the response of the porous scaffold/electrolyte system rather than intrinsic electronic conduction alone.
While nanoemulsion-enabled Ca distribution addresses the dominant constraints of printing resolution and chemical homogeneity, ensuring robust processing windows and mechanical reliability in porous ceramics still requires managing conversion-induced stresses and defects [21,26]. Here, an additional innovation pathway consists of integrating a passive boroaluminosilicate glass additive (BASG) derived from pharmaceutical waste streams, aimed at stabilizing processing and improving structural integrity while preserving the carbon-enabled response of the matrix, without implying any direct conductive contribution from the BASG phase [21,23,24,43,44]. Within the broader PDC framework, passive fillers are explicitly leveraged to mitigate shrinkage-induced damage by reducing the effective transforming fraction of the matrix and distributing stresses more uniformly, which is particularly relevant for maintaining defect-free thin-walled lattices during pyrolysis [21,22,23,24].
From a functional standpoint, borosilicate-based glasses are also attractive as electrically insulating inclusions; for example, borosilicate glass has been reported to exhibit very high electrical resistivity at room temperature under humidity-free conditions, consistent with a dielectric role that does not directly contribute to electronic conduction [43,45]. In parallel, pharmaceutical borosilicate glasses have been studied in terms of aqueous chemical durability and corrosion behaviour, which is relevant when contact with liquid electrolytes may occur in electrochemical systems [43,45]. The valorization of waste glass as a passive additive further aligns porous-ceramic manufacturing with circular-economy objectives by converting chemically stable cullet streams into functional constituents of advanced architected materials [44].
Building on these premises, the present study targets electrically and photothermally functional porous ceramics fabricated by DLP-VPP of silicone-based nanoemulsions and converted at low temperature into amorphous CaO-SiO2-derived matrices containing an in situ carbon phase [1,11,26,31,32,37]. The approach is further extended by incorporating a passive boroaluminosilicate waste-glass phase (BASG) to improve process robustness and mitigate conversion-induced defects, while preserving the benefits of emulsion-enabled chemical homogeneity and the carbon-enabled functional response [21,43,44,45,46]. This combination defines a materials-by-architecture platform for candidate porous ceramics in electrochemical applications, in which topology control, low-temperature glass conversion, in situ carbon functionalization, and waste-glass valorization are integrated within a single processing route, with the BASG phase acting as a passive structural modifier [1,2,12,21,26,44].

2. Materials and Methods

2.1. Preparation and 3D Printing of Silicone-Based Emulsions

A key novelty of the present approach is the use of a silicone-based suspension/emulsion, where a calcium salt precursor is dispersed as a secondary phase within a photocurable silicone–acrylate formulation [1,26]. An oily phase was prepared by mixing 6.11 g of silicone powder (Silres H44, Wacker Chemie AG, Munich, Germany) with 5.00 g of a commercial acrylate-based photocurable resin (Industrial Blend Transparent, FunToDo, Alkmaar, The Netherlands). The mixture was homogenized using a planetary mixer (Thinky ARE-250, Intertronics, Kidlington, UK) operated at 2000 rpm for 10 min.
In parallel, a second phase (secondary phase) was produced by emulsifying 15.0 g of the same photocurable resin with 1.0 g of Span 80 (sorbitan monooleate, TCI, Tokyo, Japan) and 5.61 g of calcium nitrate tetrahydrate (Ca(NO3)2·4H2O, Sigma-Aldrich, St. Louis, MO, USA). The mixture was sonicated using an ultrasonic tip (Bandelin Sonopuls HD 2070, Berlin, Germany) for 10 min under continuous magnetic stirring [1].
The oily and the secondary phases were then combined and homogenized using a high-speed planetary mixer (SmartDac 250.4 VAC-PLR, Hauschild SpeedMixer, Hamm, Germany) for 2 min at 2000 rpm. Afterwards, 1.0 g of hydrophobic fumed silica (FS: Aerosil R106, Evonik, Essen, Germany) was added together with pharmaceutical-grade boroaluminosilicate glass (BASG, Stevanato Group, Piombino Dese, Padova, Italy) at different loadings. BASG was investigated at 30, 50, and 70 wt.% with respect to the combined mass of H44, Ca(NO3)2·4H2O, and fumed silica (H44 + Ca(NO3)2·4H2O + FS = 100%) [1]. The formulation was further mixed for 10 min to ensure uniform distribution of the solid fillers.
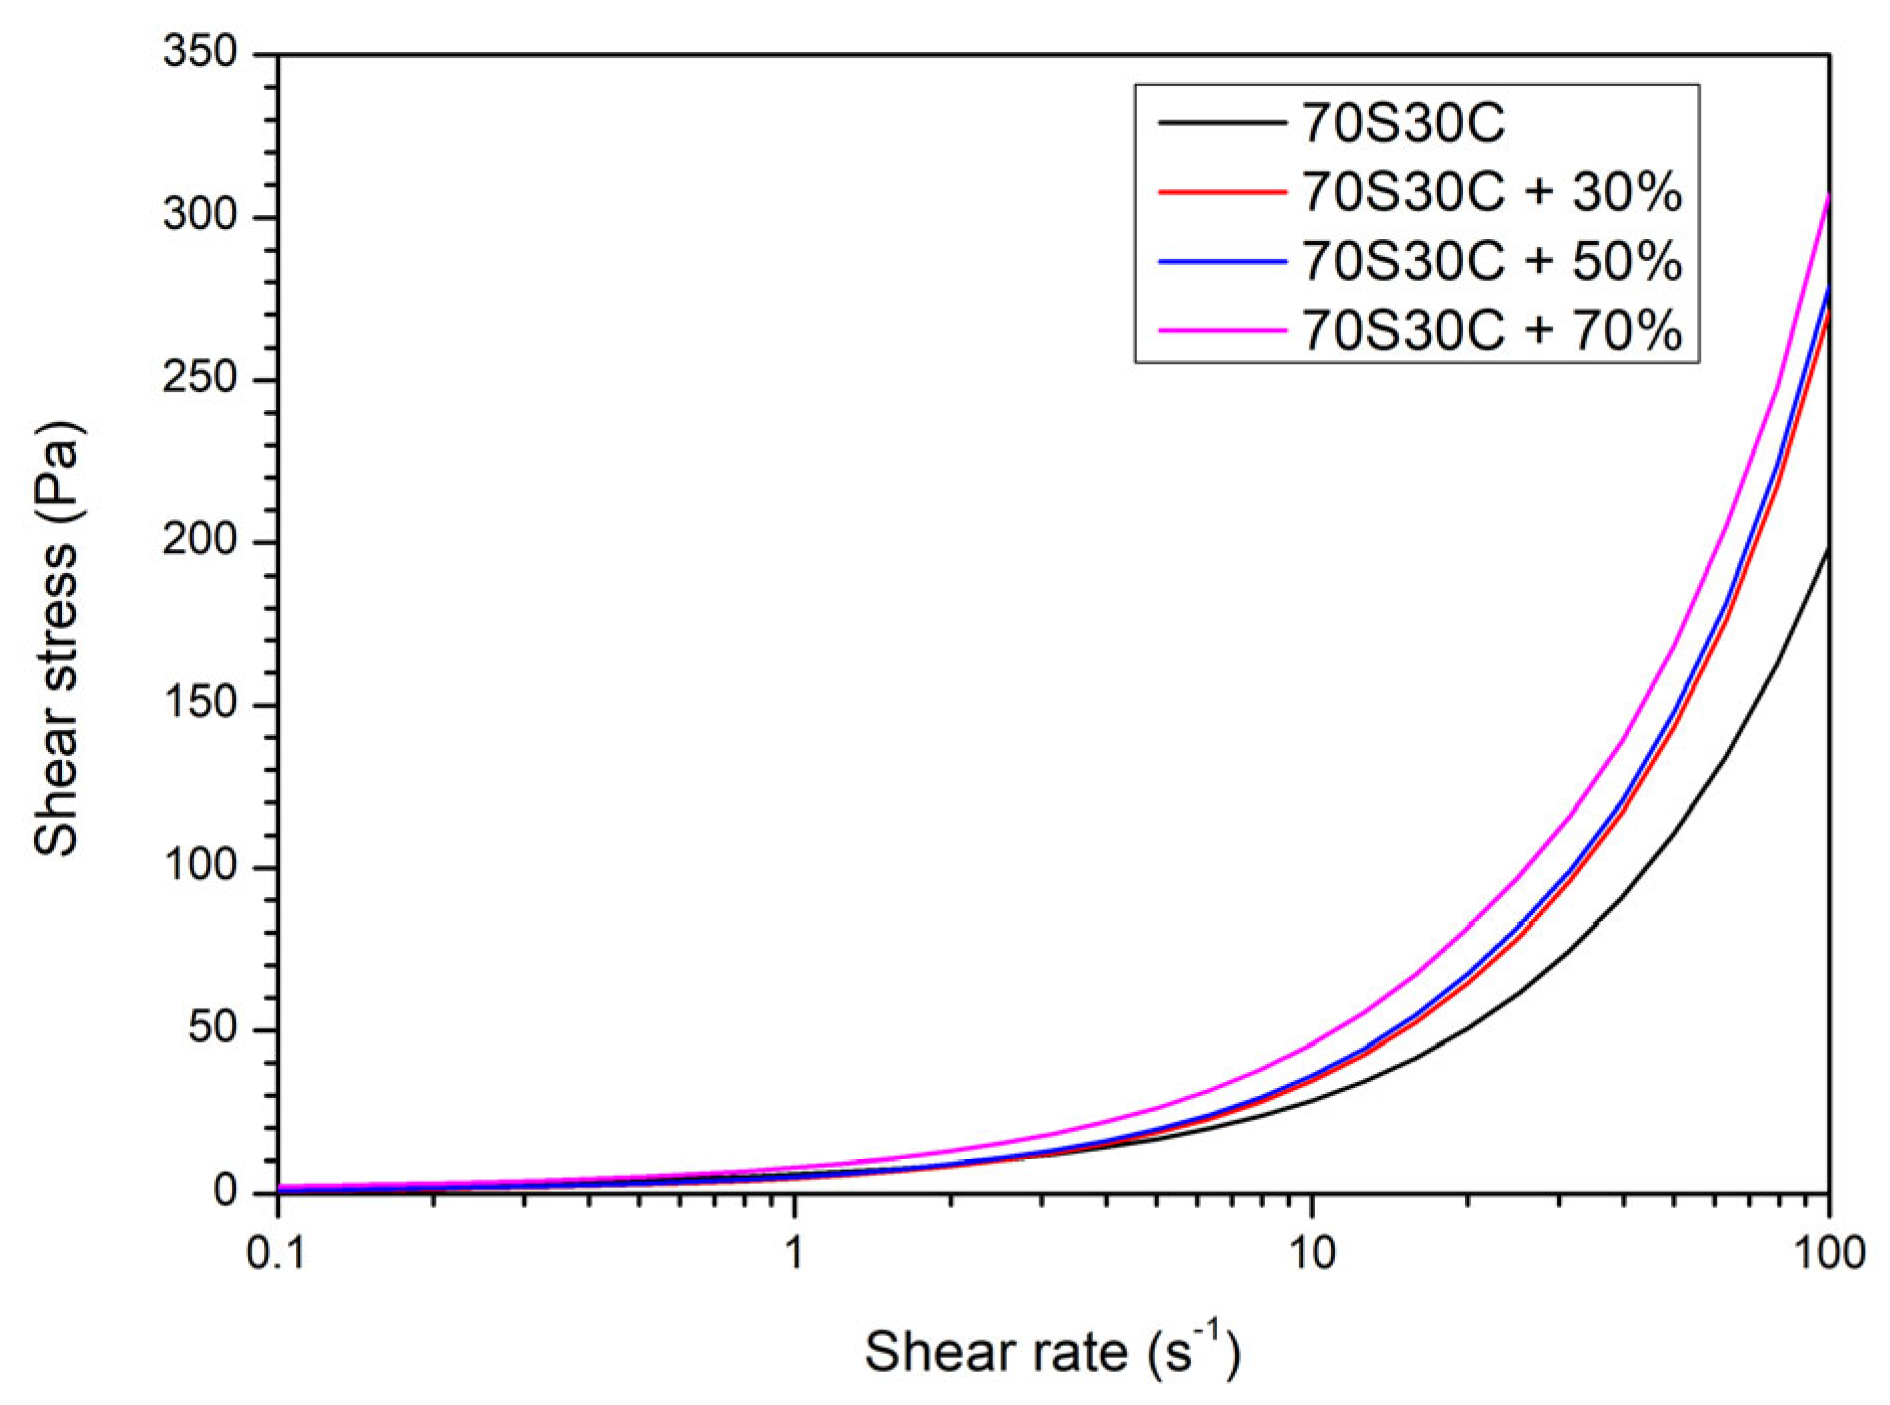
Rheological characterization of the printable emulsions was carried out using a rotational rheometer (Kinexus Lab+, Netzsch, Selb, Germany) equipped with plate–plate geometry at 25 °C. Flow curves were recorded in the shear-rate range 0.1–100 s−1 in order to evaluate the effect of BASG loading on the processability of the formulations.
Disk-shaped substrates (30 mm diameter; thickness 0.7 mm) and gyroid scaffolds (15 × 15 × 15 mm; designed porosity 85%) were fabricated using a masked vat photopolymerization 3D printer (Prusa SL1S, Prusa Research, Prague, Czech Republic) operating at 405 nm [3,32,33,34]. The printing process was conducted with a layer thickness of 50 μm and an exposure time of 4.5 s per layer. After printing, the green parts were removed from the build platform and cleaned by blowing compressed air, followed by immersion in isopropyl alcohol (IPA) for 10 s to remove residual unpolymerized resin. Samples were then post-cured under UV light (Prusa CW1, Prusa Research) at 405 nm for 10 min per side to complete polymerization.
Ceramization was carried out in flowing nitrogen using a two-step heat treatment, with heating at 0.5 °C/min up to 500 °C (2 h dwell), followed by heating at 1 °C/min up to 700 °C (2 h dwell) [1,23].

2.2. Characterization of Printed Components and Final Substrates

The morphological features of printed components, both before and after thermal treatment, were evaluated using optical stereomicroscopy (AxioCam microscopy camera, Carl Zeiss, Oberkochen, Germany) to assess surface quality and macroscopic homogeneity. Detailed microstructural observations of heat-treated samples were performed using environmental scanning electron microscopy (ESEM: FEI Quanta 200, Eindhoven, The Netherlands), equipped with an energy-dispersive X-ray spectroscopy (EDX) detector, to investigate microstructure and elemental distribution. Phase identification was conducted by X-ray diffraction (XRD) using a Bruker AXS D8 Advance diffractometer (Bruker, Karlsruhe, Germany) on powdered samples collected before and after heat treatment. Data were acquired in the 2θ range 10–60°, with a step size of 0.05° and a counting time of 1 s per step, using Cu Kα radiation and a Ni filter. Phase analysis and peak identification were performed using the Match! software package (v1.11h, Crystal Impact GbR, Bonn, Germany).
The bulk (geometrical) density of heat-treated scaffolds was determined from sample mass and volume (analytical balance and digital calliper). Skeletal density was measured by He-gas pycnometry (Anton Paar Srl, Rivoli, Italy) on whole scaffolds, whereas true density was measured by He-gas pycnometry on pulverized samples. Open, closed, and total porosities were calculated from the density values. The compressive strength of scaffolds heat treated at 700 °C was assessed using a universal testing machine (Galdabini Quasar 25, Italy) at a crosshead speed of 0.5 mm/min. Uniaxial compression tests were performed on 15 × 15 × 15 mm specimens, with loading applied perpendicular to the building plane (z direction).
The photothermal response of the fired scaffolds was assessed under infrared (IR) irradiation using a commercial incandescent IR lamp (Philips R95 100 W; emission peak at approximately 1200 nm) [34,35,36]. Samples were placed at a fixed distance of 200 mm from the lamp and irradiated for 60 s. Surface temperature was monitored by IR thermography using a FLIR ONE thermal camera attachment for iPhone (FLIR Systems), and thermal images were acquired with the FLIR ONE app. The maximum surface temperature was extracted from the thermograms to quantify the photothermal response.
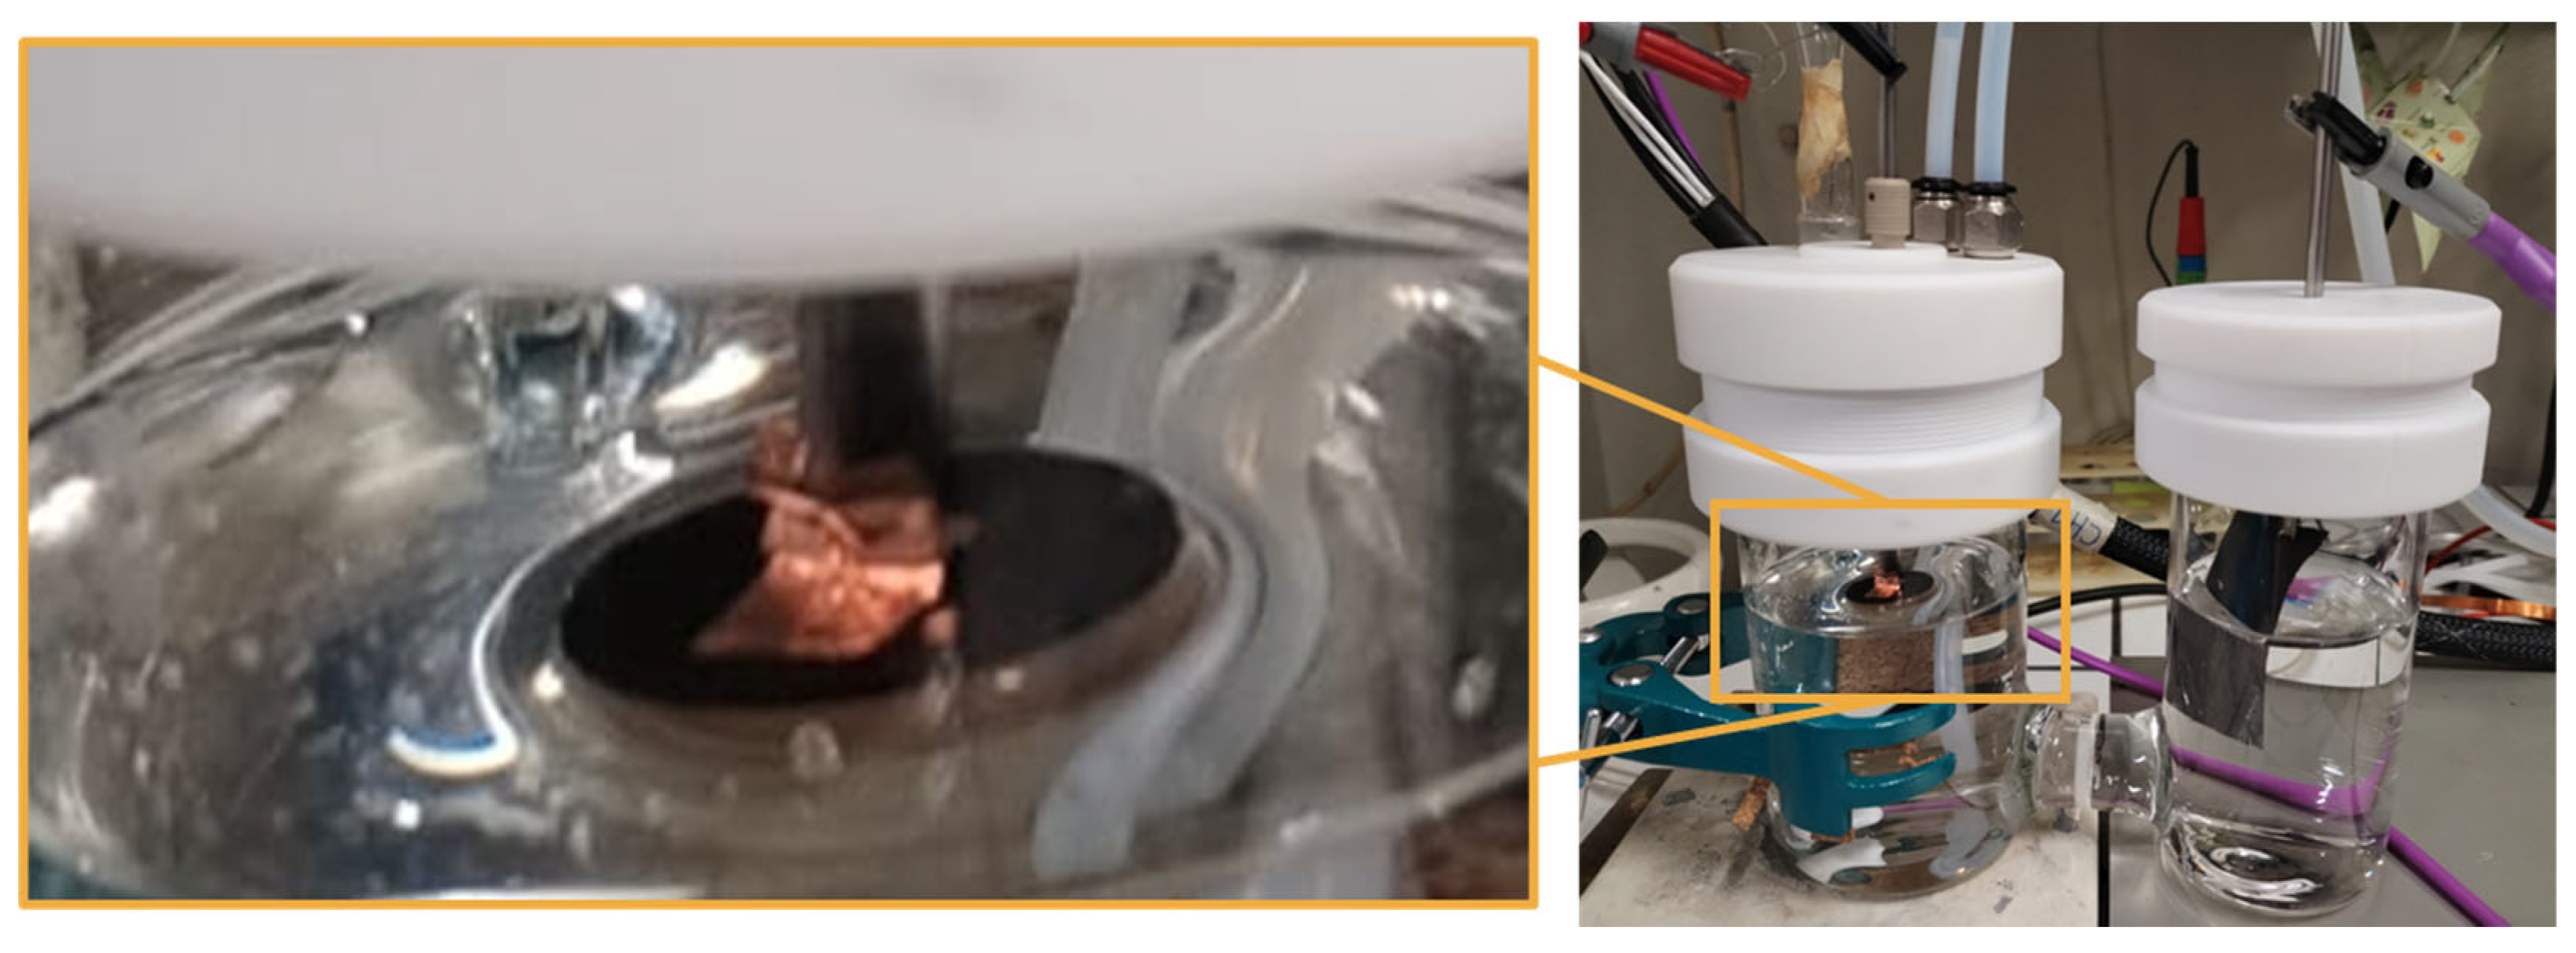
Electrochemical characterization was performed on 0.7 mm disks (70S30C and BASG-containing samples: 0%, 30%, 50%, 70%). Samples were mounted to expose only one face to 0.1 M HClO4 electrolyte, while the opposite face remained unexposed and was contacted using copper tape connected to a crocodile clip (Figure 1 left). Electrochemical impedance spectroscopy (EIS) measurements were performed in an H-type electrochemical cell using a hydrogen reference electrode, and carbon paper (Freudenberg H23C) served as the counter electrode in the opposite compartment to the working electrode (Figure 1 right). The working-electrode compartment was continuously purged by N2 bubbling into the solution. The open circuit potential (OCP) was recorded for 10 s; then, potentiostatic EIS was performed at the OCP using a 50 mV sinusoidal perturbation from 1 MHz to 1 Hz, following the literature recommendations for similar materials [47].
Nyquist plots were analysed using the Distribution of Relaxation Times (DRT) method. DRT analysis enables the transformation of frequency-domain EIS data into time-domain characteristics through the deconvolution of impedance spectra. The relaxation time represents the time required for the electrochemical system to transition between equilibrium states under an external perturbation and corresponds to the characteristic time constant of the process. For a comprehensive theoretical and mathematical description of the method, the reader is referred to the work of Ciucci and Chen [48].
In practical terms, the polarization resistance (Rp) of the system can be approximated as the area under each DRT peak:
R p = τ l τ u γ ( ln τ ) d ( ln τ ) = i = 1 N R p , i = i = 1 N τ 1 , i τ 2 , i γ ( ln τ ) d ( ln τ )
where τ u and τ l represent the lower and upper relaxation time limits, respectively. R p , i is the polarization resistance of one DRT peak; τ 1 , i ,   τ 2 , i are the lower and upper bounds of the relaxation time associated with a DRT peak [48,49,50].
The primary objective of DRT analysis is to estimate the distribution function g τ . Numerical solutions can be obtained using various regularization methods, including Tikhonov regularization (TR), maximum entropy methods, and Fourier transform approaches. In this work, the software package DRTtools (open-source software developed by the Ciucci group, University of Bayreuth, Bayreuth, Germany, http://drttools.com, accessed 25 February 2026), based on Tikhonov regularization [51,52], was employed. This approach enabled reliable estimation of the resistive and capacitive contributions derived from the Nyquist plots.

3. Results and Discussion

3.1. Rheological Behaviour and Printability

Figure 2 shows that BASG addition systematically shifts the flow curves towards higher shear-stress values. Although all formulations retain a comparable overall trend as a function of shear rate, the stress response increases with BASG content, with the 70% BASG sample showing the highest values and the neat 70S30C formulation the lowest. This result suggests that increasing BASG loading affects the resistance to flow of the printable emulsions.

3.2. Morphological Evolution

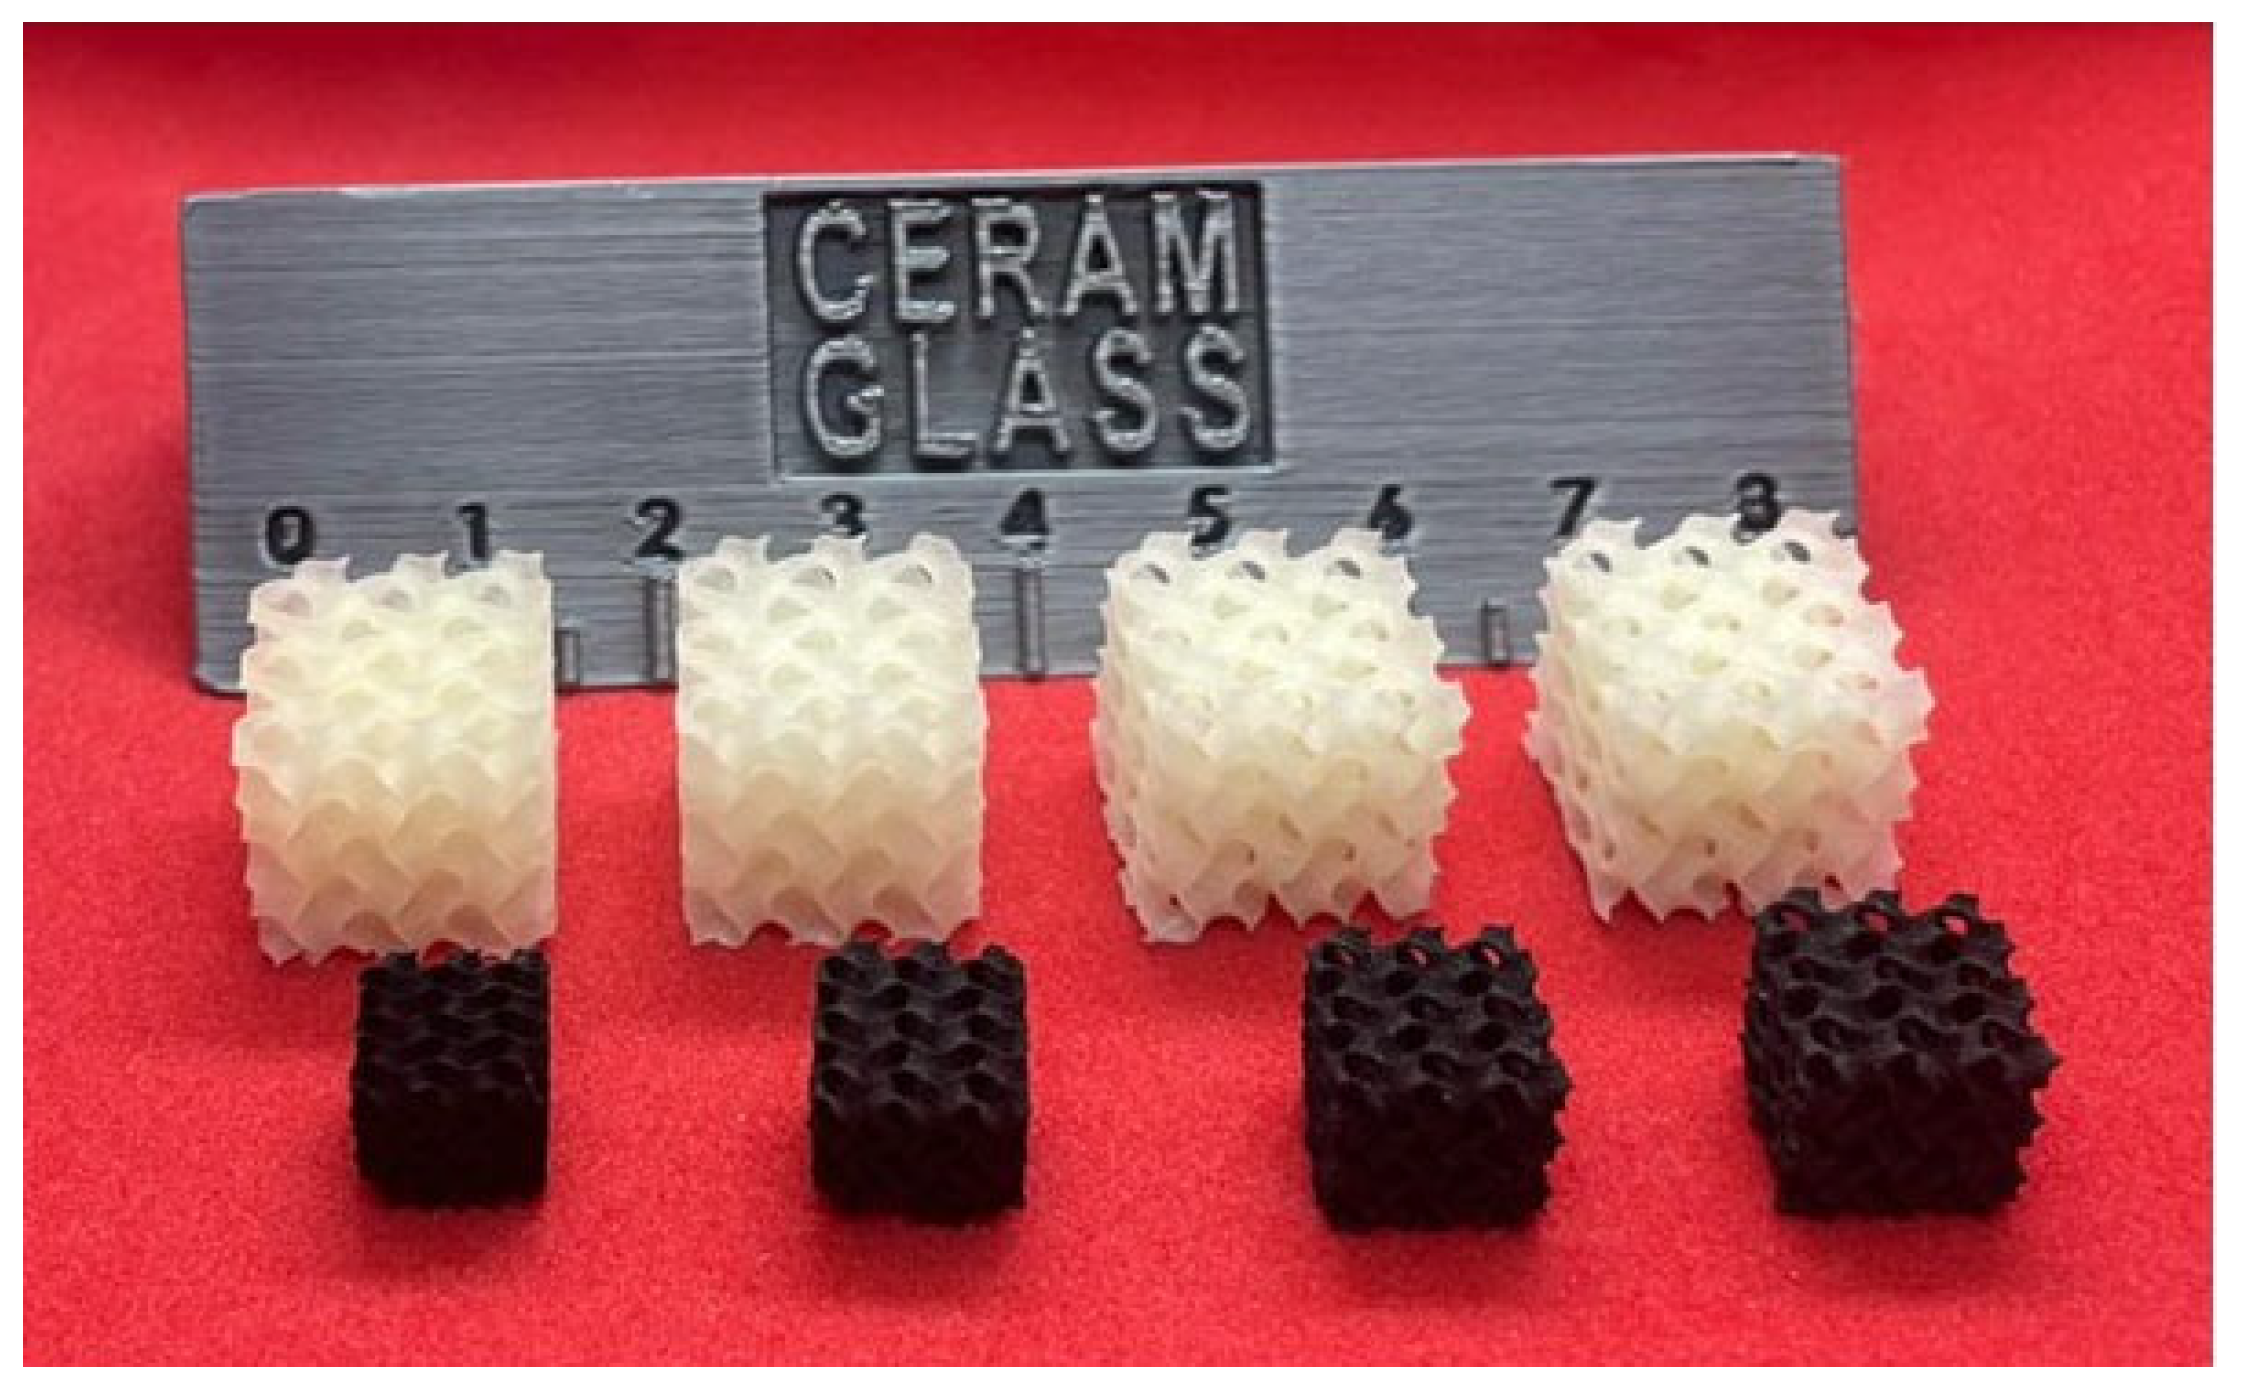
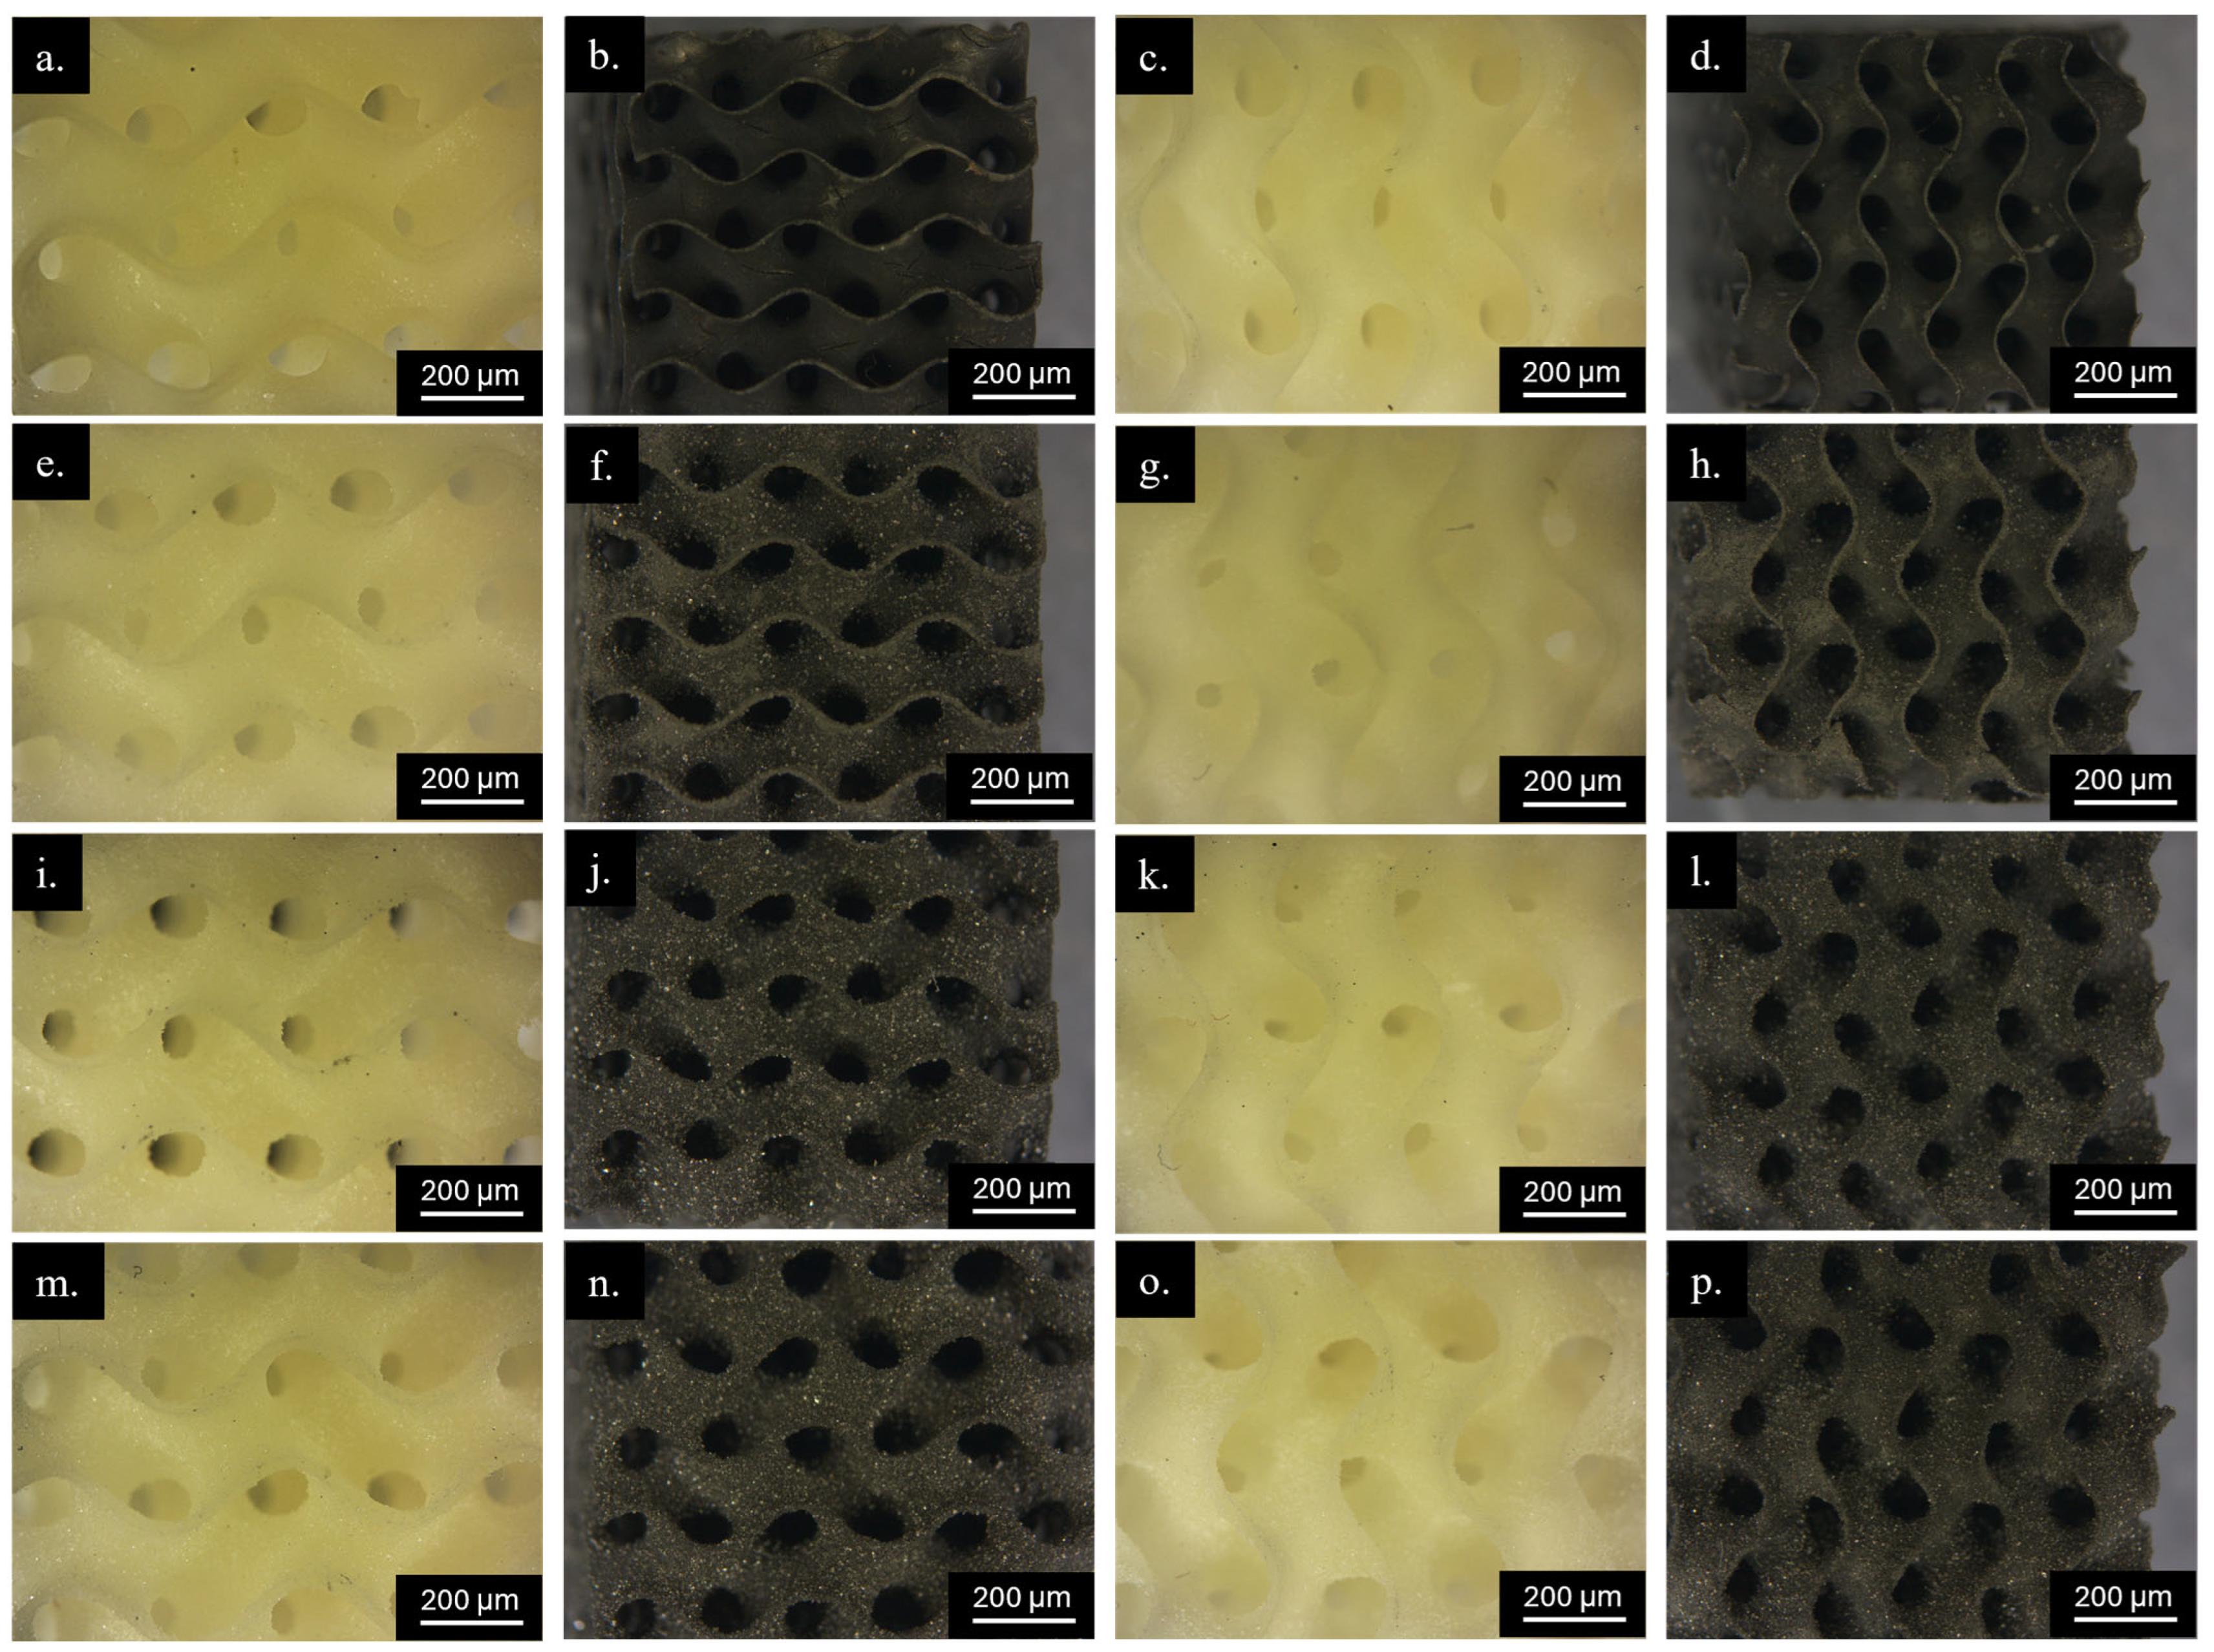
All formulations yielded well-defined architected scaffolds after DLP printing (Figure 3), confirming that the silicone-based emulsion strategy is compatible with TPMS geometries and controlled microporosity [1,2,3,4,5,6,7,8,9,18,19,20]. After firing in N2 at 700 °C, scaffolds retained their overall gyroid topology while showing the typical black colouration associated with in situ carbon formation during polymer-to-ceramic conversion (Figure 3) [26,31]. Ceramic yield increased with BASG addition, rising from 25.4% ± 0.074 for the BASG-free 70S30C formulation to 34.65% ± 0.43, 39.15% ± 0.45, and 44.53% ± 0.20 for the samples containing 30, 50, and 70 wt.% BASG, respectively. This trend is consistent with the role of BASG acting as a passive filler and increasing ceramic yield. Critically, however, the glass (70S30C) reference sample (no BASG) was observed to be cracked, whereas all BASG-containing formulations (30, 50, and 70 wt.%) showed substantially improved macroscopic integrity (Figure 4).
This contrast is consistent with the known role of inert fillers in reducing shrinkage-induced cracking during pyrolysis of preceramic polymers [22,23,24]. The literature on polymer-derived ceramic (PDC) foams indicates that filler-free systems can undergo shrinkage up to 50 vol.% at 1000 °C, whereas inert-filler-loaded systems show shrinkage around 20 vol.%, with cracks typically appearing above 600 °C when the ceramic network hardens and can no longer relax via viscous flow [23,53]. In the present case, BASG, boroaluminosilicate glass with a low coefficient of thermal expansion (composition: 76.1 wt.% SiO2, 8.9 wt.% B2O3, 7.5 wt.% Na2O, 5.7 wt.% Al2O3), acts as a passive stress-absorbing phase that remains dimensionally stable at 700 °C and thus constrains shrinkage gradients [43]. The suppression of cracking is essential for functional performance because even small defects can dominate both mechanical failure and electrical percolation in highly porous lattices [10].

3.3. Microstructure and Compositional Homogeneity

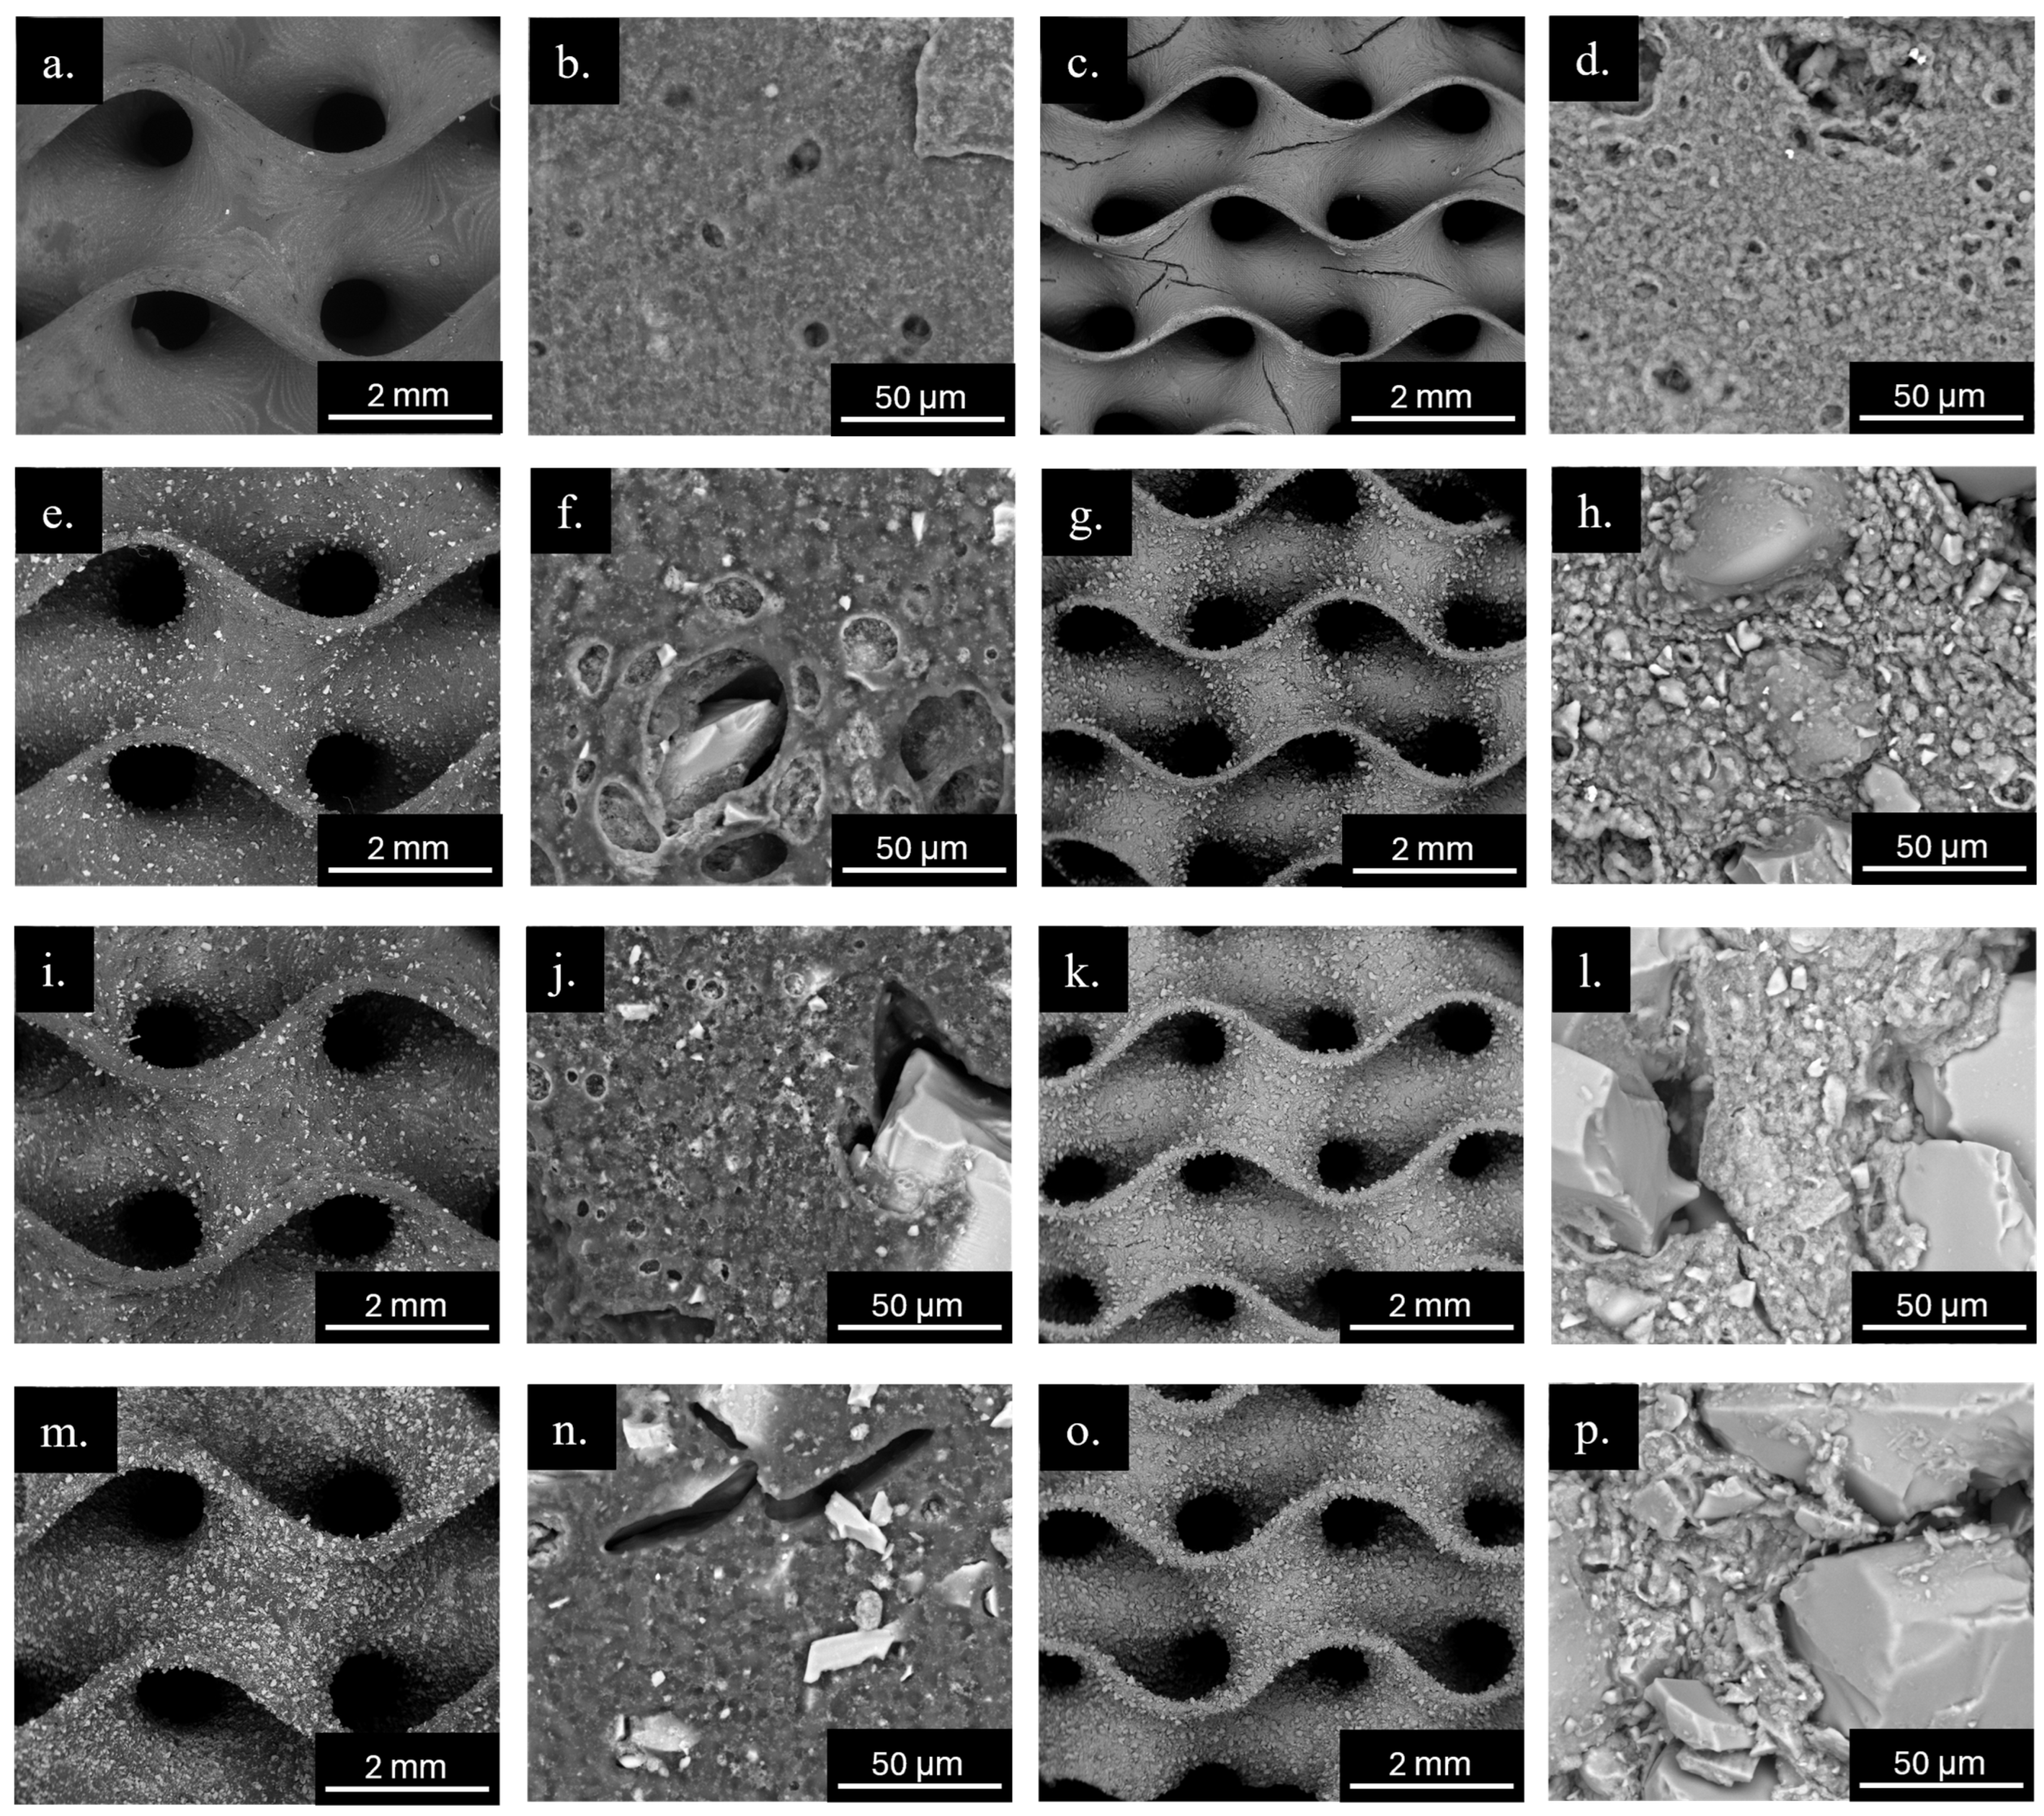
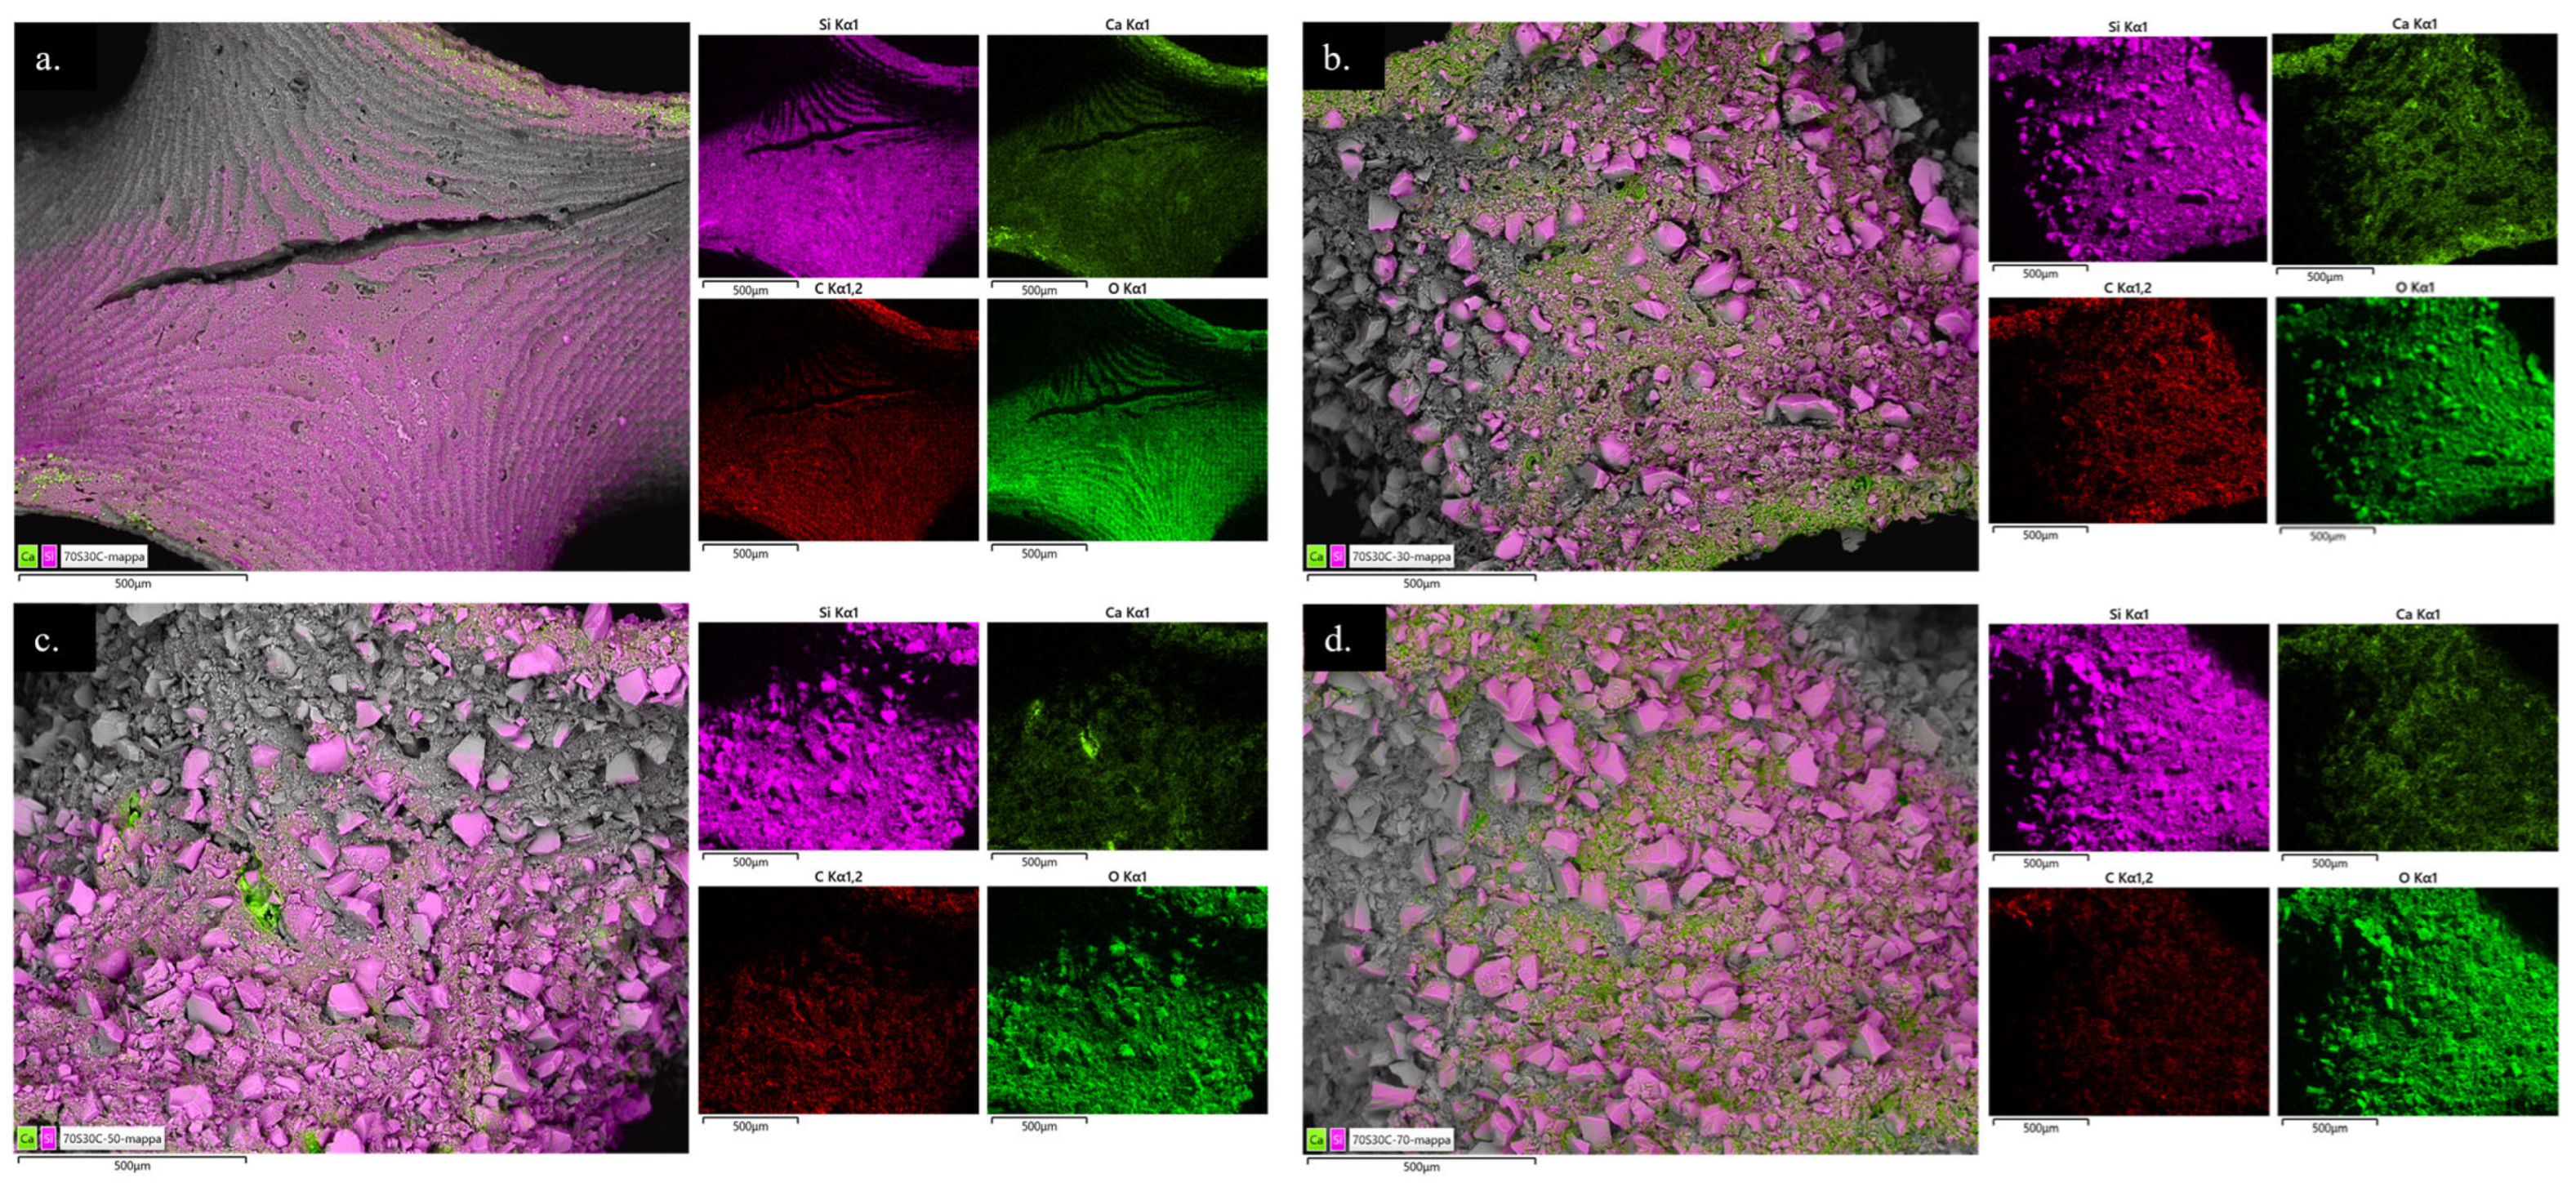
SEM micrographs at multiple magnifications (Figure 5) reveal strut surfaces that are smooth and continuous in BASG-containing samples, in contrast to the microcracked reference. EDX elemental mapping (Si, Ca, C, O) of the fired scaffolds suggests a relatively uniform distribution of all elements across the three BASG loadings, with no evidence of macroscopic Ca-rich or C-rich clusters at the SEM-EDX scale (Figure 6), although local compositional heterogeneities cannot be excluded. These observations are consistent with the formation of a composite strut in which a silicate-derived matrix coexists with a dispersed carbonaceous phase generated during N2 pyrolysis [26,31,37].
However, EDX-scale compositional uniformity (micron-to-submicron) does not prove carbon percolation, which is the key requirement for electrical conductivity. In polymer-derived SiOC, free-carbon phase segregates as turbostratic sp2 clusters within an amorphous SiO2-rich network, and the percolation threshold depends strongly on both carbon volume fraction and heat-treatment temperature; the literature reports from ≈20 vol.% at 1100 °C to ≈6 vol.% at 1600 °C, consistent with increased ordering/aspect ratio of the carbon phase [11,12,32,37,41]. At 700 °C, the carbon phase is expected to be highly disordered (low graphitization), so achieving continuous conductive pathways depends primarily on the connectivity and morphology of the carbonaceous phase (percolation), rather than on carbon presence alone; moreover, EDX-derived carbon fractions should be interpreted cautiously when comparing with the literature percolation thresholds expressed in vol.% free carbon [32,37,42].

3.4. Phase Evolution by X-Ray Diffraction

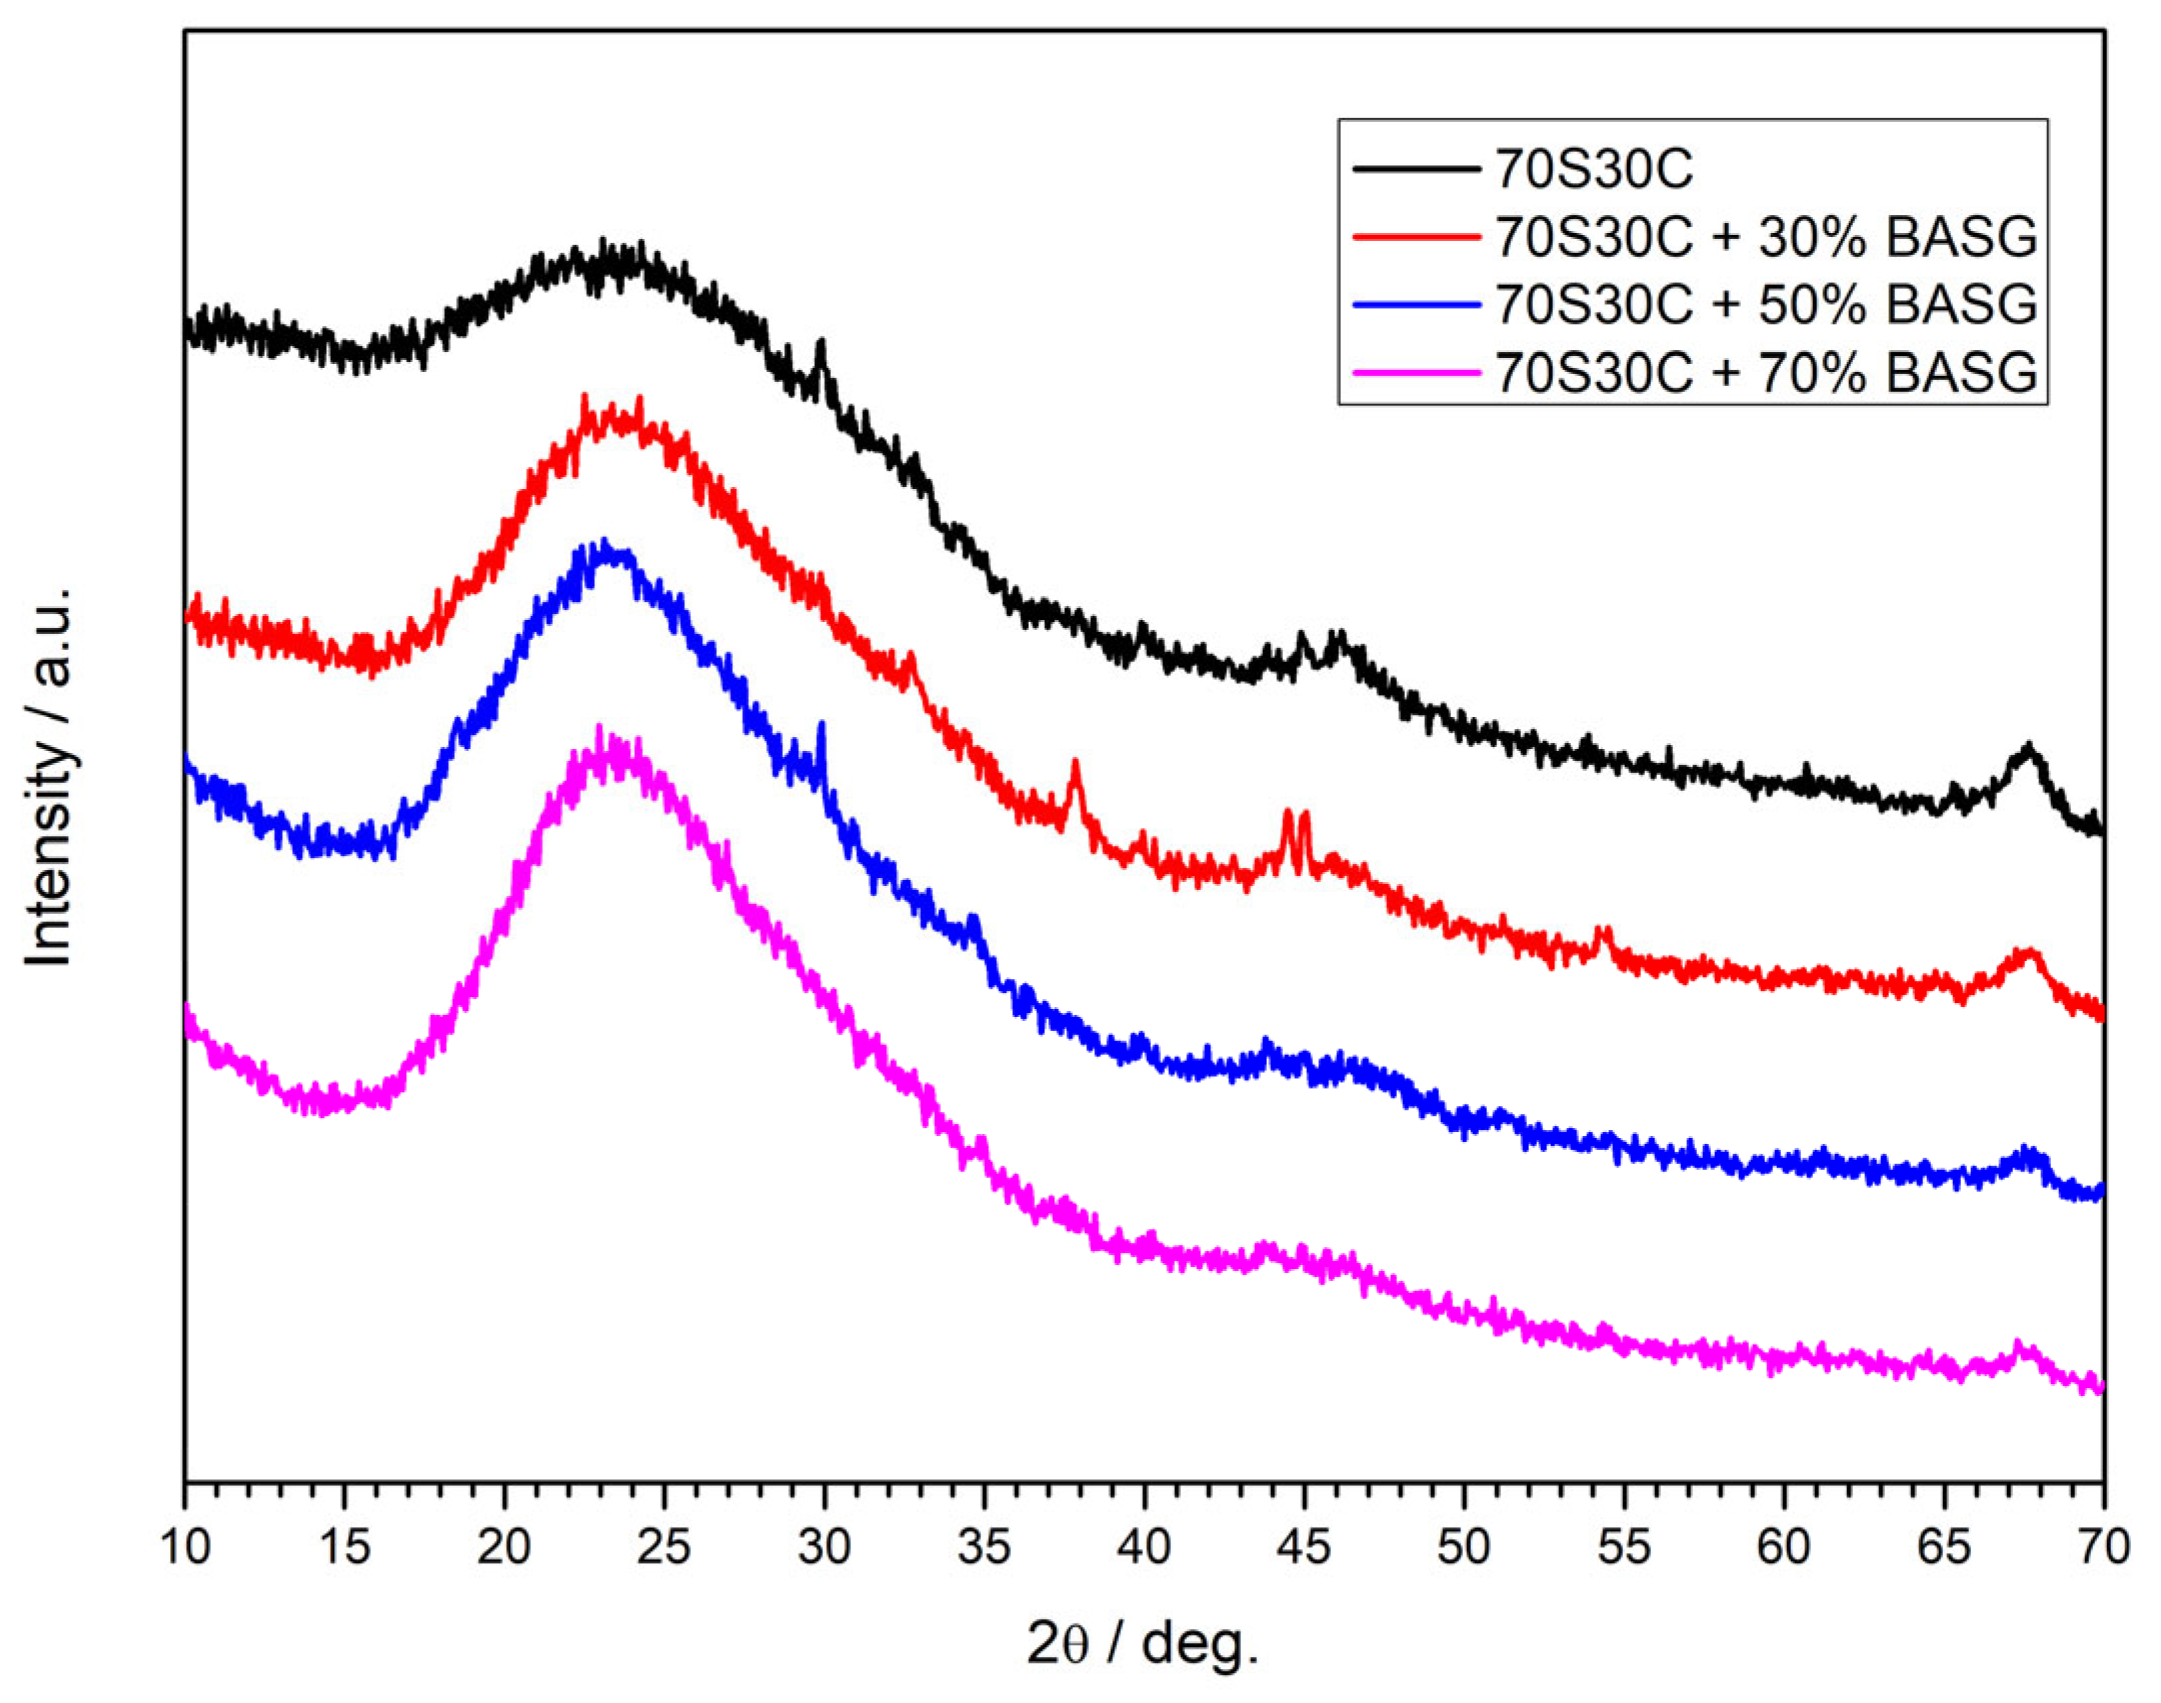
XRD patterns of fired scaffolds (700 °C, N2) show a predominantly amorphous pattern, with no sharp crystalline peaks corresponding to CaO, cristobalite, or calcium silicate phases (Figure 7). Under these conditions, the data indicate the absence of detectable crystalline Ca-rich segregates, but they do not rule out the presence of amorphous or very finely dispersed Ca-containing domains below the detection limit of XRD. Therefore, the results are consistent with a substantial degree of Ca dispersion in the amorphous matrix, rather than providing definitive proof of the complete absence of Ca-rich clusters. Such dispersion is consistent with the intended role of the nitrate-nanoemulsion route in promoting a more homogeneous Ca distribution within the silicate-derived matrix [26,27,28,29,30]. A more homogeneous Ca distribution is expected to reduce local compositional heterogeneity that can seed crystallization and introduce coefficient of thermal expansion (CTE) mismatch [10], while also favouring a glass-derived matrix better able to accommodate the dispersed carbon phase without additional interfacial stress.
The XRD data also show no sharp reflections attributable to crystalline graphitic carbon, which is not unexpected at 700 °C and is consistent with a poorly ordered carbonaceous phase that, if detectable, would more likely appear as broad features of disordered/turbostratic carbon rather than as sharp graphite peaks [32,33,37,42]. Therefore, while the XRD results are consistent with an amorphous glass–carbon composite, they do not by themselves demonstrate that the carbon phase is percolating or quantify its electrical contribution [32,37,42].

3.5. Porosity and Density

Quantitative porosity and density data are summarized in Table 1. Green scaffolds (as printed) showed open porosities in the range 78–82 vol.%, while fired scaffolds (700 °C, N2) exhibited porosities between 80 and 87 vol.%, confirming that the TPMS architecture and designed macroporosity were substantially preserved after ceramization [1,2,3,4,5,6,7,8]. Notably, porosity remained nearly constant or slightly increased upon firing, which is consistent with the low-temperature (700 °C) ceramization route that limits viscous sintering and preserves the open gyroid channels [26].

3.6. Mechanical Properties

Compressive strength data for fired scaffolds are reported in Table 1. Despite the very high open porosity after firing (≈84–87%), the gyroid scaffolds exhibit compressive strengths close to 1 MPa for the 70S30C reference and for the 30% and 50% BASG formulations, whereas the 70% BASG sample shows a lower value.
A useful first-order benchmark can be obtained from Gibson–Ashby-type scaling laws for bending/fracture-dominated open-cell cellular solids, although their applicability to highly porous architected TPMS lattices is necessarily approximate. For open-cell cellular solids, the crushing strength follows σ * / σ b e n d i n g 0.2 ( ρ * / ρ s ) 3 / 2 [53]. Taking ρ * / ρ s 1 P , a porosity of 85% corresponds to ( 1 P ) 3 / 2 0.058 , yielding σ * 0.2 × 0.058 × σ b e n d i n g [53]. Using a nominal modulus of rupture/strength for manufactured bulk glass of σ b e n d i n g 70 MPa [54], the expected compressive strength at 85% porosity is therefore σ * 0.8 MPa (i.e., below 1 MPa). In this context, the measured values for the 0–50% BASG gyroid scaffolds (≈1 MPa or higher) indicate an architecture/material combination broadly comparable with the level anticipated by classical cellular-solid scaling at extreme porosity, whereas the 70% BASG specimen falls below this reference.
Beyond relative density, the mechanical response of cellular solids is strongly affected by topology and defect population. TPMS-based lattices (including gyroids) are generally considered mechanically efficient architectures because of their continuous surfaces and interconnected load paths [5]. Consistently, BASG-containing samples also exhibited improved macroscopic integrity compared with the cracked BASG-free reference after firing, supporting the role of defect mitigation (crack suppression) in preserving load-bearing capability in highly porous lattices, and SEM/EDX observations did not reveal obvious large-scale compositional segregation or extensive macroscopic cracking in all the samples at the observed scale (Figure 4, Figure 5 and Figure 6) [10,21,22,23,24,55].
The strength drop at 70% BASG is therefore more plausibly associated with excessive passive-filler loading causing reduced continuity of the load-bearing glass-derived matrix and the formation of weaker filler/matrix interfaces rather than with macroscopic structural defects alone. However, this interpretation remains indirect and would require dedicated fractographic or higher-resolution interfacial analysis for direct confirmation [21,22,23,24]. These values should be considered with respect to the very high scaffold porosity rather than against dense glass-based materials. In this sense, the present gyroid structures combine compressive strengths of about 1 MPa with an open porosity of about 85 vol.%.

3.7. Photothermal Response

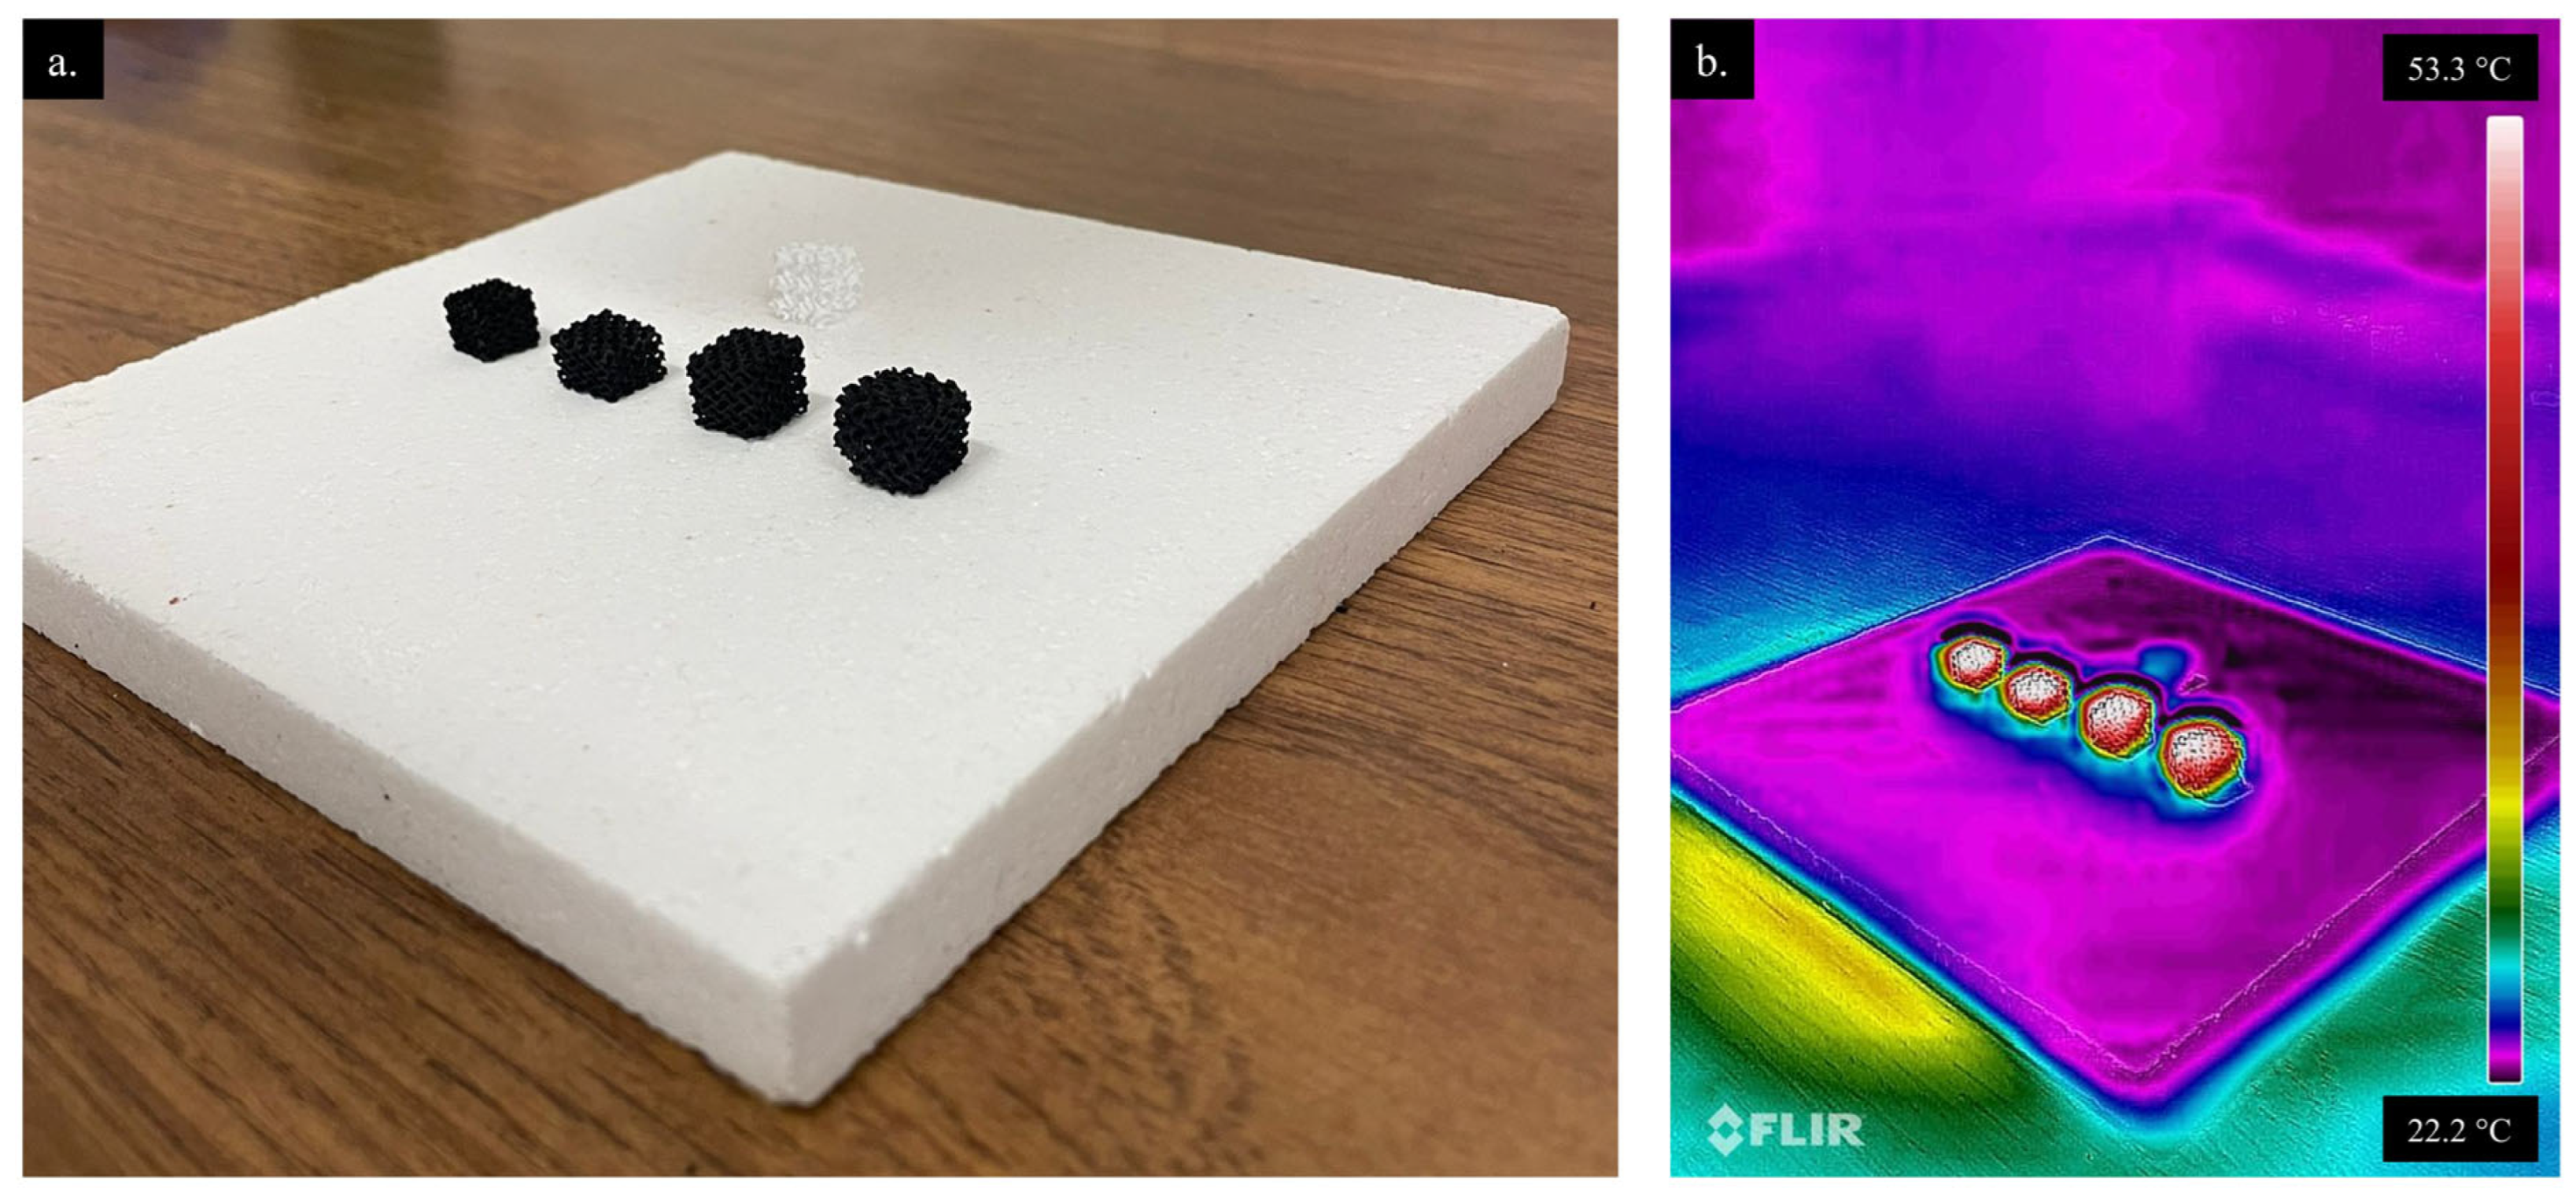
All carbon-containing scaffolds exhibited a rapid photothermal response under IR irradiation, reaching maximum surface temperatures of approximately 53 °C after 60 s (Figure 8), indicating appreciable IR absorption and photothermal heating [11,40,41,42,56,57]. This behaviour is consistent with the formation of a free-carbon (pyrolytic/turbostratic) phase during N2 pyrolysis, which acts as a broadband absorber in the near-IR [31,34,35,36,42,56,57].
The magnitude of the measured temperature rise should not be attributed to carbon content alone, because it also reflects surface emissivity and the overall heat balance of the scaffold-environment system. In the broader photothermal literature, high-aspect ratio carbon architectures (e.g., nanotubes and graphene) can deliver very high absorptance across the visible-to-NIR range and light-to-heat conversion efficiencies exceeding 90%, providing a useful upper benchmark for carbon-enabled heating [34,35,36]. In the present system, the turbostratic carbon phase is expected to have lower ordering and thus intermediate optical properties compared with highly graphitized carbons, but the high surface-to-volume ratio of the gyroid scaffold may compensate by promoting uniform exposure and rapid heat dissipation into the porous network [31,34,42].

3.8. Electrochemical Behaviour

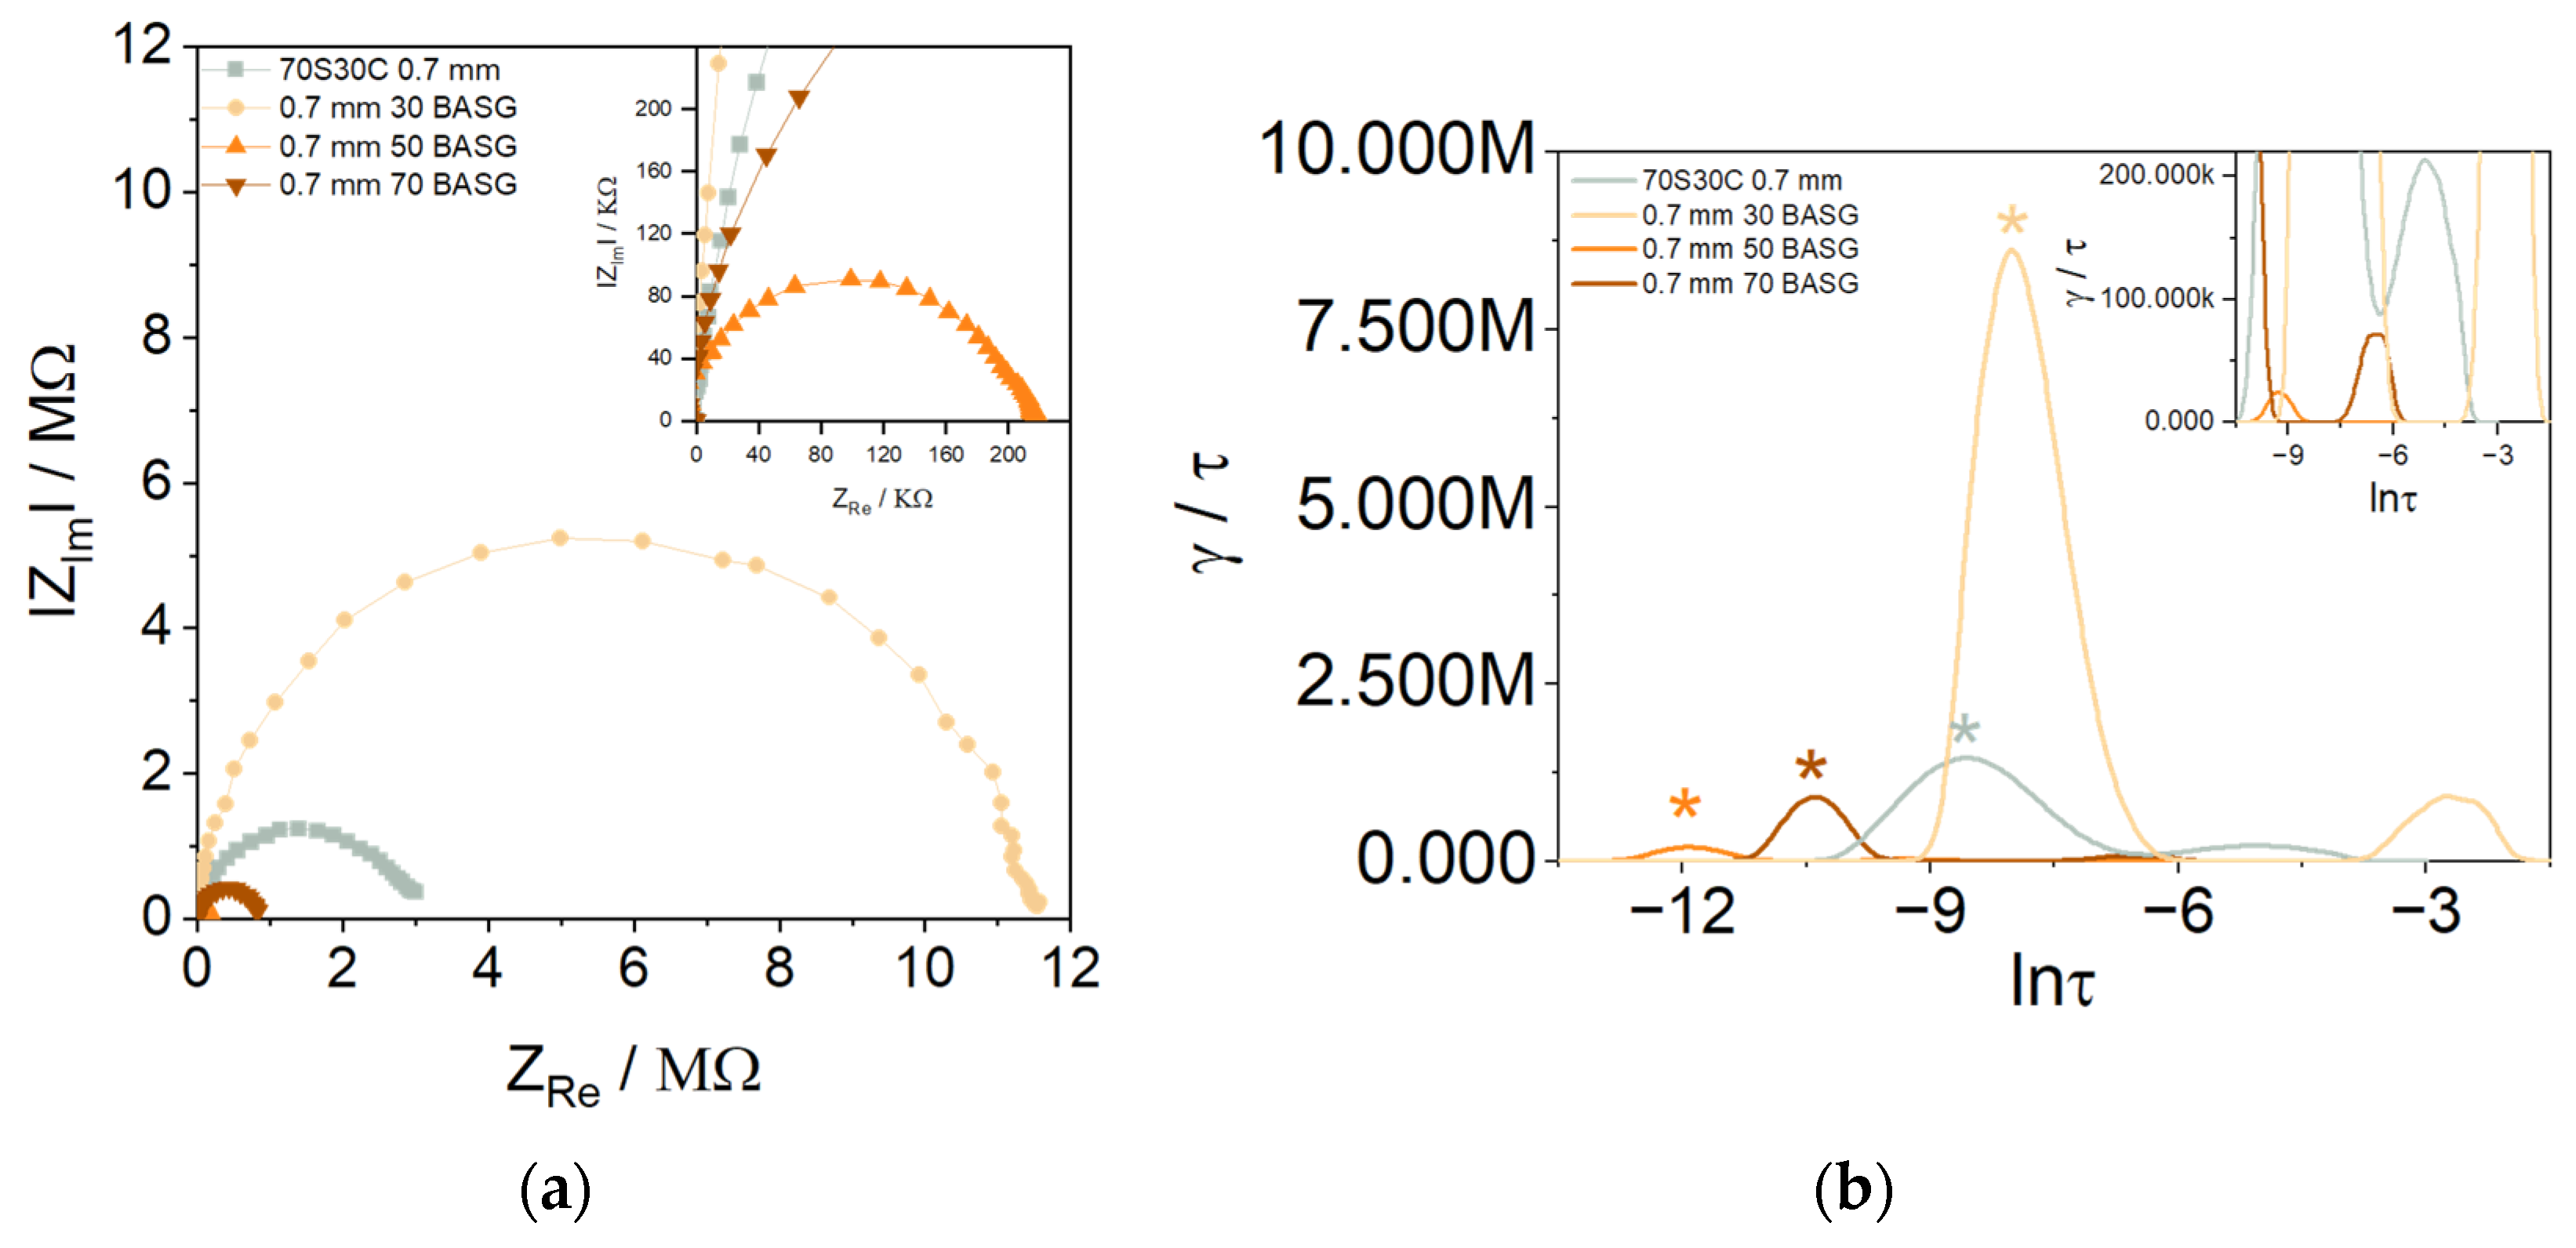
Nyquist impedance plots, shown in Figure 9a, maintained the same characteristic shape for all considered samples (70S30C 0.7, 30, 50, and 70 BASG samples), which is consistent with impedance responses reported for glassy or predominantly amorphous dielectric materials with semiconducting behaviour, including materials used in microelectronic applications [47,58,59,60]. The impedance spectra display a superposition of two consecutive semicircles, indicating the presence of two distinct relaxation processes. This type of electrical behaviour can be explained in terms of an equivalent circuit comprising two resistance–capacitance (RC) circuits connected in series. The first and larger semicircle could correspond to the bulk response, while the smaller one might be attributed to grain boundary effects, although further investigation would be necessary to confirm this attribution [58].
The DRTtools program was employed to obtain the respective DRT profiles, consisting of two peaks in a γ ( τ ) vs. τ plot. By converting the x-axis from frequency f to l n ( τ ) and integrating each peak, it is possible to determine its resistance (and consequently the capacitance C = τ R 1 since the peak position is related to the time constant τ = ( 2 π f ) 1 of the RC circuit, assuming ideal behavior. One of the most critical aspects of this analysis is the choice of the regularization parameter λ . While the values of 0.5 for the full width at half maximum (FWHM) and the Gaussian method are typically the most appropriate, the regularization parameter λ = 0.001 was chosen to ensure adequate discretization of the two semicircles without over-interpreting the data.
Figure 9b shows the results of this analysis, in which, the first peak, the most prominent and obtained at higher frequencies, is identified with an asterisk (*). The corresponding resistance, relaxation time, and capacitance values are reported in Table 2. The DRT-derived resistance contributions do not show a monotonic dependence on BASG content. In particular, the lower resistance observed for the 50 wt.% BASG sample should not be interpreted as evidence that the electrically insulating BASG phase directly enhances electronic conduction. Rather, it is most plausibly associated with a favourable balance between structural continuity, reduced cracking, and electrolyte-access conditions in the porous architecture. For the 30 wt.% BASG sample, the highest resistance contributions were obtained: 1.13 × 10⁷ Ω and 1.06 × 10⁶ Ω. In contrast, the 50 wt.% BASG sample exhibited the lowest resistance values: 1.99 × 10⁵ Ω and 2.08 × 10⁴ Ω.
Table 2 reports DRT-derived resistance contributions for the sample/electrolyte system. These values should be regarded as apparent resistive responses rather than direct measures of intrinsic conductivity. Because the measurements were performed in 0.1 M HClO4, the observed impedance may include contributions from ionic transport within the electrolyte-filled porosity and interfacial polarization at the liquid/strut interface, in addition to any electronic contribution associated with the carbonaceous phase. Therefore, the present EIS results do not by themselves demonstrate true electronic percolation through the ceramic matrix.

3.9. Surface Wettability

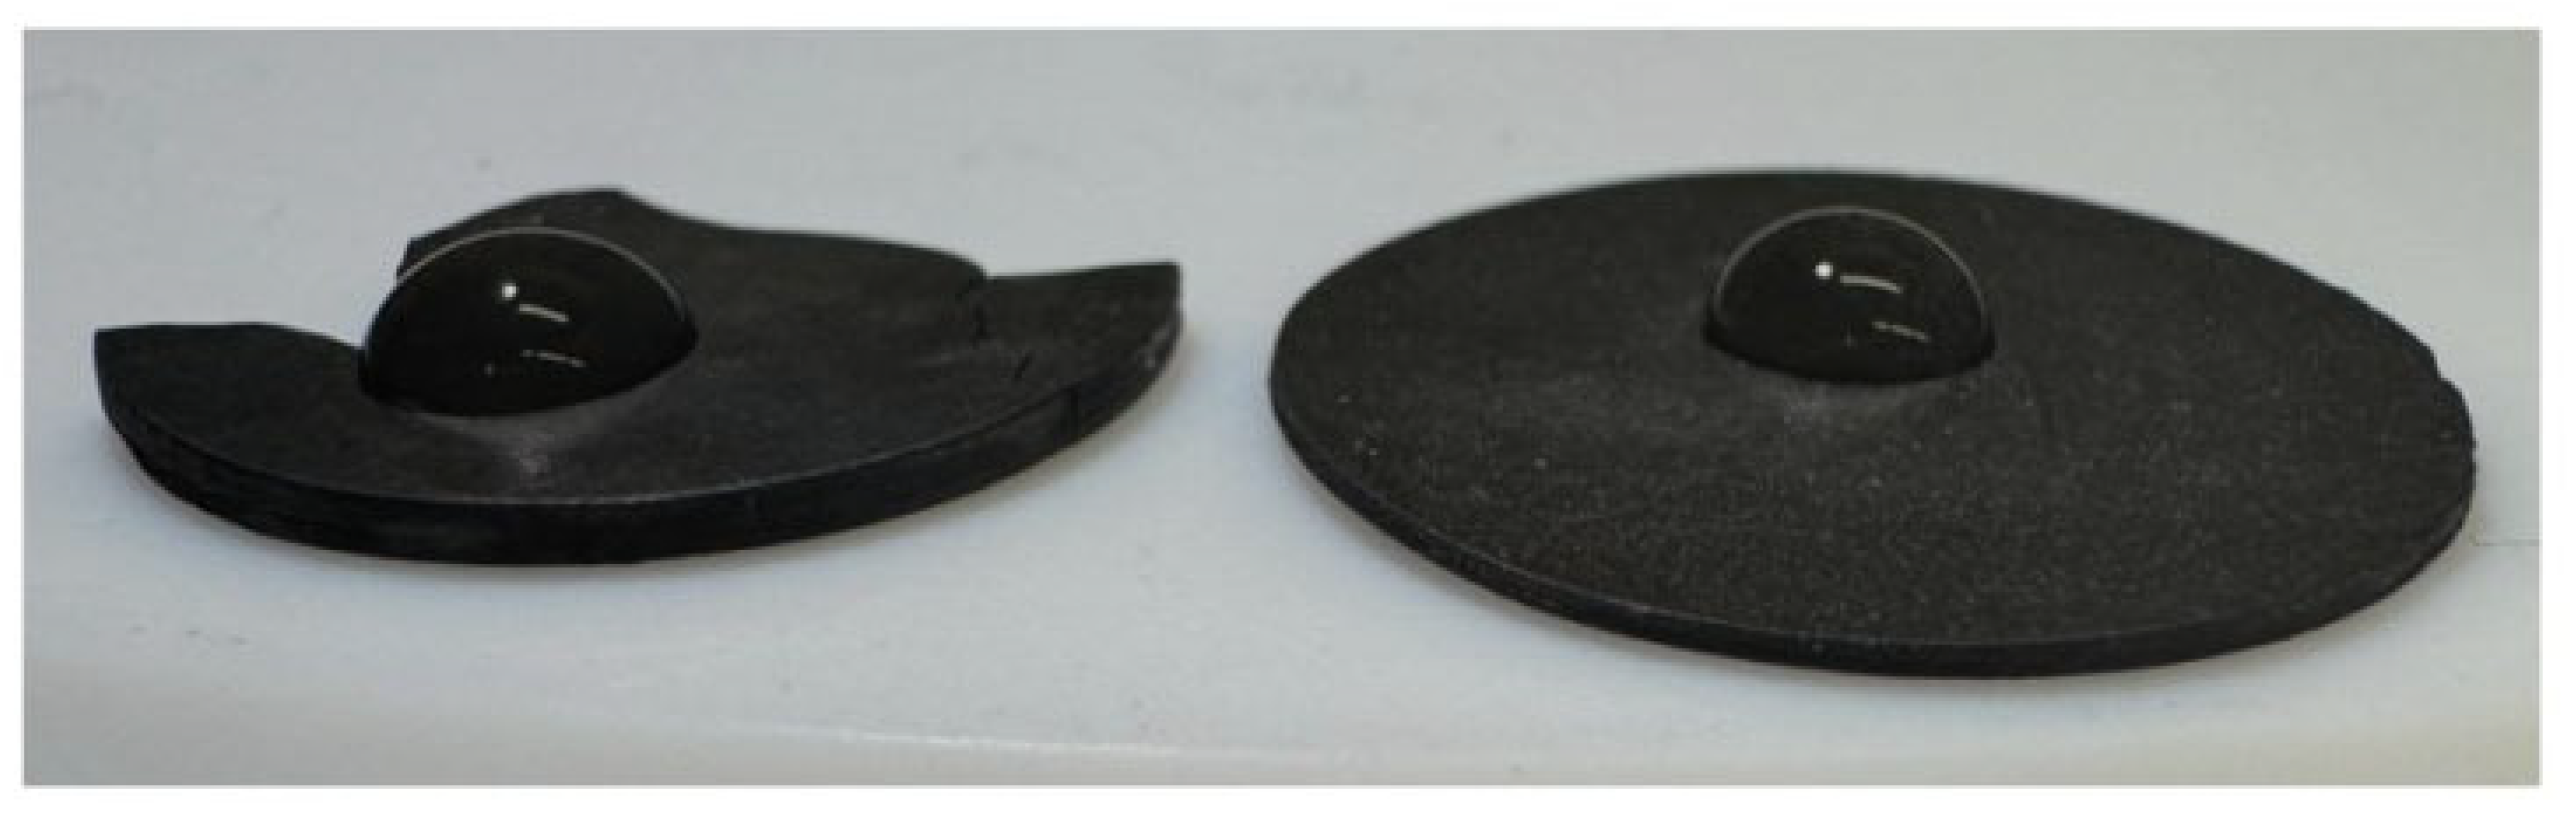
Qualitative wetting observations (Figure 10) suggest that the fired disk wettability reflects its composite surface, where a silicate-derived glassy matrix coexists with an in situ carbonaceous phase. The glass fraction is expected to promote hydrophilicity (e.g., via hydroxylated silicate sites), whereas the carbon-rich fraction can lower wettability, yielding intermediate behaviour rather than a single-phase limit [34,61,62]. Contact-angle measurements reported for glassy-carbon coatings indicate that carbonaceous surfaces can exhibit moderate-to-high water contact angles (around 70–75°), supporting the idea that the carbon fraction may reduce the overall hydrophilicity compared with purely oxidic surfaces [61]. In related Si-C materials, wetting has also been shown to depend sensitively on surface termination/chemistry (e.g., Si-face vs. C-face in SiC), reinforcing that small changes in exposed surface domains may translate into measurable differences in wettability [62].
From an application standpoint, tuning wettability is relevant in porous electrochemical architectures because it can affect electrolyte imbibition and the tendency to water-flood porous networks; engineered wettability gradients have been explicitly proposed as a strategy to improve water transport management in porous electrodes [63]. In the present system, BASG addition may therefore provide an additional handle to adjust the apparent wettability by diluting the carbon fraction and modifying the relative exposure of glassy versus carbon-rich surface domains after pyrolysis, as illustrated by the representative wetting images. Further quantitative characterization (e.g., sessile-drop contact-angle measurements on flat surfaces or capillary-rise tests on the porous scaffolds) would be required to establish clear trends with BASG loading and to correlate wettability with electrochemical performance in liquid electrolytes.

4. Conclusions

In this work, porous gyroid glass matrix composites were fabricated by DLP-VPP from a printable silicone-based emulsion containing an emulsified calcium-salt precursor and subsequently converted under nitrogen at 700 °C into CaO-SiO2-derived amorphous matrices embedding an in situ turbostratic/pyrolytic carbon phase [11,26,31,32,42]. The emulsion-enabled route supported high-fidelity replication of TPMS architectures at very high open porosity (85 vol.%), while preserving the overall topology after ceramization [1,2,3,4,5,6,7,8,26].
The addition of pharmaceutical boroaluminosilicate waste glass (BASG) as a passive filler significantly improved the macroscopic integrity of the fired lattices compared with the BASG-free reference, consistent with mitigation of conversion-induced stresses and cracking in thin-walled architectures [21,22,23,24,43]. Microstructural observations and XRD indicated a predominantly amorphous glass-derived matrix with relatively homogeneous elemental distribution at the SEM-EDX scale and no detectable crystalline Ca-rich phases, supporting the effectiveness of the salt-emulsion strategy in maintaining compositional homogeneity at low conversion temperature [26,27,28,29,30]. All fired samples exhibited a clear photothermal response under IR irradiation, consistent with the formation of a carbonaceous phase during inert-atmosphere conversion [31,34,35,36,42,56,57], and preliminary impedance measurements suggested an apparent electrochemical response in liquid electrolyte [32,33,39,40].
Overall, the combination of architecture control, low-temperature conversion, in situ carbon-enabled functionality, and waste-glass valorization defines a promising processing route for architected porous components targeting electrochemical platforms where interconnected porosity and electrochemically responsive struts are advantageous [1,2,12,21,26,44]. Further dry-state conductivity measurements or blocking-electrode experiments will be required to decouple electronic and ionic contributions and to assess the extent of true electronic percolation in the present materials.

Author Contributions

Conceptualization, A.Z. and E.B.; methodology, A.Z., M.P., C.D. and E.B.; validation, A.Z., M.P., C.D. and E.B.; formal analysis, A.Z. and M.P.; investigation, A.Z. and M.P.; resources, C.D. and E.B.; data curation, A.Z. and M.P.; writing—original draft preparation, A.Z. and M.P.; writing—review and editing, C.D. and E.B.; visualization, C.D. and E.B.; supervision, C.D. and E.B.; project administration, E.B.; funding acquisition, E.B. All authors have read and agreed to the published version of the manuscript.

Funding

This research received no external funding.

Data Availability Statement

Data available on request.

Acknowledgments

A.Z. and E.B. acknowledge the Italian Ministry of Research and Education (MUR)—Resource and Recovery Plan (PNRR) and De Angeli Prodotti Srl (Bagnoli di Sopra, Padova, Italy) for co-funding the D.M. 117 PhD scholarship of A.Z.

Conflicts of Interest

The authors declare no conflicts of interest.

References

  1. Elsayed, H.; Micheli, S.; Stabile, F.M.; Altun, A.A.; Schwentenwein, M.; Cimetta, E.; Bernardo, E. Advanced vat photopolymerization of polymer-derived 70S30C glass-carbon nano-composites: Topological control and biological validation. J. Eur. Ceram. Soc. 2025, 45, 117384. [Google Scholar] [CrossRef]
  2. Hossain, S.; Hossain, M.; Nilufar, S. An overview of additive manufacturing of triply periodic minimal surface-based lattice structures. Polymers 2025, 17, 3307. [Google Scholar] [CrossRef]
  3. du Plessis, A.; Broeckhoven, C.; Yadroitsava, I.; Yadroitsev, I.; Hands, C.H.; Kunju, R.; Bhate, D. Beautiful and functional: A review of biomimetic design in additive manufacturing. Addit. Manuf. 2019, 27, 408–427. [Google Scholar] [CrossRef]
  4. Gado, M.G.; Al-Ketan, O.; Aziz, M.; Al-Rub, R.A.; Ookawara, S. Triply periodic minimal surface structures: Design, fabrication, 3D printing techniques, state-of-the-art studies, and prospective thermal applications for efficient energy utilization. Energy Technol. 2024, 12, 2301287. [Google Scholar] [CrossRef]
  5. Shen, M.; Quin, W.; Xing, B.; Zhao, W.; Gao, S.; Sun, Y.; Jiao, T. Mechanical properties of 3D printed ceramic cellular materials with triply periodic minimal surface architectures. J. Eur. Ceram. Soc. 2021, 41, 1481–1489. [Google Scholar] [CrossRef]
  6. Zhang, X.-Y.; Fang, G.; Zhou, J. Additively manufactured scaffolds for bone tissue engineering and the prediction of their mechanical behavior: A review. Materials 2017, 10, 50. [Google Scholar] [CrossRef]
  7. Maevskaia, E.; Guerrero, J.; Ghayor, C.; Bhattacharya, I.; Weber, F.E. Triply periodic minimal surface-based scaffolds for bone tissue engineering: A mechanical, in vitro and in vivo study. Tissue Eng. Part A 2023, 29, 507–517. [Google Scholar] [CrossRef]
  8. Vigil, J.; Lewis, K.; Norris, N.; Karakoç, A.; Becker, T.A.; Mari, M. Design, Fabrication, and Characterization of 3D-Printed Multiphase Scaffolds Based on Triply Periodic Minimal Surfaces. Adv. Polym. Technol. 2024, 2024, 4616496. [Google Scholar] [CrossRef]
  9. Fiume, E.; Coppola, B.; Montanaro, L.; Palmero, P. Vat-photopolymerization of ceramic materials: Exploring current applications in advanced multidisciplinary fields. Front. Mater. 2023, 10, 1242480. [Google Scholar] [CrossRef]
  10. Colombo, P.; Mera, G.; Riedel, R.; Sorarù, G.D. Polymer-derived ceramics: 40 years of research and innovation in advanced ceramics. J. Am. Ceram. Soc. 2010, 93, 1805–1837. [Google Scholar] [CrossRef]
  11. Sugie, C.; Navrotsky, A.; Lauterbach, S.; Kleebe, H.-J.; Mera, G. Structure and thermodynamics of silicon oxycarbide polymer-derived ceramics with and without mixed-bonding. Materials 2021, 14, 4075. [Google Scholar] [CrossRef]
  12. Ionescu, E.; Kleebe, H.-J.; Riedel, R. Silicon-containing polymer-derived ceramic nanocomposites (PDC-NCs): Preparative approaches and properties. Chem. Soc. Rev. 2012, 41, 5032–5052. [Google Scholar] [CrossRef]
  13. Ichikawa, H. Polymer-derived ceramic fibers. Annu. Rev. Mater. Res. 2016, 46, 335–356. [Google Scholar] [CrossRef]
  14. Sorarù, G.D.; D’Andrea, G.; Campostrini, R.; Babonneau, F.; Mariotto, G. Structural characterization and high-temperature behavior of silicon oxycarbide glasses prepared from sol-gel precursors containing Si-H bonds. J. Am. Ceram. Soc. 1995, 78, 379–387. [Google Scholar] [CrossRef]
  15. Sorarù, G.D.; Tavonatti, C.; Kundanati, L.; Pugno, N.; Biesuz, M. Effect of the pyrolysis atmosphere on the mechanical properties and microstructure of polymer-derived SiOC and SiCN. J. Am. Ceram. Soc. 2020, 103, 6519–6530. [Google Scholar] [CrossRef]
  16. Zanchetta, E.; Cattaldo, M.; Franchin, G.; Schwentenwein, M.; Homa, J.; Brusatin, G.; Colombo, P. Stereolithography of SiOC ceramic microcomponents. Adv. Mater. 2016, 28, 370–376. [Google Scholar] [CrossRef]
  17. Halloran, J.W.; Tomeckova, V.; Gentry, S.; Das, S.; Cilino, P.; Yuan, D.; Guo, R.; Rudraraju, A.; Shao, P.; Wu, T.; et al. Photopolymerization of powder suspensions for shaping ceramics. J. Eur. Ceram. Soc. 2011, 31, 2613–2619. [Google Scholar] [CrossRef]
  18. Wu, X.; Teng, J.; Ji, X.; Ma, D.; Sui, S.; Zhang, Z. Research progress of the defects and innovations of ceramic vat photopolymerization. Addit. Manuf. 2023, 65, 103441. [Google Scholar] [CrossRef]
  19. Zhang, K.; Meng, Q.; Qu, Z.; He, R. A review of defects in vat photopolymerization additive-manufactured ceramics: Characterization, control, and challenges. J. Eur. Ceram. Soc. 2024, 44, 1361–1384. [Google Scholar] [CrossRef]
  20. Sun, H.; Zou, B.; Quan, T.; Wang, X.; Ma, X.; Xing, H.; Wei, S.; Huang, C. Multi-material ceramic hybrid additive manufacturing based on vat photopolymerization and material extrusion compound process. Addit. Manuf. 2025, 97, 104627. [Google Scholar] [CrossRef]
  21. Colombo, P.; Bernardo, E.; Parcianello, G. Multifunctional advanced ceramics from preceramic polymers and nano-sized active fillers. J. Eur. Ceram. Soc. 2013, 33, 453–469. [Google Scholar] [CrossRef]
  22. Zheng, C.; Li, H.; Li, H.; Lei, Y.; Cao, K.; Zhang, B.; Wang, J.; Liao, X. Synthesis and shrinkage resistance of precursor ceramic microspheres aerogel composed of curled molecular chains via polymer-derived ceramics route. Ceram. Int. 2024, 50, 47722–47732. [Google Scholar] [CrossRef]
  23. Schelm, K.; Morales, E.A.; Scheffler, M. Mechanical and surface-chemical properties of polymer derived ceramic replica foams. Materials 2019, 12, 1870. [Google Scholar] [CrossRef]
  24. Balkan, A.; Wang, X.; Gurlo, A. Influence of Si3N4 fillers and pyrolysis profile on the microstructure of additively manufactured silicon carbonitride ceramics derived from polyvinylsilazane. Sci. Technol. Adv. Mater. 2024, 25, 2363170. [Google Scholar] [CrossRef]
  25. Zocca, A.; Franchin, G.; Elsayed, H.; Gioffredi, E.; Bernardo, E.; Colombo, P. Direct ink writing of a preceramic polymer and fillers to produce hardystonite (Ca2ZnSi2O7) bioceramic scaffolds. J. Am. Ceram. Soc. 2016, 99, 1960–1967. [Google Scholar] [CrossRef]
  26. Stabile, F.M.; Famengo, A.; Pedron, D.; Elsayed, H.; Bernardo, E. Functional bioglass-carbon nanocomposite scaffolds from vat photopolymerization of a novel preceramic polymer-based nanoemulsion. Addit. Manuf. 2023, 75, 103731. [Google Scholar] [CrossRef]
  27. Jones, J.R.; Clare, A.G. Bio-Glasses: An Introduction; John Wiley & Sons, Ltd.: Hoboken, NJ, USA, 2011. [Google Scholar] [CrossRef]
  28. Jones, J.R.; Ehrenfried, L.M.; Hench, L.L. Optimising bioactive glass scaffolds for bone tissue engineering. Biomaterials 2006, 27, 964–973. [Google Scholar] [CrossRef]
  29. Islam, M.T.; Felfel, R.M.; Abou Neel, E.A.; Grant, D.M.; Ahmed, I.; Zakir Hossain, K.M. Bioactive calcium phosphate-based glasses and ceramics and their biomedical applications: A review. J. Tissue Eng. 2017, 8, 2041731417719170. [Google Scholar] [CrossRef]
  30. Bui, X.V. Hydrothermal synthesis of bioactive calcium silicate glass. Zast. Mater. 2024, 65, 653–659. [Google Scholar] [CrossRef]
  31. Dogrul, F.; Bortolin, S.; Del Col, D.; Dengo, N.; Pedron, D.; Michalek, M.; Elsayed, H.; Galusek, D.; Bernardo, E. Polymer-derived Biosilicate-C composite foams: Phase development and photothermal effect. J. Eur. Ceram. Soc. 2021, 41, 380–388. [Google Scholar] [CrossRef]
  32. Rosenburg, F.; Balke, B.; Nicoloso, N.; Riedel, R.; Ionescu, E. Effect of the content and ordering of the sp2 free carbon phase on the charge carrier transport in polymer-derived silicon oxycarbides. Molecules 2020, 25, 5919. [Google Scholar] [CrossRef] [PubMed]
  33. Lu, K.; Erb, D.; Liu, M. Thermal stability and electrical conductivity of carbon-enriched silicon oxycarbide. J. Mater. Chem. C 2016, 9, 1829–1837. [Google Scholar] [CrossRef]
  34. Neelgund, G.M.; Oki, A.R. Influence of carbon nanotubes and graphene nanosheets on the photothermal effect of hydroxyapatite. J. Colloid Interface Sci. 2016, 484, 135–145. [Google Scholar] [CrossRef]
  35. Markovic, Z.M.; Harhaji-Trajkovic, L.M.; Todorovic-Markovic, B.M.; Kepić, D.P.; Arsikin, K.M.; Jovanović, S.P.; Pantovic, A.C.; Dramićanin, M.D.; Trajkovic, V.S. In vitro comparison of the photothermal anticancer activity of graphene nanoparticles and carbon nanotubes. Biomaterials 2011, 32, 1121–1129. [Google Scholar] [CrossRef]
  36. Yang, K.; Zhang, S.; Zhang, G.; Sun, X.; Lee, S.-T.; Liu, Z. Graphene in mice: Ultrahigh in vivo tumor uptake and efficient photothermal therapy. Nano Lett. 2010, 10, 3318–3323. [Google Scholar] [CrossRef]
  37. Rosenburg, F.; Ionescu, E.; Nicoloso, N.; Riedel, R. High-temperature Raman spectroscopy of nano-crystalline carbon in silicon oxycarbide. Materials 2018, 11, 93. [Google Scholar] [CrossRef]
  38. Ricohermoso, E., III; Klug, F.; Schlaak, H.; Riedel, R.; Ionescu, E. Electrically conductive silicon oxycarbide thin films prepared from preceramic polymers. Int. J. Appl. Ceram. Technol. 2022, 19, 149–164. [Google Scholar] [CrossRef]
  39. Mazo, M.A.; Caballero, A.C.; Rubio, J. Further insights into the electrical and thermal properties of carbon enriched silicon oxycarbide composites. J. Alloys Compd. 2021, 889, 161698. [Google Scholar] [CrossRef]
  40. Gangadhar, J.; Maheshwari, A.; Bordia, R.K.; Shyam Kumar, C.N.; Kubel, C.; Sujith, R. Role of carbon on the thermal and electrical properties of graphene-enriched silicon oxycarbides. Ceram. Int. 2020, 46, 28156–28164. [Google Scholar] [CrossRef]
  41. Cordelair, J.; Greil, P. Electrical conductivity measurements as a microprobe for structure transitions in polysiloxane derived Si–O–C ceramics. J. Eur. Ceram. Soc. 2000, 20, 1947–1957. [Google Scholar] [CrossRef]
  42. Ferrari, A.C.; Robertson, J. Interpretation of Raman spectra of disordered and amorphous carbon. Phys. Rev. B 2000, 61, 14095–14107. [Google Scholar] [CrossRef]
  43. Ma, X.; Liu, J.; Zhang, J.; Su, Y.; Yi, K.; Zhang, Y.; Ding, L.; Zheng, Q. Impact of chemical corrosion on mechanical properties of boroaluminosilicate pharmaceutical glasses. Materials 2024, 17, 3120. [Google Scholar] [CrossRef]
  44. Carollo, F.; De Rienzo, E.; D’Angelo, A.; Sgarbossa, P.; Barbieri, L.; Leonelli, C.; Lancellotti, I.; Catauro, M.; Bernardo, E. Cold consolidation of waste glass by alkali activation and curing by traditional and microwave heating. Materials 2025, 18, 2628. [Google Scholar] [CrossRef]
  45. Lima, M.; Monteiro, R.; Graca, M.; Ferreira da Silva, M. Structural, electrical and thermal properties of borosilicate glass-alumina composites. J. Alloys Compd. 2012, 538, 66–72. [Google Scholar] [CrossRef]
  46. Yang, R.; Liu, H.; Ding, Z.; Zheng, J.; Mauro, J.C.; Kim, S.H.; Zheng, Q. Chemical durability of borosilicate pharmaceutical glasses: Mixed alkaline earth effect with varying [MgO]/[CaO] ratio. J. Am. Ceram. Soc. 2021, 104, 3973–3981. [Google Scholar] [CrossRef]
  47. Hernández-Ramírez, F.; Tarancón, A.; Casals, O.; Rodriguez, J.; Romano-Rodriguez, A.; Morante, J.R.; Barth, S.; Mathur, S.; Choi, T.Y.; Poulikakos, D.; et al. Fabrication and electrical characterization of circuits based on individual tin oxide nanowires. Nanotechnology 2006, 17, 5577–5583. [Google Scholar] [CrossRef]
  48. Ciucci, F.; Chen, C. Analysis of electrochemical impedance spectroscopy data using the distribution of relaxation times: A Bayesian and hierarchical Bayesian approach. Electrochim. Acta 2015, 167, 439–454. [Google Scholar] [CrossRef]
  49. Zuo, J.; Steiner, N.Y.; Li, Z.; Hissel, D. Degradation root cause analysis of PEM fuel cells using distribution of relaxation times. Appl. Energy 2025, 378, 124762. [Google Scholar] [CrossRef]
  50. Gu, Z.; Ma, T.; Chen, J. Quantitative analysis of proton exchange membrane fuel cell degradation during idling using distribution of relaxation times. J. Appl. Electrochem. 2024, 54, 2241–2253. [Google Scholar] [CrossRef]
  51. Wang, Z.; Wang, Y.; Py, B.; Maradesa, A.; Liu, J.; Wan, T.H.; Saccoccio, M.; Ciucci, F. DRTtools: Freely accessible distribution of relaxation times analysis for electrochemical impedance spectroscopy. ACS Sel. Electrochem. 2025, 1, 2680–2689. [Google Scholar] [CrossRef]
  52. Wan, T.H.; Saccoccio, M.; Chen, C.; Ciucci, F. Influence of the discretization methods on the distribution of relaxation times deconvolution: Implementing radial basis functions with DRTtools. Electrochim. Acta. 2015, 184, 483–499. [Google Scholar] [CrossRef]
  53. Ashby, M.F. The properties of foams and lattices. Philos. Trans. A Math. Phys. Eng. Sci. 2006, 364, 15–30. [Google Scholar] [CrossRef]
  54. Gwóźdź, M. Formulae for buckling load bearing capacity of glass structure elements. Arch. Civ. Eng. 2020, 66, 353–368. [Google Scholar] [CrossRef]
  55. Elsayed, H.; Secco, M.; Zorzi, F.; Schuhladen, K.; Detsch, R.; Boccaccini, A.R.; Bernardo, E. Highly porous polymer-derived bioceramics based on a complex hardystonite solid solution. Materials 2019, 12, 3970. [Google Scholar] [CrossRef]
  56. Wang, Z.; Zhao, S.; Xiao, S.; Liu, S.; Yao, R.; Li, Y.; Wang, Y.; Li, Y.; Tan, H. Heteropoly blue/carbon nanotubes nanocomposites as high-performance photothermal conversion materials. Chem.-A Eur. J. 2023, 29, 195. [Google Scholar] [CrossRef] [PubMed]
  57. Chen, F.; Xu, L.; Tian, Y.; Caratenuto, A.; Liu, X.; Zheng, Y. Electrospun polycaprolactone nanofiber composites with embedded carbon nanotubes/nanoparticles for photothermal absorption. ACS Appl. Nano Mater. 2021, 4, 5230–5239. [Google Scholar] [CrossRef]
  58. Prasad, A.; Basu, A. Dielectric and impedance properties of sintered magnesium aluminum silicate glass-ceramic. J. Adv. Ceram. 2013, 2, 71–78. [Google Scholar] [CrossRef]
  59. Sakthisabarimoorthi, A.; Dhas, S.B.; Jose, M. Electrical impedance spectroscopic investigations of monodispersed SiO2 nanospheres. Superlattices Microstruct. 2018, 113, 271–282. [Google Scholar] [CrossRef]
  60. Sobas, P.A.; Grossner, U.; Svensson, B.G. Characterization of the SiO2/SiC interface with impedance spectroscopy. Mater. Sci. Forum 2009, 615–617, 501–504. [Google Scholar] [CrossRef]
  61. Teodosiev, D.; Bouzekova-Penkova, A.; Simeonova, S.; Grozev, N. Contact angle and AFM analysis of glassy carbon coatings after an extended stay on the International Space Station (ISS). C. R. Acad. Bulg. Sci. 2023, 76, 256–263. [Google Scholar] [CrossRef]
  62. Zhong, W.W.; Huang, Y.F.; Gan, D.; Xu, J.Y.; Li, H.; Wang, G.; Meng, S.; Chen, X.L. Wetting behavior of water on silicon carbide polar surfaces. Phys. Chem. Chem. Phys. 2016, 18, 28033–28039. [Google Scholar] [CrossRef] [PubMed]
  63. Pan, Z.; Wu, L.; Xie, F.; Zhang, Z.; Zhao, Z.; Esan, O.C.; Zhang, X.; Chen, R.; An, L. Engineered wettability-gradient porous structure enabling efficient water manipulation in regenerative fuel cells. Energy AI 2024, 17, 100400. [Google Scholar] [CrossRef]
Figure 1. Schematic illustration of the electrochemical configuration, showing the sample suspended at the electrolyte surface in an H-type cell configuration.
Solids 07 00032 g001
Figure 2. Flow curves of the 70S30C−based emulsions with increasing BASG content, reported as shear stress as a function of shear rate.
Solids 07 00032 g002
Figure 3. Green 3D-printed gyroids before pyrolysis and same sample after heat treatment at 700 °C in N2, showing black colouration and shrinkage.
Solids 07 00032 g003
Figure 4. Optical micrographs of 3D-printed scaffolds before ceramization and after firing at 700 °C at increasing BASG content. Rows correspond to compositions: 70S30C (ad), 70S30C + 30 wt% BASG (eh), 70S30C + 50 wt% BASG (il), and 70S30C + 70 wt% BASG (mp). Columns show: pre-ceramization, XY plane (a,e,i,m); fired at 700 °C, XY plane (b,f,j,n); pre-ceramization, Z plane (c,g,k,o); fired at 700 °C, Z plane (d,h,l,p).
Solids 07 00032 g004
Figure 5. SEM micrographs of 3D-printed scaffolds at increasing BASG content. Rows correspond to compositions: 70S30C (ad), 70S30C + 30 wt% BASG (eh), 70S30C + 50 wt% BASG (il), and 70S30C + 70 wt% BASG (mp). Columns show: pre-ceramization, XY plane (a,b,e,f,i,j,m,n); fired at 700 °C, XY plane (c,d,g,h,k,l,o,p). Low-magnification images showing the macroporous architecture are reported in (a,e,i,m) and (c,g,k,o), while high-magnification images of the strut surface are shown in (b,f,j,n) and (d,h,l,p).
Solids 07 00032 g005
Figure 6. SEM images with corresponding EDX elemental maps of scaffolds fired at 700 °C with increasing BASG content: 70S30C (a), 70S30C + 30 wt% BASG (b), 70S30C + 50 wt% BASG (c), and 70S30C + 70 wt% BASG (d). For each sample, the distributions of Si, Ca, C, and O are reported.
Solids 07 00032 g006
Figure 7. X-ray diffraction (XRD) patterns of 70S30C and 70S30C–BASG composites containing 30, 50, and 70% BASG after heat treatment at 700 °C under N2.
Solids 07 00032 g007
Figure 8. Photothermal response of the fired 70S30C-based glass–carbon scaffolds under infrared (IR) irradiation: (a) digital photograph of the samples placed on an insulating support prior to irradiation; (b) corresponding FLIR thermographic image recorded during IR exposure, showing a rapid temperature increase due to IR absorption by the dispersed pyrolytic carbon phase.
Solids 07 00032 g008
Figure 9. (a) Nyquist plots and (b) corresponding DRT analysis for 70S30C 0.7 mm samples with varying BASG contents.
Solids 07 00032 g009
Figure 10. Qualitative sessile-drop wetting images of fired disks comparing the 70S30C reference composition (left) and the 70S30C + 30% BASG composite (right).
Solids 07 00032 g010
Table 1. Bulk (geometrical) density ( ρ b u l k ), skeletal density ( ρ s k e l ), and open porosity of the as-printed (“green”) and fired (700 °C) 70S30C scaffolds and 70S30C–BASG composites (30, 50, and 70% BASG) and compressive strength ( σ c ) of fired scaffolds.
Samplesρbulk [g/cm3]ρskel [g/cm3]Open Porosity [%]σc [MPa]
Green70S30C0.2520 ± 0.0161.2994 ± 0.00780.87 ± 1.42
+30% BASG0.2532 ± 0.0151.4024 ± 0.02382.26 ± 0.81
+50% BASG0.2855 ± 0.0111.4579 ± 0.06380.85 ± 1.21
+70% BASG0.2995 ± 0.0251.4999 ± 0.01680.77 ± 0.23
Fired70S30C0.3147 ± 0.0081.8044 ± 0.02382.56 ± 0.441.098 ± 0.054
+30% BASG0.3071 ± 0.0242.3109 ± 0.25886.57 ± 2.160.984 ± 0.161
+50% BASG0.3347 ± 0.0712.3738 ± 0.11685.78 ± 3.591.243 ± 0.419
+70% BASG0.3591 ± 0.0122.3092 ± 0.03884.45 ± 0.460.613 ± 0.006
Table 2. Resistance (R), relaxation time (τ), and capacitance (C) values obtained from DRT analysis of impedance spectroscopy data for 70S30C samples with different BASG contents, measured in 0.1 M HClO4. The asterisks (*) denote the more resistive process.
DRT Peak R ( Ω ) τ ( s ) C ( F )
70S30C *2.88 × 1062.00 × 10−36.94 × 10⁻¹¹
70S30C4.13 × 1056.16 × 10−31.49 × 10⁻⁸
+30% BASG *1.13 × 1073.32 × 10−42.93 × 10⁻¹¹
+30% BASG1.06 × 1066.39 × 10−26.05 × 10⁻⁸
+50% BASG *1.99 × 1057.29 × 10−63.68 × 10⁻¹¹
+50% BASG2.08 × 1049.59 × 10−54.61 × 10⁻⁹
+70% BASG * 8.44 × 1053.07 × 10−53.64 × 10⁻¹¹
+70% BASG 7.52 × 1041.47 × 10−31.96 × 10⁻⁸
Disclaimer/Publisher’s Note: The statements, opinions and data contained in all publications are solely those of the individual author(s) and contributor(s) and not of MDPI and/or the editor(s). MDPI and/or the editor(s) disclaim responsibility for any injury to people or property resulting from any ideas, methods, instructions or products referred to in the content.