
Estimation of the Turkish Boron Exportation to Europe


Abstract
:1. Introduction
1.1. What Is Boron?
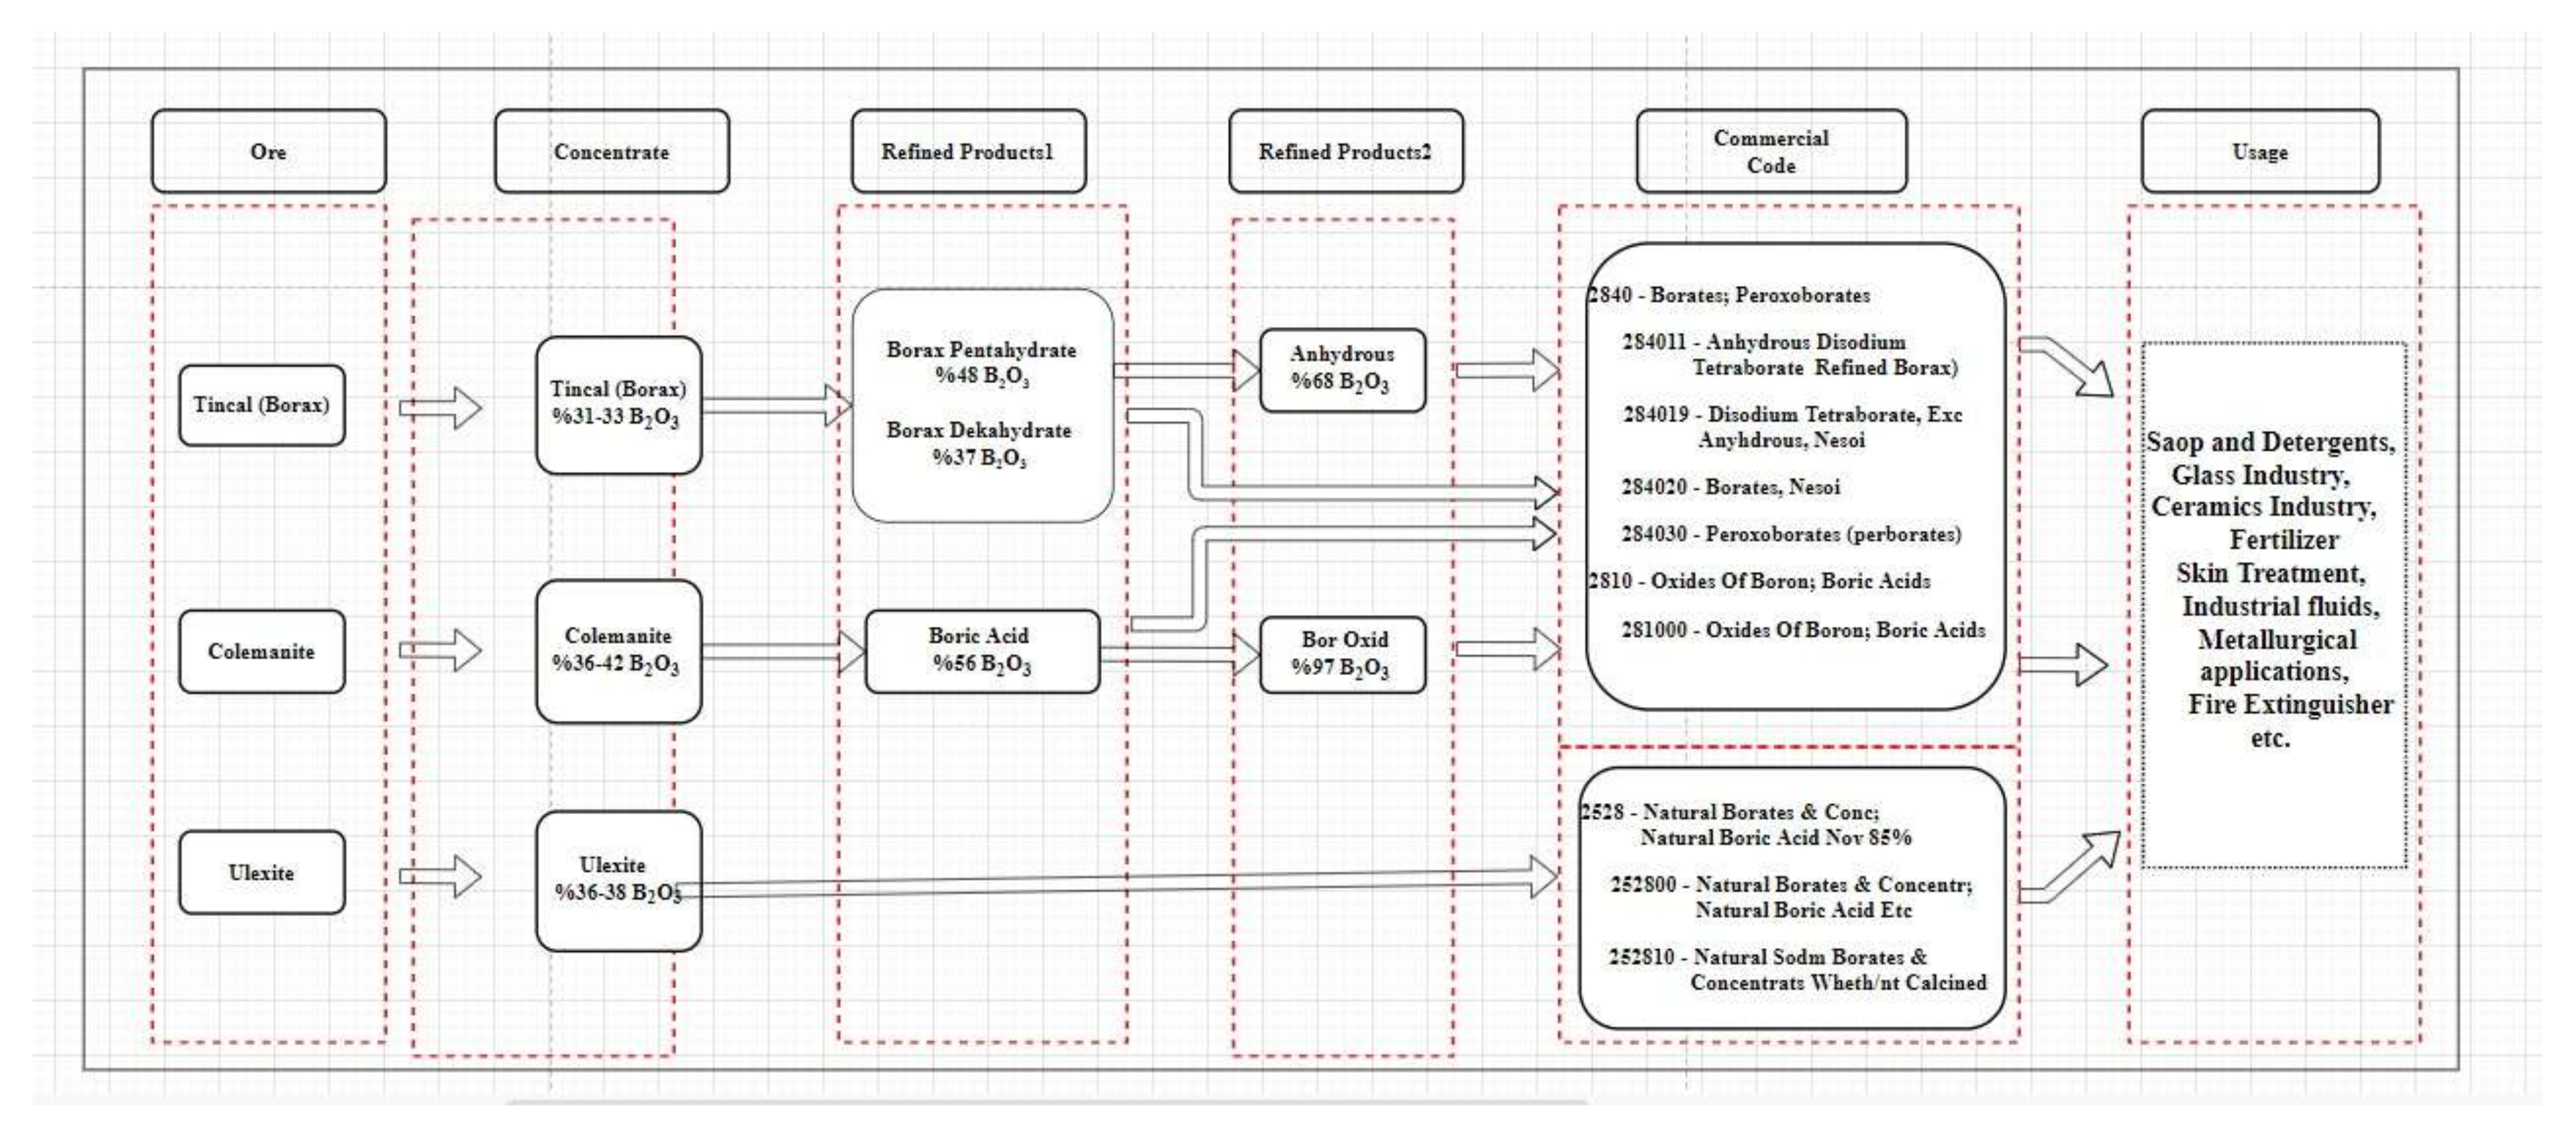
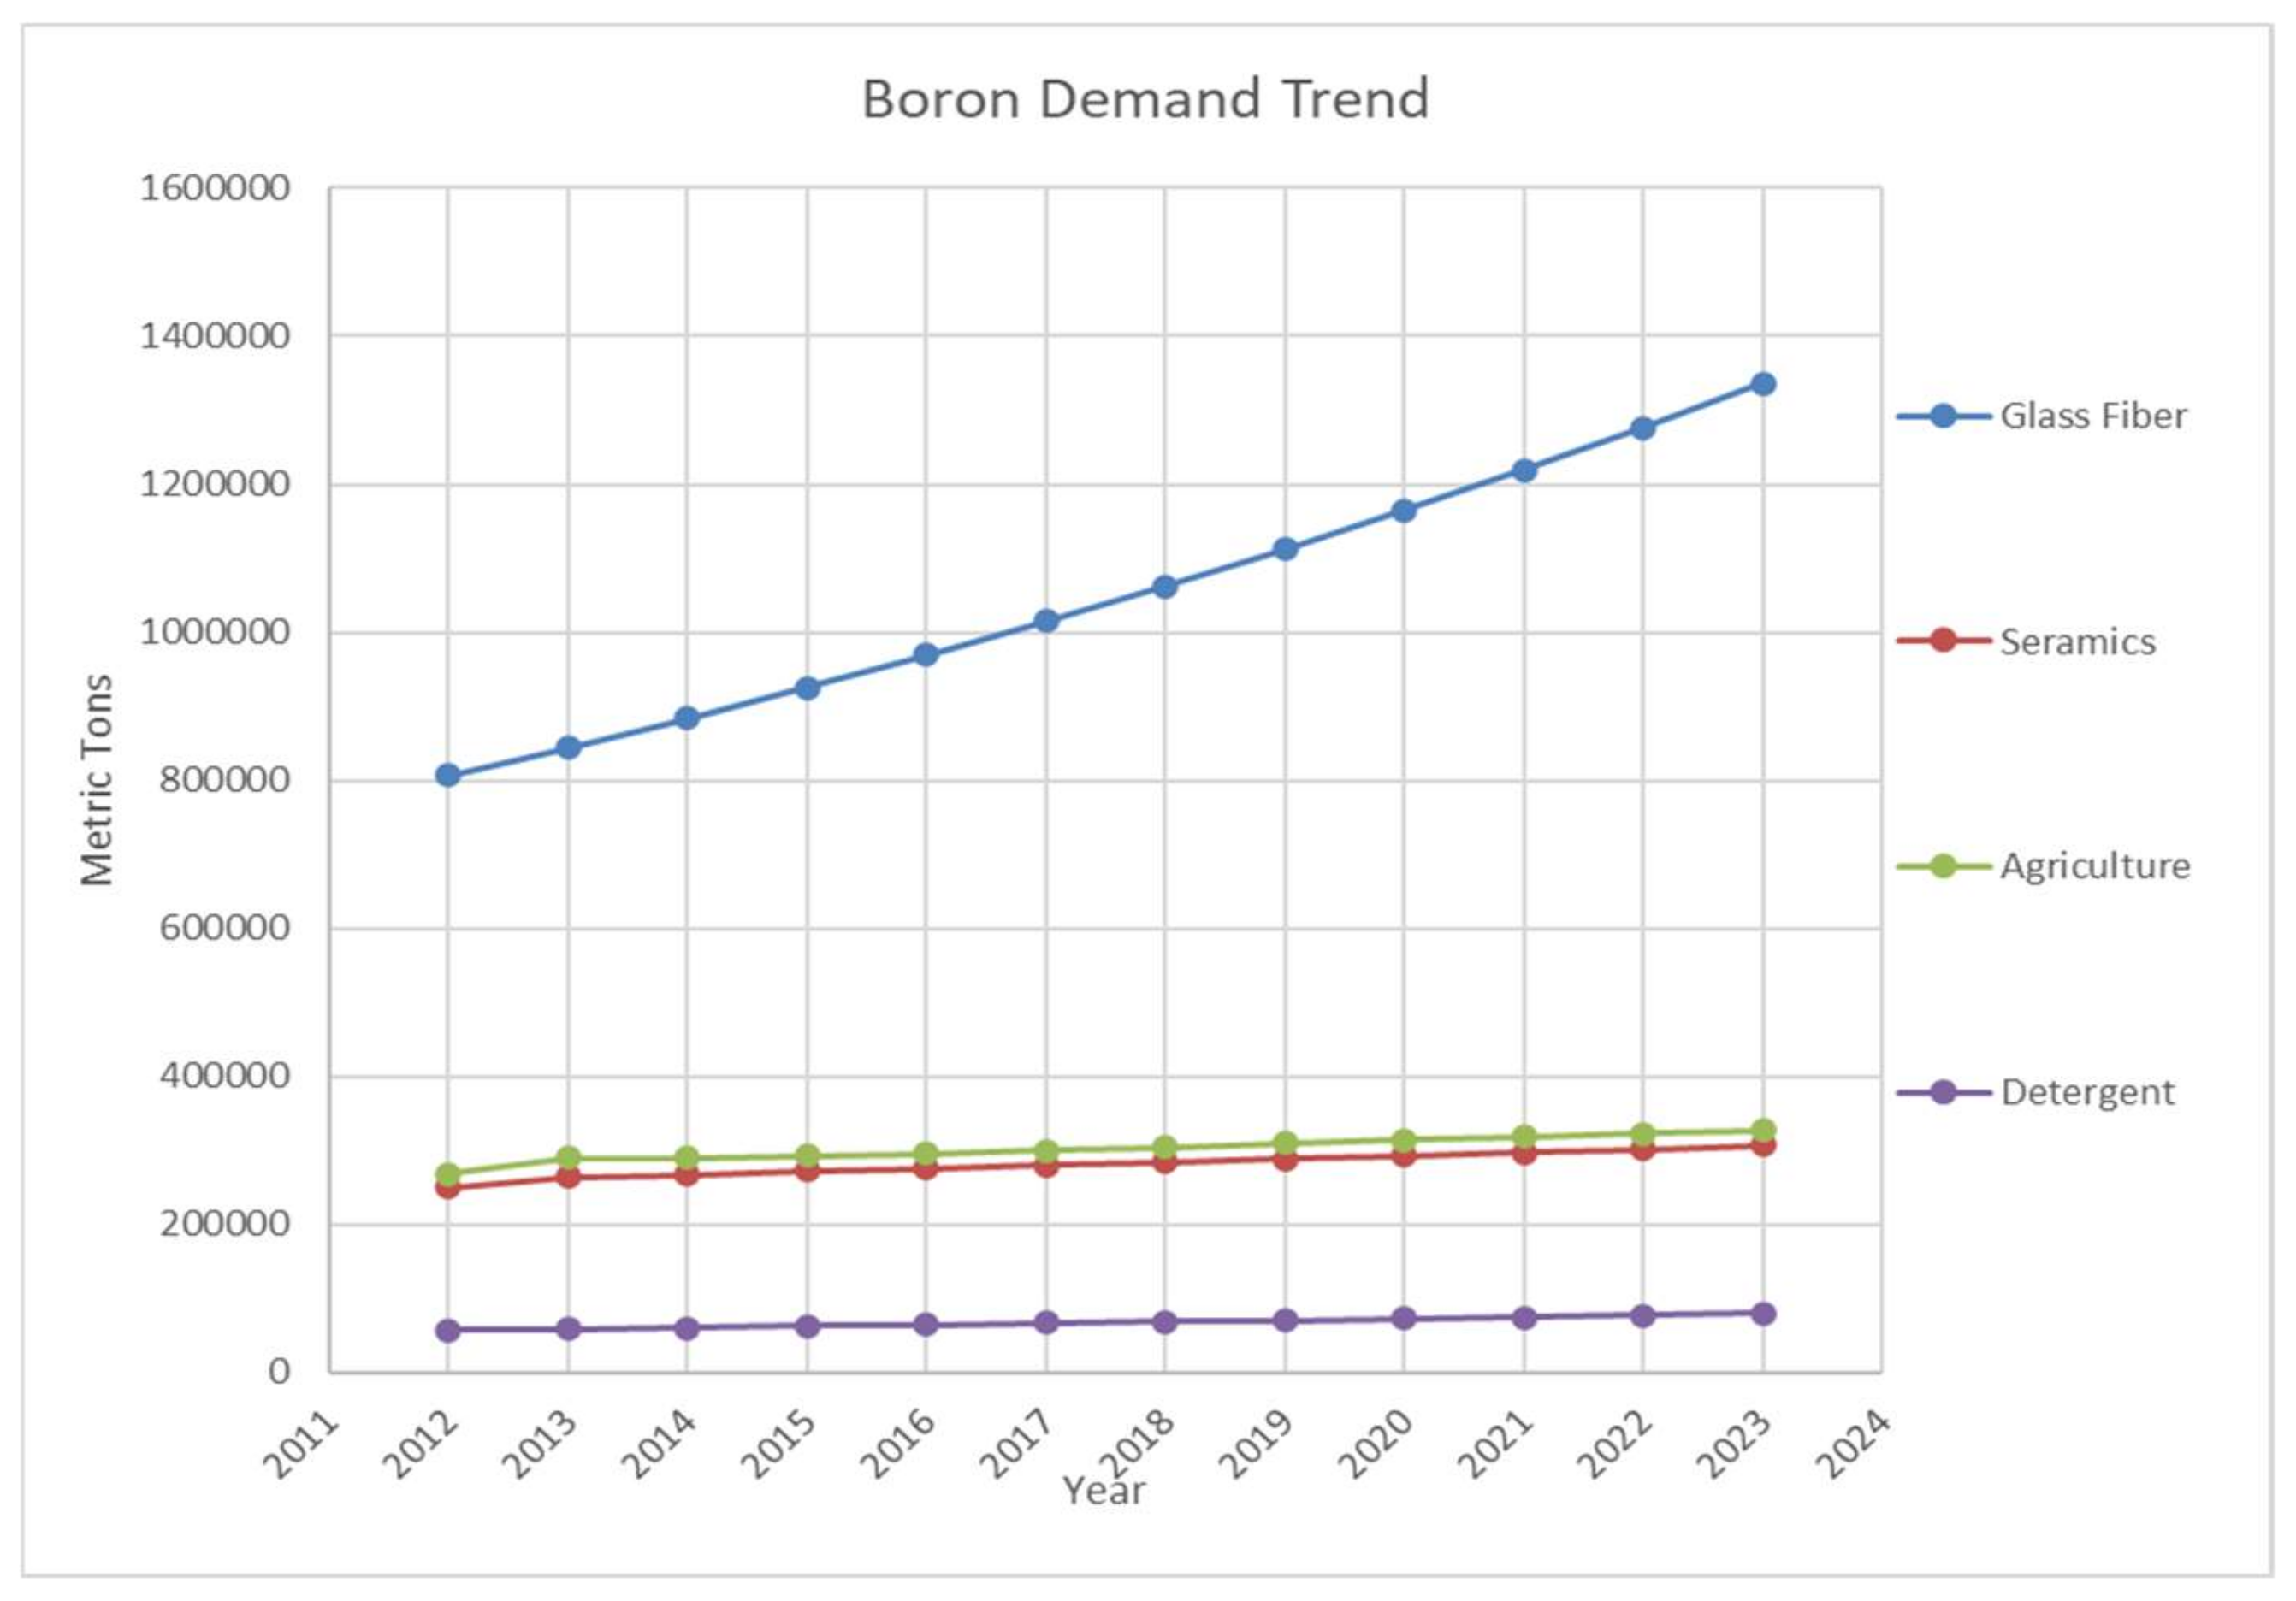
1.2. Supply Chain and Applications of Boron
1.3. Challenges
2. Materials and Methods
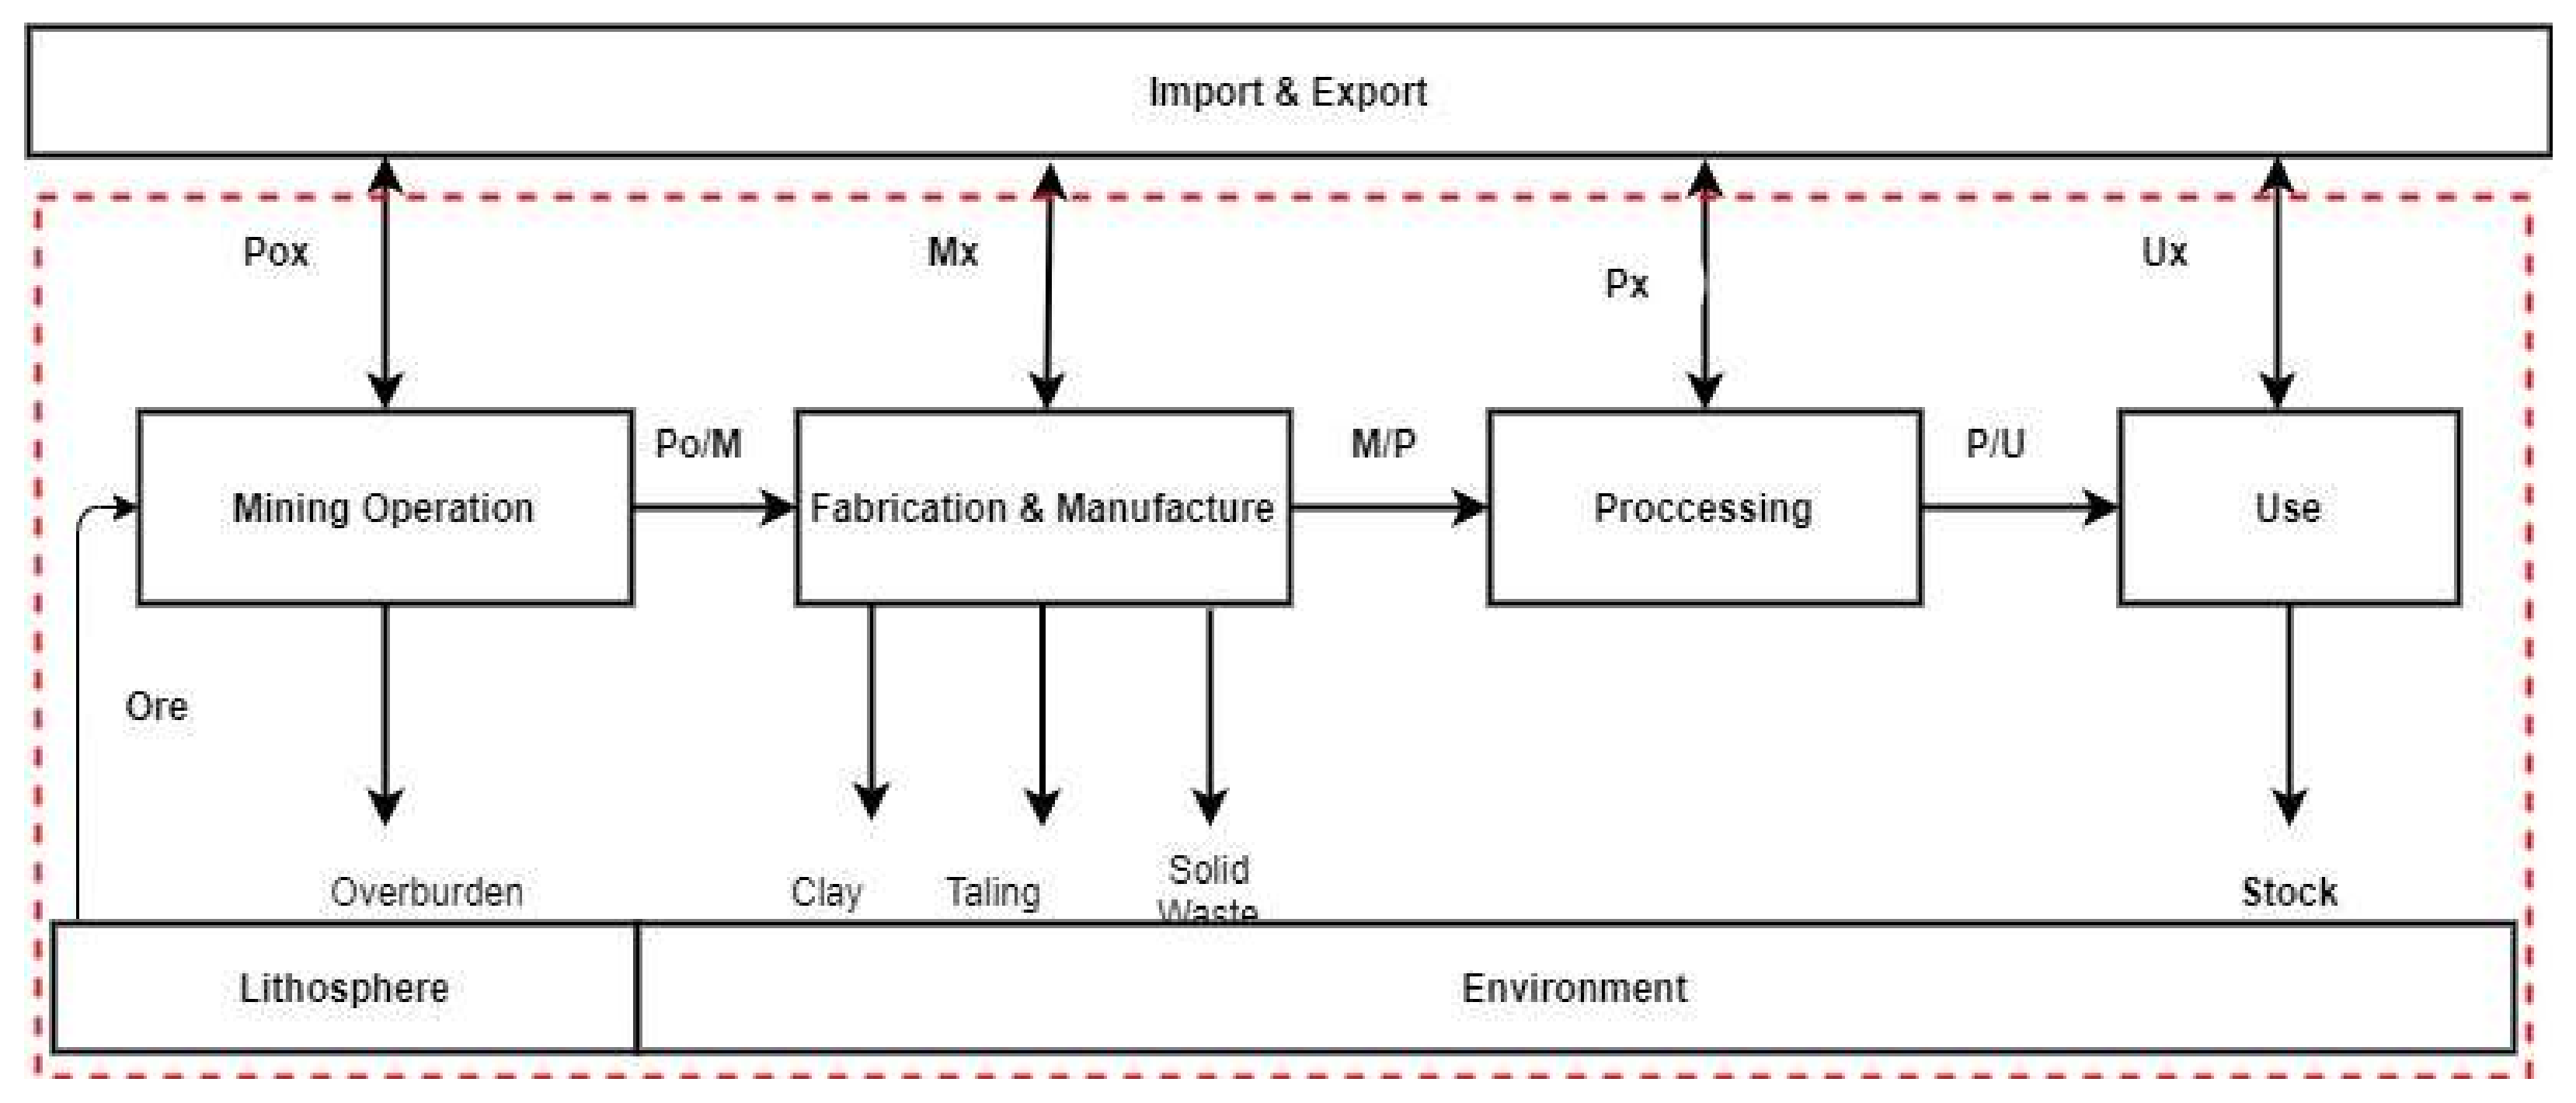
2.1. Materials Flow Analysis
2.2. Scope of the Data Collection
- (1)
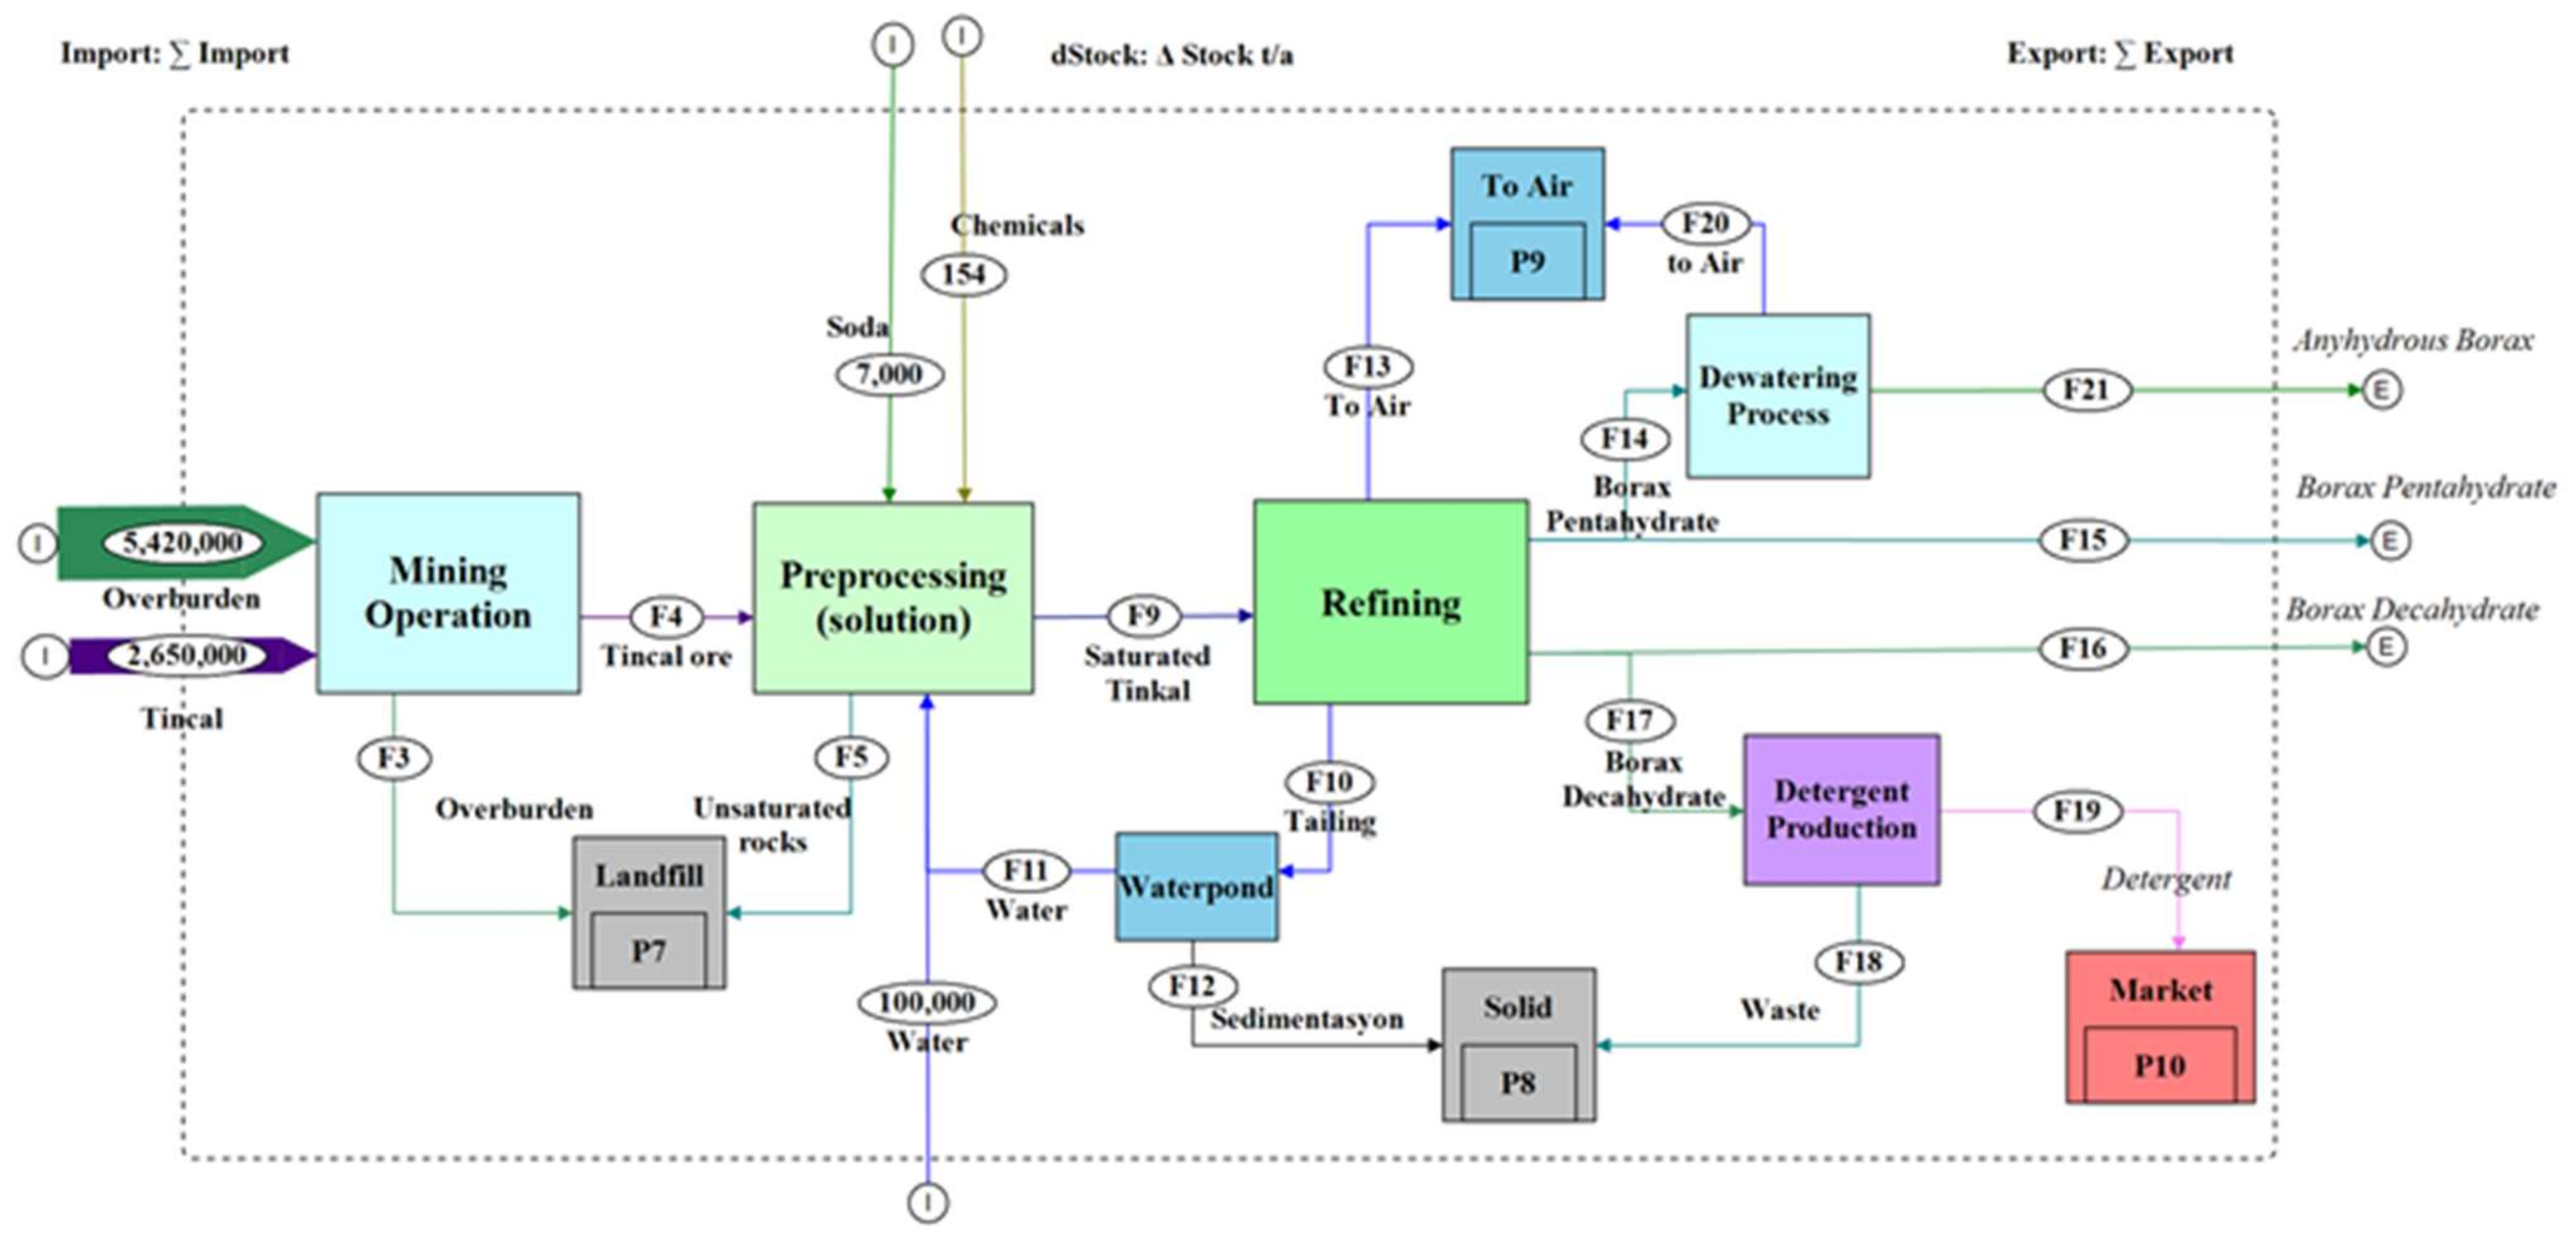
- The Mining: Mining is the process of extracting boron ore from the ground. Boron minerals are extracted by means of open-cut operations. Along with the minerals, a significant amount of overburden is also extracted.
- (2)
- The Mineral Processing: The run of the mine is crushed and cleaned in order to remove non-boron materials before refining. For borax (tincal) minerals, this step is only crushing. For other minerals, this step includes crushing and removing non-boron minerals in order to have enriched boron minerals, known as concentrate.
- (3)
- The Refining: At this stage, different refined boron products are produced, employing different processes such as dissolving, crystallizing, filtering, drying.
- (4)
2.3. Data Collection
3. Results
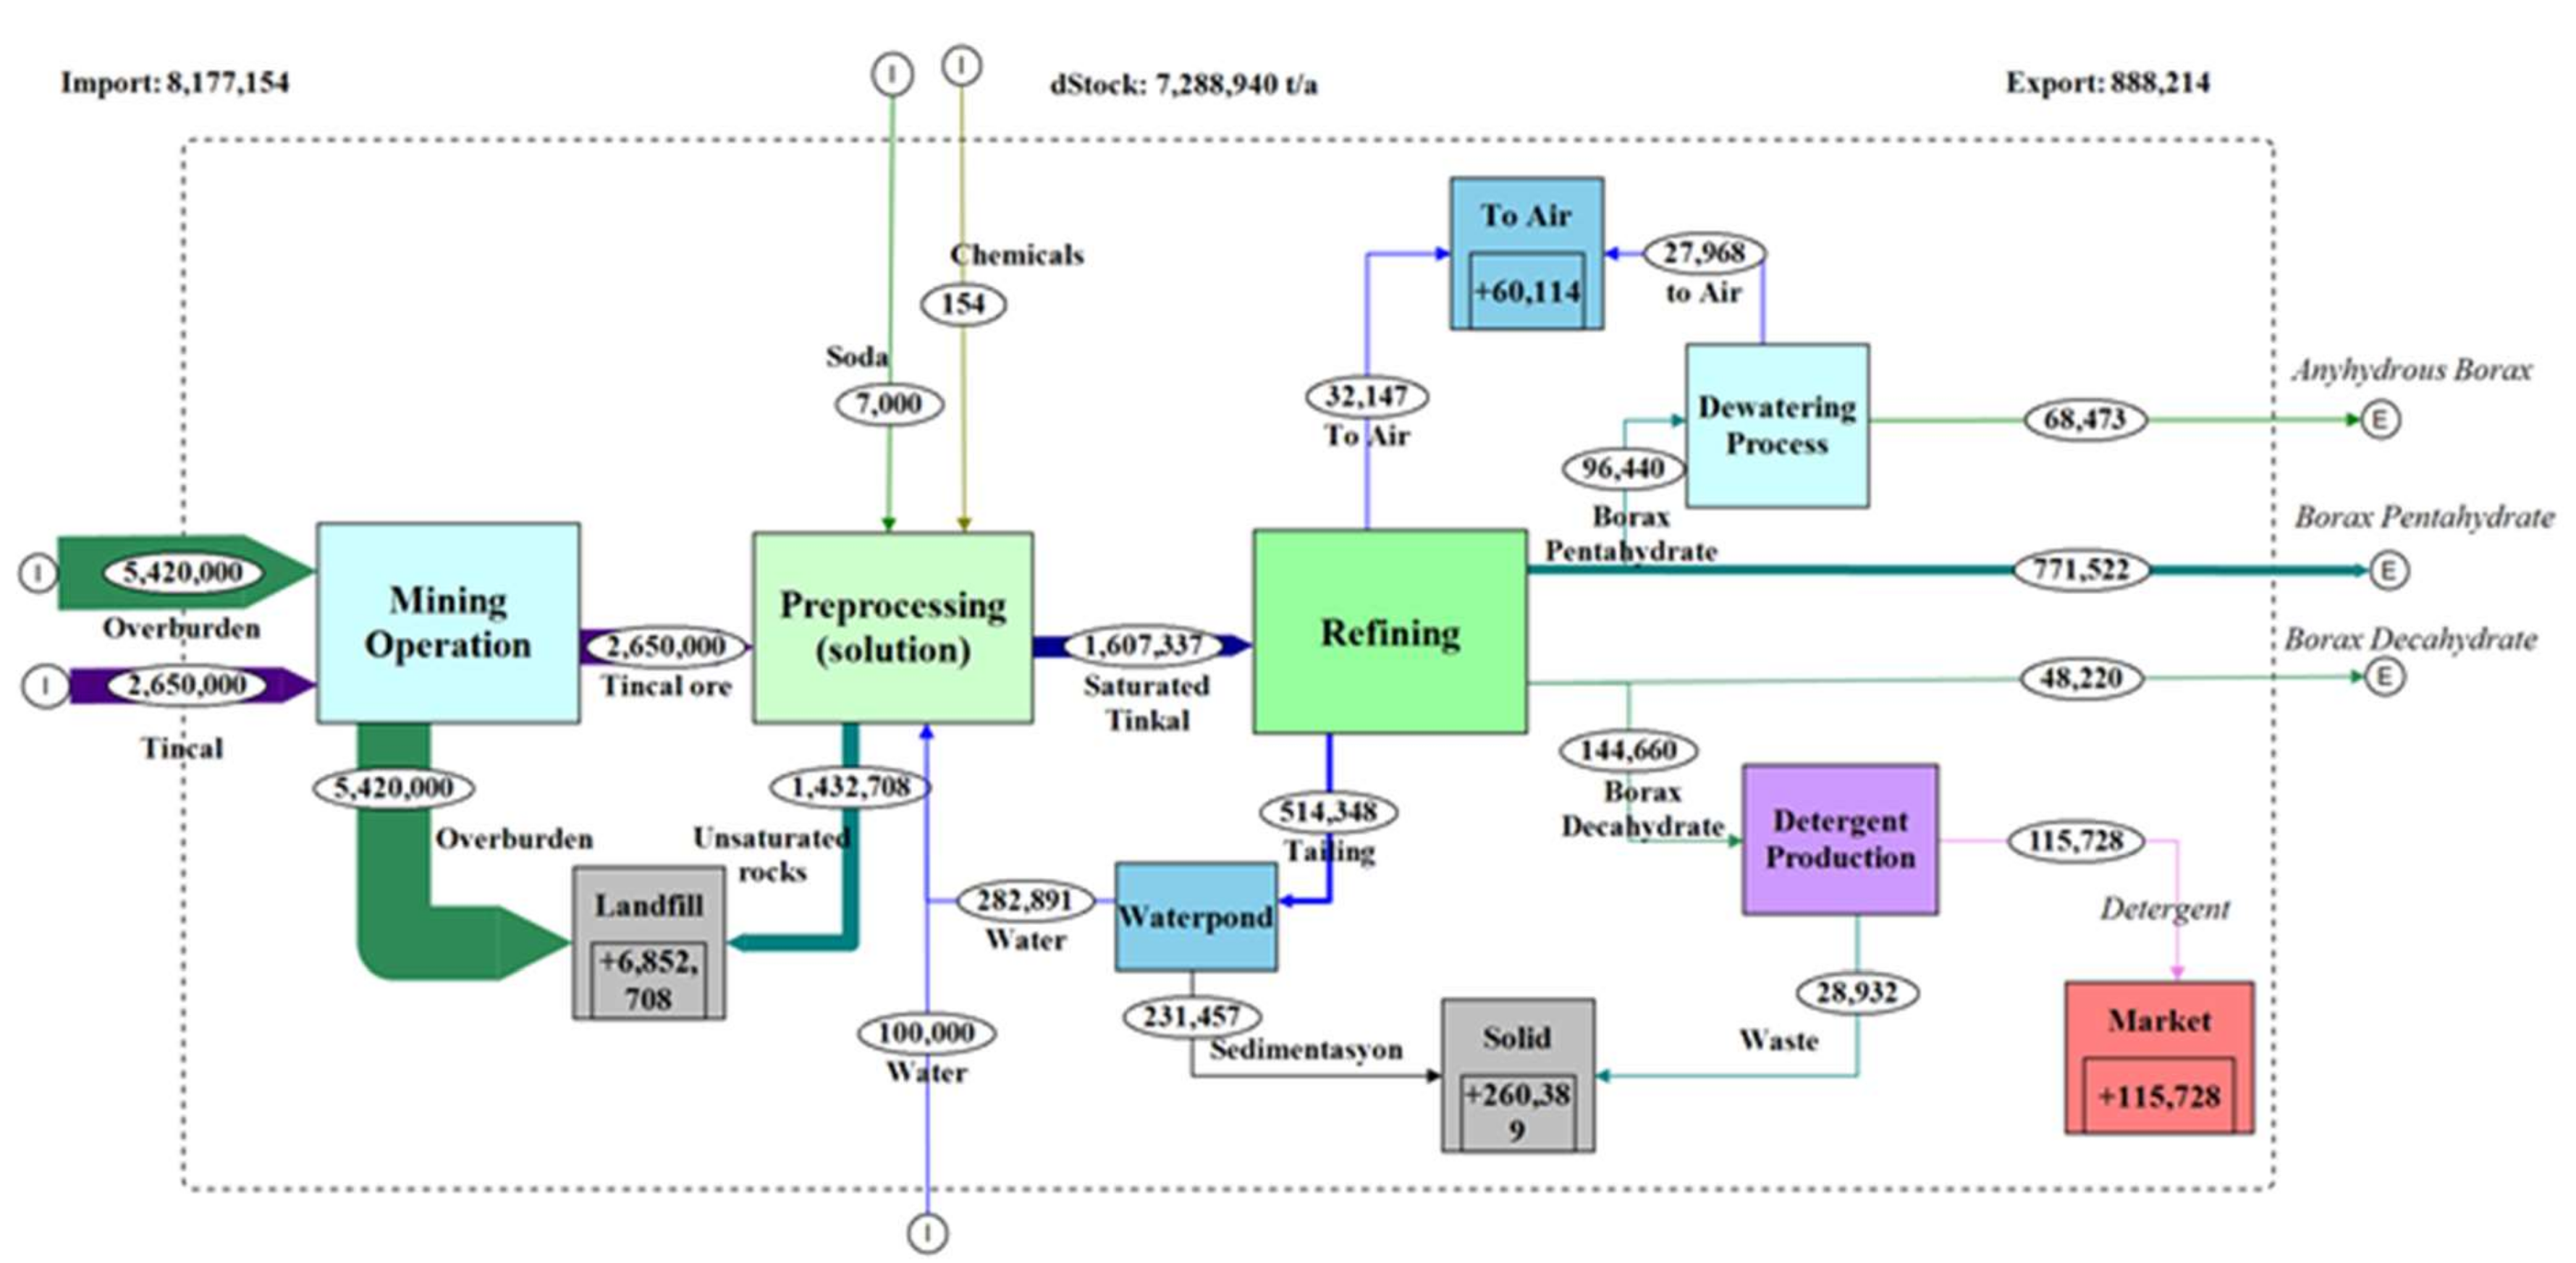
3.1. MFA for Tincal
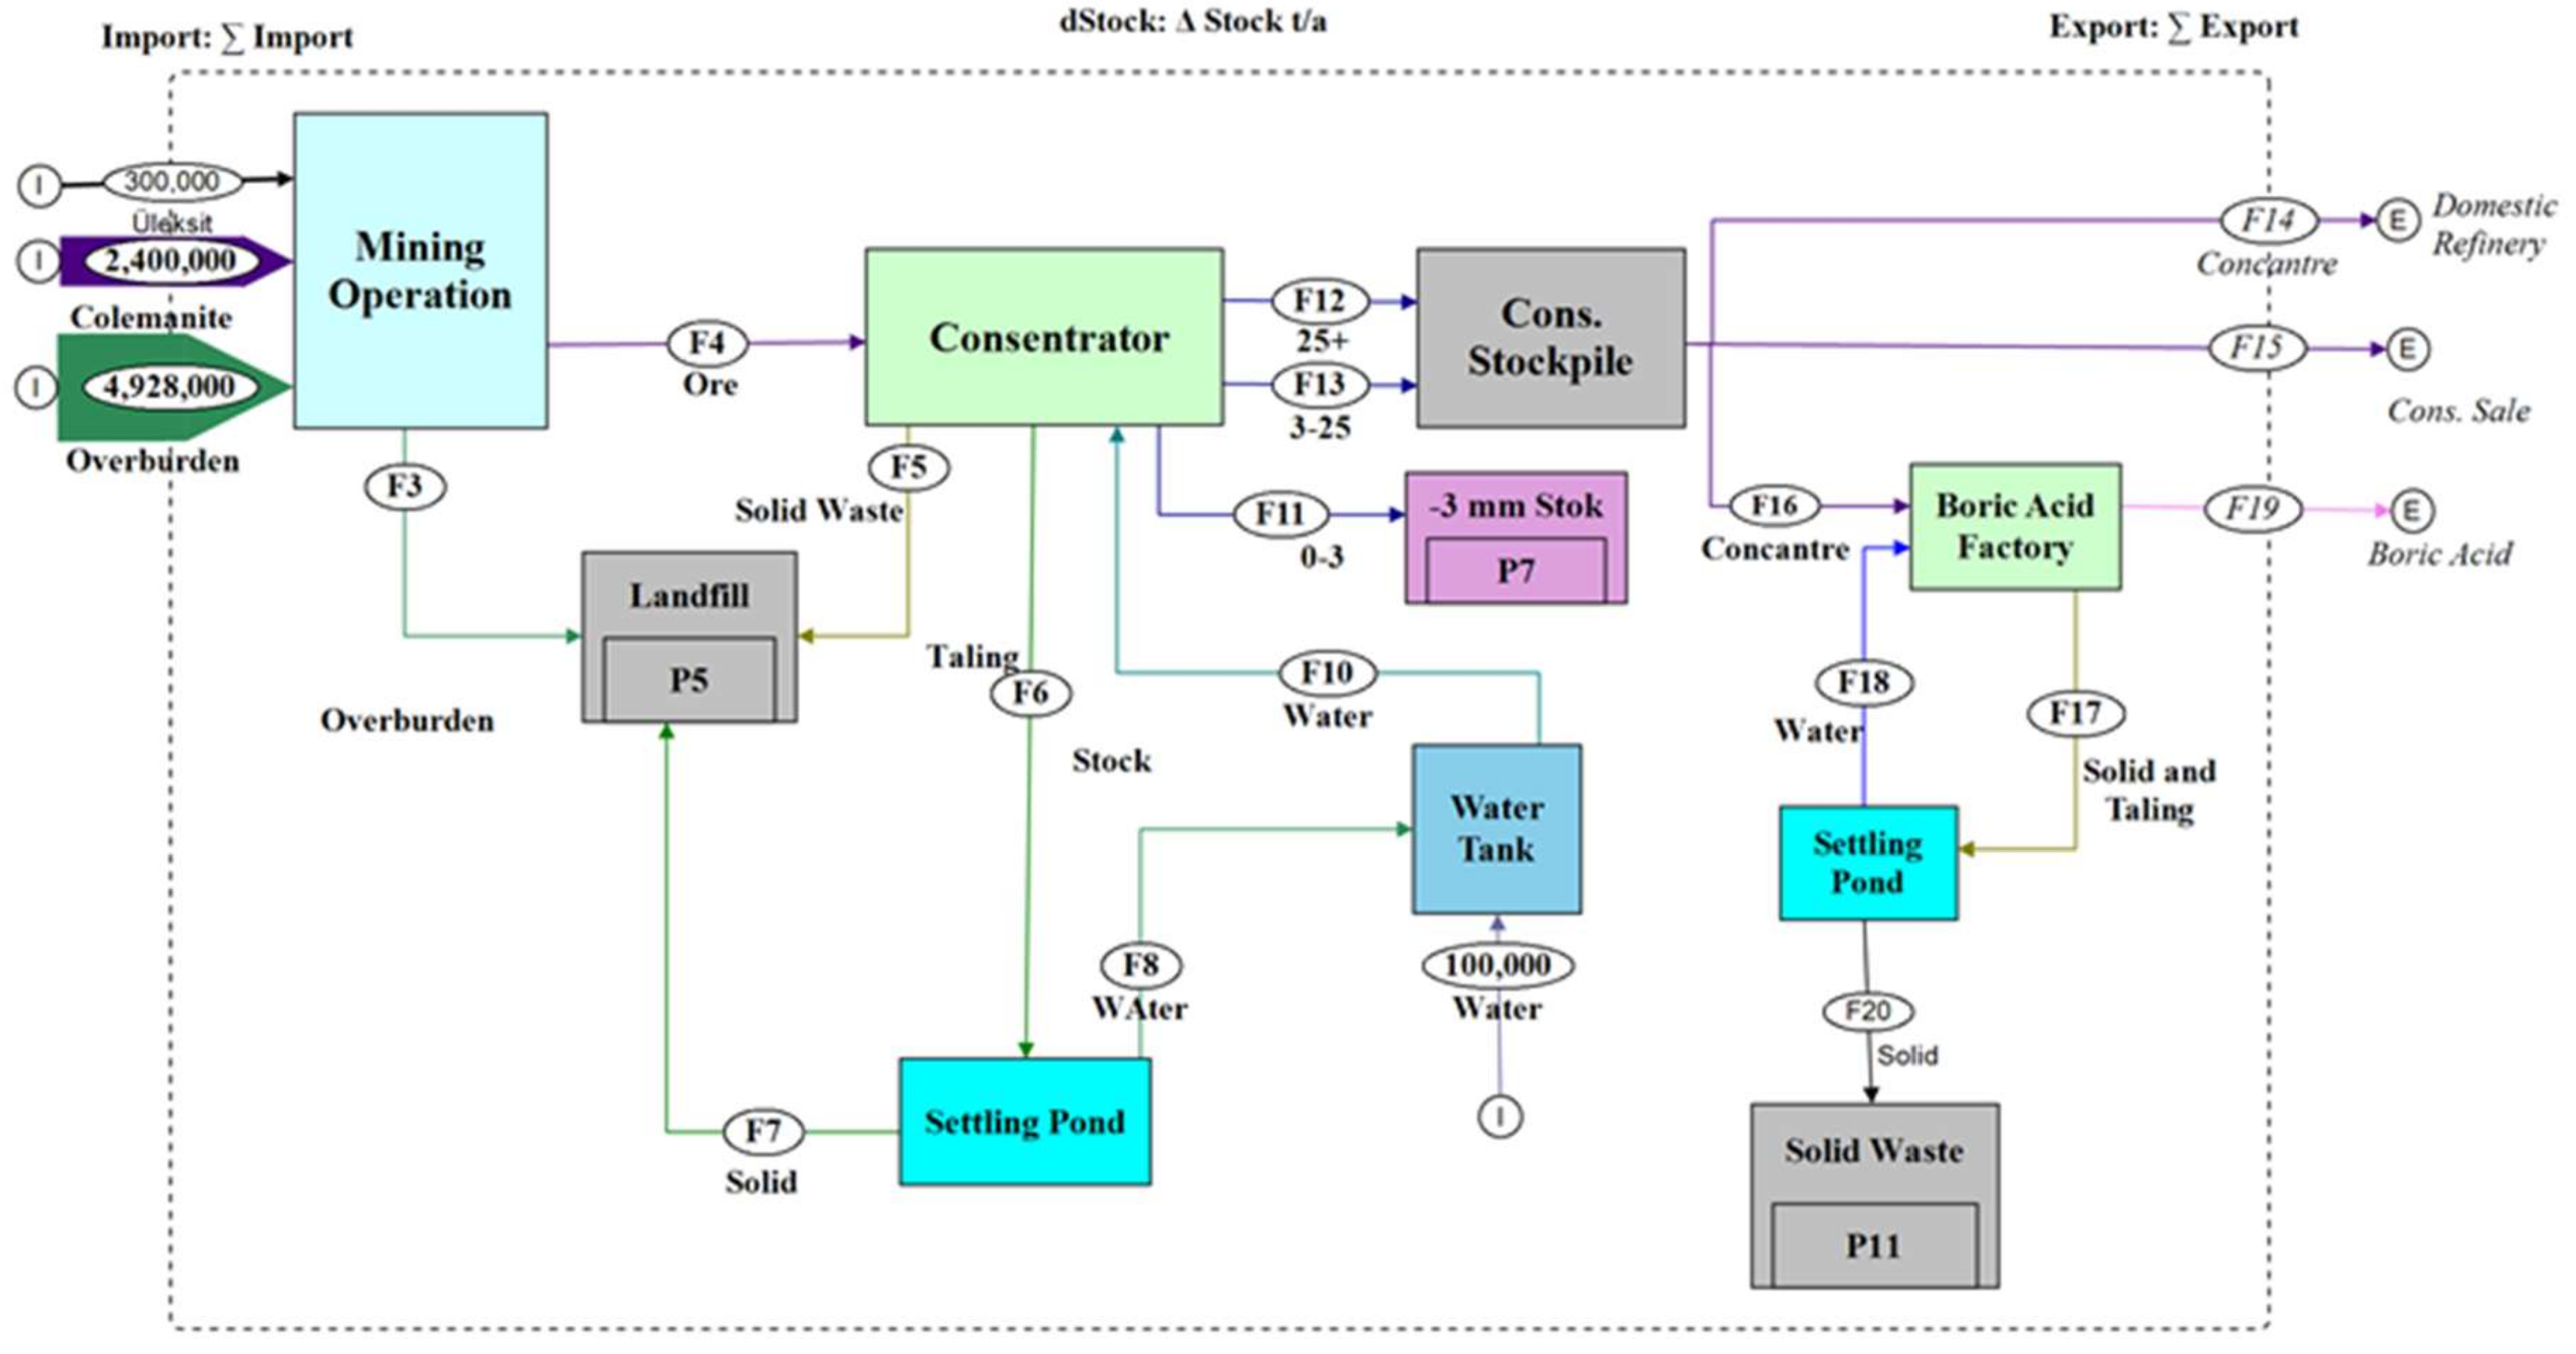
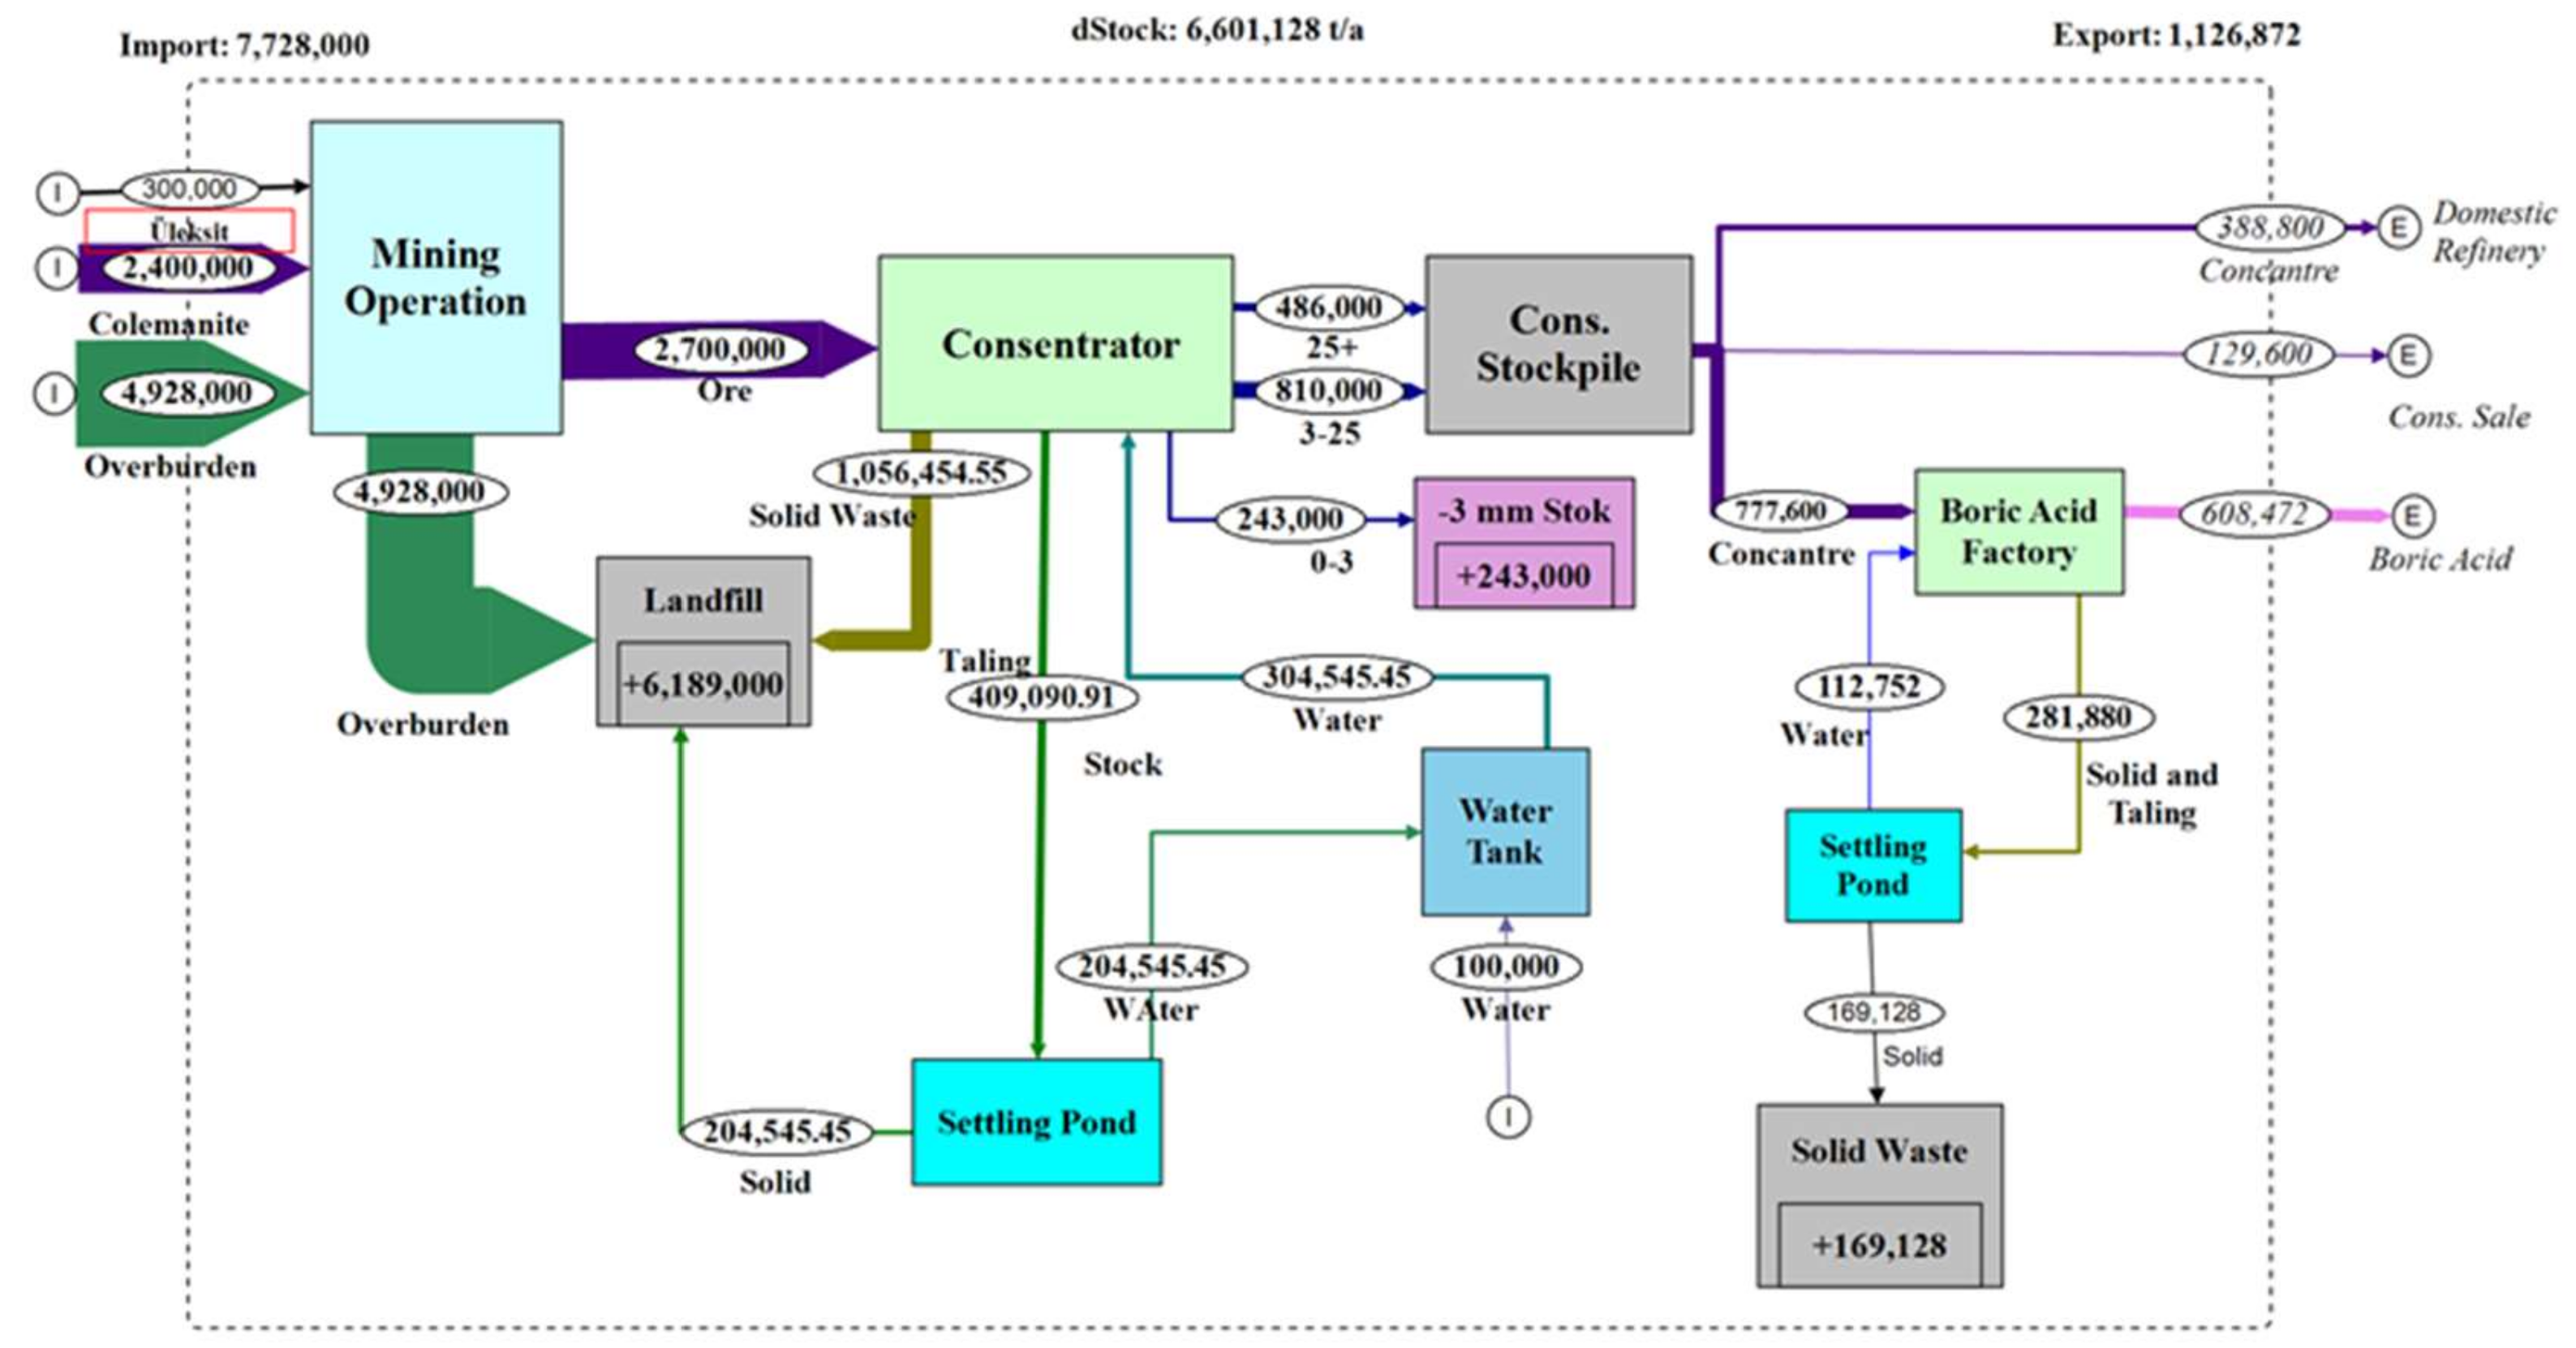
3.2. MFA for Colemanite
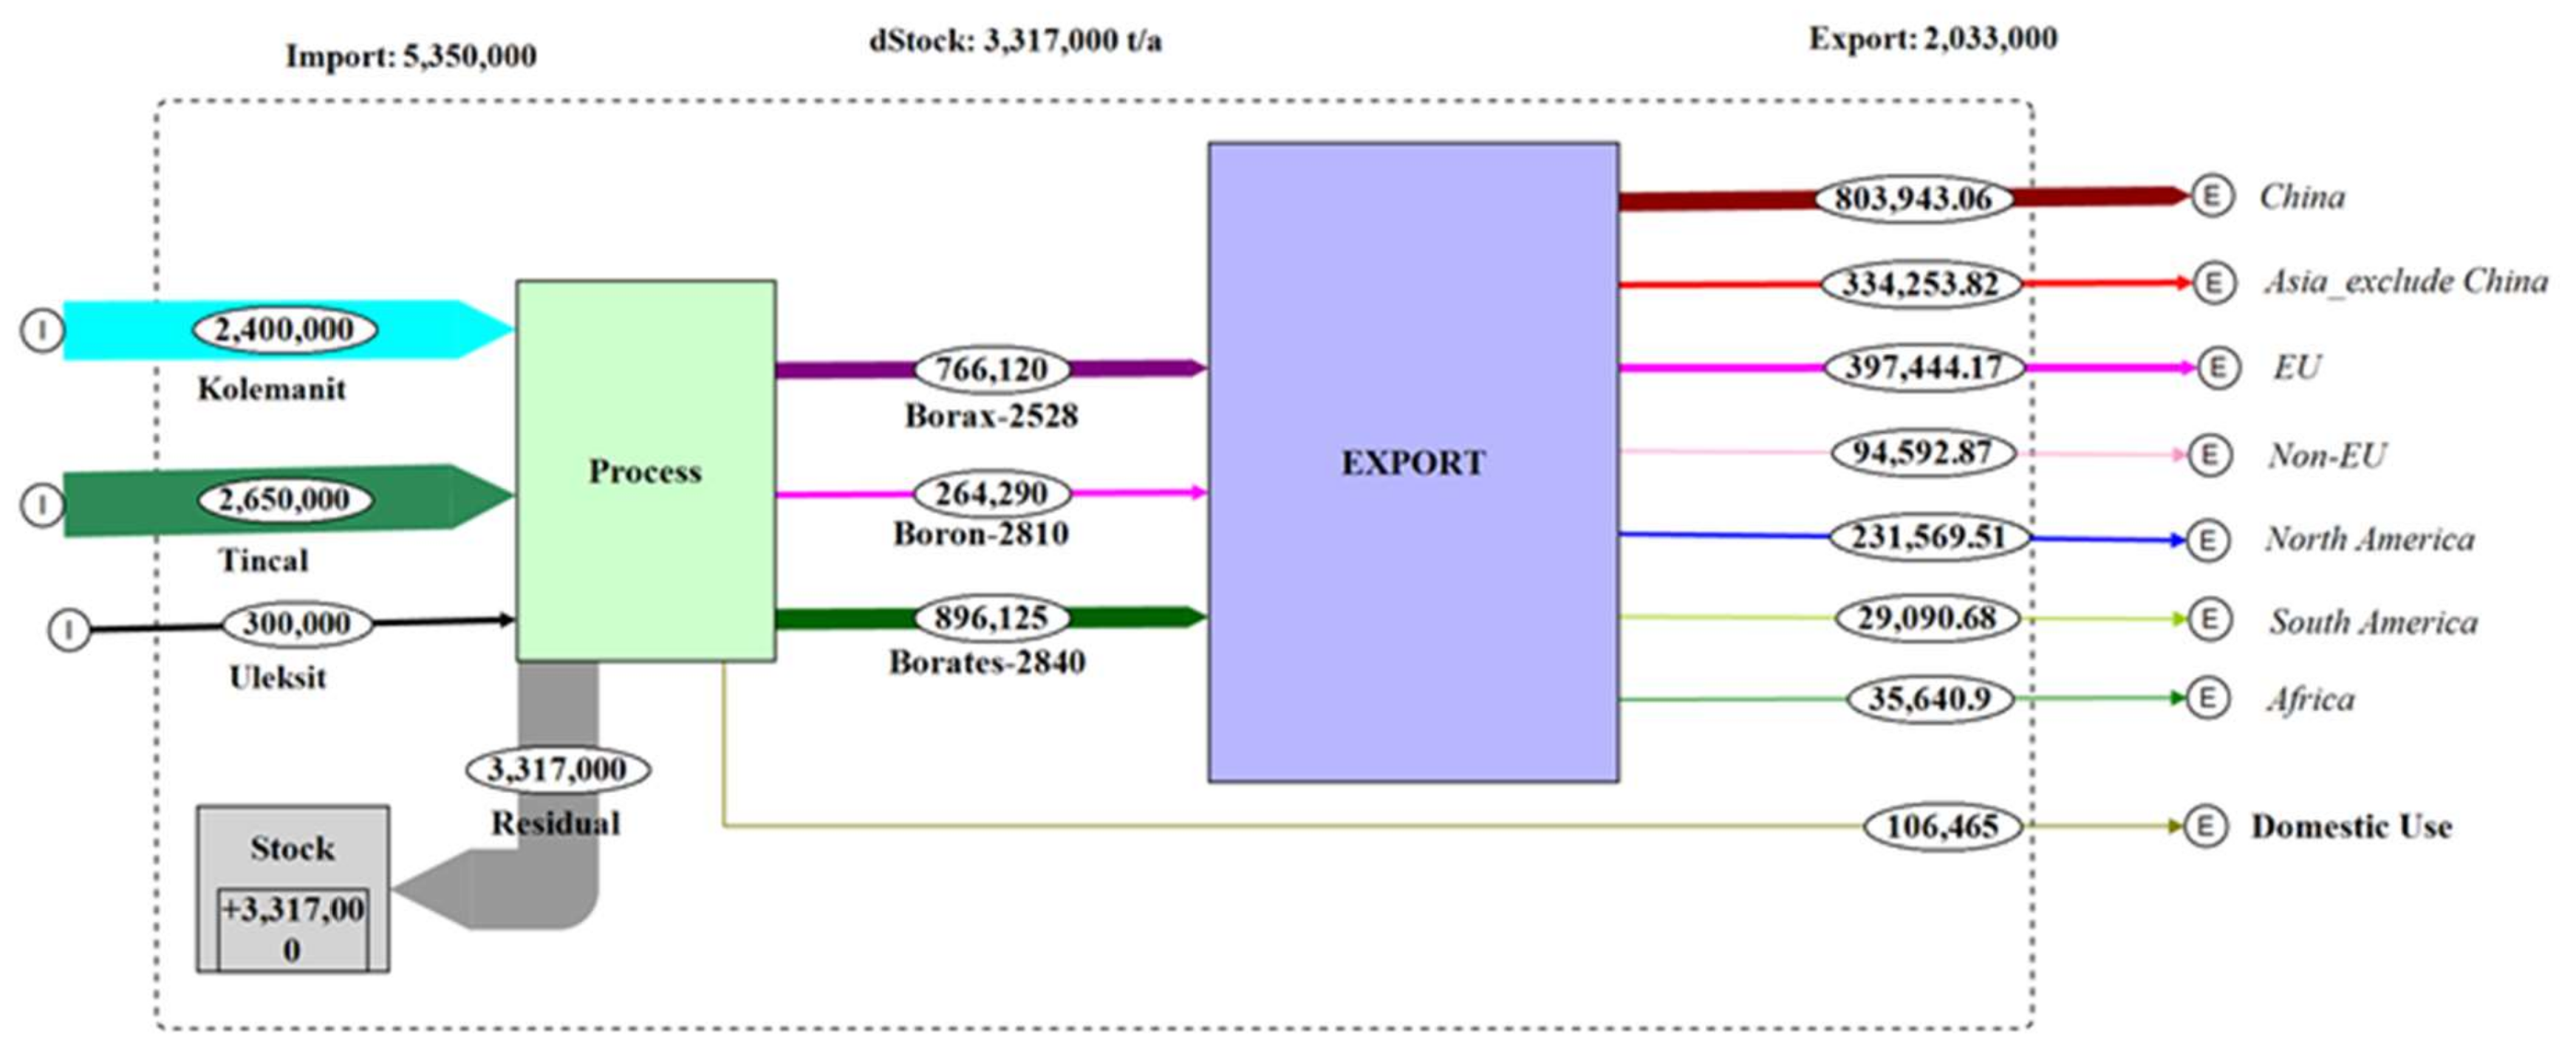
3.3. Global MFA of Boron from Turkey
4. Discussion and Conclusions
Supplementary Materials
Author Contributions
Funding
Acknowledgments
Conflicts of Interest
References
- European Commission. Critical Raw Materials Resilience: Charting a Path towards Greater Security and Sustainability. 2020. Available online: https://ec.europa.eu/docsroom/documents/42849 (accessed on 27 April 2021).
- Helvaci, C. Borate deposits: An overview and future forecast with regard to mineral deposits. J. Boron 2017, 2, 59–70. [Google Scholar]
- Diemer, A.; Nedelciu, E.; Schellens, M.; Gisladottir, J. Challenges for Sustainability in Critical Raw Material Assessments. Int. J. Manag. Sustain. 2018, 7, 156–179. [Google Scholar] [CrossRef] [Green Version]
- Jin, Y.; Kim, J.; Guillaume, B. Review of critical material studies. Resour. Conserv. Recycl. 2016, 113, 77–87. [Google Scholar] [CrossRef]
- Henckens, M.L.C.M.; Driessen, P.P.J.; Worrell, E. Metal scarcity and sustainability, analyzing the necessity to reduce the extraction of scarce metals. Resour. Conserv. Recycl. 2014, 93, 1–8. [Google Scholar] [CrossRef]
- Helvaci, C. Türkiye Borat Yatakları Jeolojik Konumu, Ekonomik Önemi ve Bor Politikası. Balıkesir Üniv. Fen Bilim. Enst. Derg. 2003, 5, 4–41. [Google Scholar]
- Mermer, C.; Şengül, H. Addressing potential resource scarcity for boron mineral: A system dynamics perspective. J. Clean. Prod. 2020, 270, 122192. [Google Scholar] [CrossRef]
- USGS. Minerals Yearbook: Boron. 2017. Available online: https://prd-wret.s3-us-west-2.amazonaws.com/assets/palladium/production/atoms/files/myb1-2017-boron.pdf (accessed on 27 April 2021).
- Henckens, M.L.C.M.; Driessen, P.P.J.; Worrell, E. Towards a sustainable use of primary boron. Approach to a sustainable use of primary resources. Resour. Conserv. Recycl. 2015, 103, 9–18. [Google Scholar] [CrossRef]
- Trade Atlas. What is HS Code? Available online: https://www.tradeatlas.com/en/page/what-is-hs-code-find-hs-code-search-hs-code (accessed on 20 March 2021).
- ETI Maden. Bor Sektör Raporu. 2020. Available online: https://www.etimaden.gov.tr/storage/2021/Bor_Sektor_Raporu_2020.pdf (accessed on 27 April 2021). (In Turkish)
- Bertram, M.; Martchek, K.J.; Rombach, G. Material Flow Analysis in the Aluminum Industry. J. Ind. Ecol. 2009, 13, 650–654. [Google Scholar] [CrossRef]
- Kaufman, S.M. Quantifying sustainability: Industrial ecology, materials flow and life cycle analysis. In Metropolitan Sustainability; Elsevier: Amsterdam, The Netherlands, 2012; pp. 40–54. [Google Scholar] [CrossRef]
- Shahbudin, N.R.; Kamal, N.A. Establishment of material flow analysis (MFA) for heavy metals in a wastewater system. Ain Shams Eng. J. 2021, 12, 1407–1418. [Google Scholar] [CrossRef]
- Yoshimura, A.; Matsuno, Y. Dynamic Material Flow Analysis and Forecast of Copper in Global-Scale: Considering the Difference of Recovery Potential between Copper and Copper Alloy. Mater. Trans. 2018, 59, 989–998. [Google Scholar] [CrossRef] [Green Version]
- Vienna University of Technology. STAN (Short for SubSTance Flow ANalysis); Institute for Water Quality, Resource and Waste Management, Vienna University of Technology: Vienna, Austria, 2012. [Google Scholar]
- Brunner, P.H.; Rechberger, H. Practical Handbook of Material Flow Analysis; Advanced Methods in Resource and Waste Management; CRC/Lewis: Boca Raton, FL, USA, 2004. [Google Scholar]
- Gsodam, P.; Lassnig, M.; Kreuzeder, A.; Mrotzek, M. The Austrian silver cycle: A material flow analysis. Resour. Conserv. Recycl. 2014, 88, 76–84. [Google Scholar] [CrossRef]
- Web1. 2021. Available online: https://oec.world/en/visualize/tree_map/hs92/export/tur/all/62840/ (accessed on 2 December 2021).
- Web2. 2021. Available online: https://trendeconomy.com/data/h2?commodity=2 (accessed on 2 December 2021).
- Web3. 2021. Available online: https://www.statista.com/search/?q=boron&Search=&qKat=search (accessed on 2 December 2021).
- The Observatory of Economic Complexity. Where Does Turkey Export Borax to? 2019. Available online: https://oec.world/en/visualize/tree_map/hs92/export/tur/all/52528/2019/ (accessed on 5 April 2021).
- Charpentier Poncelet, A.; Helbig, C.; Loubet, P.; Beylot, A.; Muller, S.; Villeneuve, J.; Laratte, B.; Thorenz, A.; Tuma, A.; Sonnemann, G. Life cycle impact assessment methods for estimating the impacts of dissipative flows of metals. J. Ind. Ecol. 2021, 25, 1177–1193. [Google Scholar] [CrossRef]
- Charpentier Poncelet, A.; Loubet, P.; Laratte, B.; Muller, S.; Villeneuve, J.; Sonnemann, G. A necessary step forward for proper non-energetic abiotic resource use consideration in life cycle assessment: The functional dissipation approach using dynamic material flow analysis data. Resour. Conserv. Recycl. 2019, 151, 104449. [Google Scholar] [CrossRef] [Green Version]
- Berger, M.; Sonderegger, T.; Alvarenga, R.; Bach, V.; Cimprich, A.; Dewulf, J.; Frischknecht, R.; Guinée, J.; Helbig, C.; Huppertz, T.; et al. Mineral resources in life cycle impact assessment: Part II—Recommendations on application-dependent use of existing methods and on futuremethod development needs. Int. J. Life Cycle Assess. 2020, 25, 798–813. [Google Scholar] [CrossRef] [Green Version]
- Joint Research Centre, European Commission. Feasibility Study to Implement Resource Dissipation in LCA; Publications Office of the European Union: Luxembourg, 2017. [Google Scholar]
- Santillán-Saldivar, J.; Cimprich, A.; Shaikh, N.; Laratte, B.; Young, S.B.; Sonnemann, G. How recycling mitigates supply risks of critical raw materials: Extension of the geopolitical supply risk methodology applied to information and communication technologies in the European Union. Resour. Conserv. Recycl. 2021, 164, 105108. [Google Scholar] [CrossRef]
- Helbig, C.; Wietschel, L.; Thorenz, A.; Tuma, A. How to evaluate raw material vulnerability—An overview. Resour. Policy 2016, 48, 13–24. [Google Scholar] [CrossRef]
- Helbig, C.; Thorenz, A.; Tuma, A. Quantitative assessment of dissipative losses of 18 metals. Resour. Conserv. Recycl. 2020, 153, 104537. [Google Scholar] [CrossRef]
- Van Oers, L.F.C.M.; Guinée, J. The Abiotic Depletion Potential: Background, Updates, and Future. Resources 2016, 5, 16. [Google Scholar] [CrossRef]
- Panasiuk, D.; Laratte, B.; Remy, S. Steel Stock Analysis in Europe from 1945 to 2013. In Proceedings of the 23rd CIRP Conference on Life Cycle Engineering, Procedia CIRP 48, Berlin, Germany, 22–24 May 2016; pp. 348–351. [Google Scholar] [CrossRef] [Green Version]
- Celik, H. Recycling of Boron Waste to Develop Ceramic Wall Tile in Turkey. Trans. Indian Ceram. Soc. 2015, 74, 108–116. [Google Scholar] [CrossRef]
- Olgun, A.; Erdogan, Y.; Ayhan, Y.; Zeybek, B. Development of ceramic tiles from coal fly ash and tincal ore waste. Ceram. Int. 2005, 31, 153–158. [Google Scholar] [CrossRef]


| Name | Description |
|---|---|
| Ore | Boron in ore |
| Po | Production life stage |
| M | Fabrication & manufacturing life stage |
| P | Processing life stage |
| U | In-use life stage |
| Pox, Mx, Px, Ux | Respective export and import |
| Export Values (×1000, 1000 USD, 2019) | ||||||||||
| Ratio | World | China | Asia-Ex. China | EU | Nom EU | N. America | S. America | Africa | Other | |
| Borax-2528 | 33.34% | 256.80 | 112.42704 | 50.17296 | 48.97775121 | 8.228352 | 27.00 | 3.19 | 5.458 | 1.325 |
| Boron-2810 | 14.04% | 108.14 | 36.291784 | 24.408216 | 26.1146351 | 4.65954176 | 8.126 | 2.742 | 4.364 | 1.43 |
| Borates-2840 | 52.63% | 405.40 | 168.88964 | 57.51036 | 86.23056 | 21.0998528 | 58.40 | 6.172 | 4.52 | 2.58 |
| TOTAL | 100.00% | 1770.34 | 317.608464 | 132.091536 | 161.322707 | 33.9877466 | 93.526 | 12.104 | 14.342 | 5.40 |
| Estimated Export Amount (Ton, 2019) | ||||||||||
| Price ($/tom) | World | China | Asia-Ex. China | EU | Nom EU | N. America | S. America | Africa | Other | |
| Borax-2528 | 310 | 828,387 | 362,668 | 161,848 | 157,992 | 26,543 | 87,097 | 10,290 | 17,606 | 4342 |
| Boron-2810 | 540 | 200,259 | 67,207 | 45,200 | 48,360 | 8629 | 15,048 | 5078 | 8081 | 2655 |
| Borates-2840 | 450 | 900,889 | 375,310 | 127,801 | 191,623 | 46,889 | 129,778 | 13,716 | 10,044 | 5728 |
| TOTAL | 1,929,535 | 805,185 | 334,849 | 397,976 | 82,060 | 231,923 | 29,084 | 35,732 | 12,726 | |
| Share | 41.73% | 17.35% | 20.63% | 4.25% | 12.02% | 1.51% | 1.85% | 0.66% | ||
Publisher’s Note: MDPI stays neutral with regard to jurisdictional claims in published maps and institutional affiliations. |
© 2022 by the authors. Licensee MDPI, Basel, Switzerland. This article is an open access article distributed under the terms and conditions of the Creative Commons Attribution (CC BY) license (https://creativecommons.org/licenses/by/4.0/).
Share and Cite
Elevli, B.; Yaman, İ.; Laratte, B. Estimation of the Turkish Boron Exportation to Europe. Mining 2022, 2, 155-169. https://doi.org/10.3390/mining2020009
Elevli B, Yaman İ, Laratte B. Estimation of the Turkish Boron Exportation to Europe. Mining. 2022; 2(2):155-169. https://doi.org/10.3390/mining2020009
Chicago/Turabian StyleElevli, Birol, İrem Yaman, and Bertrand Laratte. 2022. "Estimation of the Turkish Boron Exportation to Europe" Mining 2, no. 2: 155-169. https://doi.org/10.3390/mining2020009
APA StyleElevli, B., Yaman, İ., & Laratte, B. (2022). Estimation of the Turkish Boron Exportation to Europe. Mining, 2(2), 155-169. https://doi.org/10.3390/mining2020009