Article

Validation of a Saliency Map for Assessing Image Quality in Nuclear Medicine: Experimental Study Outcomes

1
Department of Radiation Science, Hirosaki University, Hirosaki 036-8564, Japan
2
Department of Radiological Sciences, Tokyo Metropolitan University, Tokyo 116-8551, Japan
3
Department of Radiology Technology, Iwate Prefectural Ofunato Hospital, Ofunato 022-0002, Japan
4
Department of Radiology, Division of Medical Technology, Hirosaki University Hospital, Hirosaki 036-8563, Japan
5
Department of Radiological Technology, Tsukuba International University, Tsuchiura 300-0051, Japan
*
Author to whom correspondence should be addressed.
Radiation 2022, 2(3), 248-258; https://doi.org/10.3390/radiation2030018
Submission received: 14 March 2022 / Revised: 23 June 2022 / Accepted: 28 June 2022 / Published: 1 July 2022
(This article belongs to the Special Issue Radiation in the Human Life—Environment and Medical Use)

Abstract

:

Simple Summary

Since modern positron-emission tomography images are reconstructed with many nonlinear corrections, there is a need for a comprehensive evaluation method based on human vision instead of the conventional method using the count number. Image quality evaluation metrics related to human vision have been actively studied in the field of natural imaging, but there have been few reports in the field of nuclear medicine. This study’s aim was to verify the appropriateness of an image quality assessment using a saliency map by comparing it with the gaze data obtained during evaluation. We calculated the Pearson’s correlation coefficient between the gaze data and the saliency map. The correlation between the two was high, indicating that saliency mapping is a valid evaluation method.

Abstract

Recently, the use of saliency maps to evaluate the image quality of nuclear medicine images has been reported. However, that study only compared qualitative visual evaluations and did not perform a quantitative assessment. The study’s aim was to demonstrate the possibility of using saliency maps (calculated from intensity and flicker) to assess nuclear medicine image quality by comparison with the evaluator’s gaze data obtained from an eye-tracking device. We created 972 positron emission tomography images by changing the position of the hot sphere, imaging time, and number of iterations in the iterative reconstructions. Pearson’s correlation coefficient between the saliency map calculated from each image and the evaluator’s gaze data during image presentation was calculated. A strong correlation (r ≥ 0.94) was observed between the saliency map (intensity) and the evaluator’s gaze data. This trend was also observed in images obtained from a clinical device. For short acquisition times, the gaze to the hot sphere position was higher for images with fewer iterations during the iterative reconstruction. However, no differences in iterations were found when the acquisition time increased. Saliency by flicker could be applied to clinical images without preprocessing, although compared with the gaze image, it increased slowly.

1. Introduction

Image quality evaluation in the field of nuclear medicine is based on objective physical and subjective visual evaluations. There are advantages and disadvantages to both evaluation methods, and the information obtained from each is different. In some cases, it is impossible to obtain a high correlation between physical and visual evaluations [1], which may be because the evaluation criteria and tasks are different, and human visual characteristics are nonlinear [2]. The visual evaluation of medical image quality is important because diagnosis is based on the subjective judgment of the physician. However, since the visual evaluation depends on the evaluator, it is often hard to construct an evaluation environment to obtain accurate results. Therefore, the benefits of establishing a physical evaluation method that correlates well with the visual evaluation would be significant. Many human vision-based image quality metrics have been proposed, and saliency, which represents the ease of causing human visual attention, is one metric [3]. Although there are many applications of saliency maps in the medical field, such as lesion detection [4,5] and segmentation [6,7], there are few examples of their use for image quality evaluation in nuclear medicine, such as Hosokawa’s study [8]. Hosokawa et al. showed that image quality evaluation using saliency maps can provide an objective evaluation close to subjective assessments. However, since that was a basic study that used a rectangular phantom in which cold signals were placed, whether the same results can be obtained under clinical conditions, such as using an anthropomorphic phantom or actual device, has not been verified. Additionally, the validity of the evaluation method using the saliency map was performed by comparing it with a qualitative visual evaluation (three-point scale), and no quantitative evaluation was performed.
To obtain subconscious information that cannot be verbalized, various biometric data, such as heartbeat, sweating, and brain measurements, have been used. Gaze measurements reveal attention and interest. Therefore, comparing the gaze data with saliency mapping is commonly used for validation [9,10]. Information on potential visual attention is widely used in marketing [11], sports [12], and the diagnosis of cognitive disorders [13]. A recently reported application in the field of radiological technology is the analysis of gazing during mammography between skilled and novice users [14]. We believe that the degrees of interest shown by visual attention to the target signals in a uniform phantom from medical images reflect the image quality and do not depend on experience or knowledge.
This study’s aim was to assess the validity of using saliency maps to evaluate the image quality of positron emission tomography (PET) images obtained by imaging a phantom simulating a human body. We compared the saliency maps with the gaze data of the evaluator obtained from an eye-tracking device.

2. Materials and Methods

First, we obtained PET images obtained by a Monte Carlo simulation. We used GATE version 8.2 (OpenGATE collaboration, http://www.opengatecollaboration.org, accessed on 30 June 2022) [15] for the simulation code. The simulated PET system was the Discovery ST Elite (GE Healthcare). The imaging object was a NEMA/IEC body phantom, and one hot sphere with a diameter of 10 mm was placed in it. The hot spheres were placed in 18 patterns at different distances from the phantom center (Figure 1). The background radioactivity concentration was set to 2.65 kBq/mL, and the hot sphere was set to four times that concentration. The acquisition time ranged from 10 to 180 s. The obtained sinograms were reconstructed by the three-dimensional ordered-subset expectation maximization (3D-OSEM) method using Customizable and Advanced Software for Tomographic Reconstruction (CASToR, open-source, https://castor-project.org, accessed on 30 June 2022) version 3.0.1 [16]. For the number of OSEM updates, the subset was fixed at 20, and the iteration was set from 1 to 3. Scattering and attenuation corrections were applied, but time-of-flight or point spread function corrections were not applied. The field of view (FOV) of the reconstructed image was 320 × 320 mm, and the matrix size was 128 × 128. Gaussian filters with a full width at half maximum (FWHM) of 4 mm were applied in the axial and trans-axial directions. The imaging was limited to one bed position where the hot sphere was located at the axial center. We acquired 972 data points with a combination of an imaging time increasing every 10 s (18 patterns), the hot sphere positions (18 patterns), and the iteration number (3 patterns). Each PET dataset had 47 slice images with a thickness of 3.27 mm. We also obtained actual PET images by Discovery ST Elite (GE Healthcare, Milwaukee, WI, USA). The acquisition time was set to 18 types, ranging from 10 to 1800 s. The PET images were reconstructed by 3D-OSEM (iteration 2, subset 20). The FOV was 320 mm × 320 mm, and the matrix size was 128 × 128. Gaussian filters with a 2-mm FWHM were used.
For the physical evaluation, the percent of contrast (Q10 mm), percent of background variability (N10 mm), and the ratio of the two (Q10 mm/ N10 mm) were calculated [17]. These indices were calculated using Equations (1) and (2):
N 10 m m = ( S D 10 m m C B , 10 m m ) × 100 ( % )
Q 10 m m = ( C H , 10 m m / C B , 10 m m 1 a H / a B 1 ) × 100 ( % )
where SD10 mm is the standard deviation of the background area, CB, 10 mm is the average pixel value of the background area, and CH, 10 mm is the average pixel value of the hot sphere placement position. The ratio of aH to aB (aH/aB) is the ratio of the radioactivity concentration in the hot sphere to the radioactivity concentration in the background region, which was set to four in this study.
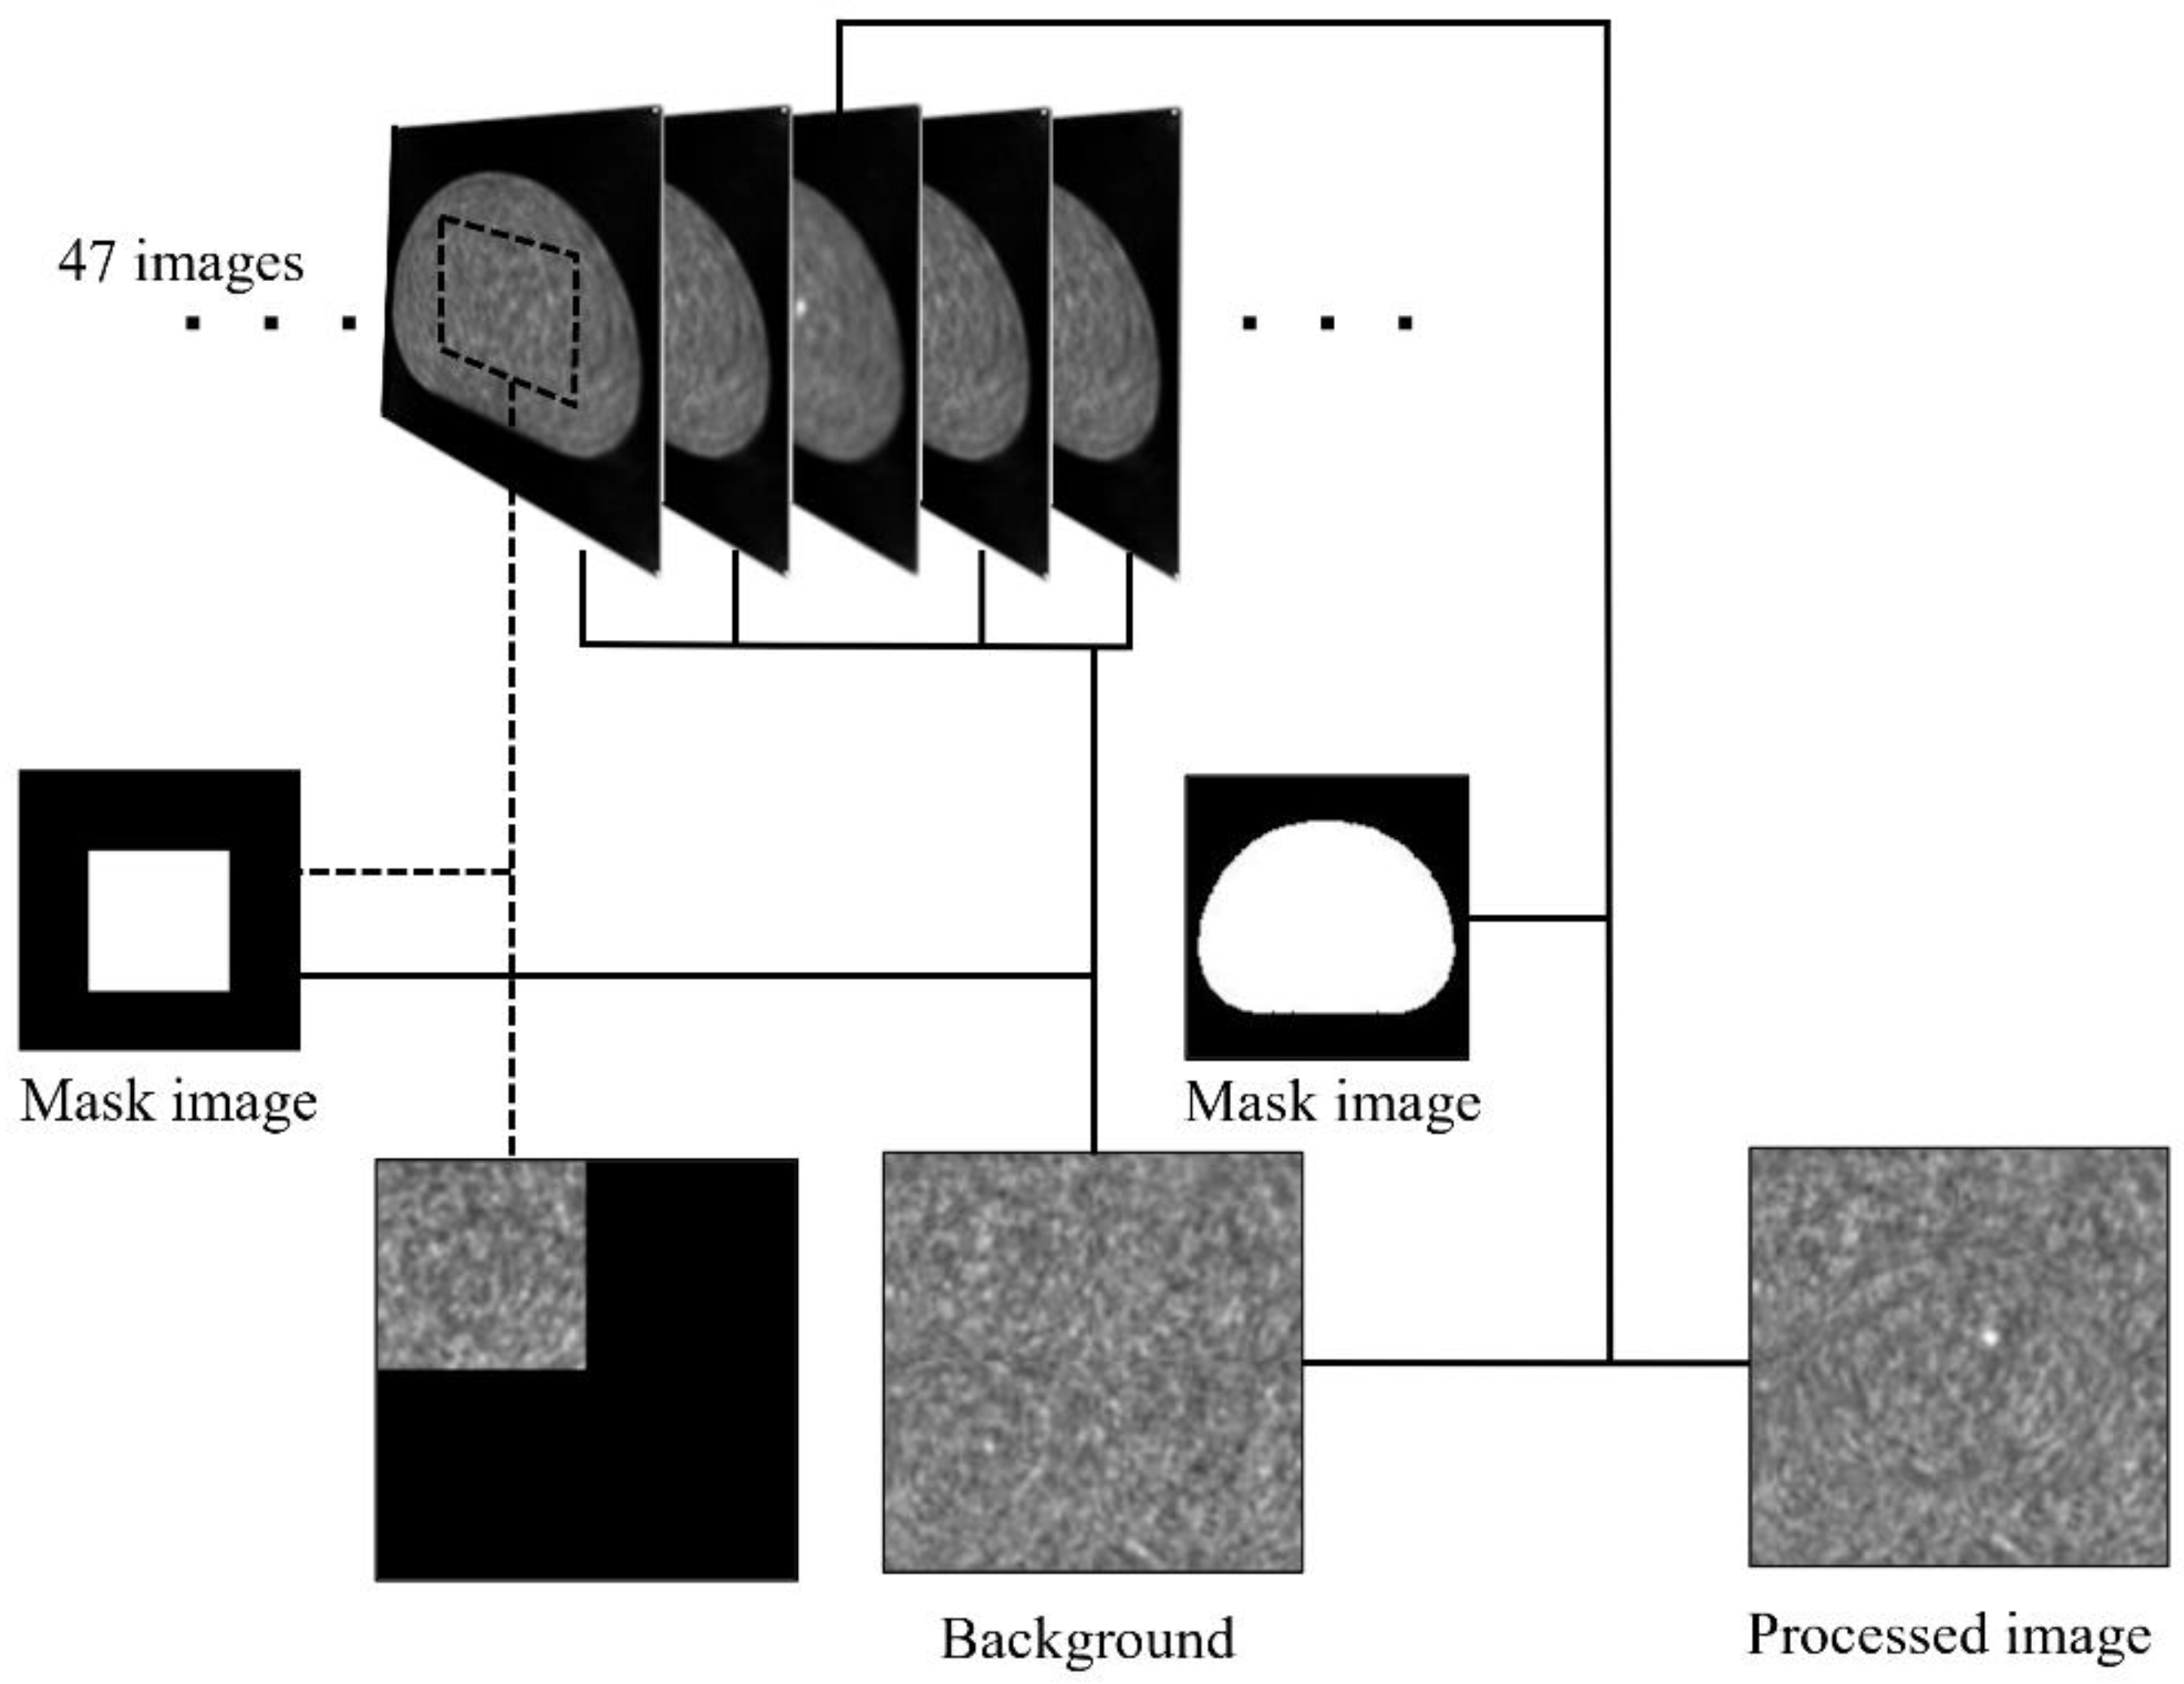
The iLab C++ Neuromorphic Vision Toolkit (iNVT) version 3.1 was used to calculate the saliency map [18]. The input formats available in iNVT are limited; therefore, the matrix size of the PET images was changed to 256 × 256 and converted to an 8-bit JPEG format by ImageJ (National Institutes of Health, Bethesda, MD, USA) [19] version 1.52a software to be used as the input for the iNVT. The calculation of the saliency map is based on several features, but in the simulation study, the features of intensity and flicker were used. Since the salience by intensity increases where the change in pixel values is large, we preprocessed the body phantom by filling its periphery with the pixel values of the background region (Figure 2). The pixel values of the background region were obtained from the slices before and after the slice in which the hot sphere was clearly depicted. The processed PET image was used as the input, and the pixel values of the hot sphere position in the saliency map were used. The feature of flicker is used to compute the saliency of the video and respond to the change in intensity from the previous frame [20]. Therefore, the process of filling the outside of the phantom was not necessary. The calculation was performed by considering a series of 2D images as a video. Salience by intensity indicates prominence within a slice, whereas evaluation by flicker implies prominence in the slice direction. The PET images obtained from the actual device were processed in the same way. However, only the intensity features were used to calculate the salience.
A Tobii Eye Tracker 4C (Tobii, Sweden) was used as the eye-tracking device. Six radiographers with 1–15 years of experience working in the nuclear medicine department were asked to participate in this study, and the method of acquiring gaze data was explained to them. The evaluator was instructed to find and gaze at the hot sphere, and the training was conducted with 10 images. The evaluator calibrated the test before the evaluation to ensure that the gazing location was within the circle of the estimated gazing area, which corresponded to a size of 55 mm in diameter in the PET image. The estimated gazing area was hidden during the image quality evaluation. The images presented to the evaluator contained equal proportions of slices containing hot spheres and slices without hot spheres for a total of 1944 images. Each image was displayed on a full screen for 0.5 s in a random order. In consideration of the evaluator’s fatigue, the evaluation was divided into 36 sessions, and 54 images were continuously displayed per session. The study using clinical images was conducted in one session due to the small number of images. The gaze data were acquired at intervals of about 10 ms, and the acquisition time and X and Y coordinates of the gazing point were recorded. The program used to acquire the raw data of the gazing points was written in Python 3.6 using the software development kit provided by Tobii. A 128 × 128 matrix of gaze images was created from the frequency of the gazing points at each coordinate. The pixel values were displayed as Z-scores. Regions of interest (ROIs) with a diameter of 55 mm were placed on the gaze image (320 × 320 mm) centered on the coordinates where the hot sphere was placed, and the average Z-score was calculated.
R (open-source, http://www.R-project.org, accessed on 30 June 2022) version 4.1.1 [21] was used for statistical processing to obtain Pearson’s product-moment correlation coefficient between each indicator. The significance level for all statistical tests was considered to be 5%.

3. Results

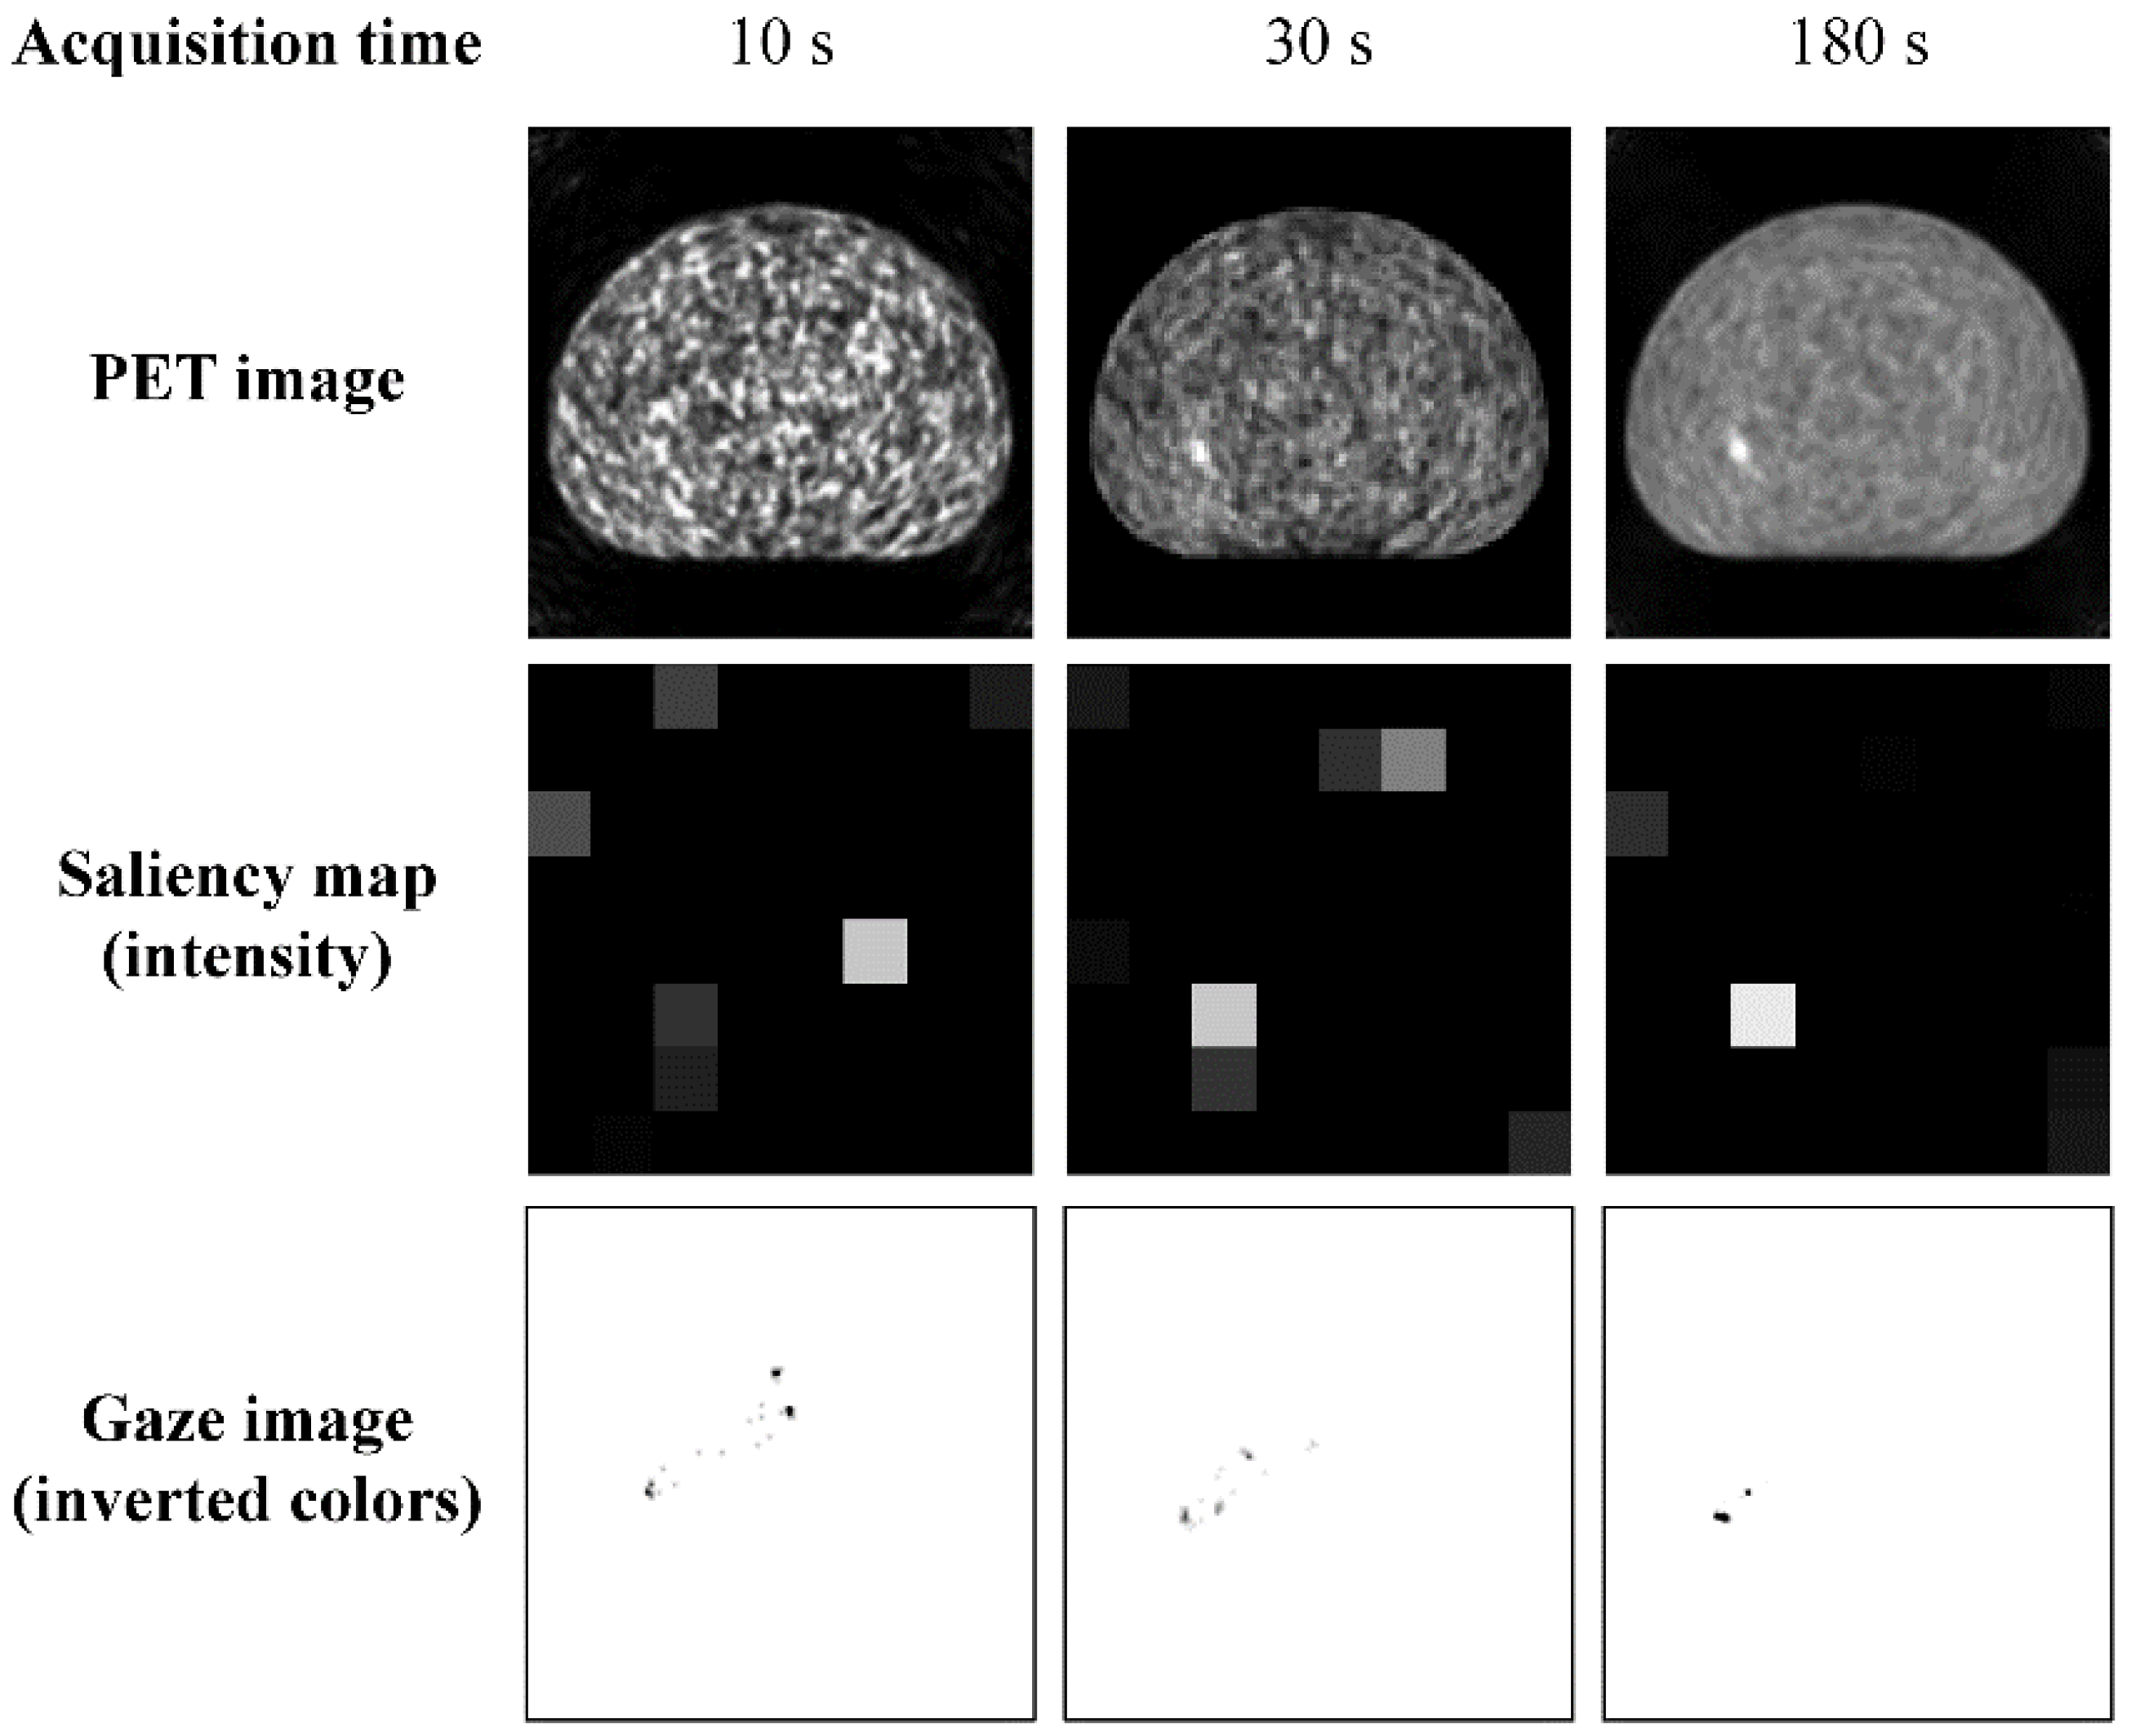
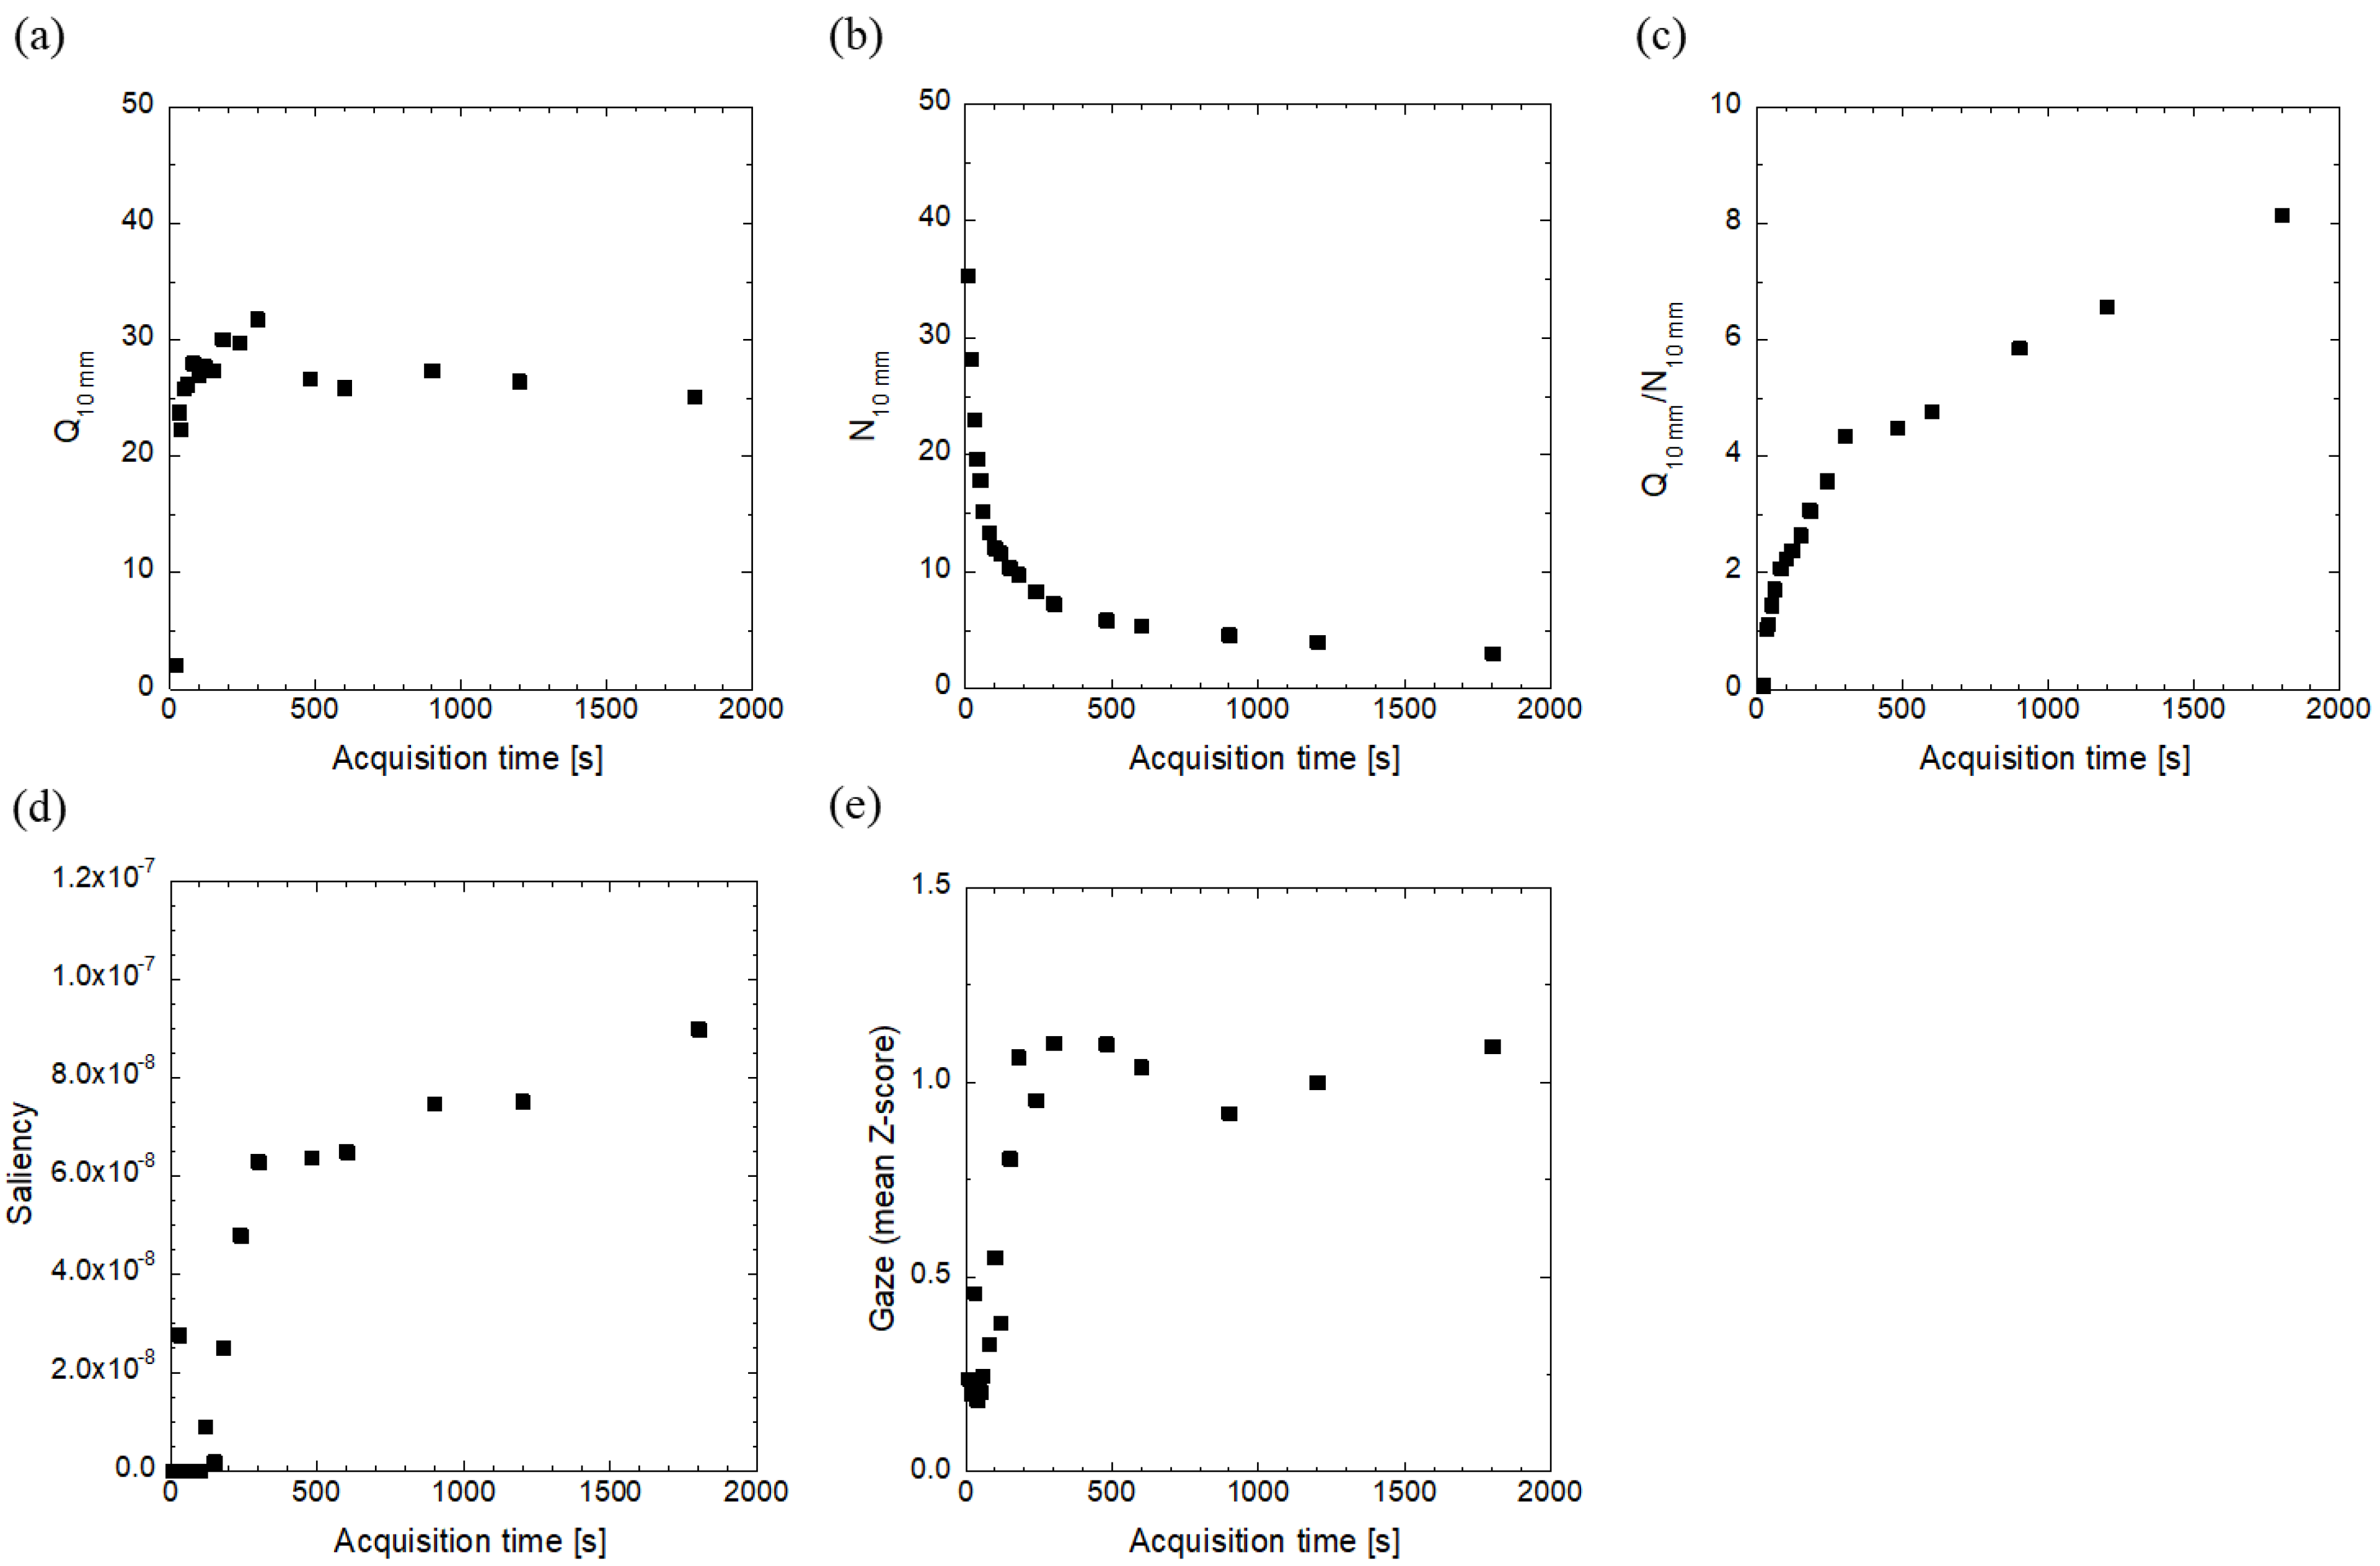
Some of the reconstructed PET images, saliency maps (intensity), and black and white inverted gaze images are shown in Figure 3. The pixel values of the hot sphere location in the saliency map and gaze image were low at an acquisition time of 10 s but became higher as the acquisition time increased to 30 s and 180 s. Q10 mm, N10 mm, and Q10 mm/N10 mm, as well as the max pixel values (intensity and flicker) at the hot sphere position in the saliency map and the average Z-scores in the ROIs of the gaze image, are shown in Figure 4. The respective correlation coefficients are presented in Table 1. The Q10 mm value was higher for images with larger iterations but was almost independent of the acquisition time. However, the standard deviation tended to decrease as the acquisition time increased. The N10 mm value was lower in the PET images reconstructed with smaller iterations and decreased with an increasing acquisition time. The Q10 mm/N10 mm values were higher in the images reconstructed with iterations 2 and 3 than in the images reconstructed with iteration 1. The pixel value of the hot sphere position in the saliency map (intensity) showed high values in the images with small iterations when the acquisition time was short and tended to increase and saturate when sufficient counts were obtained. The salience by flicker was higher for smaller iterations and increased with an increasing acquisition time. The error bars are not shown in Figure 4 because the standard deviation of the gaze images was large due to large individual differences. The average Z-score within the ROI increased with the smaller number of iterations when the acquisition time of the PET image was short (≤90 s). When the acquisition time was >90 s, the Z-score was constant regardless of the number of iterations. In the correlation between the mean Z-score of the gaze images and each evaluation indicator, only Q10 mm did not show a significant correlation in iterations 2 and 3, and N10 mm was the highest. The results of the study are shown in Figure 5 and Table 2 using clinical images. The trend was similar to that in the simulation study, although the number of images was small and thus varied widely. In the study using the actual device, the gaze data and saliency showed a high correlation.

4. Discussion

This study differs from the work by Hosokawa et al. in the following respects [8]. In the current study, the phantom used was not a rectangular phantom but instead a NEMA/IEC body phantom that simulated the human body. In addition to the simulation study, PET images obtained from the actual device were used. Flicker was used in addition to the intensity as features to calculate the saliency map. To demonstrate the validity of the quality evaluation of the image using the saliency map, we compared it with the evaluator’s gaze data. The human viewpoint is not fixed to a single point but instead moves slightly. Therefore, there is no repeatability in the maximum pixel value of the gazing point in the gaze image. In addition, the gaze data decreased with the duration of blinking during the evaluation. We adopted the average Z-score in the hot sphere position calculated by the number of fixations at each position as our evaluation indicator. The results from the simulation study showed that the correlation between the gaze image and saliency map (intensity) was >0.94, indicating that they were excellent indicators.
To reduce the influence of individual differences in the pixel values of the gaze image, it was necessary to obtain the average of many samples, so a Monte Carlo simulation was used to create the PET images. Those images had better reproducibility than those from a phantom study using clinical equipment and were less likely to contain errors due to procedural errors. Alternatively, the problem with that approach is that it does not take the patient table into account, and the scattered radiation correction is different from that of the clinical machine. The results obtained from the actual device showed a similar trend to the results of the simulation experiment.
The PET images were displayed for only 0.5 s to minimize the influence of various factors, such as experience and knowledge. Reportedly, the initial gaze position immediately after image presentation follows bottom-up attention [22]. Furthermore, the gaze immediately after image presentation has been shown to correlate with a saliency map calculated from the bottom-up in mammographic lesion detection [23]. Our study results also support that finding.
The saliency map through intensity was created by filling the area outside the body phantom with background pixel values. We also proposed a method of using the saliency calculated by flicker that did not require this preprocessing. However, the correlation between saliency by flicker and the gaze information was lower than the correlation between saliency by intensity and the gaze information. The process of filling in the outside body is difficult in the evaluation of clinical images. Although some studies have used saliency mapping in clinical imaging, the most prominent location in many clinical PET images is not necessarily the lesion [24]. Normal tissue, inflammation, and benign lesions may also accumulate FDG and affect its saliency. Not only is quantitative evaluation difficult, but the salience of the lesion may disappear if the normal areas are very prominent. Therefore, it is difficult to evaluate the ability of the saliency maps calculated from the intensity features in this software to depict lesions present on clinical images. A method to compute saliency maps from flicker features may solve this problem, but further improvement is needed. To solve this problem, top-down attention needs to be considered. However, the method using top-down attention involves a field of computer-aided detection (CADe). Recently, CADe using a deep convolutional neural network (DCNN) has been actively studied [25]. Models trained with the evaluator’s eye data reportedly are more accurate than the general-purpose models proposed for natural images [26]. Unless the algorithm used is fixed, however, it is impossible to determine whether the change in results is due to a difference in image quality or in the algorithm. CADe using a DCNN is in its infancy and changes quickly. We preprocessed the input images and did not make any changes to the established algorithms.
In this study, conventionally used image quality evaluation indices were also calculated for comparison. N10 mm had a high negative correlation with the average Z-score of the gaze target image, but the evaluation was based on the amount of noise in the background region and did not consider the visibility of the hot sphere. Therefore, changing the radioactivity concentration of the hot sphere did not change the value. The value of Q10 mm was constant regardless of the acquisition time, and hence the image quality could not be evaluated by Q10 mm itself. The explanation for why Q10 mm/N10 mm showed different changes from the average Z-score and saliency of the gaze image is thought to be that the gaze image and saliency map were obtained from 8-bit images, whereas Q10 mm/N10 mm was calculated from 32-bit float images. Since saliency maps have been actively researched using natural images, algorithms that use 8-bit images as their input are common. Even though high dynamic range images have been used as input in studies [27,28], 8-bit images are still commonly used [6,7].
It is unclear if the Q10 mm/N10 mm calculated from a 32-bit image represents the quality of the medical images a doctor sees.
Recently, the no-reference image quality assessment (NR-IQA) concept has been extensively studied. Unlike full-reference IQAs, such as the normalized mean squared error, the NR-IQA is characterized by its ability to perform absolute evaluations. Initially, the NR-IQA was studied in the field of natural imaging and subsequently applied to many medical magnetic resonance imaging situations [29,30]. Moreover, applications in the field of PET are expected. However, it is the noise and distortion of the entire image that is evaluated and not the ability to accurately describe the lesion. That purpose is different from the purpose of our study. The most primitive method of Itti’s model was used in this study, but other established algorithms are also worth a try [31].

5. Conclusions

In this study, we used the saliency map calculated by Itti’s algorithm for image quality evaluation in nuclear medicine. Itti’s algorithm is an established algorithm and has a clear calculation method. The validity of the proposed method was demonstrated by comparing it with the gaze data of the evaluator. Even though the algorithm was designed to calculate the saliency of the natural images, the low-resolution gray-scale nuclear medicine images showed the same trend as the gaze images. A strong correlation was observed between the two, suggesting that salience can be used to evaluate the image quality when a uniform phantom is used. When attempting to apply this approach to clinical images, although further work must be performed, its potential is evident in the flicker feature.

Author Contributions

Conceptualization, S.H.; methodology, S.H. and Y.W.; software, S.H.; formal analysis, S.H.; investigation, S.H. and C.N.; writing—original draft preparation, S.H. and Y.T.; writing—review and editing, S.H., H.Y. and K.I.; visualization, S.H.; supervision, M.F.; funding acquisition, S.H. All authors have read and agreed to the published version of the manuscript.

Funding

This work was supported by JSPS KAKENHI, grant number JP20K20240.

Institutional Review Board Statement

We confirmed in advance that no ethical approval from our institutional review board was required to conduct this study as it did not use any clinical data.

Informed Consent Statement

Not applicable.

Data Availability Statement

The data presented in this study are available in this article.

Conflicts of Interest

The authors declare no conflict of interest related to this study.

References

  1. Reynes-Llompart, G.; Sabate-Llobera, A.; Llinares-Tello, E.; Marti-Climent, J.M.; Gamez-Cenzano, C. Image quality evaluation in a modern PET system: Impact of new reconstructions methods and a radiomics approach. Sci. Rep. 2019, 9, 10640. [Google Scholar] [CrossRef] [PubMed]
  2. Bertalmío, M.; Gomez-Villa, A.; Martín, A.; Vazquez-Corral, J.; Kane, D.; Malo, J. Evidence for the intrinsically nonlinear nature of receptive fields in vision. Sci. Rep. 2020, 10, 16277. [Google Scholar] [CrossRef] [PubMed]
  3. Zhai, G.; Min, X. Perceptual image quality assessment: A survey. Sci. China Inf. Sci. 2020, 63, 211301. [Google Scholar] [CrossRef]
  4. Ujjwal, V.J.; Sivaswamy, J.; Vaidya, V. Assessment of computational visual attention models on medical images. In Proceedings of the Eighth Indian Conference on Computer Vision, Graphics and Image Processing, Mumbai, India, 16–19 December 2012; Association for Computing Machinery: New York, NY, USA. [Google Scholar]
  5. Alpert, S.; Kisilev, P. Unsupervised detection of abnormalities in medical images using salient features. In Proceedings of thevolume 9034, Medical Imaging 2014, Image Processing, San Diego, CA, USA, 15–20 February 2014; Ourselin, S., Styner, M.A., Eds.; SPIE: Bellingham, WA, USA, 2014; Volume 9034. [Google Scholar]
  6. Banerjee, S.; Mitra, S.; Shankar, B.U.; Hayashi, Y. A novel GBM saliency detection model using multi-channel MRI. PLoS ONE 2016, 11, e0146388. [Google Scholar] [CrossRef]
  7. Mitra, S.; Banerjee, S.; Hayashi, Y. Volumetric brain tumour detection from MRI using visual saliency. PLoS ONE 2017, 12, e0187209. [Google Scholar] [CrossRef] [Green Version]
  8. Hosokawa, S.; Takahashi, Y.; Inoue, K.; Suginuma, A.; Terao, S.; Kano, D.; Nakagami, Y.; Watanabe, Y.; Yamamoto, H.; Fukushi, M. Fundamental study on objective image quality assessment of single photon emission computed tomography based on human vision by using saliency. Jpn. J. Nucl. Med. Technol. 2021, 41, 175–184. [Google Scholar]
  9. Wen, G.; Aizenman, A.; Drew, T.; Wolfe, J.M.; Haygood, T.M.; Markey, M.K. Computational assessment of visual search strategies in volumetric medical images. J. Med. Imaging 2016, 3, 015501. [Google Scholar] [CrossRef] [Green Version]
  10. Matsumoto, H.; Terao, Y.; Yugeta, A.; Fukuda, H.; Emoto, M.; Furubayashi, T.; Okano, T.; Hanajima, R.; Ugawa, Y. Where do neurologists look when viewing brain CT images? An eye-tracking study involving stroke cases. PLoS ONE 2011, 6, e28928. [Google Scholar] [CrossRef]
  11. Motoki, K.; Saito, T.; Onuma, T. Eye-tracking research on sensory and consumer science: A review, pitfalls and future directions. Food Res. Int. 2021, 145, 110389. [Google Scholar] [CrossRef]
  12. Kredel, R.; Vater, C.; Klostermann, A.; Hossner, E.-J. Eye-tracking technology and the dynamics of natural gaze behavior in sports: A systematic review of 40 years of research. Front. Psychol. 2017, 8, 1845. [Google Scholar] [CrossRef] [Green Version]
  13. Liu, Z.; Yang, Z.; Gu, Y.; Liu, H.; Wang, P. The effectiveness of eye tracking in the diagnosis of cognitive disorders: A systematic review and meta-analysis. PLoS ONE 2021, 16, e0254059. [Google Scholar] [CrossRef] [PubMed]
  14. Yamashina, H.; Kano, S.; Suzuki, T.; Yagahara, A.; Ogasawara, K. Assessing visual attention of mammography positioning using eye tracking system: A comparison between experts and novices. Jpn. J. Radiol. Technol. 2019, 75, 1316–1324. [Google Scholar] [CrossRef] [PubMed] [Green Version]
  15. Jan, S.; Santin, G.; Strul, D.; Staelens, S.; Assie, K.; Autret, D.; Avner, S.; Barbier, R.; Bardies, M.; Bloomfield, P.M.; et al. GATE: A simulation toolkit for PET and SPECT. Phys. Med. Biol. 2004, 49, 4543–4561. [Google Scholar] [CrossRef] [PubMed]
  16. Merlin, T.; Stute, S.; Benoit, D.; Bert, J.; Carlier, T.; Comtat, C.; Filipovic, M.; Lamare, F.; Visvikis, D. CASToR: A generic data organization and processing code framework for multi-modal and multi-dimensional tomographic reconstruction. Phys. Med. Biol. 2018, 63, 185005. [Google Scholar] [CrossRef] [Green Version]
  17. Fukukita, H.; Suzuki, K.; Matsumoto, K.; Terauchi, T.; Daisaki, H.; Ikari, Y.; Shimada, N.; Senda, M. Japanese guideline for the oncology FDG-PET/CT data acquisition protocol: Synopsis of version 2.0. Ann. Nucl. Med. 2014, 28, 693–705. [Google Scholar] [CrossRef] [Green Version]
  18. Itti, L.; Koch, C.; Niebur, E. A model of saliency-based visual attention for rapid scene analysis. IEEE Trans. Pattern Anal. Mach. Intell. 1998, 20, 1254–1259. [Google Scholar] [CrossRef] [Green Version]
  19. Schneider, C.A.; Rasband, W.S.; Eliceiri, K.W. NIH Image to ImageJ: 25 years of image analysis. Nat. Methods 2012, 9, 671–675. [Google Scholar] [CrossRef]
  20. Itti, L.; Dhavale, N.; Pighin, F. Realistic avatar eye and head animation using a neurobiological model of visual attention. SPIE 2003, 5200, 64–78. [Google Scholar]
  21. Ihaka, R.; Gentleman, R.R. A language for data analysis and graphics. J. Comput. Graph. Stat. 1996, 5, 299–314. [Google Scholar] [CrossRef]
  22. Parkhurst, D.; Law, K.; Niebur, E. Modeling the role of salience in the allocation of overt visual attention. Vis. Res. 2002, 42, 107–123. [Google Scholar] [CrossRef] [Green Version]
  23. Perconti, P.; Loew, M.H. Salience measure for assessing scale-based features in mammograms. J. Opt. Soc. Am. A Opt. Image Sci. Vis. 2007, 24, B81–B90. [Google Scholar] [CrossRef] [PubMed]
  24. Rosenbaum, S.J.; Lind, T.; Antoch, G.; Bockisch, A. False-positive FDG PET uptake—The role of PET/CT. Eur. Raiol. 2006, 16, 1054–1065. [Google Scholar] [CrossRef] [PubMed]
  25. Puttagunta, M.; Ravi, S. Medical image analysis based on deep learning approach. Multimed. Tools Appl. Multimed. 2021, 80, 24365–24398. [Google Scholar] [CrossRef] [PubMed]
  26. Zou, X.; Zhao, X.; Yang, Y.; Li, N. Learning-based visual saliency model for detecting diabetic macular edema in retinal image. Comput. Intell. Neurosci. 2016, 2016, 7496735. [Google Scholar] [CrossRef] [PubMed] [Green Version]
  27. Brémond, R.; Petit, J.; Tarel, J.P. Saliency maps of high dynamic range images. In Proceedings of the Trends and Topics in Computer Vision. ECCV 2010 Workshops, Heraklio, Greece, 10–11 September 2010; Kutulakos, K.N., Ed.; Springer: Berlin/Heidelberg, Germany, 2012. [Google Scholar]
  28. Dong, Y.; Pourazad, M.T.; Nasiopoulos, P. Human visual system-based saliency detection for high dynamic range content. IEEE Trans. Multimedia 2016, 18, 549–562. [Google Scholar] [CrossRef]
  29. Oszust, M.; Piórkowski, A.; Obuchowicz, R. No-reference image quality assessment of magnetic resonance images with high-boost filtering and local features. Magn. Reason. Med. 2020, 84, 1648–1660. [Google Scholar] [CrossRef]
  30. Chow, L.S.; Rajagopal, H. Modified-BRISQUE as no reference image quality assessment for structural MR images. Magn. Reason. Imaging 2017, 43, 74–87. [Google Scholar] [CrossRef]
  31. Borji, A.; Cheng, M.-M.; Hou, Q.; Jiang, H.; Li, J. Salient object detection: A survey. Comp. Vis. Media 2019, 5, 117–150. [Google Scholar] [CrossRef] [Green Version]
Figure 1. Hot sphere placement in the body phantom. A hot sphere with a diameter of 10 mm was placed at 18 different positions in each image. The hot spheres were placed at radii (r) of 28.6 mm, 57.2 mm, and 85.8 mm from the center of the body phantom. The radioactivity concentration was set to four times that of the background region.
Radiation 02 00018 g001
Figure 2. Preprocessing to calculate saliency. Since the salience was calculated to be higher in the area when the change in pixel value in the image was large, the blank area around the body phantom was preprocessed to be filled with the pixel value of the background area. Four slices before and after the slice in which the hot sphere was depicted were used as the background region pixel values. A binarized mask image (mask image) was used to combine the slices in which the hot sphere was depicted (processed image). Longdash lines were used to prevent misinterpretation of where lines intersect.
Radiation 02 00018 g002
Figure 3. Positron emission tomography (PET) image, saliency map, and gaze image. Saliency maps are calculated from processed PET images, as shown in Figure 2. The longer the acquisition time, the higher the pixel values of the gaze image and salience map.
Radiation 02 00018 g003
Figure 4. Relationship between imaging time and image quality index. The horizontal axis displays the imaging time. For each graph, the vertical axis represents the following: (a) percent of contrast (Q10 mm), (b) percent of background variability (N10 mm), (c) ratio of the percent of background variability to the percent of contrast (Q10 mm/N10 mm), (d) the pixel value of the saliency map calculated from the intensity (e) and flicker in the hot sphere position, and (f) the Z-score of the gaze image (Gaze). Each figure shows the results of iterations 1–3 of the ordered-subset expectation maximization reconstruction.
Radiation 02 00018 g004
Figure 5. Results obtained from use of the actual device. The relationship between the imaging time and image quality index is shown. The horizontal axis displays the imaging time. For each graph, the vertical axis represents the following: (a) percent of contrast (Q10 mm), (b) percent of background variability (N10 mm), (c) ratio of percent of background variability to percent of contrast (Q10 mm/N10 mm), (d) pixel value of the saliency map calculated from the intensity, and (e) Z-score of the gaze image (Gaze).
Radiation 02 00018 g005
Table 1. Correlation coefficient and 95% confidence interval between each image quality index. There is a significant correlation between gaze data and all image quality indices except Q10 mm. The saliency map and Q10 mm/N10 mm show correlations of similar strengths with the gaze data.
IterationIndicatorCorrelation Coefficient (95% Confidence Interval)
Saliency
(Intensity)
Saliency
(Flicker)
Q10 mmN10 mmQ10 mm/N10 mm
1Gaze0.942
(0.849, 0.979)
0.802
(0.537, 0.923)
−0.599
(−0.833, −0.184)
−0.959
(−0.985, −0.890)
0.837
(0.608, 0.938)
Saliency (Intensity) 0.947
(0.860, 0.980)
−0.773
(−0.911, −0.478)
−0.994
(−0.998, −0.982)
0.967
(0.912, 0.988)
Saliency (Flicker) −0.888
(−0.958, −0.719)
−0.920
(−0.970, −0.795)
0.991
(0.976, 0.997)
Q10 mm 0.757
(0.449, 0.904)
−0.883
(−0.956, −0.708)
N10 mm −0.947
(−0.981, −0.861)
2Gaze0.942
(0.847, 0.978)
0.790
(0.511, 0.918)
−0.195 (n.s.)
(−0.607, 0.299)
−0.967
(−0.988, −0.912)
0.835
(0.603, 0.937)
Saliency (Intensity) 0.940
(0.844, 0.978)
−0.436 (n.s.)
(−0.750, 0.039)
−0.991
(−0.997, −0.976)
0.966
(0.909, 0.987)
Saliency (Flicker) −0.645
(−0.855, −0.255)
−0.908
(−0.966, −0.766)
0.985
(0.959, 0.994)
Q10 mm 0.410 (n.s.)
(−0.071, 0.736)
−0.609
(−0.838, −0.199)
N10 mm −0.943
(−0.979, −0.849)
3Gaze0.964
(0.905, 0.987)
0.835
(0.603, 0.937)
0.157 (n.s.)
(−0.334, 0.582)
−0.978
(−0.992, −0.940)
0.890
(0.725, 0.959)
Saliency (Intensity) 0.942
(0.848, 0.979)
−0.010 (n.s.)
(−0.474, 0.459)
−0.982
(−0.993, −0.950)
0.974
(0.929, 0.990)
Saliency (Flicker) −0.244 (n.s.)
(−0.638, 0.252)
−0.888
(−0.958, −0.720)
0.983
(0.955, 0.994)
Q10 mm −0.022 (n.s.)
(−0.484, 0.449)
−0.173 (n.s.)
(−0.592, 0.320)
N10 mm −0.936
(−0.976, −0.834)
n.s. = not significant.
Table 2. Correlation coefficient and 95% confidence interval between each image quality index. A significant correlation is shown between gaze data and saliency, similar to the simulation study.
IndicatorCorrelation Coefficient (95% Confidence Interval)
Saliency
(Intensity)
Q10 mmN10 mmQ10 mm/N10 mm
Gaze0.848
(0.630, 0.942)
0.516
(0.065, 0.792)
−0.801
(−0.923, −0.534)
0.832
(0.597, 0.935)
Saliency (Intensity) 0.352 (n.s.)
(−0.137, 0.703)
−0.710
(−0.884, −0.364)
0.910
(0.771, 0.966)
Q10 mm −0.822
(−0.932, −0.577)
0.517
(0.066, 0.793)
N10 mm −0.870
(−0.951, −0.679)
n.s. = not significant.
Publisher’s Note: MDPI stays neutral with regard to jurisdictional claims in published maps and institutional affiliations.