Proceeding Paper

Stress-Testing Alternative Water Quality Sensor Designs under Cyber-Physical Attack Scenarios †

by
Dionysios Nikolopoulos
1,*,
Georgios Moraitis
1,
George Karavokiros
1,
Dimitrios Bouziotas
2 and
Christos Makropoulos
1
1
Department of Water Resources and Environmental Engineering, School of Civil Engineering, National Technical University of Athens, 15780 Athens, Greece
2
KWR Water Research Institute, Groningenhaven 7, 3433 PE Nieuwegein, The Netherlands
*
Author to whom correspondence should be addressed.
Presented at the International Conference EWaS5, Naples, Italy, 12–15 July 2022.
Environ. Sci. Proc. 2022, 21(1), 17; https://doi.org/10.3390/environsciproc2022021017
Published: 19 October 2022

Abstract

:
Water systems are rapidly transforming into cyber-physical systems. Despite the benefits of remote control and monitoring, autonomous operation and connectivity, there is an expanded threat surface, which includes cyber-physical attacks. This study demonstrates a stress-testing methodology that focuses on assessing the performance of a contamination warning system, designed with alternative water quality (WQ) sensor placement strategies against cyber-physical attacks. The physical part of the attacks consists of backflow injection attacks with a contaminant, while the cyber part comprises cyber-attacks to the contamination warning system. The WQ sensor designs are generated with the Threat Ensemble Vulnerability Assessment and Sensor Placement Optimization Tool (TEVA-SPOT), based on optimizing various metrics. The coupled WDN and CPS operation, the deliberate contamination events, and the cyber-physical attacks, are simulated with the water system cyber-physical stress-testing platform RISKNOUGHT. Multidimensional resilience profile graphs are utilized to analyze performance, demonstrated in a benchmark case study. This type of assessment can be useful in risk assessment studies for water utilities as well as in WQ sensor placement optimization.

1. Introduction

The uninterrupted supply of clean drinking water to consumers is one of the most critical functions of a society for nurturing public health, and societal and economic welfare. The critical infrastructures serving the purpose are water distribution networks (WDNs), which are spatially large and complex systems, even when suppling water to smaller communities. One critical objective of WDNs is maintaining the water quality within acceptable safety thresholds, limiting biological (microbial) and chemical (potentially harmful substances) hazards [1]. Various incidents have shown that quality failures, typically in the form of contamination events, can have severe consequences including deaths, illnesses, and monetary losses. Examples include the 1993 cryptosporidium outbreak in Milwaukee [2], the 2014 Elk River MCHM spill in West Virginia, the 2019 Askøy water supply system campylobacter outbreak, and the 2019 E. coli outbreak in Long Beach [3]. The safety of WDNs is hampered by their distributed nature and numerous physical entry points [4]. There is an ever-growing concern of the security of these systems, especially for deliberate contamination actions (e.g., [5,6,7]).
To prevent such events, water utilities employ contaminant warning systems (CWS) as part (usually a subsystem) of their supervisory control and data acquisition (SCADA) systems. A CWS consists of strategically placed water quality sensors and is tasked with the timely detection of contaminants within the WDN, activating response measures for mitigation, and issuing alarms to the public. The optimal placement of sensors in a CWS is a subject studied extensively in the literature, as it is not economically viable or technically feasible to monitor all positions in the network. Generally, placement is formulated as an optimization problem, where the control variables are the positions of a limited number (budget) of sensors. Performance metrics such as those presented by Moraitis et.al. [8] are utilized to capture a system’s performance and quantify it as objective functions in the optimization problem. Under this scheme, various individual objective functions can be used such as the time of detection [9], contamination extent (total pipe length affected) [10], detection likelihood [11], volume of contaminated water consumed [9], mass of contaminant consumed, and others. The problem is usually solved by heuristics, integer programming, evolutionary algorithms [4], etc., and there exists dedicated software for the formulization of the problem, the generation of sensor designs (number and placement), and the assessment of contamination events such as TEVA-SPOT [12].
Recently, cyber-physical attacks are also being considered [7,13,14,15,16,17] as potential threats to WDNs, where a deliberate contamination event (e.g., a backflow contaminant injection attack) is supported by a cyber-attack (e.g., hijacking communications to alter sensor readings) on the CWS to mask the contamination. The resilience of sensor designs under failure in general (e.g., a sensor’s structural failure, inability to identify a specific contaminant etc.) is an under-investigated subject [18], and specifically, the resilience of a design under cyber-physical threats has only recently emerged in the literature [15]. This can be also attributed to the fact that software platforms able to represent WDNs as cyber-physical systems (i.e., simulate both the physical properties and processes as well as the cyber infrastructure and information flow) and stress-test them under cyber-physical attacks have only recently been developed. Related tools and platforms include epanetCPA [13] and RISKNOUGHT [14], the latter being able to simulate contaminant injection attacks [19], CWS operation, control logic regarding contaminant mitigation measures, and cyber-physical attacks targeting water quality sensors, also having been used in the resilience assessment of CWSs [15].
In this work, we present a methodology for the multi-metric resilience assessment of sensor designs under cyber-physical attacks as well as quantifying the uncertainty regarding the targeted sensors.

2. Case Study and Stress-Testing Methodology

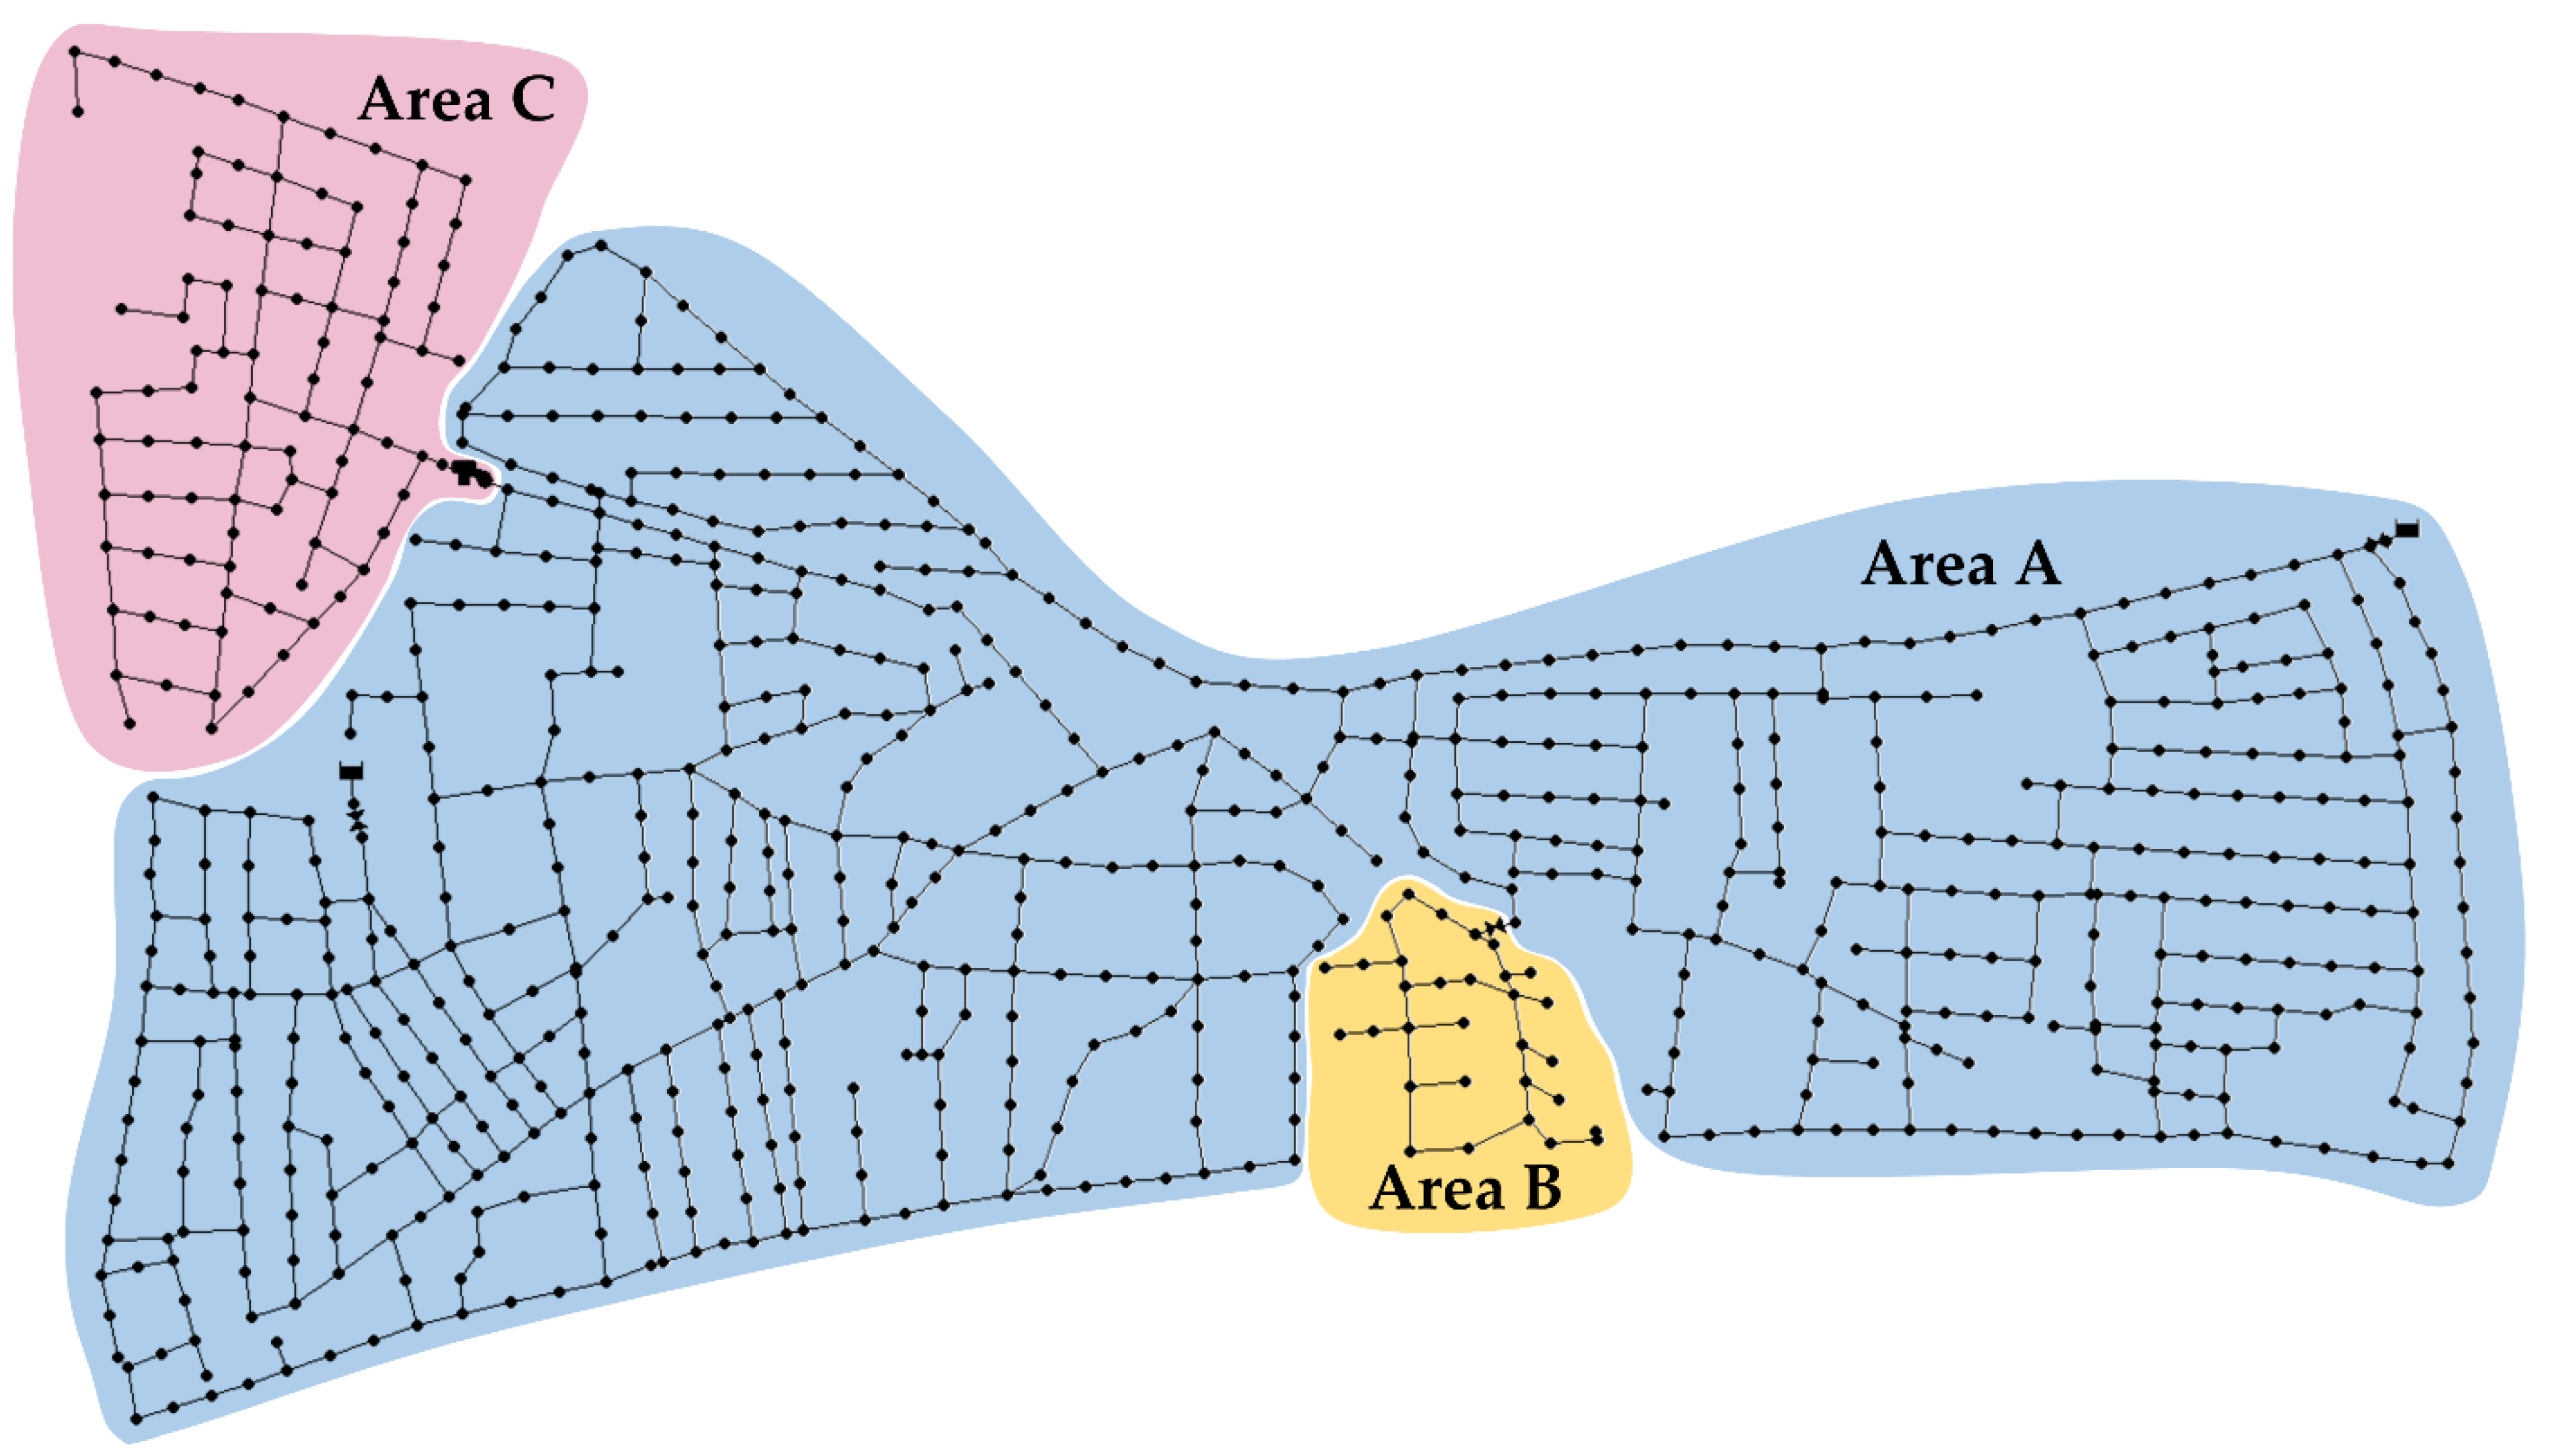
2.1. L-Town Case Study

L-Town is a benchmark WDN of a small hypothetical town, modelled in EPANET. The system is supplied by two sources, namely reservoirs R1 and R2, and distributes water to approximately 10,000 people through a pipe network of 42.6 km. The consumers’ profiles include residential, commercial, and industrial uses, resulting in a typical distribution during the weekdays and higher consumption during nighttime for the weekend for areas with residential and commercial uses. The system is divided into three supply areas, as shown in Figure 1, with area “C” characterized by the highest elevation and area “B” by the lowest.
Pressure in the network is regulated through two PRVs (pressure reducing valves) installed directly at the input points of the system in area “A”, while a third PRV is located at the inflow of area “B”. Area “C” is supplied through a pump-fed tank at the starting point of the area, pushing water from area “A” to higher elevations. The pump activation protocol relies on the data sent from the tank level sensor.

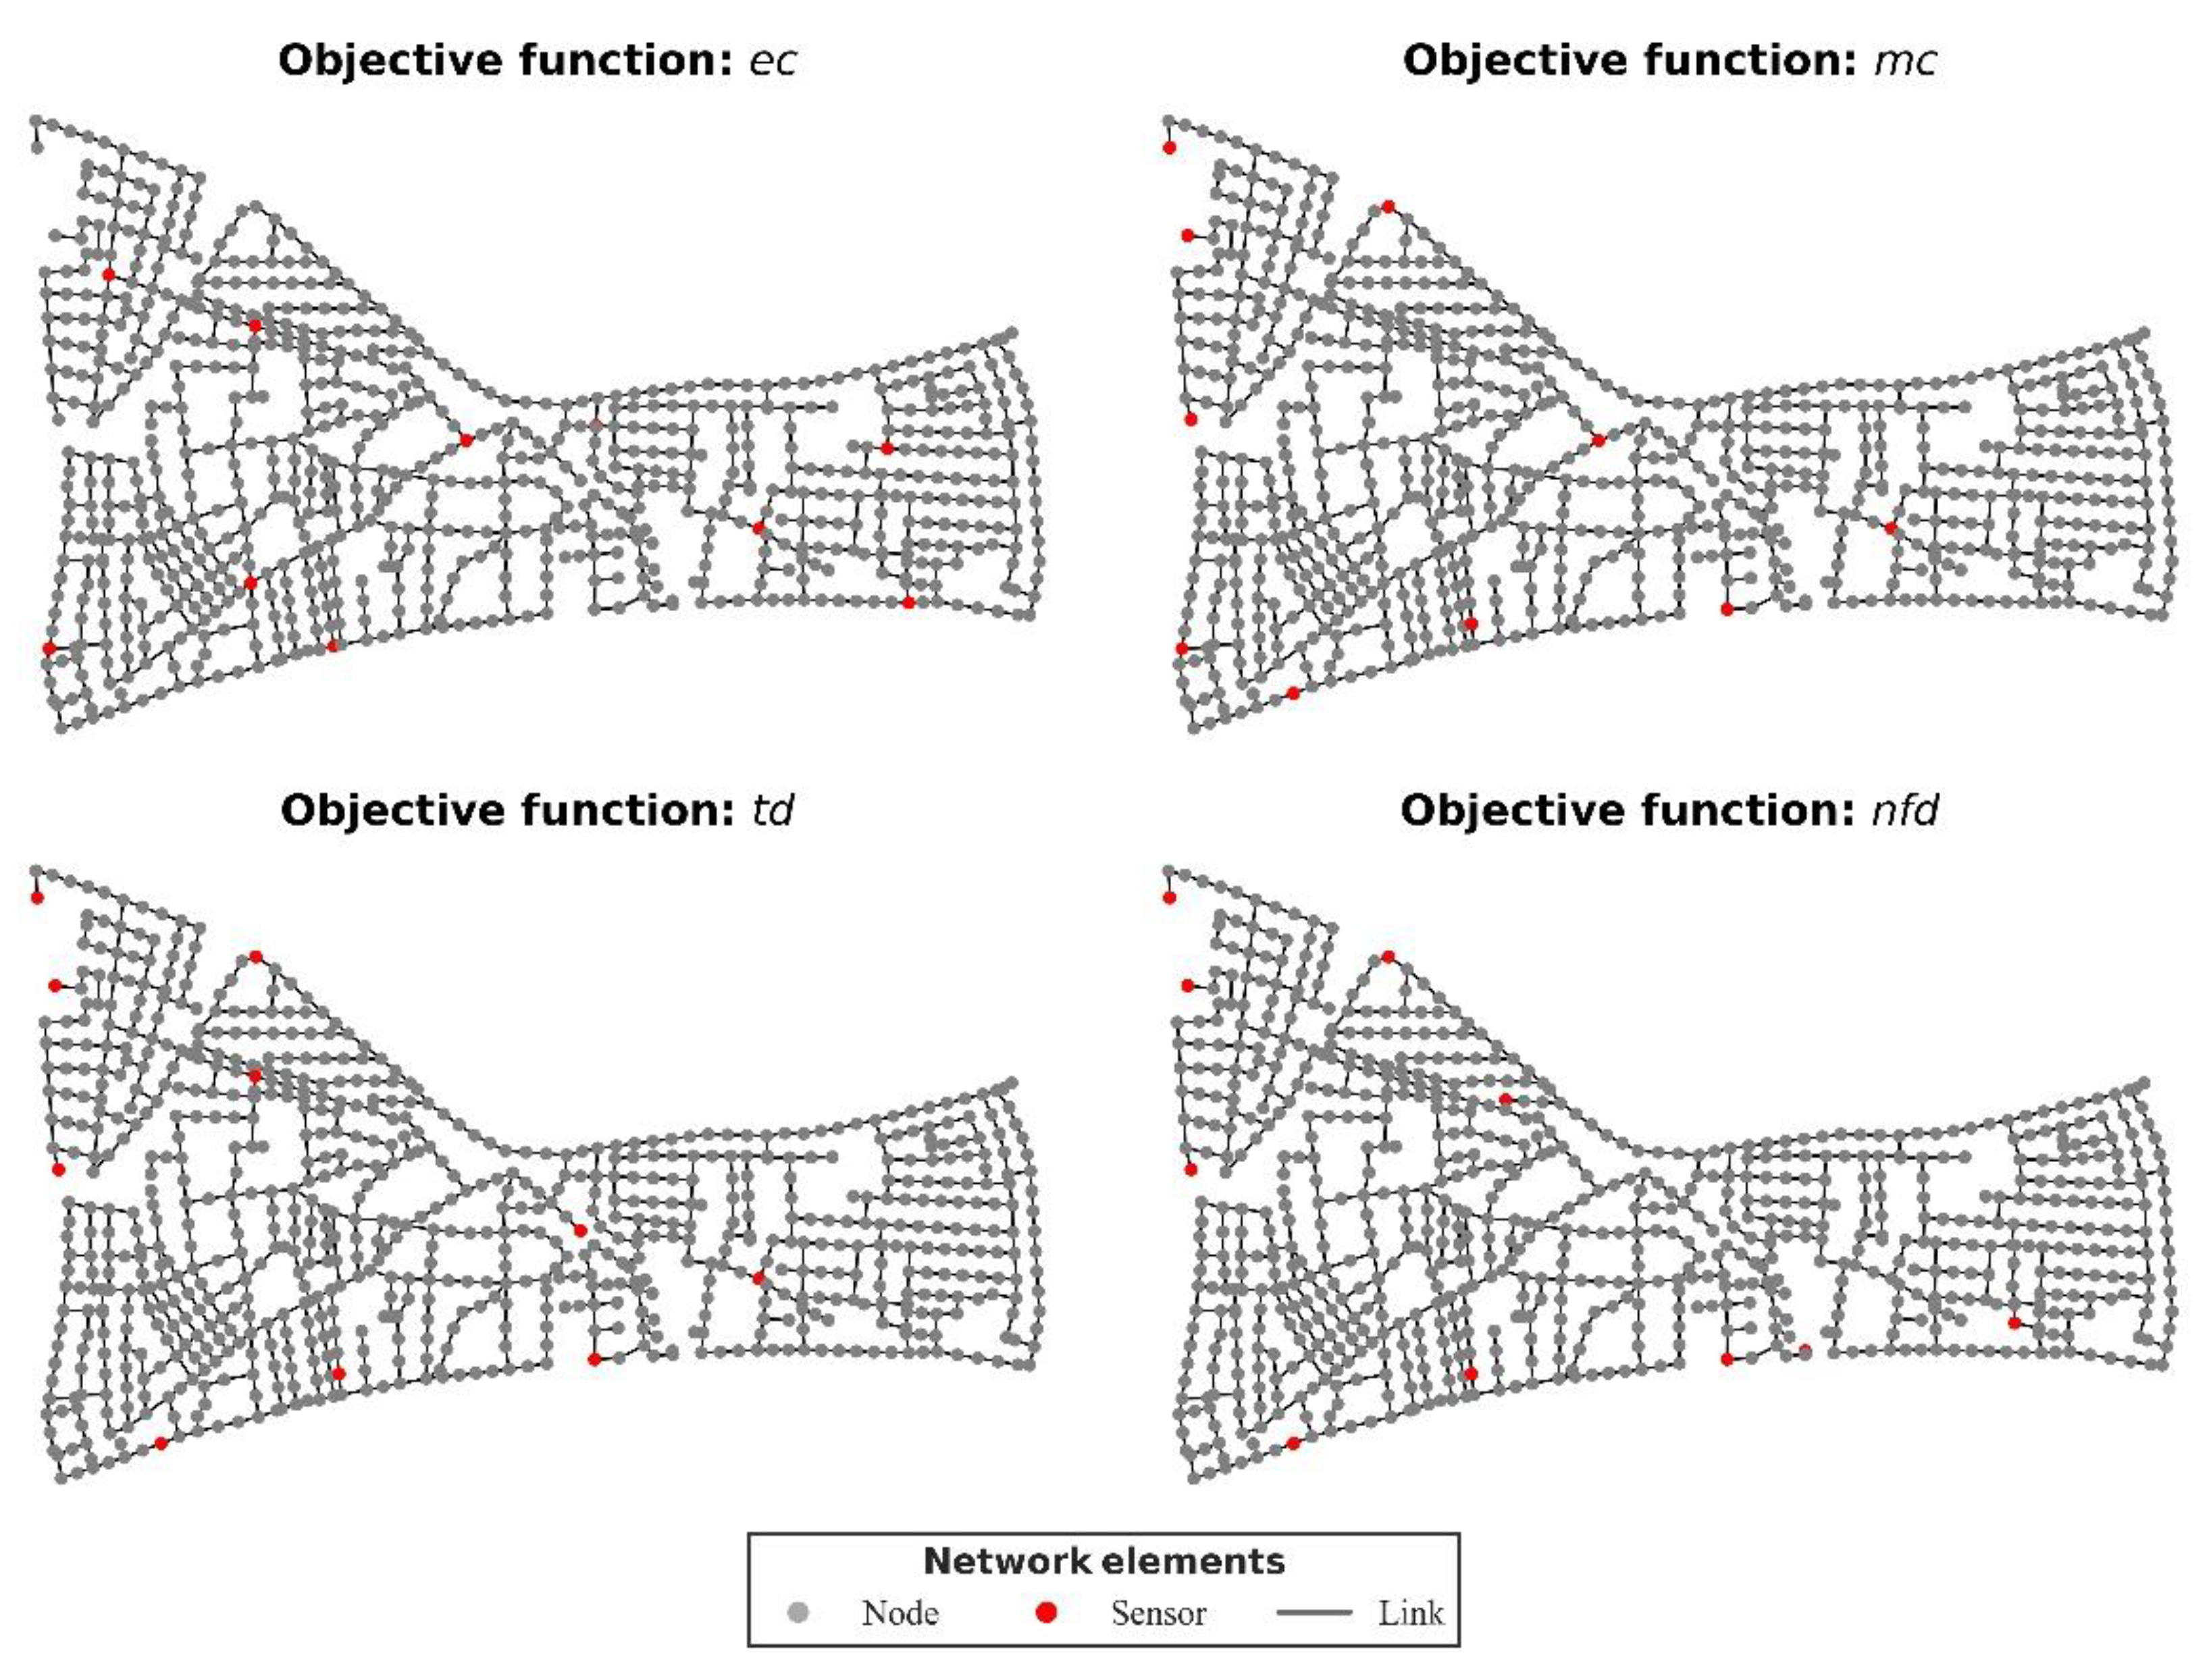
2.2. Alternative Water Quality Sensor Placement Strategies Using TEVA-SPOT

The maximum number of water quality sensors is mainly cost-constrained, regardless of the selected placement optimization strategy. In this case study, the number of sensors, to be placed at junctions of the network, was set to 10. The TEVA-SPOT software was utilized to generate four different sensor placement strategies, diversified by the applied objective function, as follows:
  • Mean extent of contamination (ec);
  • Mean mass of contaminant consumed (mc);
  • Mean number of failed detections (nfd);
  • Mean time to detection (td).
It was assumed that all junctions were suitable for placement (i.e., it is technically feasible to place a sensor) and the sensors were perfect (i.e., measurements were totally accurate and there was no minimum detection threshold). The junctions on which sensors were optimally placed, according to each objective function selected, are presented in Table 1 and visualized in Figure 2.

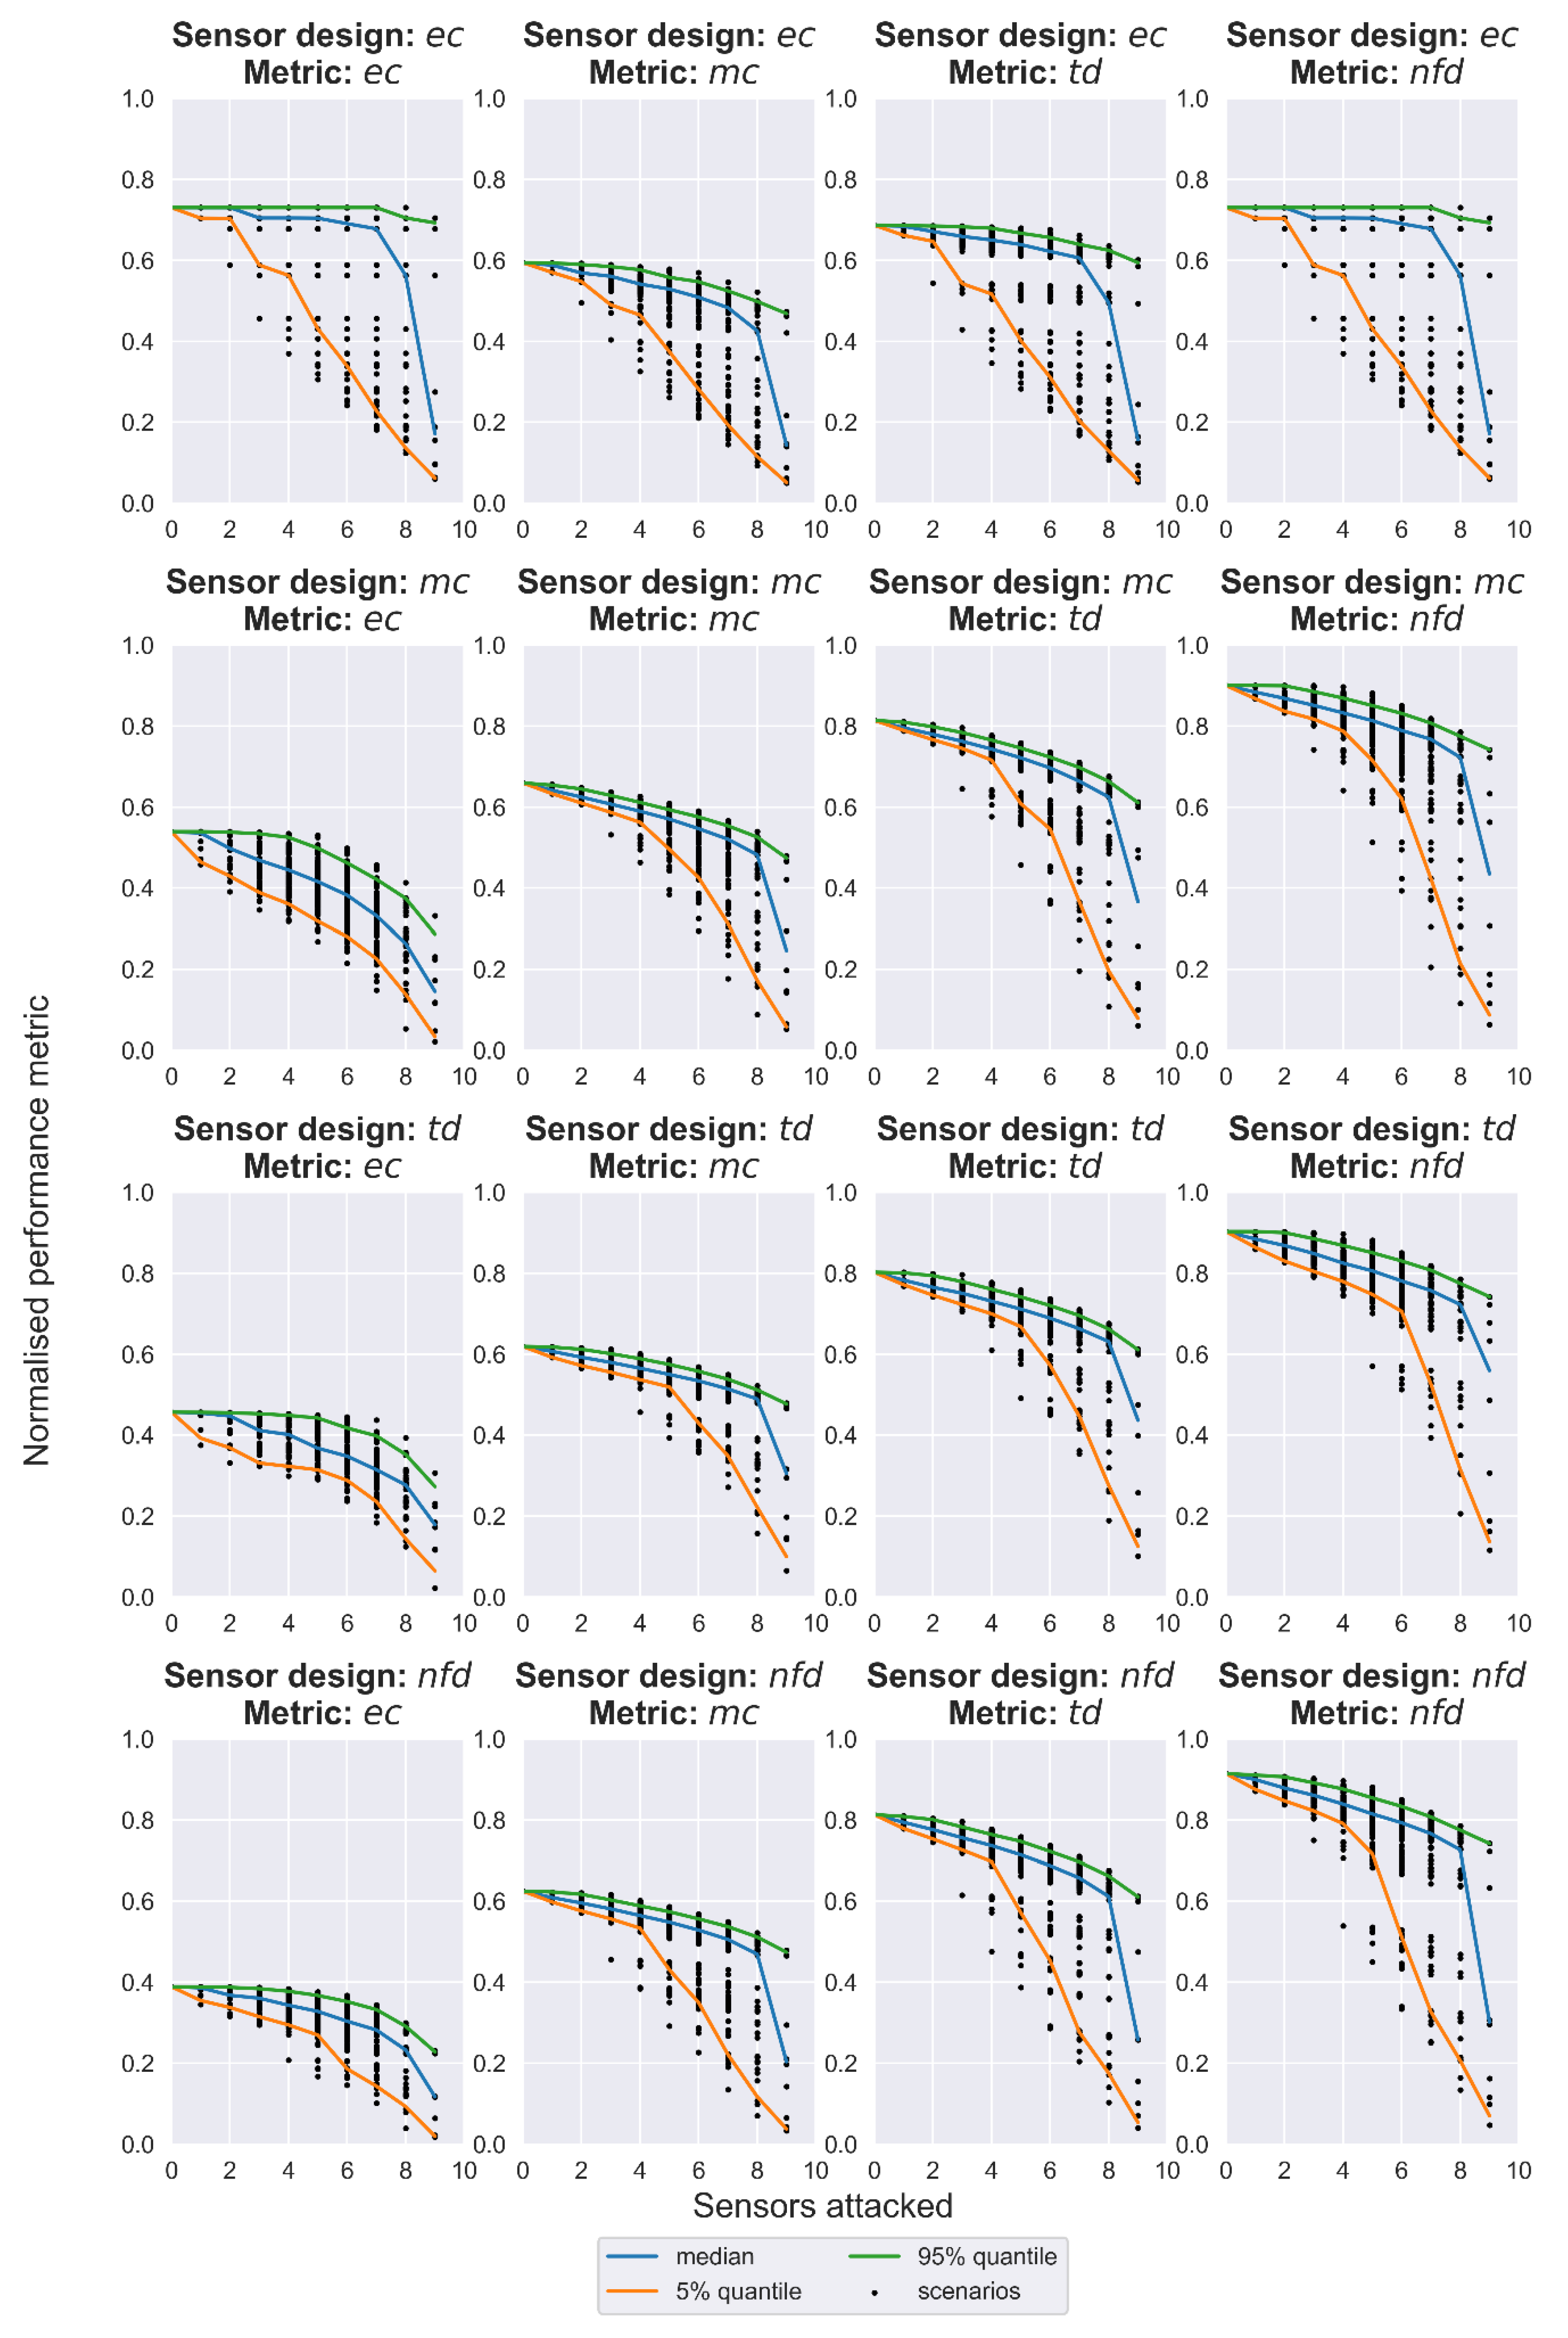
2.3. Stress-Testing Alternative Designs against Cyber-Physical Attacks

The sensor placement designs were stress-tested with the same ensemble of cyber-physical attack scenarios. Each attack has (a) a physical part (i.e., a backflow injection attack with a conservative chemical contaminant at a network’s junction) and (b) a cyber part (i.e., cyber-attacks that feed bogus data (replay normal water quality readings) to a sub-set of the sensors, with the intent to blind them). Hence, the contamination may go undetected for longer or even entirely, depending on the remaining, not-tampered sensors.
The ensemble of cyber-physical attacks pairs all possible injection points (782) in the network and all combinations of 0 to 9 of the cyber-attacked sensors (1023), generating 799,986 scenarios for each sensor design, being an exhaustive analysis. We used a mode in RISKNOUGHT that simplifies the stress-testing process for this specific task by using a post-analysis of pre-run quality simulation results for all physical injections and considers the attacked sensors as not operational (i.e., removing them from the pool), instead of the regular coupling of the physical and cyber simulations in the same step concurrently, making the simulation of the events orders of magnitude faster without a loss of fidelity for the examined case.
For each scenario, the same four metrics of ec, mc, td, and nfd were calculated as a mean value from the combined set of all physical attacks and the cyber-attacks. These were further normalized to range [0, 1], which denotes the maximum to minimum impact to supply four comparable performance indicators that describe the reliability in preventing contamination consequences by each metric. For example, the normalization attributes are the ec performance score of 1, if the mean ec value of the scenario is 0, where the score of 0 is reserved by the scenario with the worst mean ec (calculated as the mean ec of the trivial scenario consisting of the ensemble of physical attacks and 0 operating water quality sensors).
The performance indicators for each scenario, grouped by sensor design, are utilized in a special type of graph, the resilience profile graph [20,21]. On the original methodology, on the x-axis, the stress scenarios are described in increasing order (i.e., the number of sensors attacked), while the y-axis describes performance. The area under the performance curve, scaled from 0 to 1, is the resilience of the system. For scenarios that can have many realizations (as in this case, where the scenario “2 sensors attacked” consists of many possible pairs), the methodology was modified to account for uncertainty in the work of Nikolopoulos et al. [22] by describing the resilience of the performance quantiles curves (e.g., resilience under the worst 5% realizations of the various scenario types). Because this case study explored four different resilience scores for each sensor design, the need for a multi-metric resilience analysis arises. We used a weighted resilience metric (WR) with equal weights of 0.25 for each resilience score for the performance metrics ec, mc, td, nfd, in order to compare the sensor designs, under increasingly stressful failure conditions imposed by the cyber-physical attack scenarios. Finally, the weighted nominal performance (WNP) indicator was calculated to describe the performance for the nominal operating conditions for the special scenario of 0 cyber-attacks (i.e., all water quality sensors are operational). The mean ec, mc, td, and nfd performance of that scenario were given equal weights of 0.25.

3. Results and Discussion

The results from the stress-testing procedure are presented as resilience profile graphs in Figure 3, and the multi-metric weighted resilience (WR) scores for the performance curves of quantiles 5%, 50%, and 95%, along with the WNP, are summarized in Table 2. The sensor design generated with the objective function mc displayed the best WNP with a score of 0.728, while the other three designs had similar scores around 0.69. By exploring the weighted resilience of the designs under cyber-attacks, it is evident that the alternative designs did not differ significantly. However, the sensor design that minimizes mc ranked two times in second and once in first place. Thus, it may be the best compromise between the nominally performant but also resilient under failure conditions sensor design in this particular case study. As expected, the stress increased the performance drops and the uncertainty bounds between 5% and 95% were wide as a result of the utility provided by the remaining operating sensors. Remarkably though, when looking at the 95% quantile, there was enough utility left, even with one operating sensor in most designs and performance metrics. This can be attributed to the looped nature of the WDN examined, but also signifies that there are critical (in terms of the utility provided) water quality sensors that should be prioritized for protection in a cyber-physical wise risk management procedure.
It should be noted that in this case, the WDN was small in extent and the sensor designs employed a limited number of sensors, and the specific type of cyber-physical attack could be surrogated by a post-analysis of water quality simulations. Therefore, it is possible to exhaustively search the scenario space to generate the resilience profile graphs, which is not the general case. In analyses with larger WDNs, more complex CWSs, and specialized cyber-attacks requiring to be simulated in a coupled cyber-physical manner in RISKNOUGHT’s regular mode, a Monte Carlo approach to select ensembles of physical and cyber-attacks should be followed.

4. Conclusions

We presented a cyber-physical stress-testing procedure for water quality sensor designs that assessed performance in a multi-metric resilience manner, under the impacts caused by cyber-physical attacks that target both the physical layer of a WDN by contamination attacks as well as the cyber-layer by attacks on the water quality sensors. The evaluation of resilience profile graphs provides insight into the uncertainty regarding the behavior of the CWS under such failure events and the residual capability offered by sensors that continue operation, which is affected by the design strategy selected. Therefore, better informed decisions can be made by water utilities regarding (a) the placement optimization of water quality sensors, and (b) the prioritization of cyber and/or physical security measures at the most critical sensors of the CWS. It is suggested that this type of study is useful for the risk management efforts of cyber-wise water utilities to optimize their budget allocation and resources while minimizing the risk of adverse consequences for consumers, as well as for the implementation of water safety plans (WSP).

Author Contributions

Conceptualization, D.N.; methodology, D.N. and G.M.; software, D.N.; validation, G.M., D.B. and G.K.; formal analysis, D.N.; investigation, D.N. and G.M.; resources, G.K.; data curation, D.N. and G.M.; writing—original draft preparation, D.N. and G.M; writing—review and editing, G.M., D.B., G.K. and C.M.; visualization, G.M. and D.B.; supervision, C.M.; Project administration, C.M.; Funding acquisition, C.M. All authors have read and agreed to the published version of the manuscript.

Funding

The research work was supported by the project PROCRUSTES which is funded by the Hellenic Foundation for Research and Innovation (H.F.R.I.) under the “First Call for H.F.R.I. Research Projects to support Faculty members and Researchers and the procurement of high-cost research equipment grant” (Project Number: HFRI-FM17-2918).

Conflicts of Interest

The authors declare no conflict of interest.

References

  1. Clark, R.M.; Deininger, R.A. Protecting the Nation’s Critical Infrastructure: The Vulnerability of U.S. Water Supply Systems. J. Contingencies Cris. Manag. 2000, 8, 73–80. [Google Scholar] [CrossRef]
  2. Mac Kenzie, W.R.; Hoxie, N.J.; Proctor, M.E.; Gradus, M.S.; Blair, K.A.; Peterson, D.E.; Kazmierczak, J.J.; Addiss, D.G.; Fox, K.R.; Rose, J.B.; et al. A Massive Outbreak in Milwaukee of Cryptosporidium Infection Transmitted through the Public Water Supply. N. Engl. J. Med. 1994, 331, 161–167. [Google Scholar] [CrossRef] [PubMed]
  3. Qiu, M.; Salomons, E.; Ostfeld, A. A framework for real-time disinfection plan assembling for a contamination event in water distribution systems. Water Res. 2020, 174, 115625. [Google Scholar] [CrossRef] [PubMed]
  4. Ostfeld, A.; Salomons, E. Optimal Layout of Early Warning Detection Stations for Water Distribution Systems Security. J. Water Resour. Plan. Manag. 2004, 130, 377–385. [Google Scholar] [CrossRef]
  5. Gleick, P.H. Water and terrorism. Water Policy 2006, 8, 481–503. [Google Scholar] [CrossRef] [Green Version]
  6. Ginsberg, M.D.; Hock, V.F. Terrorism and security of water distribution systems: A primer. Def. Secur. Anal. 2004, 20, 373–380. [Google Scholar] [CrossRef]
  7. Pelekanos, N.; Nikolopoulos, D.; Makropoulos, C. Simulation and vulnerability assessment of water distribution networks under deliberate contamination attacks. Urban Water J. 2021, 18, 209–222. [Google Scholar] [CrossRef]
  8. Moraitis, G.; Nikolopoulos, D.; Bouziotas, D.; Lykou, A.; Karavokiros, G.; Makropoulos, C. Quantifying Failure for Critical Water Infrastructures under Cyber-Physical Threats. J. Environ. Eng. 2020, 146, 04020108. [Google Scholar] [CrossRef]
  9. Kessler, A.; Ostfeld, A.; Sinai, G. Detecting Accidental Contaminations in Municipal Water Networks. J. Water Resour. Plan. Manag. 1998, 124, 192–198. [Google Scholar] [CrossRef]
  10. Watson, J.P.; Greenberg, H.J.; Hart, W.E. A multiple-objective analysis of sensor placement optimization in water networks. In Critical Transitions in Water and Environmental Resources Management; American Society of Civil Engineers: Reston, VA, USA, 2004; pp. 4609–4618. [Google Scholar] [CrossRef]
  11. Ostfeld, A.; Salomons, E. Sensor Network Design Proposal for the Battle of the Water Sensor Networks (BWSN). In Proceedings of the Water Distribution Systems Analysis Symposium, Cincinnati, OH, USA, 27–30 August 2006. [Google Scholar]
  12. Berry, J.; Boman, E.; Riesen, L.A.; Hart, W.E.; Phillips, C.A.; Watson, J.-P. User’s Manual: TEVA-SPOT Toolkit 2.5.2; U.S. Environmental Protection Agency: Cincinnati, OH, USA, 2012.
  13. Taormina, R.; Galelli, S.; Tippenhauer, N.O.; Salomons, E.; Ostfeld, A. Characterizing Cyber-Physical Attacks on Water Distribution Systems. J. Water Resour. Plan. Manag. 2017, 143, 04017009. [Google Scholar] [CrossRef]
  14. Nikolopoulos, D.; Moraitis, G.; Bouziotas, D.; Lykou, A.; Karavokiros, G.; Makropoulos, C. Cyber-Physical Stress-Testing Platform for Water Distribution Networks. J. Environ. Eng. 2020, 146, 04020061. [Google Scholar] [CrossRef]
  15. Nikolopoulos, D.; Ostfeld, A.; Salomons, E.; Makropoulos, C. Resilience Assessment of Water Quality Sensor Designs under Cyber-Physical Attacks. Water 2021, 13, 647. [Google Scholar] [CrossRef]
  16. Nikolopoulos, D.; Moraitis, G.; Makropoulos, C. 7. Strategic and Tactical Cyber-Physical Security for Critical Water Infrastructures. In Cyber-Physical Threat Intelligence for Critical Infrastructures Security: Securing Critical Infrastructures in Air Transport, Water, Gas, Healthcare, Finance and Industry; Soldatos, J., Praça, I., Jovanovic, A., Eds.; Now Publishers: Boston, MA, USA; Delft, The Netherlands, 2021; pp. 159–187. ISBN 978-1-68083-823-7. [Google Scholar] [CrossRef]
  17. Moraitis, G.; Nikolopoulos, D.; Koutiva, I.; Tsoukalas, I.; Karavokyros, G.; Makropoulos, C. The PROCRUSTES testbed: Tackling cyber-physical risk for water systems. In Proceedings of the EGU General Assembly 2021, Vienna, Austria, 19–30 April 2021; p. EGU21-14903. [Google Scholar] [CrossRef]
  18. Zhang, Q.; Zheng, F.; Kapelan, Z.; Savic, D.; He, G.; Ma, Y. Assessing the global resilience of water quality sensor placement strategies within water distribution systems. Water Res. 2020, 172, 115527. [Google Scholar] [CrossRef] [PubMed]
  19. Nikolopoulos, D.; Makropoulos, C. Stress-testing water distribution networks for cyber-physical attacks on water quality. Urban Water J. 2022, 19, 256–270. [Google Scholar] [CrossRef]
  20. Makropoulos, C.; Nikolopoulos, D.; Palmen, L.; Kools, S.; Segrave, A.; Vries, D.; Koop, S.; van Alphen, H.J.; Vonk, E.; van Thienen, P.; et al. A resilience assessment method for urban water systems. Urban Water J. 2018, 15, 316–328. [Google Scholar] [CrossRef]
  21. Nikolopoulos, D.; van Alphen, H.-J.; Vries, D.; Palmen, L.; Koop, S.; van Thienen, P.; Medema, G.; Makropoulos, C. Tackling the “New Normal”: A Resilience Assessment Method Applied to Real-World Urban Water Systems. Water 2019, 11, 330. [Google Scholar] [CrossRef] [Green Version]
  22. Nikolopoulos, D.; Kossieris, P.; Tsoukalas, I.; Makropoulos, C. Stress-Testing Framework for Urban Water Systems: A Source to Tap Approach for Stochastic Resilience Assessment. Water 2022, 14, 154. [Google Scholar] [CrossRef]
Figure 1. L-Town network visualization with three DMAs of the hypothetical town highlighted.
Environsciproc 21 00017 g001
Figure 2. The four alternative sensor designs for L-Town, as generated by the respective objective functions (ObjF) from TEVA-SPOT.
Environsciproc 21 00017 g002
Figure 3. Resilience profile graphs of the four performance metrics (subplots in columns) for the sensor design alternatives (subplots in rows).
Environsciproc 21 00017 g003
Table 1. Sensors placed according to the placement strategy and ordered by their criticality ranking, from highest to lowest impact.
Criticality Rankecmctdnfd
1 n62 n93 n62n1
2 n264 n1 n1n215
3 n188 n527 n215n4
4 n221 n264 n4 n50
5 n157 n4n527n25
6 n286 n215 n50n527
7 n93 n50n339n750
8 n313 n25n25 n253
9 n18 n576n264n576
10n104n104n576n83
Table 2. Weighted nominal performance and weighted resilience scores by performance quantile of the four alternative water quality sensor designs.
Sensor DesignWNPWR (95th perc)WR (50th perc)WR (5th perc)
ec0.6850.6650.5910.420
mc0.7280.6630.6080.490
td0.6950.6420.5980.496
nfd0.6850.6280.5730.446
Publisher’s Note: MDPI stays neutral with regard to jurisdictional claims in published maps and institutional affiliations.

