Proceeding Paper

Utilizing Spent Yeast for Tannin Adsorption in Chestnut Shell Treatment Solutions †

by
Elsa F. Vieira
1,*,
Tomás Amaral
2,*,
Ricardo Ferraz
2,3,4 and
Cristina Delerue-Matos
1
1
REQUIMTE/LAQV, Instituto Superior de Engenharia do Porto, Instituto Politécnico do Porto, 4200-072 Porto, Portugal
2
Ciências Químicas e das Biomoléculas, Escola Superior de Saúde, Instituto Politécnico do Porto (ESS/IPP), 4200-072 Porto, Portugal
3
RISE-Health, Centro de Investigação em Saúde Translacional e Biotecnologia Médica (TBIO), Escola Superior de Saúde, Instituto Politécnico do Porto, 4200-072 Porto, Portugal
4
REQUIMTE/LAQV, Departamento de Química e Bioquímica, Faculdade de Ciências, Universidade do Porto, 4169-007 Porto, Portugal
*
Authors to whom correspondence should be addressed.
Presented at the 5th International Electronic Conference on Applied Sciences, Online, 4–6 December 2024.
Eng. Proc. 2025, 87(1), 21; https://doi.org/10.3390/engproc2025087021
Published: 19 March 2025
(This article belongs to the Proceedings of The 5th International Electronic Conference on Applied Sciences)

Abstract

:
This study evaluated the use of brewer’s spent yeast (BSY) as an adsorbent for tannins from a chestnut shell extract (CS tannin extract). This extract was derived from an alkaline treatment (5% NaOH (v/v)) to recover cellulosic material from chestnut shells and needed valorization. Various BSY treatments, including lyophilization, immobilization in calcium alginate beads, and alkaline and acid treatments, were tested to identify which had the best tannin adsorption capacity. The results highlight BSY’s potential as a system to valorize tannins from this treatment solution.

1. Introduction

Brewer’s spent yeast (BSY) is the second largest by-product of the brewing process, generating approximately 2.1 million tons of biomass annually [1]. While traditionally utilized as animal feed or fertilizer, BSY offers significant potential for improving human nutrition [2]. Recent studies have highlighted the biosorption capabilities of Saccharomyces spp. yeast and BSY for flavonoid polyphenols derived from various food sources (e.g., tea [3], yerba mate [4], seeds [5,6]) and agro-food residues (e.g., olive leaf extracts [7], grape pomace [8]). To enhance the biosorption efficiency for specific compounds, modifications to yeast cells—physical, chemical, immobilization, or magnetic—have been explored to optimize their surface properties [9].
Chestnut shells (CSs) are a by-product of the chestnut processing industry rich in polyphenols, particularly hydrolysable tannins such as ellagitannins (e.g., castalin, vescalin, castalagin, vescalagin, and kurigalin) and gallotannins, with an average content of 12.49 mg/g dry weight (DW) extracted from a total of 20.01 mg of phenolic compounds/g DW [10]. As part of an ongoing project focused on recovering cellulosic material from CSs through an alkaline treatment [11], a tannin-rich CS extract was produced, requiring its valorization. Therefore, this study aimed to explore the potential of BSY to adsorb tannins (and other phenolic compounds) from this CS extract, with the dual objectives of promoting more sustainable laboratory practices (i.e., the recovery of tannins from an alkaline treatment solution) and enhancing the economic viability of CS cellulosic material extraction. To improve tannin biosorption, BSY was subjected to various treatments, including lyophilization, immobilization in calcium alginate beads, and alkaline and acid modifications. Batch biosorption assays were conducted to evaluate the tannin adsorption onto BSY and identify the most effective approach. Functional groups involved in the biosorption process were analyzed using Fourier Transform Infrared Spectroscopy (FT-IR).

2. Material and Methods

2.1. Material

2.1.1. Chestnut Shell Tannin Extract

Chestnut shells (CSs) were supplied by Sortegel (Bragança, Portugal), dried at 45 °C for 36 h, minced, and processed into a CS tannin extract following the protocol in [11]. Before biosorption experiments, the CS extract was thawed in the fridge and protected from light with aluminum foil. The total phenolic compounds (TPCs) of the CS tannin extract were determined by the Folin–Ciocalteu colorimetric method, adopting the protocol in [12] and using tannic acid (Riedel-de Haën, Seelze, Germany) to construct the calibration curve (linearity range: 50–800 mg L−1; R2 = 0.9995). The results were expressed as the milligrams of tannic acid equivalents per liter of extract (mg TAE L−1). The CS tannin extract was also analyzed in terms of the hydrolysable and condensed tannins, adopting the methodology described by [13].

2.1.2. Biosorbent

Saccharomyces pastorianus biomass, obtained from the Pilsen beer fermentation process conducted by the SuperBock group (Leça do Balio, Portugal), was transported refrigerated, washed with distilled water, and stored at −80 °C for use as a biosorbent. Lyophilized (LIOF) BSY: BSY was freeze-dried (Buchi Lyovapor, L-300, Flawil, Switzerland), ground, and homogenized. Immobilized (IMOB) BSY: BSY was immobilized in calcium alginate beads according to the procedures in [14]. A 2% sodium alginate solution (mixed 1:1 with an 18% yeast suspension) was blended at 14,000 rpm for 10 min, dropped into 2% CaCl₂, and left for 2 h, at −4 °C. The beads were washed and dried at 50 °C for 24 h. Acid (ACID) and alkaline (ALK) treated BSY: 5 g of BSY was treated with 500 mL of 0.1 M sulfuric acid or 0.1 M sodium hydroxide following the protocol in [4]. The suspensions were shaken at 125 rpm and 25 °C for 24 h, centrifuged (Heraeus Fresco 21; Thermo Scientific, Waltham, WA, USA) at 5000× g for 10 min, washed, freeze-dried, ground, and homogenized. LIOF, IMOB, ACID, and ALK BSY was stored in falcon tubes at −18 °C and protected from light until they were used in the biosorption experiments.

2.2. Biosorption Studies

2.2.1. Kinetic Assays

The kinetics study followed the protocol in [15] with slight modifications. In 125 mL Erlenmeyer flasks, 100 mg of LIOF, IMOB, ALK or ACID BSY was mixed with 25 mL of CS tannin extract and shaken at 150 rpm and 25 °C. Samples were collected at intervals from 1 to 360 min to measure the TPCs in the solution and calculate the biosorption. A blank with only BSY and 100 mM sodium phosphate (pH 7) was used to account for yeast interference. The experiments were conducted in duplicate at room temperature, with the biosorption pH set at 10.0, 9.0, 11.0, and 5.0 for LIOF, IMOB, ALK, and ACID BSY, respectively. The samples were centrifuged at 5000× g for 30 min at 5 °C before TPC quantification and the biosorbed concentration (qt, mg TAE g⁻1 BSY) was calculated using Equation (1).
q t = C 0 C t · V m
where C0 and Ct are the TPCs (expressed as mg TAE L−1) before and after biosorption, respectively; V is the solution volume (L); and m is the adsorbent mass (g).
Kinetic modeling was performed using Pseudo 1st Order, Pseudo 2nd Order, and Elovich models [16], as described by Equations (2)–(4), respectively.
q t = q e · 1 e k 1 · t
q t = q e 2  ·  k 2 · t 1 + q e · k 2 · t  
q t = 1 β · ln 1 + α · β · t
where qe is the equilibrium adsorption capacity (mg g⁻1); k1 (g mg⁻1 min⁻1) is the Pseudo 1st Order kinetic constant of the model; k2 (g mg⁻1 min⁻1) is the Pseudo 2nd Order kinetic constant of the model; α is the Elovich constant related to the initial biosorption rate; and β is the Elovich constant related to the desorption rate.

2.2.2. Equilibrium Assays

Biosorption isotherm assays were conducted under the same conditions as the kinetic studies, measuring the equilibrium time and varying the LIOF, IMOB, ACID or ALK BSY concentrations (2, 4, 8, 12, and 16 g L−1). The Langmuir–Freundlich (Sips) model [17] was fitted to the data to evaluate the CS tannin extract biosorption onto the treated BSY.
q e = q m L F · ( K L F · C e ) n L F 1 + ( K L F  ·  C e ) n L F
where Ce is the equilibrium TPCs (expressed as mg TAE L−1); qmLF is the Langmuir–Freundlich maximum biosorption capacity; KLF is the constant; and n L F and K L F are Langmuir–Freundlich’s constants.

2.3. Analysis by UV-VIS Spectrometry

A total of 50 mg of the biosorbent (pre- and post-biosorption) was dissolved in 5 mL of ultrapure water and stirred for 30 min at 150 rpm, protected from light. Then, the suspension was placed in an ultrasonic bath (Selecta SA, Barcelona, Spain) for 5 min and centrifuged (6000 rpm for 5 min). The process was repeated once more, and the supernatants were combined, homogenized, and analyzed (Shimadzu UV-2101PC, Kyoto, Japan).

2.4. Analysis by Fourier Transform Infrared Spectroscopy (FT-IR)

Pellets were prepared by mixing 1 mg of the biosorbent (pre- and post-biosorption) with 100 mg of dry KBr. The samples were oven-dried, finely ground, and scanned five times. The averaged spectra were analyzed (Nicolet 6700 FT-IR, Thermo Scientific, MCT/A detector) in the 4000–500 cm⁻1 fingerprint region. The spectra were acquired and processed with OMNIC software version 8.3.103.

2.5. Statistical Analysis

The experimental data were fitted using non-linear regression in Origin 7.0 (OriginLab, Northampton, MA, USA), with the adjusted R2 determining the best fit for the kinetic and biosorption studies. A one-way ANOVA with Tukey’s post hoc test (p < 0.05) was conducted in SPSS software (SPSS 20.0, Chicago, IL, USA) to compare the means.

3. Results and Discussion

3.1. Characterization of CS Tannin Extract

The CS tannin extract was measured as being 128 mg ± 12 TAE L−1, represented by 95 ± 2% of hydrolysable tannins and 5 ± 0.4% of condensed tannins.

3.2. Kinetic Studies

The biosorption kinetics of the phenolic compounds from the CS tannin extract in all treated BSY showed a fast equilibrium time (40 min), with a high biosorption rate occurring in the first 20 min. This high rate of adsorption suggests that the process occurs mainly on the surface of the biosorbent. Table 1 summarizes the kinetic parameters obtained by fitting Pseudo 1st Order, Pseudo 2nd Order, and Elovich models to the data on the biosorption of the CS tannin extract by BSY. None of the kinetic models presented a good fit to the experimental data of ACID BSY, excluding this approach. By contrast, the Pseudo 2nd Order model provided the best fit for the biosorption data of LIO BSY, IMOB BSY, and ALK BSY, with adjusted R2 values of 0.9672, 0.9368, and 0.8991, respectively, suggesting that the biosorption of tannins by BSY mainly occurs chemically. This kinetic model also showed superior performance for the kinetics of the biosorption of yerba mate [4] and grape pomace [8] phenolic compounds by BSY. The maximum theoretical biosorption capacities (qe = 23.00 ± 0.05, 13.60 ± 0.15, and 16.0 ± 0.05 (mg TAE g BSY−1)) were consistent with the experimental values (qe exp = 22.96 ± 0.08, 13.58 ± 0.05, and 16.96 ± 0.08 (mg TAE g BSY−1)) and highlight LIO BSY as the best biosorbent approach with a removal efficiency of 72.4 ± 4.2%. Furthermore, the k2 values suggest rapid biosorption with minimal mass transfer resistance. The observed differences between the treated BSY treatments are likely attributable to the varying abilities of individual phenolic compounds with diverse structures in the CS tannin extract to bind to the available sites on the biosorbent.

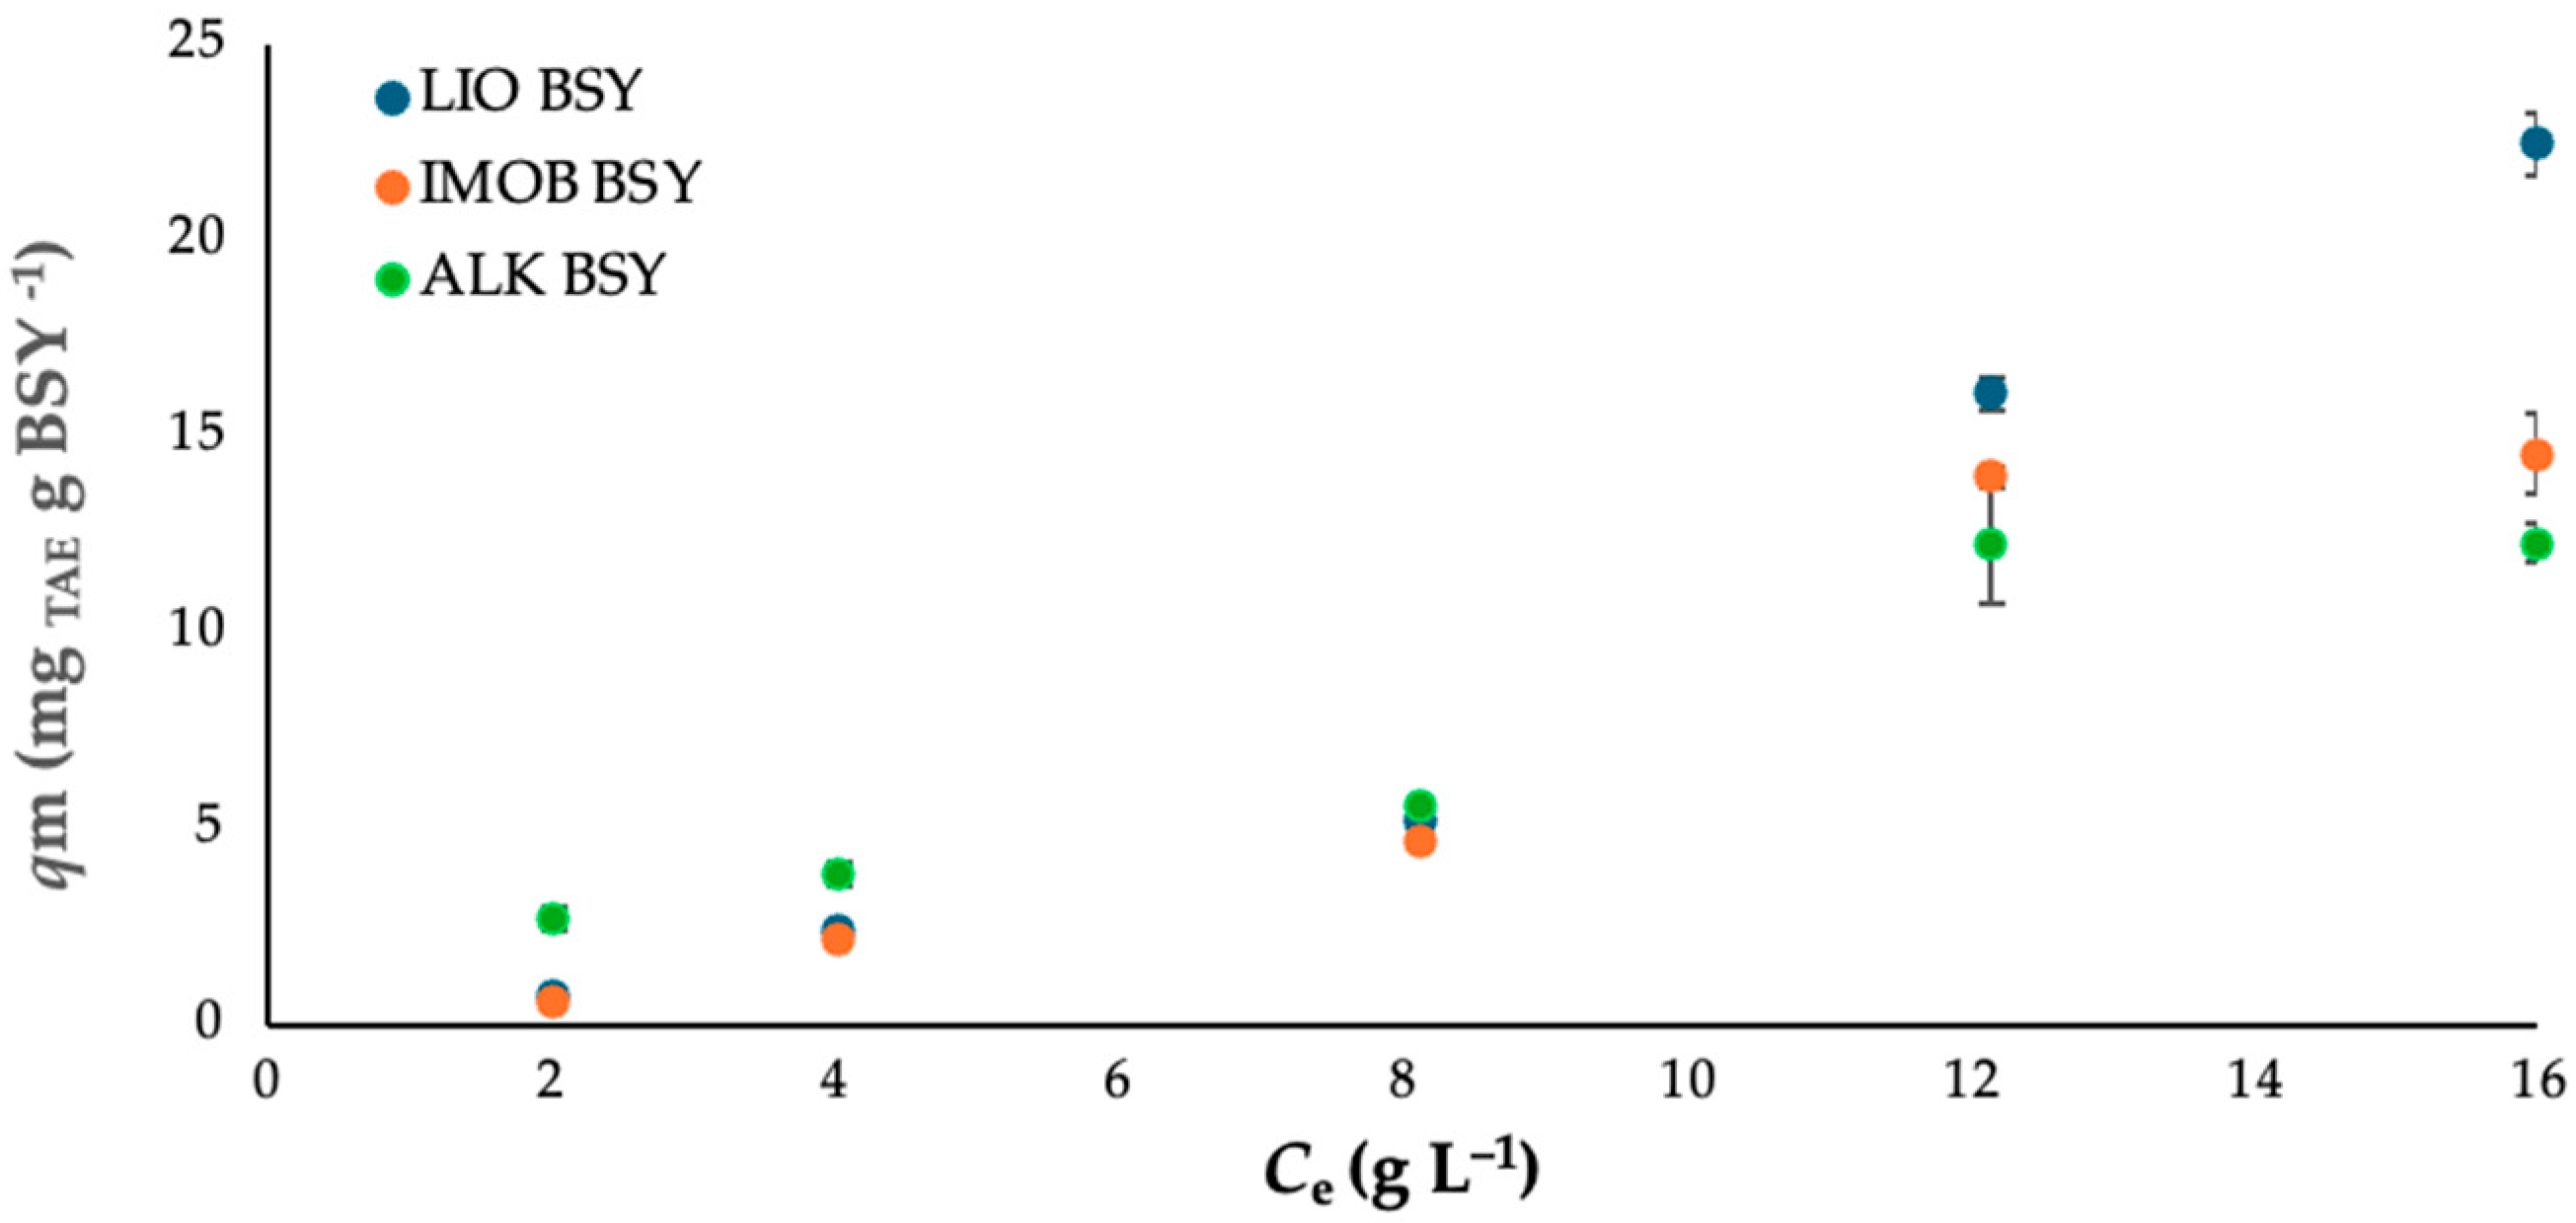
3.3. Equilibrium Studies

In these studies, the Sips isotherm model was employed to evaluate the equilibrium in the biosorption process of the CS tannin extract with treated BSY. As shown in Figure 1, an adsorbent rate higher than 12 g for ALK BSY (or IMOB BSY) (L⁻1) did not result in significant adsorption improvements, likely due to the binding of nearly all the tannins (and other phenolic compounds) and the establishment of an equilibrium between the adsorbed and soluble molecules in the CS tannin extract. Conversely, higher concentrations of LIOF BSY (up to 16 g L⁻1) enabled a greater biosorption capacity for the CS tannin extract. The Sips model showed a good correlation coefficient (R2 of 0.9901, 0.9827, and 0.9205) and predicted a maximum qm of 22.5 ± 0.82 mg TAE g BSY−1, 13.60 ± 0.15 mg TAE g BSY−1, and 12.30 ± 0.50 mg TAE g BSY−1 for LIOF BSY, IMOB BSY, and ALK BSY, respectively.

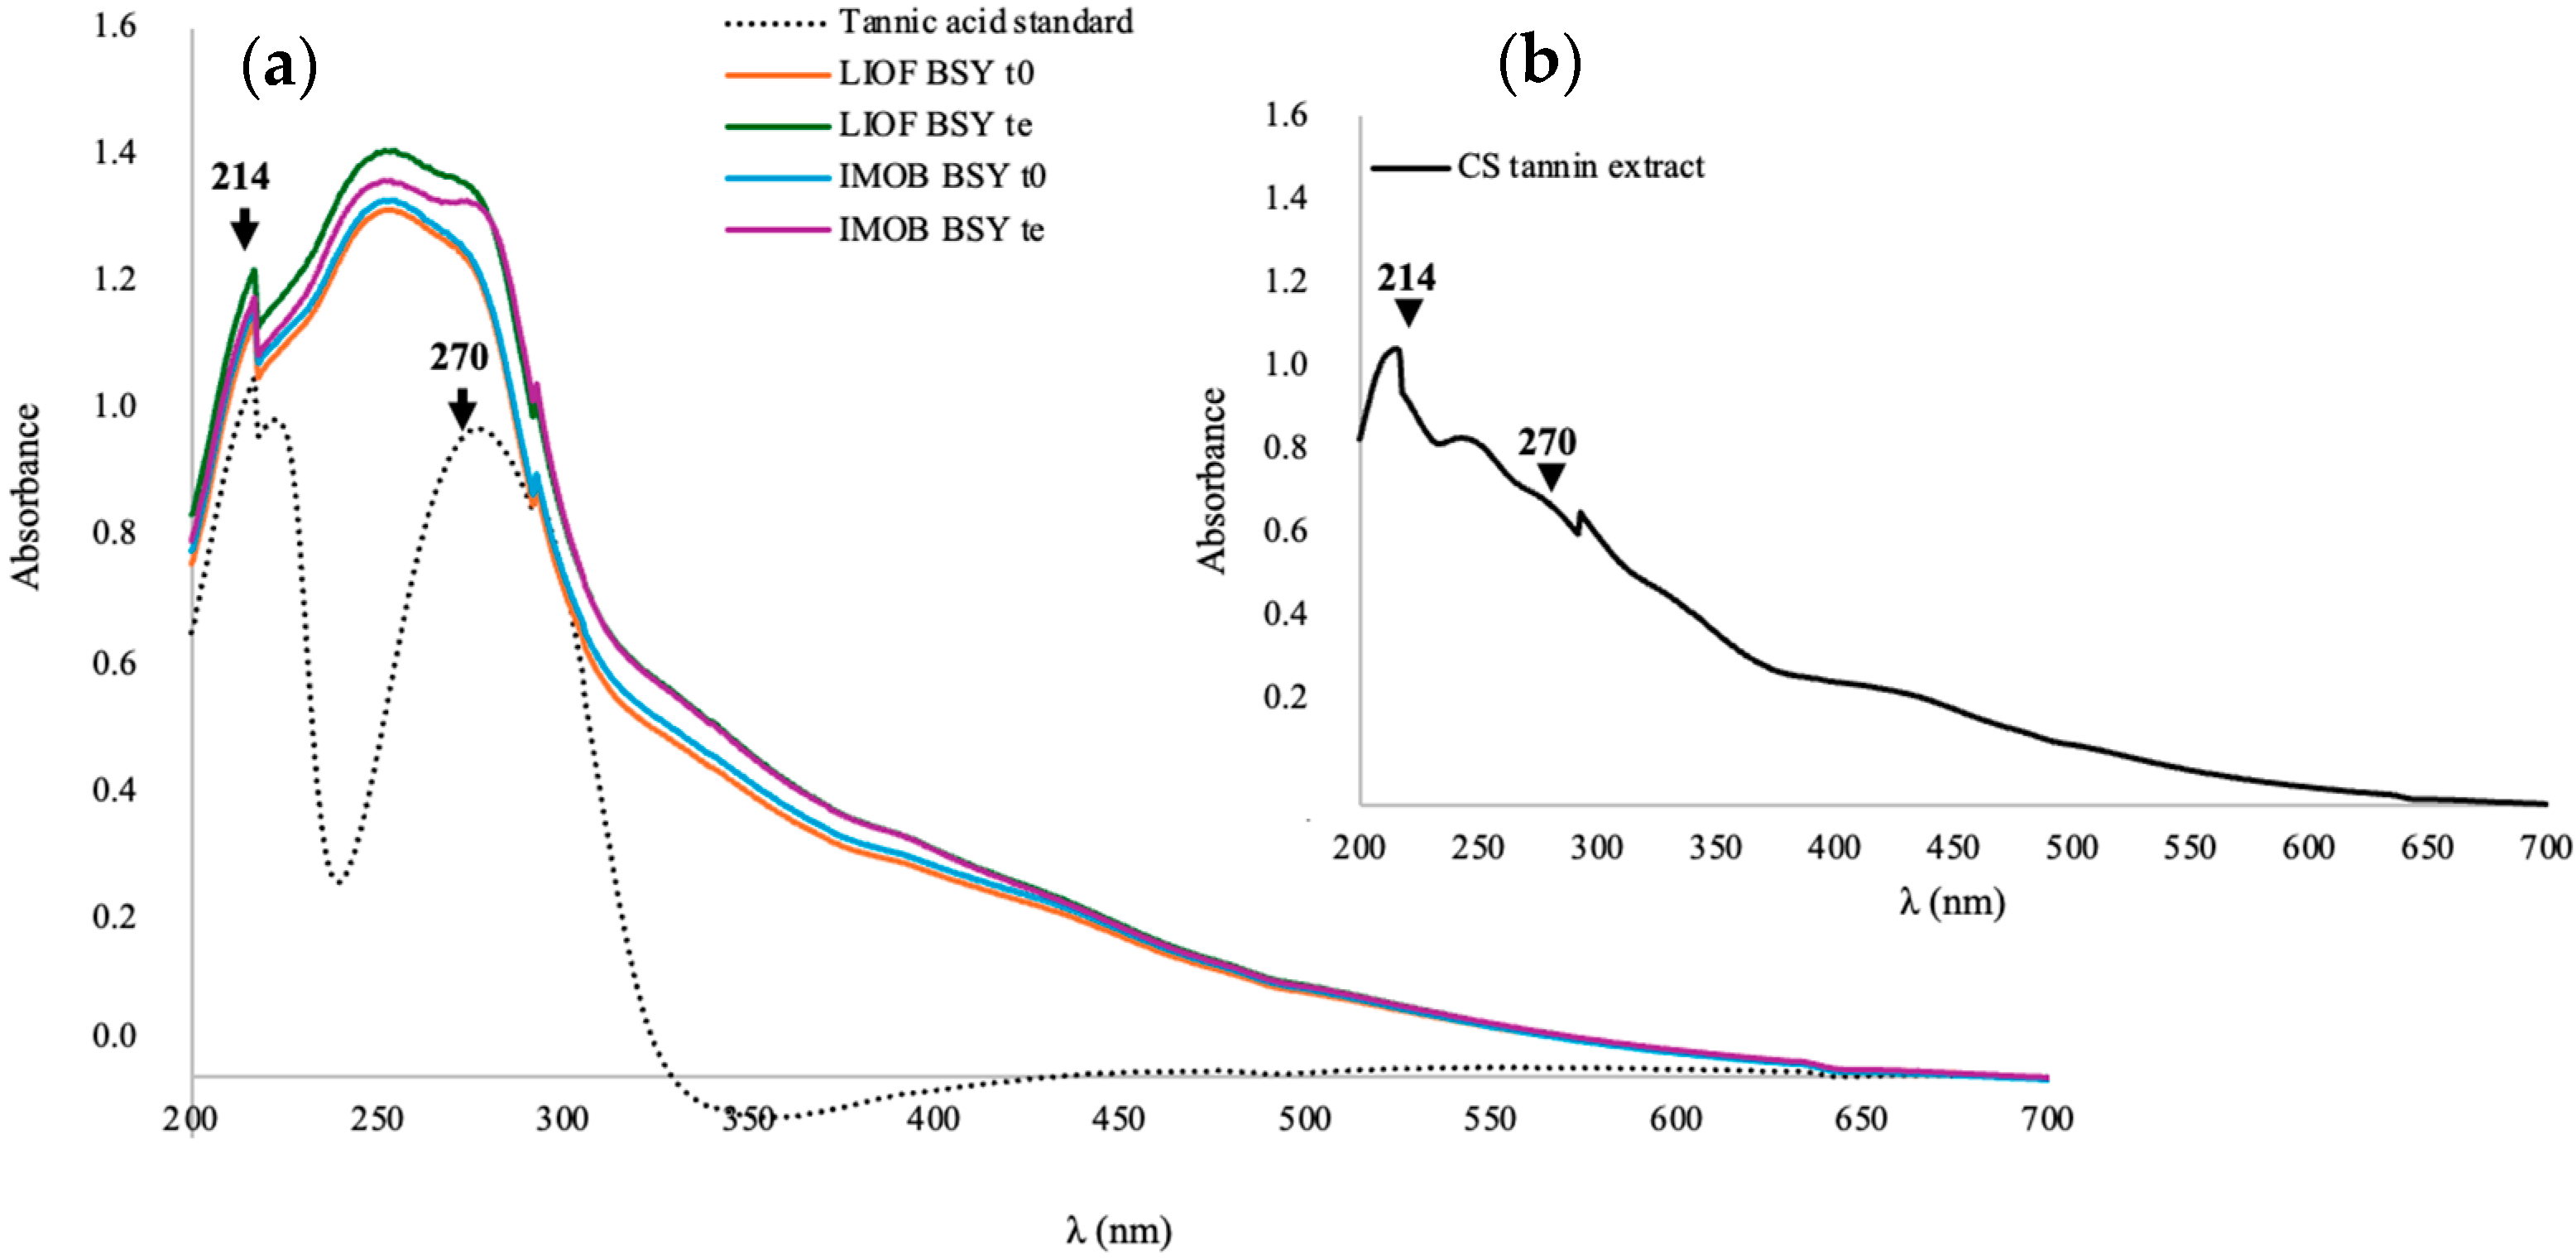
3.4. UV-VIS Spectrometry
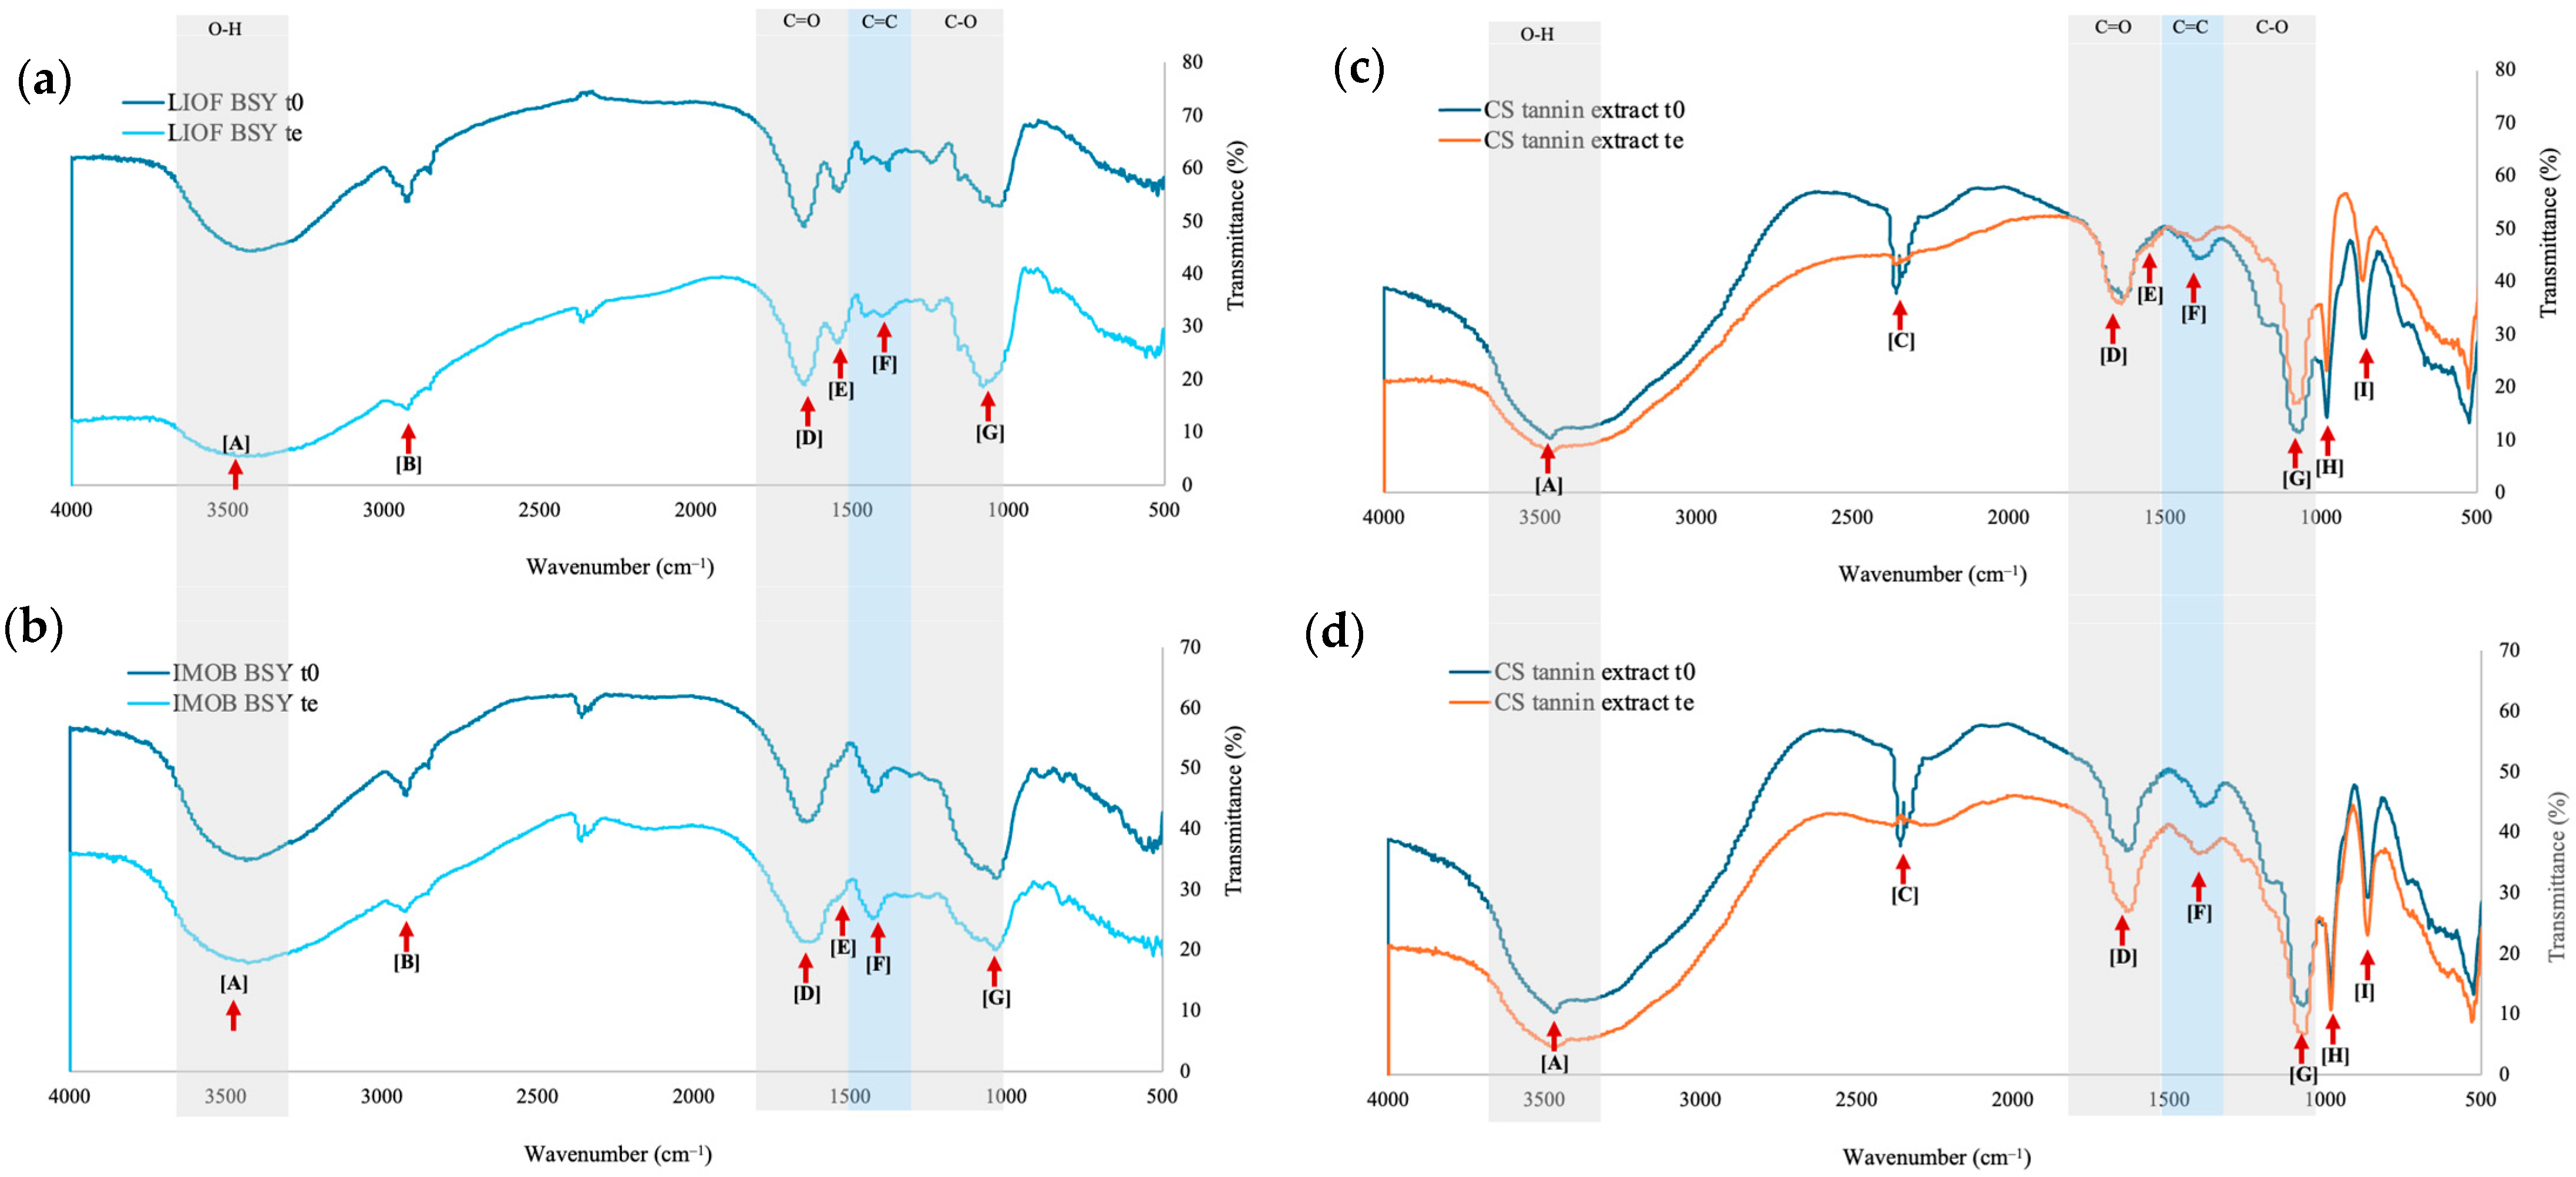
The UV-VIS spectra of the tannic acid standard used in the TPC spectrophotometric method exhibited two isosbestic points at 214 nm and 270 nm. These forms of tannic acid were also present in the CS tannin extract used for the adsorption studies (Figure 2b), along with additional peaks likely corresponding to oxidized forms of phenolic compounds generated during the alkaline treatment of chestnut shells. As shown in Figure 2a, an increase in the absorbance area of the peaks at 214 nm and 270 nm was observed after 40 min of equilibrium contact between the CS tannin extract and LIOF BSY or IMOB BSY, indicating that biosorption had occurred. This increase was more pronounced for LIOF BSY.

3.5. FT-IR

The FT-IR spectra of LIOF BSY and IMOB BSY before and after the biosorption of the CS tannin extract are shown in Figure 3. The data suggest that both LIOF BSY and IMOB BSY can effectively absorb tannins from the CS extract. Although the spectral changes in both types of yeast were similar, LIOF BSY showed greater intensity, indicating a higher biosorption capacity. This difference may be due to lyophilization, which increases the porosity of the yeast cell wall, making it easier for tannins to bind. In contrast, in IMOB BSY, tannins may have limited access to binding sites due to the presence of alginate, leading to a lower absorption capacity. The FT-IR spectral changes also suggest that various functional groups, such as hydroxyl, amino, phosphate, and protein groups, are involved in the biosorption process. The appearance of new peaks indicates that other components of the CS tannin extract, like organic acids and sugars, may also be adsorbed by BSY. The data also show that tannins and other compounds in the CS tannin extract interact with LIOF BSY and IMOB BSY, causing changes in the yeast cell absorption bands and shifts in the characteristic bands. The main changes observed include the following: (i) There was a decrease in the 3460 cm−1 band (band A), associated with hydroxyl (-OH) stretching vibrations. This suggests an interaction between the yeast wall and biomolecules in the CS tannin extract, possibly the formation of hydrogen bonds or hydrophobic interactions between the tannins’ hydroxyl groups and the yeast cell wall (mainly glucans and mannans). This is consistent with other studies on phenolic compound biosorption by BSY [4,5]. (ii) There was also a reduction in the 1546 cm−1 band (band D), which represents the amide II functional group, indicating a possible chemical interaction between the yeast surface and phenolic compounds (tannins), and (iii) a decrease in the 1449 cm−1 band (band E), related to C-H vibrations.

4. Conclusions

The highest biosorption capacity for the Chestnut shells tannin extract was observed in Brewer´s spent yeast subjected to lyophilization. The Sips isotherm model provided a good fit for the studied systems, indicating that the biosorption of tannins onto residual yeast cells is a chemisorption process. The Fourier Transform Infrared Spectroscopy analysis identified various functional groups in the spent yeast, with carboxyl, amino/hydroxyl, and amide groups playing a primary role in tannin biosorption. These findings highlight that spent yeast, a significant by-product of the brewing industry, serves as an effective biosorbent for tannins from a disposal solution resulting from cellulosic material extraction from chestnut shells. Further research is required to elucidate the specific interaction mechanisms and explore the practical uses of tannin-enriched brewer´s spent yeast.

Author Contributions

E.F.V.: Conceptualization, supervision, investigation, methodology, writing—original draft and review and editing. T.A.: Formal analysis, data curation, writing—review and editing. R.F.: Formal analysis, writing—review and editing. C.D.-M.: Resources, writing—review and editing. All authors have read and agreed to the published version of the manuscript.

Funding

This work received financial support from the project Chestfilm—Valorização de resíduos sólidos do processamento da castanha: extração de biopolímeros e preparação de filmes biodegradáveis (Ref. PD21-00024), supported by national funds from the Fundação “la Caixa” with BPI collaboration and partnered with the Fundação para a Ciência e Tecnologia (FCT) 4ª Edição do Programa Promove—Concurso 2022—o Futuro do Interior, co-supported by the Fundo Europeu de Desenvolvimento Regional (FEDER) through COMPETE 2020—Programa Operacional Competitividade e Internacionalização (POCI-01-0145-FEDER-029277).

Institutional Review Board Statement

Not applicable.

Informed Consent Statement

Not applicable.

Data Availability Statement

No new data were created or analyzed in this study. Data sharing is not applicable to this article.

Acknowledgments

Elsa F. Vieira thanks the FCT (Fundação para a Ciência e Tecnologia) for funding through the Scientific Employment Stimulus Individual Call (DOI 10.54499/CEECIND/03988/2018/CP1545/CT0006).

Conflicts of Interest

Ricardo Ferraz was employed by the company (RISE-Health). The remaining authors declare that the research was conducted in the absence of any commercial or financial relationships that could be construed as a potential conflict of interest.

References

  1. Ferreira, I.M.P.L.V.O.; Pinho, O.; Vieira, E.; Tavarela, J.G. Brewer’s Saccharomyces yeast biomass: Characteristics and potential applications. Trends Food Sci. Technol. 2010, 21, 77–84. [Google Scholar] [CrossRef]
  2. Ribeiro, V.R.; Fernandes, I.D.A.A.; Mari, I.P.; Stafussa, A.P.; Rossetto, R.; Maciel, G.M.; Haminiuk, C.W.I. Bringing together Saccharomyces cerevisiae and bioactive compounds from plants: A new function for a well-known biosorbent. J. Funct. Foods 2019, 60, 103433. [Google Scholar] [CrossRef]
  3. Jilani, H.; Cilla, A.; Barberá, R.; Hamdi, M. Biosorption of green and black tea polyphenols into Saccharomyces cerevisiae improves their bioaccessibility. J. Funct. Foods 2015, 17, 11–21. [Google Scholar] [CrossRef]
  4. Ribeiro, V.R.; Maciel, G.M.; Fachi, M.M.; Pontarolo, R.; Fernandes I de, A.A.; Stafussa, A.P.; Haminiuk, C.W.I. Improvement of phenolic compound bioaccessibility from yerba mate (Ilex paraguariensis) extracts after biosorption on Saccharomyces cerevisiae. Food Res. Int. 2019, 126, 108623. [Google Scholar] [CrossRef] [PubMed]
  5. Rossetto, R.; Maciel, G.M.; Bortolini, D.G.; Ribeiro, V.R.; Haminiuk, C.W.I. Acai pulp and seeds as emerging sources of phenolic compounds for enrichment of residual yeasts (Saccharomyces cerevisiae) through biosorption process. LWT-Food Sci. Technol. 2020, 128, 109447. [Google Scholar] [CrossRef]
  6. Maroldi, W.V.; Maciel, G.M.; Rossetto, R.; Bortolini, D.G.; Fernandes I de, A.A.; Haminiuk, C.W.I. Biosorption of phenolic compounds from Plinia cauliflora seeds in residual yeast: Kinetic, equilibrium, and bioaccessibility studies. J. Food Process Preserv. 2022, 46, e17156. [Google Scholar] [CrossRef]
  7. Jilani, H.; Cilla, A.; Barberá, R.; Hamdi, M. Improved bioaccessibility and antioxidant capacity of olive leaf (Olea euro-paea L.) polyphenols through biosorption on Saccharomyces cerevisiae. Ind. Crops Prod. 2016, 84, 131–138. [Google Scholar] [CrossRef]
  8. Rubio, F.T.V.; Maciel, G.M.; da Silva, M.V.; Corrêa, V.G.; Peralta, R.M.; Haminiuk, C.W.I. Enrichment of waste yeast with bioactive compounds from grape pomace as an innovative and emerging technology: Kinetics, isotherms and bioaccessibility. Innov. Food Sci. Emerg. Technol. 2018, 45, 18–28. [Google Scholar] [CrossRef]
  9. Mirmahdi, R.S.; Mahoozi, T.; Zoghi, A.; Montazeri, N.; Khosravi-Darani, K. The roles of Saccharomyces cerevisiae on the bioaccessibility of phenolic compounds. World J. Microbiol. Biotechnol. 2024, 40, 1–9. [Google Scholar] [CrossRef] [PubMed]
  10. Pinto, D.; Vieira, E.F.; Peixoto, A.F.; Freire, C.; Freitas, V.; Costa, P.; Delerue-Maros, C.; Rodrigues, F. Optimizing the extraction of phenolic antioxidants from chestnut shells by subcritical water extraction using response surface methodology. Food Chem. 2021, 334, 127521. [Google Scholar] [CrossRef] [PubMed]
  11. Amaral, L.; Rodrigues, F.; Silva, A.; Costa, P.; Delerue-Matos, C.; Vieira, E.F. Reinforcement of starch film with Castanea sativa shells polysaccharides: Optimized formulation and characterization. Food Chem. 2022, 396, 133609. [Google Scholar] [CrossRef] [PubMed]
  12. Paz, M.; Gúllon, P.; Barroso, M.F.; Carvalho, A.P.; Domingues, V.F.; Gomes, A.M.; Becker, H.; Longhinotti, E.; Delerue-Matos, C. Brazilian fruit pulps as functional foods and additives: Evaluation of bioactive compounds. Food Chem. 2015, 172, 462–468. [Google Scholar] [CrossRef] [PubMed]
  13. Aimone, C.; Grillo, G.; Boffa, L.; Giovando, S.; Cravotto, G. Tannin extraction from chestnut wood waste: From lab scale to semi-industrial plant. Appl. Sci. 2023, 13, 2494. [Google Scholar] [CrossRef]
  14. De Rossi, A.; Rigueto, C.V.T.; Dettmer, A.; Colla, L.M.; Piccin, J.S. Synthesis, characterization, and application of Saccharomyces cerevisiae/alginate composites beads for adsorption of heavy metals. J. Environ. Chem. Eng. 2020, 8, 104009. [Google Scholar] [CrossRef]
  15. Stafussa, A.P.; Maciel, G.M.; Da Silva Anthero, A.G.; Da Silva, M.V.; Zielinski, A.A.F.; Haminiuk, C.W.I. Biosorption of anthocyanins from grape pomace extracts by waste yeast: Kinetic and isotherm studies. J. Food Eng. 2016, 169, 53–60. [Google Scholar] [CrossRef]
  16. Low, M.J.D. Kinetics of Chemisorption of Gases on Solids. Chem. Rev. 1960, 60, 267–312. [Google Scholar] [CrossRef]
  17. Sips, R. On the Structure of a Catalyst Surface. J. Chem. Phys. 1948, 16, 490–495. [Google Scholar] [CrossRef]
Figure 1. Equilibrium results (Sips model) for biosorption of tannins present in CS tannin extract with BSY (biosorption time of 40 min).
Engproc 87 00021 g001
Figure 2. UV-Vis spectra of (a) tannic acid standard solution (25 mg L−1) and LIOF BSY and IMOB BSY’s intracellular content (at same concentration of 1 mg mL−1) before (t = 0) and after 40 min of equilibrium biosorption contact with CS tannin extract; (b) CS tannin extract (25 mg L−1).
Engproc 87 00021 g002
Figure 3. FT-IR spectra of (a) LIOF BSY before (t0) and after biosorption studies (te, equilibrium time); (b) IMOB BSY before (t0) and after biosorption studies (te); (c) CS tannin extract before (t0) and after biosorption studies (te) with LIOF BSY; (d) CS tannin extract before (t0) and after biosorption studies (te) with IMOB BSY.
Engproc 87 00021 g003
Table 1. Parameters of kinetic models for BSY subjected to different treatments in contact with CS tannin extract.
ModelParametersLIOF BSYIMOB BSY ALK BSY ACID BSY
Pseudo 1st Orderqe exp. (mg TAE g BSY−1)22.87 ± 0.4813.92 ± 0.2922.87 ± 0.487.96 ± 0.56
qe (mg TAE g BSY−1)23.01 ± 0.4114.02 ± 0.1016.01 ± 0.12
k1 (g BSY mg TAE−1 min−1)2.51 ± 0.501.80 ± 0.762.52 ± 0.12
Adjusted R2 0.93350.84240.84260.2231
Pseudo 2nd Orderqe exp. (mg TAE g BSY−1)22.96 ± 0.0813.58 ± 0.0516.96 ± 0.087.09 ± 0.04
qe (mg TAE g BSY−1)23.00 ± 0.0513.60 ± 0.1516.0 ± 0.05
k2 (g BSY mg TAE−1 min−1)5.0 ± 0.405.5 ± 2.045.2 ± 0.76
Adjusted R2 0.96720.93680.89910.6533
Elovichα (g BSY mg TAE−1 min−1) 1.0 × 10²¹ ± 1.0 × 10⁸ 2.1 × 10¹⁷ ± 0.972.3 × 1012 ± 0.66
β (mg TAE g BSY−1) 2.3 ± 0.633.1 ± 0602.3 ± 0.65
Adjusted R2 0.91200.88060.85260.0250
qe is the sorption capacity (mg g−1) at time t and at equilibrium; k1 and k2 (g mg−1 min−1) are the rate constants of the Pseudo 1st Order and Pseudo 2nd Order models; R2 is the adjusted R-Square correlation coefficient; α is the Elovich constant related to the initial biosorption rate; and β is the Elovich constant related to the desorption rate. —: data did not fit significantly to the model.
Disclaimer/Publisher’s Note: The statements, opinions and data contained in all publications are solely those of the individual author(s) and contributor(s) and not of MDPI and/or the editor(s). MDPI and/or the editor(s) disclaim responsibility for any injury to people or property resulting from any ideas, methods, instructions or products referred to in the content.

