Proceeding Paper

Electrochemical Genosensors as a New Approach to Plant DNA Detection and Quantification for Honey Authentication †

by
Stephanie L. Morais
1,
Michelle Castanheira
1,
Marlene Santos
2,
Valentina F. Domingues
1,
Cristina Delerue-Matos
1 and
M. Fátima Barroso
1,*
1
REQUIMTE|LAQV, Instituto Superior de Engenharia do Porto, Instituto Politécnico do Porto, Rua Dr. António Bernardino de Almeida, 431, 4249-015 Porto, Portugal
2
REQUIMTE|LAQV, Escola Superior de Saúde, Instituto Politécnico do Porto, Rua Dr. António Bernardino de Almeida, 400, 4200-072 Porto, Portugal
*
Author to whom correspondence should be addressed.
Presented at the 11th International Electronic Conference on Sensors and Applications (ECSA-11), 26–28 November 2024; Available online: https://sciforum.net/event/ecsa-11.
Eng. Proc. 2024, 82(1), 79; https://doi.org/10.3390/ecsa-11-20353
Published: 25 November 2024

Abstract

:
Honey is a natural sweet food product with multiple nutritional and medicinal properties, making it a healthy alternative to processed sugars. With the consumers’ recent interest and purchase of dietary products, the global honey market has greatly increased. To keep up with production or simply for financial gain, some producers/companies are now blending pure honey with cheaper substances that possess similar physical characteristics. As there are no notable visible differences between pure and adulterated honey, it is extremely difficult to determine the purity of the available honeys. In this study, an electrochemical genosensor based on the sandwich format DNA hybridization reaction between two complementary probes was developed for the detection and quantification of Erica arborea pollen DNA in real samples. Analyzing public database platforms, a 98 base-pair DNA-target probe capable of unequivocally detecting the pollen from E. arborea was selected and designed. The complementary probe to the DNA-target oligonucleotide sequence was then cut into a 28-base-pair thiolated DNA-capture probe and a 70-base-pair fluorescein isothiocyanate-labelled DNA-signaling probe. To increase the hybridization reaction, a self-assembled monolayer formed from mixing the DNA-capture probe with mercaptohexanol was employed. Using chronoamperometry, the enzymatic amplification of the electrochemical signal was achieved with a concentration range of 0.03 to 2.00 nM. The DNA from certified E. arborea leaves was extracted using liquid nitrogen and mechanical grinding, and the targeted region was amplified by PCR. The developed genosensor was successfully applied for the detection and quantification of the DNA concentration of the extracted E. arborea plant leaves. Therefore, the developed genosensor is a promising, cost-effective, and innovative analytical method to detect and quantify the DNA concentration of plant DNA in real honey samples.

1. Introduction

Food fraud is a growing concern for the food industry [1]. This fraudulent practice occurs when food producers and/or suppliers intentionally deceive their customers about the quality and/or composition of the food they distribute [2]. It is predicted that food fraud affects the global food industry by approximately EUR 30 billion annually [2,3]. In the European Union, honey is among the most adulterated products found in the market, with a revenue loss of about EUR 600 million worldwide [2].
As a natural sweet food with a rich nutritional composition and multiple health benefits (e.g., anti-inflammatory, antioxidant, and antimicrobial properties), honey is often consumed as a healthy alternative to processed sugars [4]. Nevertheless, its nutritional composition differs depending on the climate, soil, altitude, production method, and pollen source, consequently affecting its health benefits and market value [5]. Therefore, the price of honey differs significantly depending on its botanical and geographical origins since different origins affect the quality, flavor, and/or health benefits that they exhibit [6]. This makes honey vulnerable to adulteration [7,8].
To keep up with consumers’ demand, or simply for monetary gain, some producers resort to fraudulent acts such as the adulteration of high-quality honey with lower-quality substances and the mislabeling of its origin and nutritional profile, compromising the safety and quality of honey [7,8,9]. Therefore, safeguarding the consumers’ interests and promoting the sustainable growth of the food industry hinges on combating food fraud. Hence, food authenticity is an important field in food safety and quality control, especially amidst the expanding global market and intricate agri-food production systems [6,9].
Several techniques have been employed (e.g., stable carbon isotope ratio analysis, gas and liquid chromatography, nuclear magnetic resonance spectroscopy, infrared spectroscopy, etc.); nonetheless, honey authentication is a complex process [10]. Normally, melissopalynology is employed to identify the botanical provenance of honey and to learn more about its geographical origins. However, due to the variety of certain plant species’ pollen morphology, this assay is time-consuming and requires skilled professionals with substantial expertise [10,11].
In this study, an electrochemical genosensor capable of detecting Erica arborea (white heather flower) pollen DNA with high sensibility and selectiveness was developed. A sandwich hybridization format was chosen to enhance the sensor’s selectivity and avoid the formation of secondary structures. Therefore, the sensor’s methodology consisted of a sandwich hybridization between a complementary 28-mer DNA sequence (designated as the DNA-capture probe) attached to the surface of a screen-printed gold electrode (SPGE) and a 98-mer E. arborea oligonucleotide sequence. For a complete hybridization, another complementary 70-mer DNA sequence (designated as the DNA-signaling probe) to the white heather flower was designed using a fluorescein isothiocyanate (FITC), to which anti-fluorescein antibodies labeled with horseradish peroxidase (POD) enzymes were attached. The enzymatic amplification of the analytical signal was obtained by chronoamperometry using a POD/H2O2 system. A linear relationship between electrochemical intensity and DNA concentration was observed when DNA concentrations ranged from 0.03 to 2.00 nM. The developed sensor was applied to the detection of the DNA from real E. arborea plant samples with promising results. This sensor will hopefully determine the geographic botanic origin of honeys and facilitate honey food safety and control.

2. Materials and Methods

2.1. Reagents and Solutions

3,3′,5,5′ tetramethylbenzidine (TMB), 6-mercapto-1-hexanol (MCH), and 20× sodium phosphate-EDTA (200 mM sodium phosphate, 3 M NaCl, 20 mM EDTA) solution (20× SSPE) were attained from Sigma Aldrich (Mannheim, Germany); the phosphate-buffered saline (PBS) solution was purchased from Thermo Fisher Scientific (Rockford, IL, USA). Liquid nitrogen was used on the real E. arborea samples before extraction. Absolute ethanol was acquired from Carlo (Rouen, France) and the anti-fluorescein-peroxidase (anti-FITC-POD) was obtained from Roch Diagnostics (Basel, Switzerland).
Before use, the 20× SSPE buffer was diluted to a concentration of 2× using Milli-Q ultrapure water obtained from a Millipore purification system. All the reagents used in this assay were of analytical grade, so no purification was required.
For the DNA amplification by PCR, Taq Master Mix (2×), an optimized and ready-to-use PCR mixture of Taq DNA Polymerase, magnesium chloride (MgCl2) 2 mM, deoxynucleotide triphosphates (dNTPs), and PCR water were used. PCR Mastermix and water were acquired from Bioron (Römerberg, Germany).

2.2. Apparatus and Electrodes

The electrochemical genosensors were assembled using an SPGE (C223BT, DropSens) from ΩMetrohm (Oviedo, Asturias, Spain). The SPGE functioned as an electrochemical transducer. Moreover, an Autolab potentiostat (PGSTAT101, ΩMetrohm, Herisau, Switherland) equipped with the NOVA 1.11.0 research software was used to measure all the electrochemical signals. The chronoamperograms were measured with a −0.1 V potential for 60 s, and the current intensity utilized for the analytical analysis corresponded to the average of the last 10 s of the recorded current measurement. All the measurements were carried out at room temperature (25 °C ± 1.0 °C).
An iron mortar and pestle were utilized to extract the DNA from inside the heather flower plant, and the DNA amplification of the targeted sequences was carried out using the conventional PCR technique. The design of the primers, specific nucleotide sequences that allow the amplification of the region of interest, was carried out using Primer-Blast (NCBI) [12] and purchased from Eurogentec (Seraing, Belgium). The protocol established by Bioron was employed for the preparation of the PCR mixtures, and the MyCycler™ thermal cycler from Bio-Rad Laboratories (Hercules, CA, USA) was used for the amplification of the samples.

2.3. Oligonucleotides and Real DNA Samples

The synthetic probes designed for this study (Table 1) were purchased from Eurogentec as a lyophilized salt. All the oligonucleotide stock solutions were stored at −20 °C after being resuspended to 100 nM using Milli-Q ultrapure water. Working oligonucleotides were made daily by diluting the necessary concentration in 2× SSPE.
E. arborea and Castanea sativa leaves were obtained from the Botanical Garden of Porto (Portugal). Their genomic DNA was extracted by mechanically shredding the plants with liquid nitrogen in an iron mortar. The samples from C. sativa (the European chestnut tree) were submitted to the same process and used as a negative control.

2.4. Electrochemical Genosensor Design

The construction of the electrochemical genosensor involved four steps: pretreatment, the sensing phase, the sandwich hybridization reaction, and electrochemical detection. Essentially, pretreatment consisted of cleaning the electrode’s surface. Prior to use, all electrodes were washed with approximately 500 µL of ethanol and water, followed by drying under a nitrogen stream.
Then, during the sensing phase, a self-assembled monolayer (SAM) interface was established between the DNA-capture probe and the MCH spacer to guarantee the vertical orientation of the DNA sequences. In the first step, the DNA-capture probe was immobilized onto the SPGE and stored in a humified chamber overnight. The next day, the modified SPGEs were rinsed with the SSPE 2× buffer to remove weakly attached DNA-capture probes, followed by the addition of 3 μL of MCH to the SPGE.
The hybridization reaction unfolds in a two-stage process. Initially, homogeneous hybridization occurs when the DNA-signaling probe connects to the DNA target. Subsequently, the partial hybridized DNA is added to the modified SPGE, enabling complete hybridization between all three DNA sequences.
After 60 min, the SPGEs are rinsed again with the buffer to eliminate any nonspecifically attached sequences. The sandwich hybridization format enhances assay selectivity by facilitating two distinct hybridization events: the homogenous hybridization between the target and the signaling probe and the subsequent binding of an anti-fluorescein antibody labeled with a horseradish enzyme to the fluorescein-labeled signaling probe.
To generate an ample electrochemical signal, POD enzymes were added onto the modified SPGEs, followed by a rinse after 30 min. Subsequently, the sensor was attached to the potentiostat, and 40 µL of TMB/H2O2 substrate was applied to the surface of the electrode for 1 min. The enzymatically oxidized product was then detected through chronoamperometry at –0.1 V for 60 s. The measurements were performed in triplicate for accuracy.

3. Results and Discussion

A sandwich format for the DNA-target probe was created using a semi-complementary fluorescein isothiocyanate-labeled DNA-signaling probe. To maximize the hybridization reaction, a mixed self-assembled monolayer of the heather-specific DNA-capture probe and mercaptohexanol was employed.

3.1. Optimization of the Analytical Parameters

The following analytical parameters were optimized: DNA, antibody, MCH concentrations, and incubation times. Table 2 summarizes the results of the optimization processes of the analytical parameters.

3.2. Analytical Characterization of the Optimized Genosensor

Using the selected values described in Table 2, the electrochemical genosensor was evaluated using the voltametric technique chronoamperometry. For this, increasing DNA-target concentrations ranging from 0.03 to 5.00 nM were measured. A linear relationship (R2 = 0.9981) between the blank-subtracted intensity current and the synthetic target concentration was obtained in the 0.03–2.00 nM range, with a slope and intercept value of 3.22 ± 0.03 (μA/nM) and 0.04 ± 0.01 (μA), respectively (Figure 1).

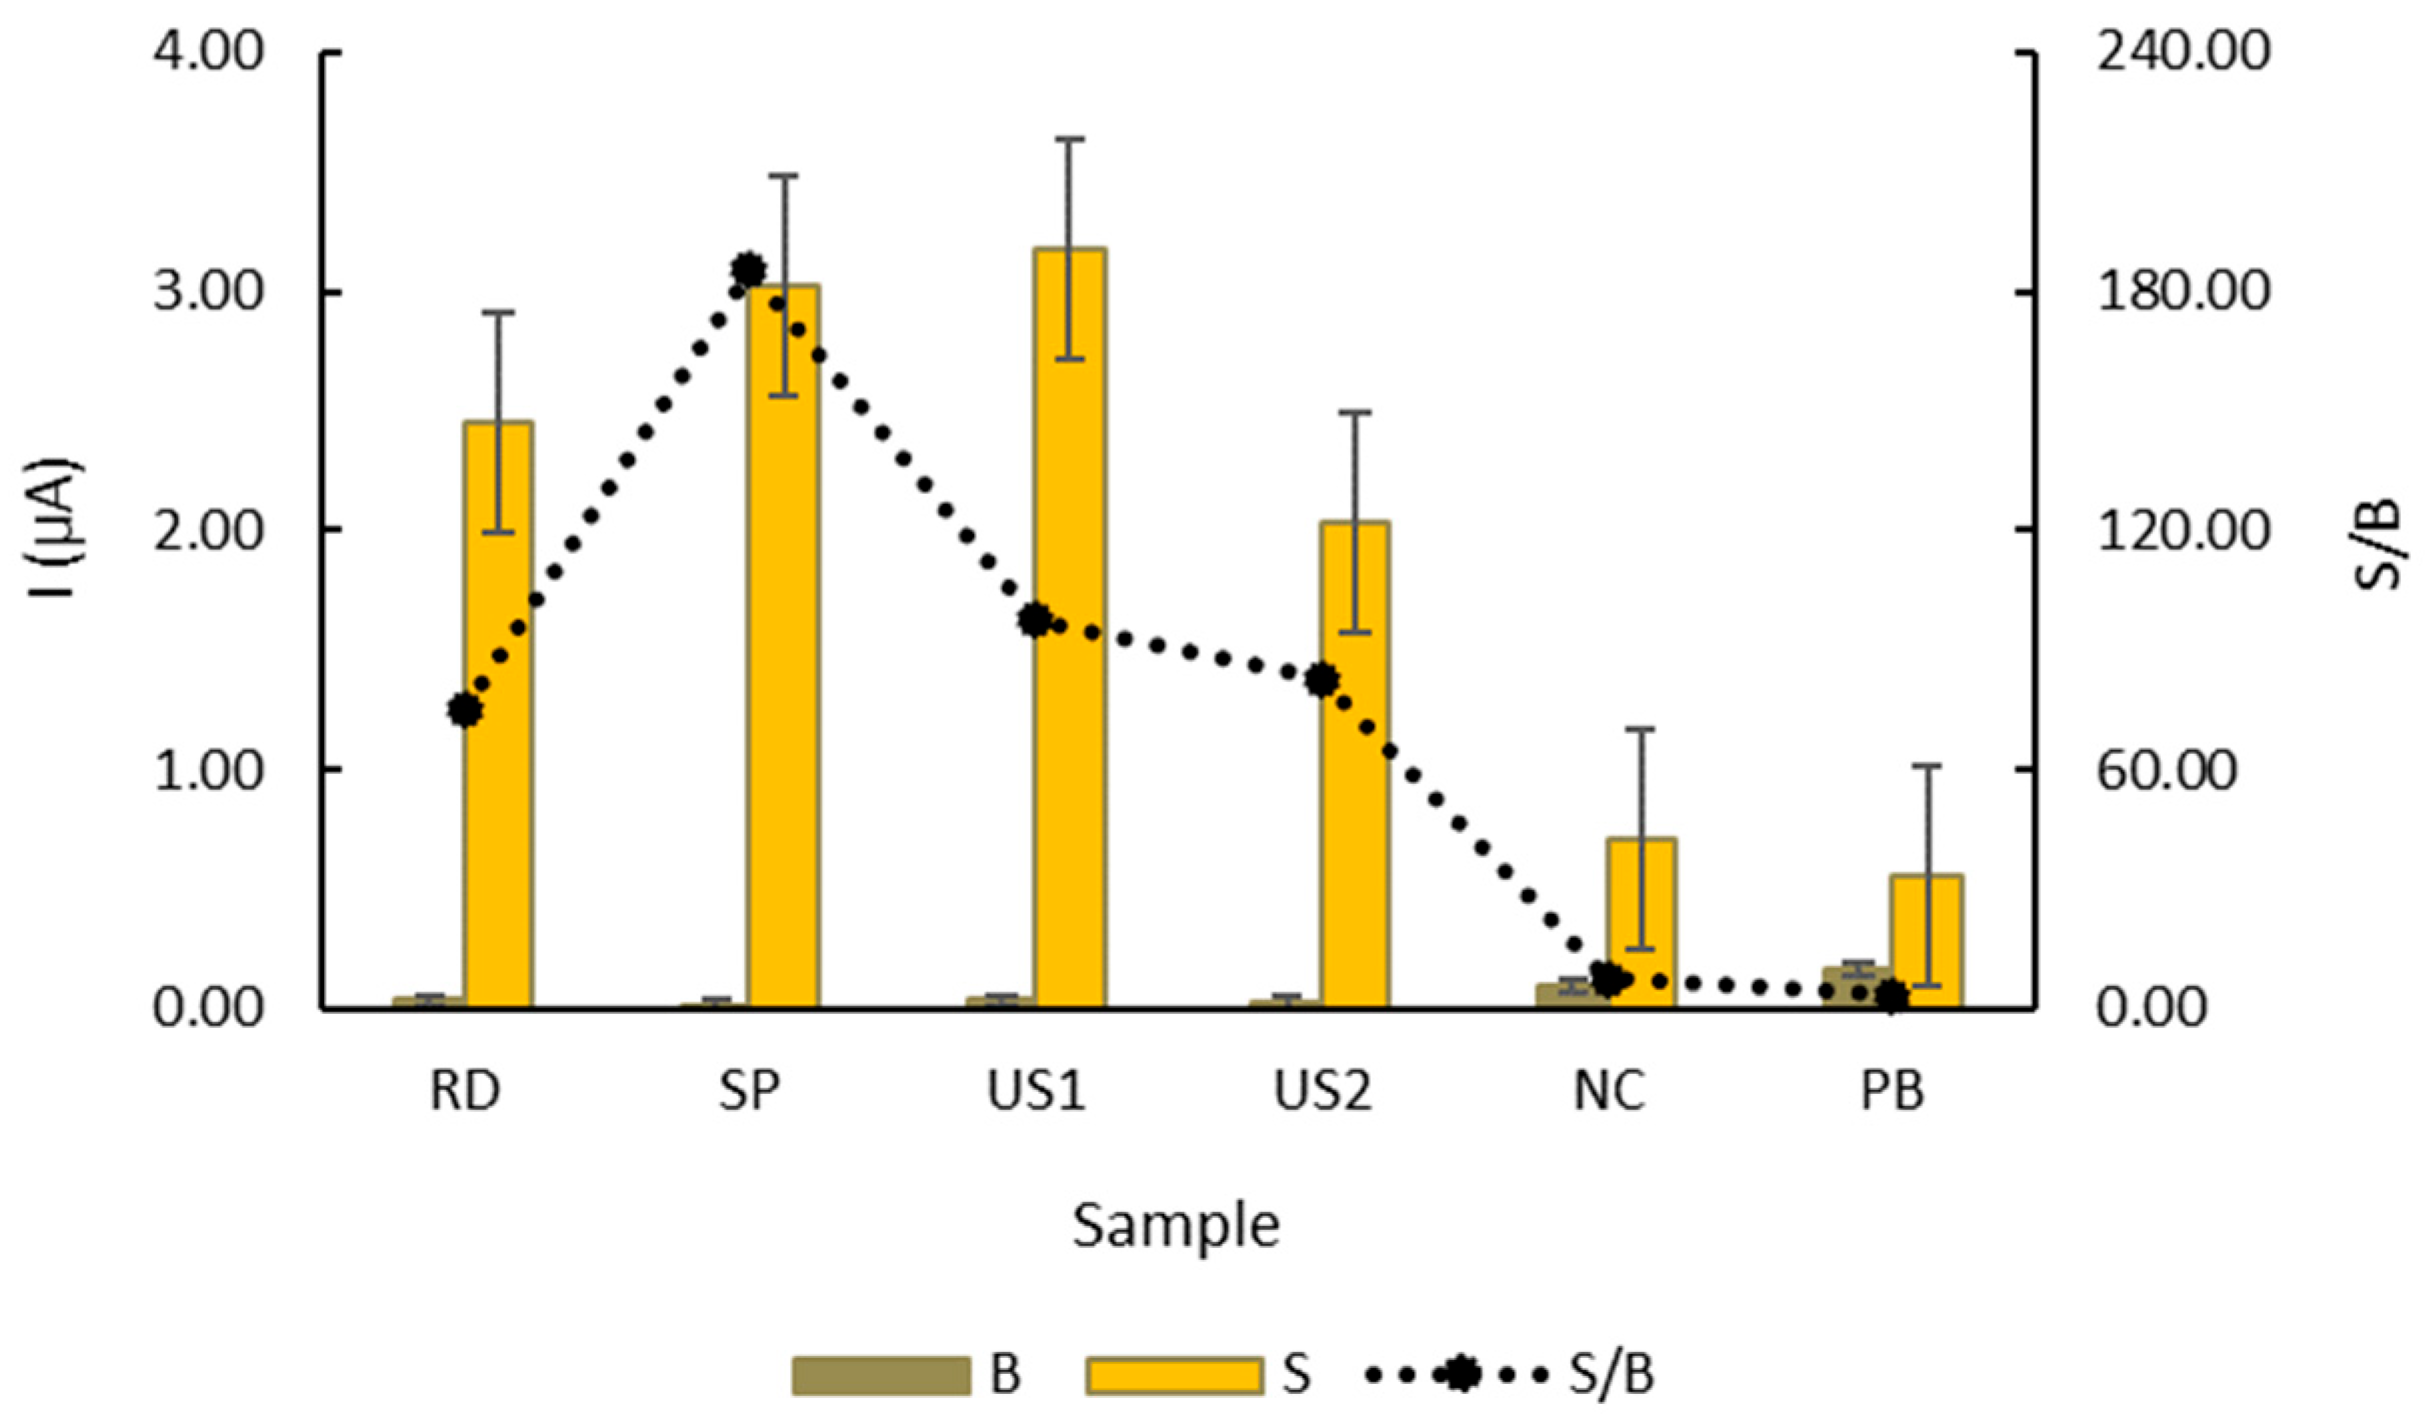
3.3. Evaluation of the Genosensor’s Selectivity

Afterward, the developed electrochemical genosensor was tested with PCR-amplified samples of genomic DNA obtained from the E. arborea samples (Figure 2). The amplification of the targeted DNA was previously completed using conventional PCR, according to the protocol established by Bioron (Römerberg, Germany).
Under the previous conditions, the target discrimination, i.e., the sensor’s selectivity, was analyzed by comparing the chronoamperometric intensities obtained in the absence or presence of the synthetic DNA-target probe (with a concentration of 1 nM), 1 nM of the amplified E. arborea genomic DNA (RD), two samples of E. arborea of varying concentrations—1.30 nM for sample US1 and 0.80 nM for sample US2—and with a noncomplementary DNA sample (NC) of another amplified plant species, C. sativa. Furthermore, to determine the influence of the primers on the developed electrochemical genosensor, a blank sample with the PCR products (PB) was also tested.
Also, analyzing the current intensity from the 1 nM genomic DNA sample (SP) to the 1 nM synthetic DNA probe, there is a 6.10% difference between the two. This difference is acceptable and within the calibration curve variation. The responses registered by samples US1 and US2 are also within the calibration curve.
The highest current intensity was observed for the E. arborea DNA sequence with 1.30 nM (US1), followed by the synthetic DNA-target probe (SP). Nevertheless, the synthetic DNA presented the highest S/B value. On the other hand, the current responses from the NC (C. sativa) and PB sequences presented the lowest current intensities. These results indicated that this sensor design is a viable option to identify E. arborea DNA in real honey samples.

4. Conclusions

The high sensitivity and selectivity of the disposable electrochemical genosensor were achieved by designing a self-assembled monolayer (thiolated DNA-capture probe and MCH spacer) and due to the design of the sandwich format assay, respectively. The amplification of the electrochemical signal conducted by the (POD) enzyme also influenced the genosensor’s performance.
The developed sensor was successfully employed for the detection and quantification of E. arborea plant samples. This genosensor was able to detect with great selectivity both the synthetic and genomic DNA of the Erica arborea samples at different concentrations.
All optimizations contributed to enhancing the sensor’s sensitivity. Thus, electrochemical genosensors are a promising, innovative, easy-to-use, and cost-effective tool to authenticate the origin of honeys, guaranteeing their quality and safety.

Author Contributions

Conceptualization, S.L.M., M.C., M.S., V.F.D., C.D.-M. and M.F.B.; Methodology, S.L.M., M.C., M.S., V.F.D., C.D.-M. and M.F.B.; Validation, S.L.M., M.C., M.S., V.F.D., C.D.-M. and M.F.B.; Formal analysis, S.L.M., M.S., V.F.D., C.D.-M. and M.F.B.; Investigation, S.L.M., M.C., M.S., V.F.D., C.D.-M. and M.F.B.; Resources, S.L.M., M.C., V.F.D., C.D.-M. and M.F.B.; Data curation, S.L.M., V.F.D., C.D.-M. and M.F.B.; Writing—original draft preparation, S.L.M., M.C., V.F.D., C. D-M., M.S. and M.F.B.; Writing—review and editing, S.L.M., M.C., M.S., V.F.D., C.D.-M. and M.F.B.; Supervision, V.F.D., C.D.-M. and M.F.B.; Project administration, M.F.B.; Funding acquisition, C.D.-M. and M.F.B. All authors have read and agreed to the published version of the manuscript.

Funding

This work received financial support from national funds (FCT/MCTES, Fundação para a Ciência e Tecnologia and Ministério da Ciência, Tecnologia e Ensino Superior) through project MTS/SAS/0077/2020—“Honey+—New reasons to care honey from the Natural Park of Montesinho: A bioindicator of environmental quality & its therapeutic potential” and through the projects UIDB/50006/2020 and UIDP/50006/2020.

Informed Consent Statement

Not applicable.

Data Availability Statement

Data is contained within the paper. Further inquiries can be directed to the corresponding author.

Acknowledgments

MFB thanks Fundação para a Ciência e a Tecnologia (FCT) for the FCT Investigator (2020.03107.CEECIND). Stephanie Morais (2023.028929.BD) and Michelle Castanheira (2023.05159.BDANA) are grateful to FCT and the European Union (EU) for their grants financed by POPH-QREN-Tipologia 4.1-Formação Avançada, funded by Fundo Social Europeu (FSE) and Ministério da Ciência, Tecnologia e Ensino Superior (MCTES).

Conflicts of Interest

The authors declare no conflicts of interest.

References

  1. Brooks, C.; Parr, L.; Smith, J.M.; Buchanan, D.; Snoich, D.; Hebishy, E. A review of food fraud and food authenticity across the food supply chain, with an examination of the impact of the COVID-19 pandemic and Brexit on food industry. Food Control 2021, 130, 108171. [Google Scholar] [CrossRef]
  2. Euroactiv. Honeygate: How Europe Is Being Flooded with Fake Honey. 2020. Available online: https://www.euractiv.com/section/agriculture-food/news/honey-gate-how-europe-is-being-flooded-with-fake-honey/ (accessed on 1 September 2024).
  3. FAO STAT. Food and Agriculture Organization of the United Nations. 2020. Available online: https://www.fao.org/faostat/en/#data (accessed on 1 September 2024).
  4. Ramanauskiene, K.; Stelmakiene, A.; Briedis, V.; Ivanauskas, L.; Jakštas, V. The quantitative analysis of biologically active compounds in Lithuanian honey. Food Chem. 2012, 132, 1544–1548. [Google Scholar] [CrossRef] [PubMed]
  5. Tosun, M.; Keles, F. Investigation methods for detecting honey samples adulterated with sucrose syrup. J. Food Comp. Anal. 2021, 101, 103941. [Google Scholar] [CrossRef]
  6. Zhang, G.; Abdulla, W. On honey authentication and adulterant detection techniques. Food Control 2022, 138, 108992. [Google Scholar] [CrossRef]
  7. Fakhlaei, R.; Selamat, J.; Khatib, A.; Razis, A.F.A.; Sukor, R.; Ahmad, S.; Babadi, A.A. The Toxic Impact of Honey Adulteration: A Review. Foods 2020, 9, 1538. [Google Scholar] [CrossRef] [PubMed]
  8. Walker, M.J.; Cowen, S.; Gray, K.; Hancock, P.; Burns, D.T. Honey authenticity: The opacity of analytical reports—Part 1 defining the problem. NPJ Sci. Food 2022, 6, 11. [Google Scholar] [CrossRef] [PubMed]
  9. Manning, L.; Soon, J.M. Food Safety, Food Fraud, and Food Defense: A Fast-Evolving Literature. J. Food Sci. 2016, 81, 823–834. [Google Scholar] [CrossRef] [PubMed]
  10. Se, K.W.; Wahab, R.A.; Yaacob, S.N.S.; Ghoshal, S.K. Detection techniques for adulterants in honey: Challenges and recent trends. J. Food Comp. Anal. 2023, 80, 16–32. [Google Scholar] [CrossRef]
  11. Soares, S.; Rodrigues, F.; Delerue-Matos, C. Towards DNA-Based Methods Analysis for Honey: An Update. Molecules 2023, 28, 2106. [Google Scholar] [CrossRef] [PubMed]
  12. Ye, J.; Coulouris, G.; Zaretskaya, I.; Cutcutache, I.; Rozen, S.; Madden, T.L. Primer-BLAST: A Tool to Design 463 Target-Specific Primers for Polymerase Chain Reaction. BMC Bioinf. 2012, 13, 134. [Google Scholar] [CrossRef] [PubMed]
Figure 1. Calibration curve corresponding to the synthetic DNA-target concentrations ranging from 0.03 to 1.00 nM. Current responses obtained from an average of three replicates.
Engproc 82 00079 g001
Figure 2. Correlation between the electrochemical signals detected from the complementary Erica arborea (RD, US1, and US2) and the non-complementary (NC and PB) amplified DNA to the synthetic DNA target (SP). Current intensity values of the blank assays (B) are represented in brown, signal (S) in orange, and the corresponding S/B ratio in black.
Engproc 82 00079 g002
Table 1. Erica arborea oligonucleotides.
Probes5′→3′ SequenceBase Pairs
Capture probeGAC CTT CTT TTT AGG CCA ACC GAG CAC A28
Signaling probeGAC TGC GTA GCA TGC ACA ACG TGT CGC AGT TTG GCA ACC ACC ACT TGT TGT GAT GTC CGT CAT CAG G70
Target probeTGT GCT CGG TTG GCC TAA AAA GAA GGT CCC TGA TGA CGG ACA TCA CAA CAA GTG GTG GTT GCC AAA CTG TCG CGA CAC GTT GTG CAT GCT ACG CAG TC98
Table 2. Selected analytical parameters levels used for the genosensor optimization.
VariablesTested RangeSelected Value
DNA-capture concentration (μM)0.25–10.001.00
MCH spacer concentration (μM)0.00–1.000.50
MCH spacer incubation time (min)5–305
Homogeneous hybridization incubation time (min)15–6030
Temperature (°C)25–9825
DNA-signaling concentration probe (μM)0.13–0.500.50
Heterogeneous hybridization incubation time (min)30–12060
Antibody concentration (U/mL)0.50–3.002.00
Antibody incubation time (min)15–4530
Disclaimer/Publisher’s Note: The statements, opinions and data contained in all publications are solely those of the individual author(s) and contributor(s) and not of MDPI and/or the editor(s). MDPI and/or the editor(s) disclaim responsibility for any injury to people or property resulting from any ideas, methods, instructions or products referred to in the content.

