Proceeding Paper

Discrimination of Different Human Cell Lines by Using FT-IR Spectra Spectroscopy †

1
Dipartimento di Medicina Sperimentale, Università della Campania “Luigi Vanvitelli”, 80138 Napoli, Italy
2
Dipartimento di Fisica “E. Pancini”, Università degli Studi di Napoli “Federico II”, 80126 Napoli, Italy
3
Istituto Nazionale di Fisica Nucleare—Sezione di Napoli, 80100 Napoli, Italy
4
ASL2 Lanciano-Vasto-Chieti, UOSD di Fisica Sanitaria, 66100 Chieti, Italy
5
Department of Neurosciences, Imaging and Clinical Sciences, Center for Advanced Studies and Technology (CAST), “G. d’Annunzio” University of Chieti-Pescara, 66100 Chieti, Italy
6
ASL2 Lanciano-Vasto-Chieti, UOC Anatomia e Istologia Patologica, 66100 Chieti, Italy
*
Author to whom correspondence should be addressed.
Presented at the 11th International Electronic Conference on Sensors and Applications (ECSA-11), 26–28 November 2024; Available online: https://sciforum.net/event/ecsa-11.
Eng. Proc. 2024, 82(1), 54; https://doi.org/10.3390/ecsa-11-20499
Published: 26 November 2024

Abstract

:
Fourier transform infrared (FT-IR) spectroscopy is a powerful analytical technique used to obtain molecular fingerprints of various biological samples. This study aims to compare the FT-IR spectra of three distinct cell lines, SH-SY5Y (neuroblastoma), HepG2 (hepatocellular carcinoma), and MCF-10A (epithelial mammary), to identify characteristic features in their spectra that can be used for this purpose. The FT-IR spectra revealed significant protein, lipid, and nucleic acid content variations among the cell lines. The differences mentioned above reflect each cell type’s unique biochemical environment and metabolic states. This distinction can help identify different cell lines. Understanding these spectral differences can provide insights into the molecular basis of cellular functions and aid in the development of cell-specific therapeutic strategies.

1. Introduction

Fourier transform infrared (FT-IR) spectroscopy is a powerful analytical tool used to study the molecular composition of various biological samples, including cell lines. Several studies have indicated the potential use of this technique for distinguishing between healthy and cancerous cells [1,2] among different cell lines [3,4]. In this study, we present a comparative analysis of the FT-IR spectra of three distinct cell lines: SH-SY5Y (a human neuroblastoma cell line), MCF-10A (a non-tumorigenic human mammary epithelial cell line), and HepG2 (a human liver carcinoma cell line). SH-SY5Y, derived from a human neuroblastoma, is used for research on neuronal functions and diseases like Parkinson’s. HepG2, a liver carcinoma cell line, retains many liver cell functions, making it useful in studies of liver function, toxicology, and drug metabolism. MCF-10A, a non-cancerous mammary epithelial cell line, serves as a model for normal breast cells and is valuable in breast cancer research [5,6,7]. The study aims to uncover molecular differences in their biochemical compositions and metabolic activities through FT-IR spectral analysis. By analyzing the spectral features of these cell lines, we aim to identify key molecular differences, which may provide insights into their biochemical composition, metabolic activities, and potential applications in biomedical research.

2. Materials and Methods

2.1. Cell Line Growth Conditions

Three different cell lines, SH-SY5Y (a human neuroblastoma cell line), HepG2 (a human hepatocarcinoma cell line) and MCF-10A (an epithelial mammary cell line), were used in this study. The cells were grown at 37 °C in a humidified atmosphere of 95% air and 5% CO2. The cell lines of SH-SY5Y and HepG2 were cultured in DMEM supplemented with 10% heat-inactivated FBS, 100 U/mL penicillin, 100 µg/mL streptomycin, and 1% L-glutamine. The cell line of MCF-10A was cultured in DMEM/F12 (Gibco 3133-028, Gibco, London, UK) supplemented with 5% horse serum (Gibco 26050-070), 20 ng/mL epidermal growth factor (EGF, Sigma SRP3027, Sigma-Aldrich, Saint Louis, MO, USA), 10 mg/mL insulin (Sigma I6634), 0.5 mg/mL hydrocortisone (Sigma H-0888), 100 ng/mL cholera toxin (Sigma C-8052), and antibiotics (Pen/Strep, Gibco 15070-063). A total of 40,000 MCF-10A cells were seeded on MirrIR slides in a 6-well dish. After two days of culture and removal from the growth medium, the MirrIR slides were fixed in a 3.7% formaldehyde PBS solution for 20 min at room temperature. Subsequently, they were briefly rinsed using distilled water for 3 s to eliminate residual PBS from the cell surface. The samples were then air dried under ambient conditions. The cell lines of SH-SY5Y and HepG2 were seeded on MirrIR slides (25 × 25 mm2) (Kevley Technologies, Chesterland, OH, USA), specific reflection FT-IR spectroscopy microscope slides, and nested in Petri dish capsules. The slides were seeded at a density of about 104 cells/cm2 for a total of approximately 5 × 10⁶ cells/Petri.

2.2. FT-IR Spectroscopy Measurements

IR absorption spectra of the cell samples were obtained using a Spectrum One FTIR (PerkinElmer, Shelton, CT, USA) spectrometer equipped with a Perkin Elmer Multiscope system infrared microscope and an MCT (mercury–cadmium–telluride) FPA (focal plane-array) detector. The measurements were performed at room temperature on cells grown on MirrIR (25 × 25 mm2) slides in transflection mode. For each experimental condition, three slides were prepared. Spectra were acquired within an aperture of 100 × 100 µm2. Different regions were investigated on every slide, and three spectra were acquired for each position. The background signal was acquired in a region of the slide free of cells. All spectra were collected using 64 scans in a range from 4000 to 600 cm−1 with a 4 cm−1 spectral resolution. For each FT-IR measurement, the spectral ranges 1800–1000 cm−1 (LWR) and 3600–2800 cm−1 (HWR) were separately analyzed. LWR includes the main spectral peaks related to the absorption of functional groups inside nucleic acids, lipids, proteins and carbohydrate cellular components, whereas HWR comprises spectral peaks mainly related to radiation absorption from the cellular lipid and protein components.

2.3. Data Analysis

The spectra were preliminarily processed by subtracting the background signal that was acquired from a cell-free zone of the slide, and a piecewise baseline correction was performed on the whole dataset. The spectra were then normalized using a vector normalization procedure in order to have comparable intensities by adopting the standard normal variate (SNV) method [8]. To evidence the spectral difference among the various cell lines, difference spectra were obtained by subtracting the average SNV spectra of the different cell lines.

3. Results and Discussion

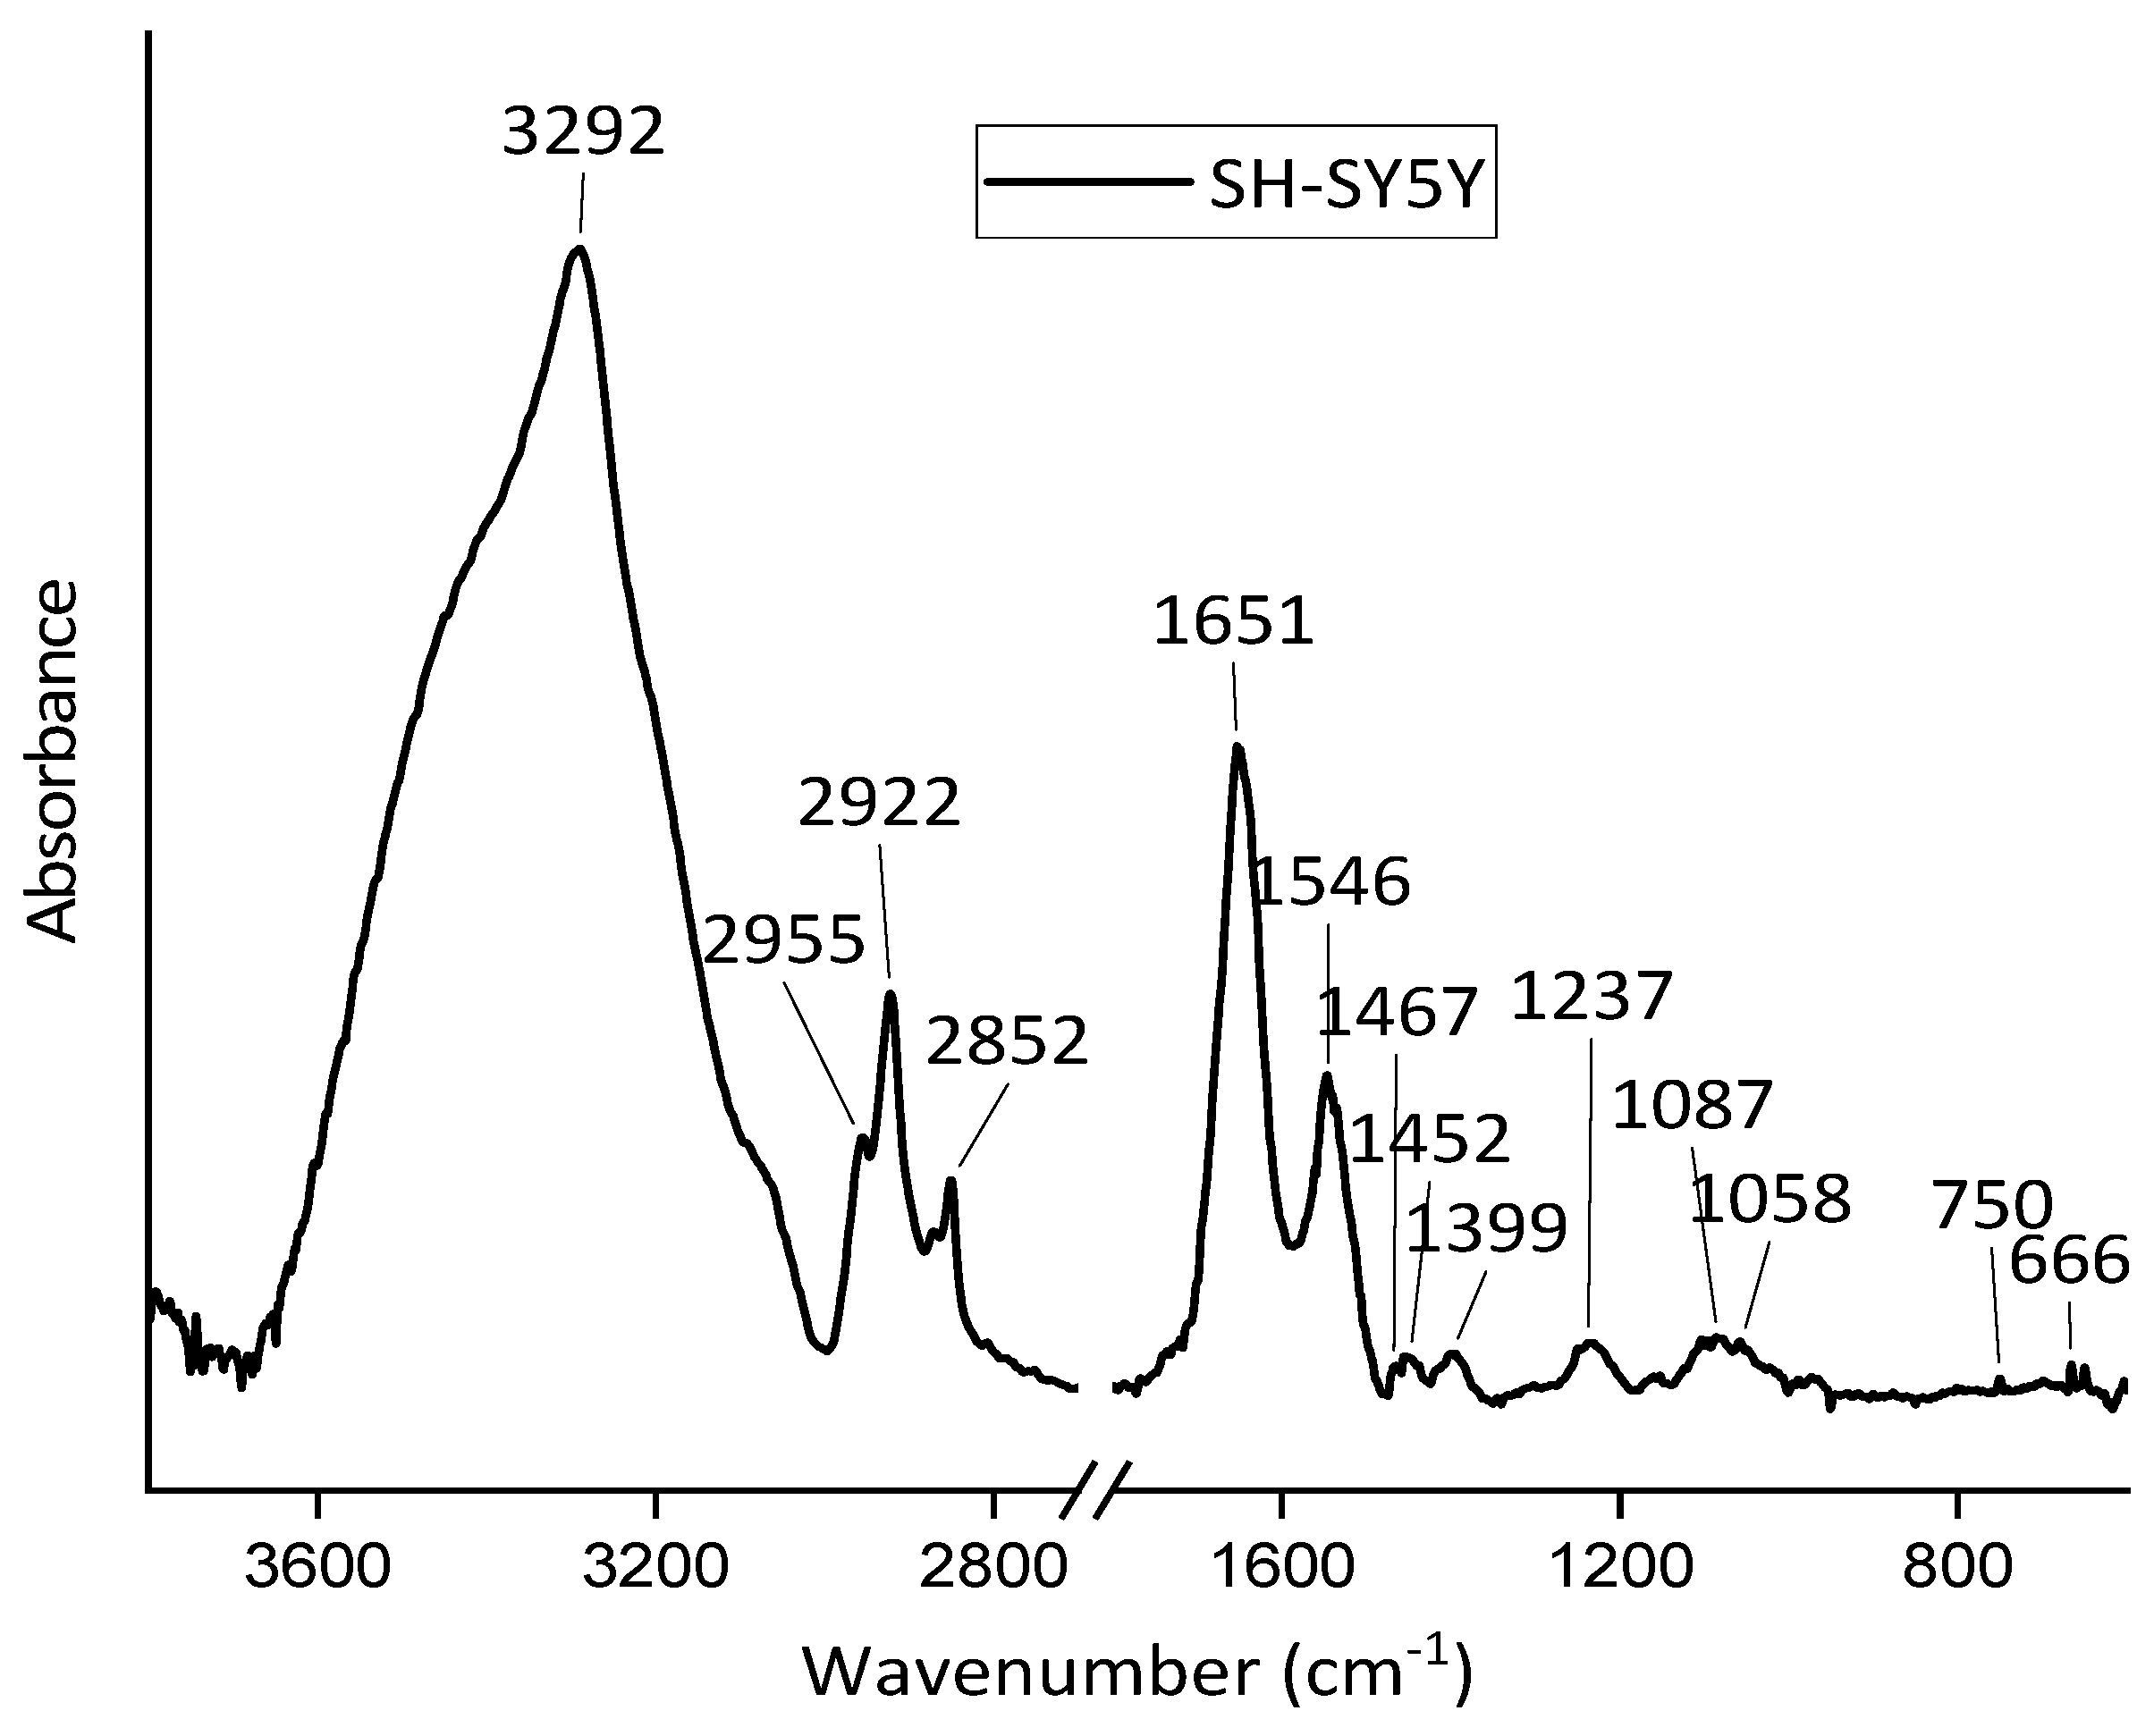
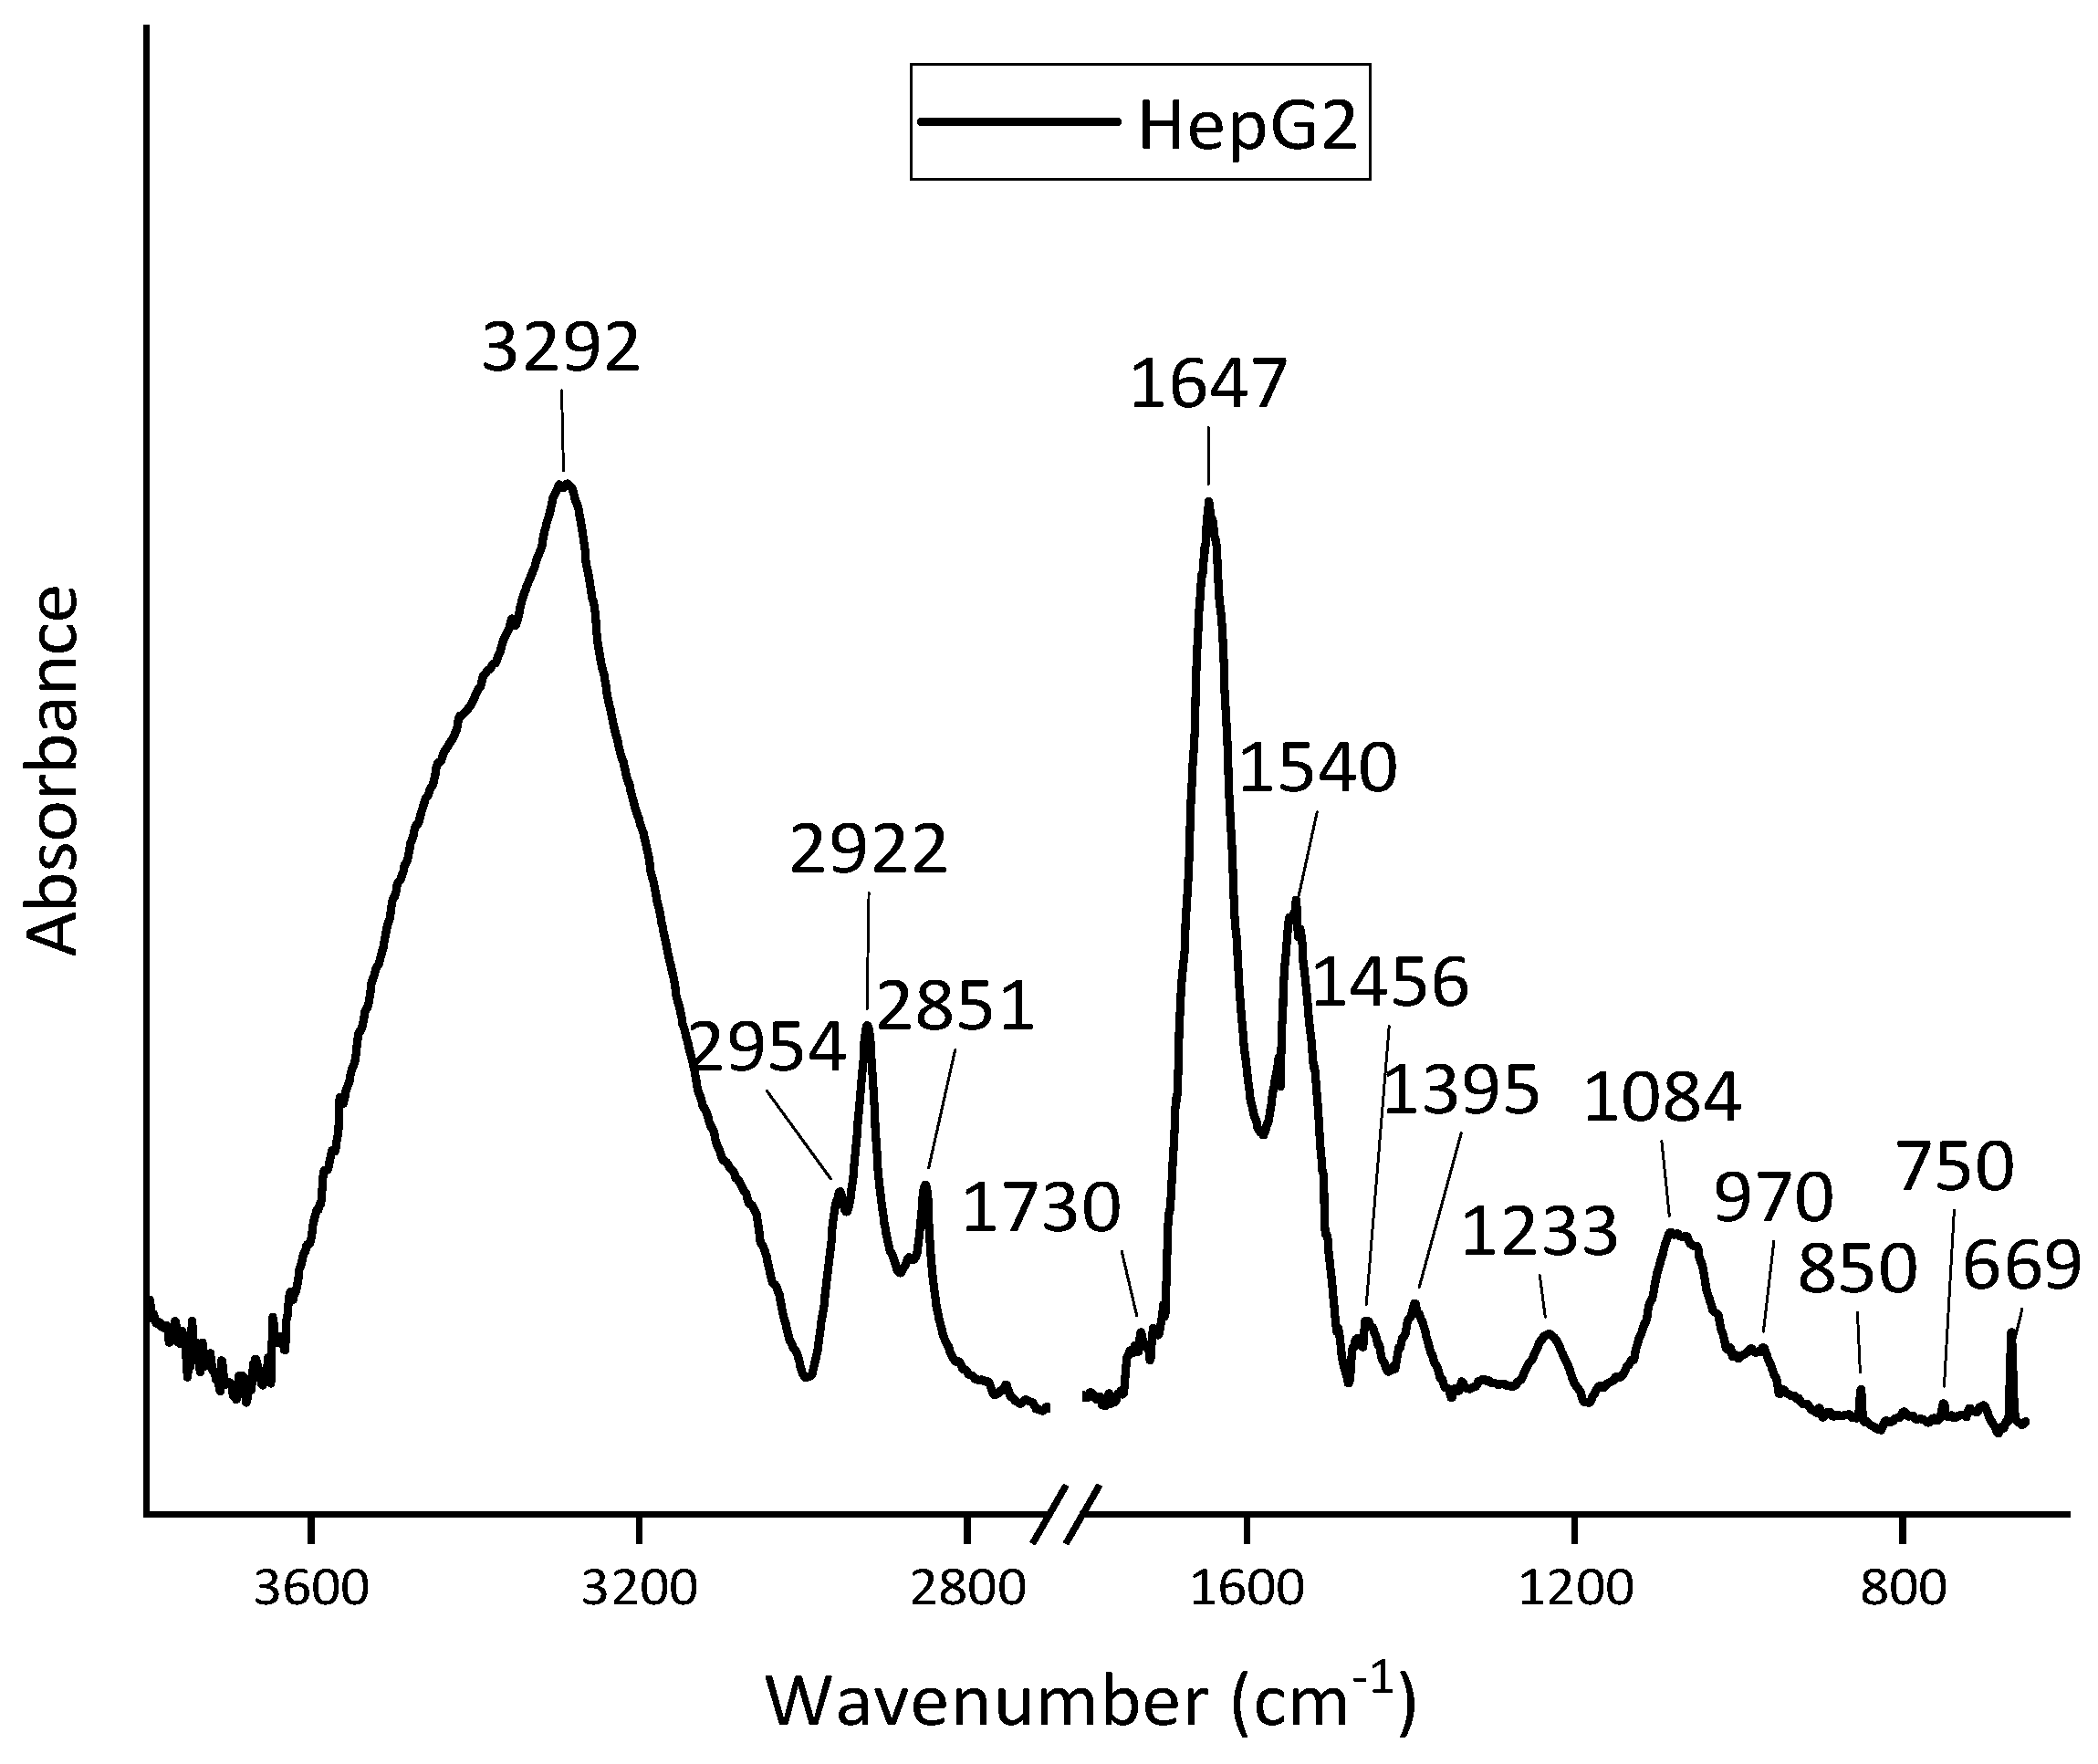
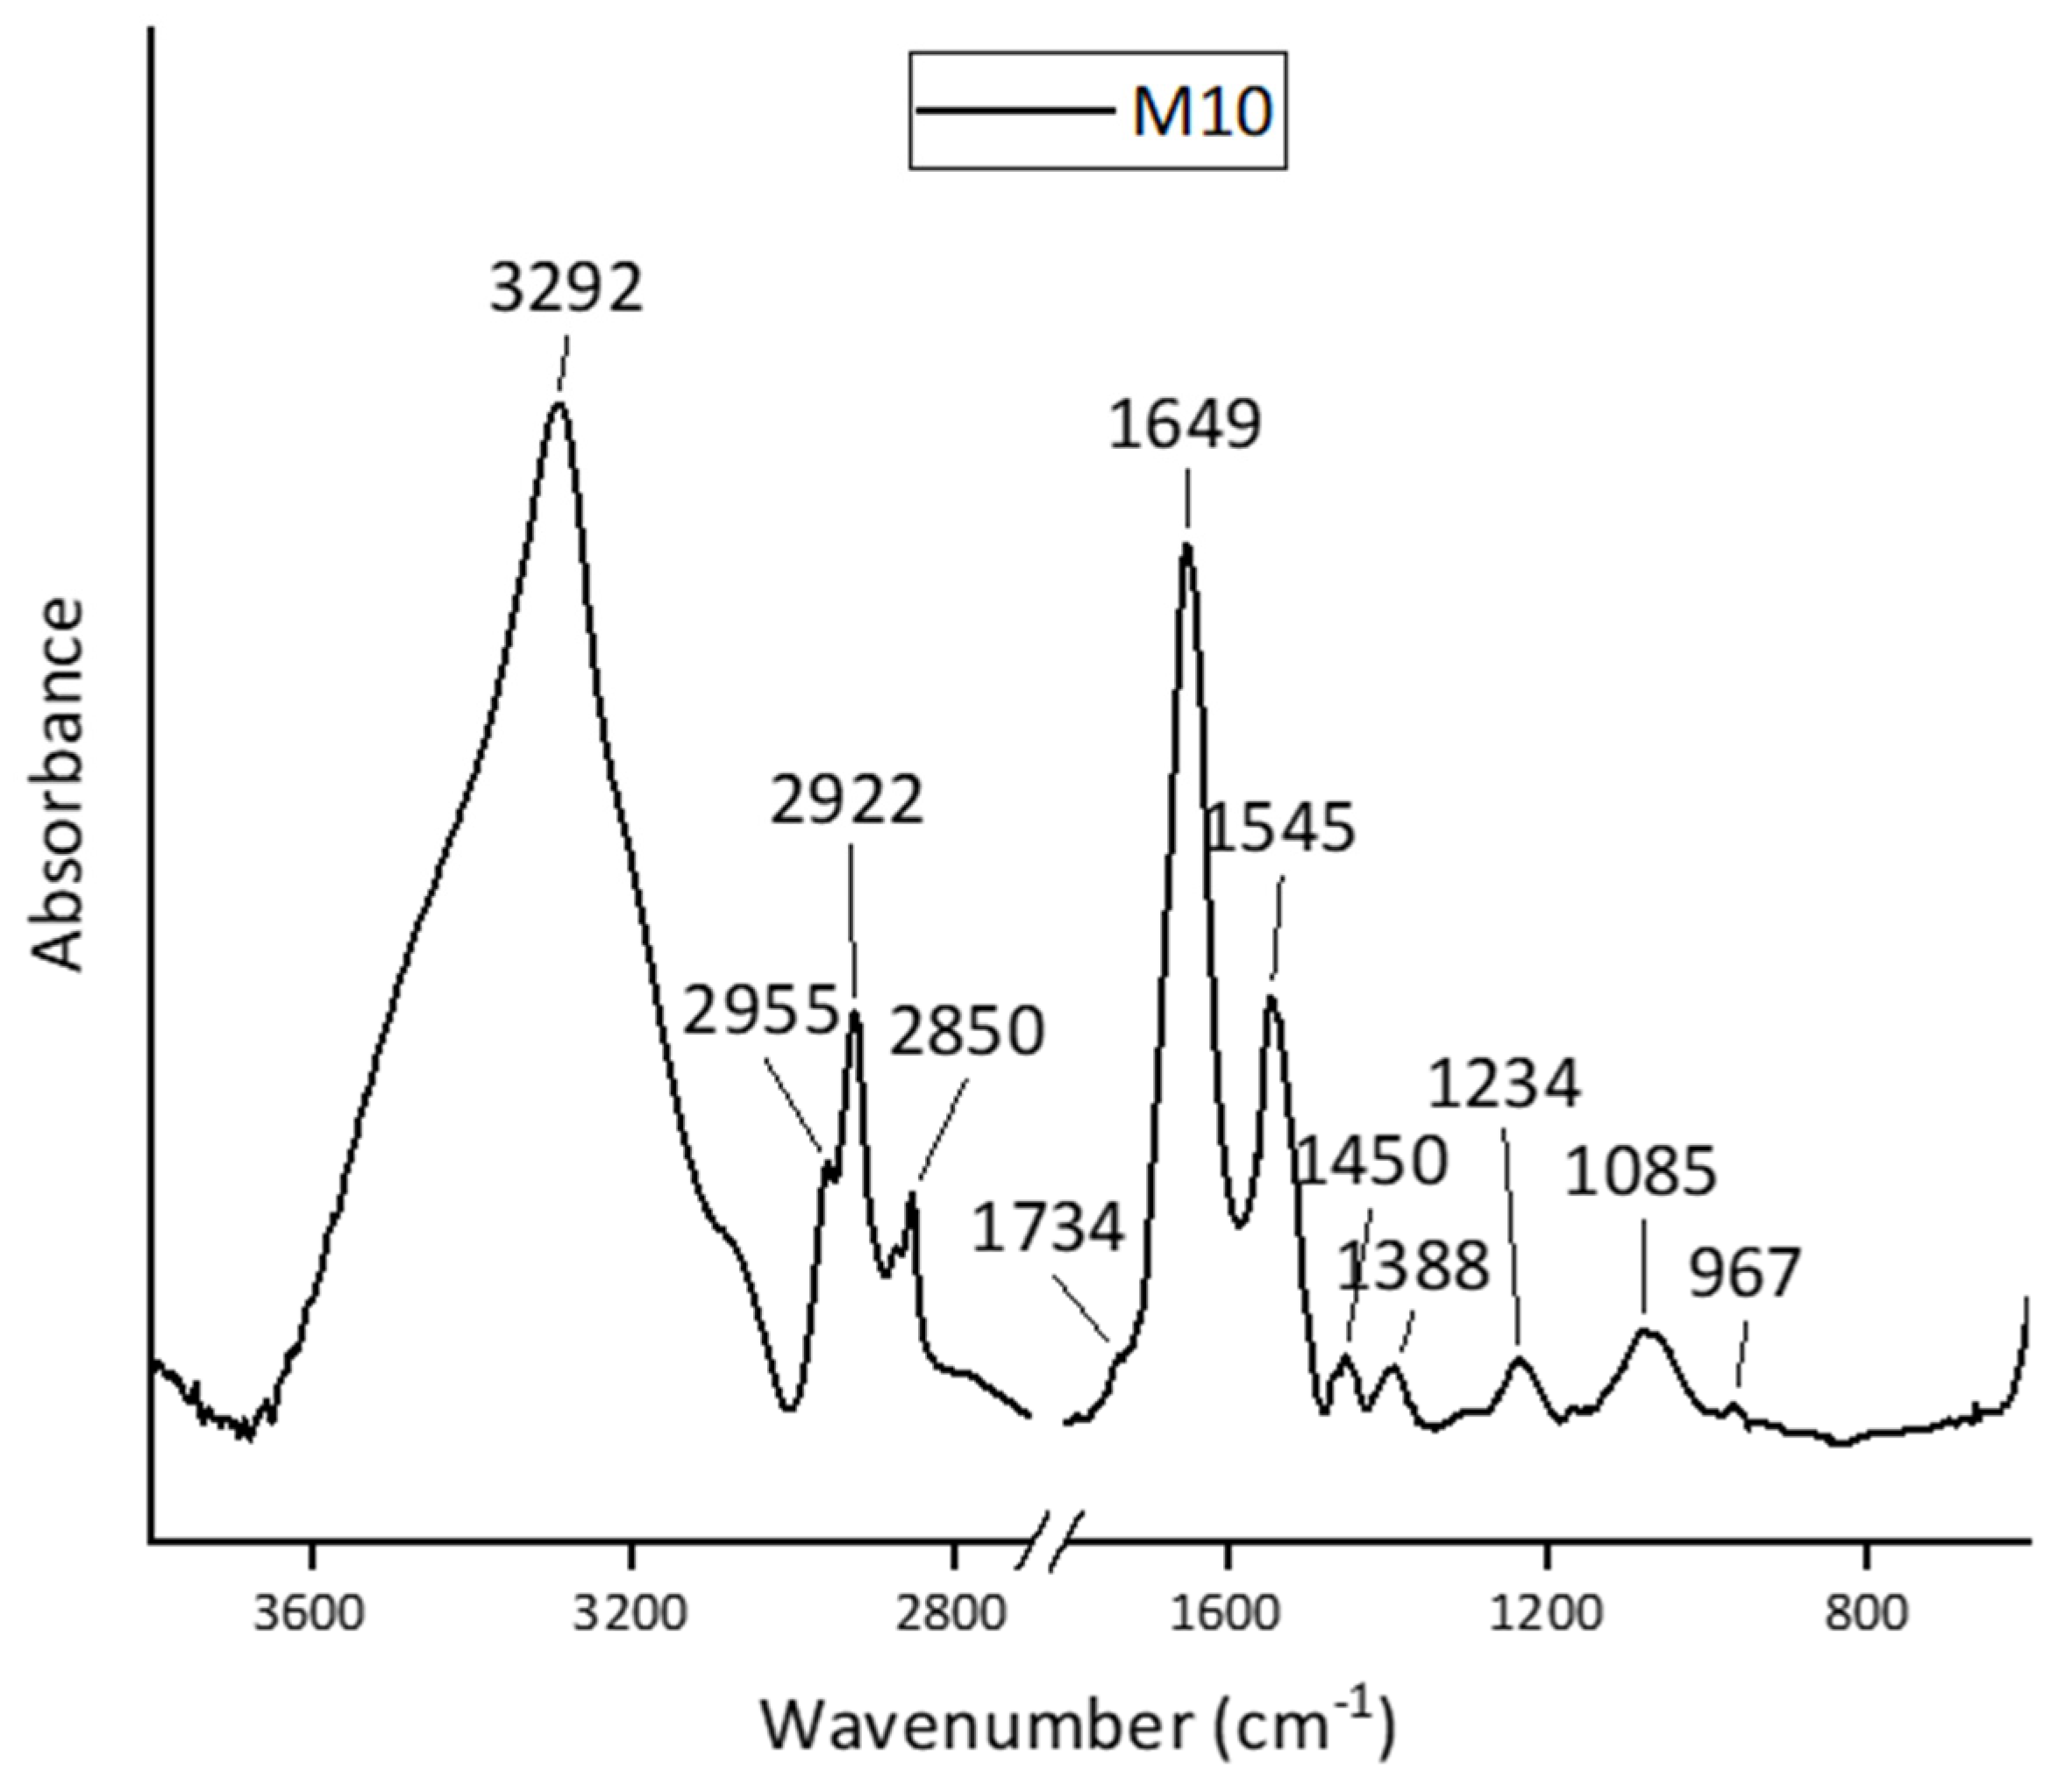
3.1. FT-IR Spectra Analysis of SH-SY5Y, HepG2, and MCF-10A Cell Lines

Figure 1 exhibits the spectrum features of the SH-SY5Y cell line. The absorption bands observed in the SH-SY5Y spectra include amide I (1651 cm−1), characterized by a dominant peak arising from C=O stretching vibrations, primarily associated with proteins; amide II (1546 cm−1), arising from N-H bending and C-N stretching vibrations; lipid bands (2852–2922 cm−1) attributed to asymmetric and symmetric stretching vibrations of CH2 groups; and phosphate bands (1237 cm−1 and 1087 cm−1), indicative of nucleic acids and phospholipids.
Figure 2 displays spectral features reflecting the HepG2 cell line. Notable absorption bands include the amide I and amide II bands that are similar to those seen in SH-SY5Y, but with variations in position and intensity of their peaks, suggesting differences in protein secondary structure or concentration. Prominent peaks in the 2851–2922 cm−1 region, indicate high lipid content, typical of liver cells. In addition, peaks at 1233 and 1084 cm−1 indicate variations in nucleic acid and phospholipid content.
Figure 3 shows the spectrum features of the MCF-A10 cell line. The amide I and II bands are consistent with those of SH-SY5Y and HepG2, but with different relative intensities. Peaks in the 2850–2922 cm−1 region, though less pronounced than in HepG2, reflect lower lipid content typical of non-cancerous cells.

3.2. Comparative Analysis of Cell Lines

In Table 1 presents the assignments of all major peaks in the SH-SY5Y, HepG2, and MCF-10A cell lines as identified by FT-IR spectroscopy. Variations in the Amide II band suggest differences in protein secondary structures or concentrations among the three cell lines. In addition, different contributions are present only for some cell lines. See, for example, the peak related to C=O stretching vibrations which is present in the HepG2 and MCF-A10 spectra but is not detected in the SH-SY5Y spectrum. The same occurs for other spectral features indicating differences in cell constituents.

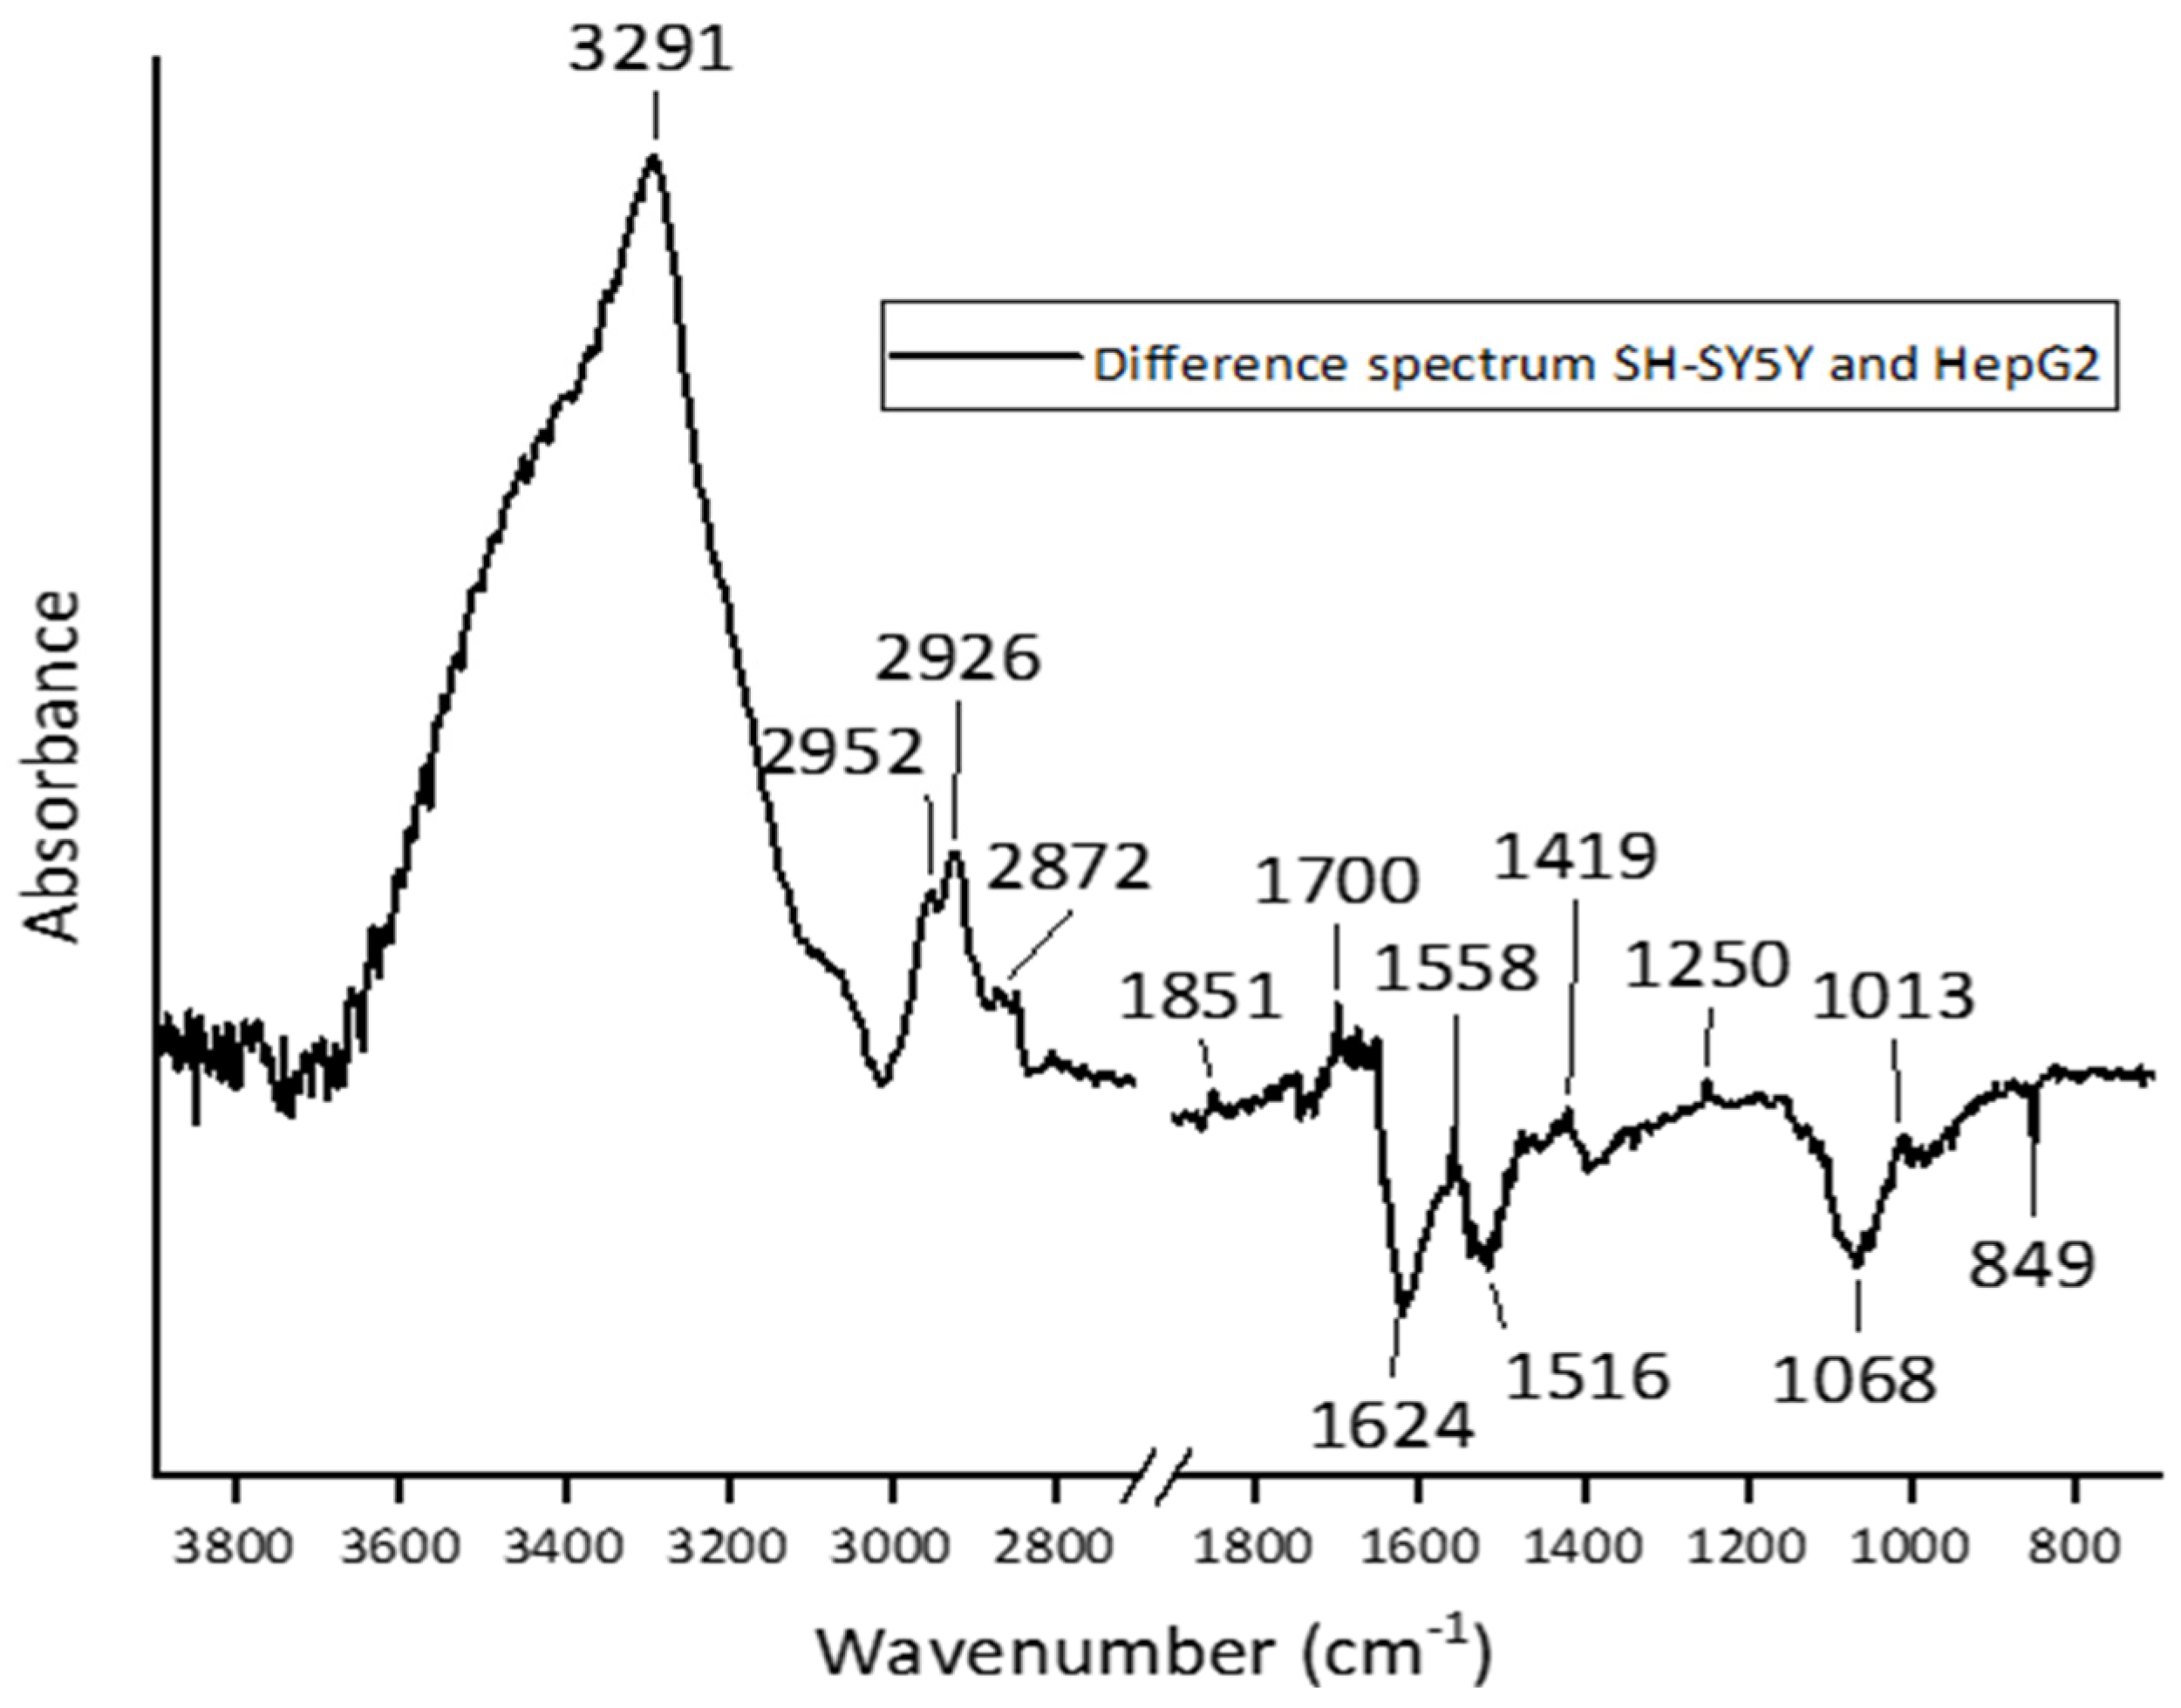
3.3. Analysis of Difference Spectra

To highlight the modifications in the infrared spectra acquired from different cell lines, it is useful to use difference spectra. This method can reveal subtle alterations in infrared absorption features between different samples or experimental conditions [12,13,14]. Figure 4, Figure 5 and Figure 6 represent the difference spectra obtained by subtracting the average SNV spectra between spectra referring to various cell lines.
Figure 4 shows the difference spectrum between SH-SY5Y and HepG2. Because SH-SY5Y and HepG2 cells belong to different tissues (neuronal vs. hepatic), their protein composition and structure vary. The difference spectrum may highlight variations in the absorption or emission peaks related to proteins characteristic of each cell line, such as neural markers versus liver-specific proteins. In addition, cell membranes vary between these two cell types. HepG2 cells, being of liver origin, might show higher lipid-related absorption peaks (due to the liver’s role in lipid metabolism), whereas SH-SY5Y cells may have different membrane lipid profiles. Figure 6 displays the difference spectrum between SH-SY5Y and MCF-A10. Differences in the position of absorption or emission peaks indicate changes in the electronic environment or molecular structure. For example, a shift in the peaks might suggest different protein folding, molecular interactions, or chromophore environments between SH-SY5Y and MCF-A10 cells.
Figure 6 shows the difference spectrum of the HepG2 and MCF-A10 cell lines. Peak intensity variations could signify differences in the concentration of specific molecules, such as lipids, proteins, or nucleic acids. Because HepG2 is cancerous, it overexpresses certain proteins or metabolites compared to MCF-A10, which could lead to heightened peak intensities in certain spectral regions.

4. Conclusions

The comparative analysis of the FT-IR spectra of the SH-SY5Y, MCF-10A, and HepG2 cell lines revealed significant protein, lipid, and nucleic acid content variations among the cell lines. These findings provide valuable insights into the biochemical composition and functional differences among these cell lines, highlighting the potential of FT-IR spectroscopy in studying cellular mechanisms and disease processes in various biomedical applications. The differences mentioned above reflect each cell type’s unique biochemical environment and metabolic states. This distinction can help identify different cell lines. Understanding these spectral differences can provide insights into the molecular basis of cellular functions and aid in the development of cell-specific therapeutic strategies.

Author Contributions

Conceptualization, M.L. and M.P.; methodology, M.P. and B.F.; software, B.F.; sample preparation, L.M., M.D.F. and M.I.; investigation, B.F. and M.L.; and M.P.; data curation, B.F.; writing—original draft preparation, B.F. and M.L.; writing—review and editing. B.F. and M.L. All authors have read and agreed to the published version of the manuscript.

Funding

This research received no external funding.

Institutional Review Board Statement

Not applicable.

Informed Consent Statement

Not applicable.

Data Availability Statement

Data are available on request.

Conflicts of Interest

The authors declare no conflicts of interest.

References

  1. Lasalvia, M.; Capozzi, V.; Perna, G. Classification of healthy and cancerous colon cells by Fourier transform infrared spectroscopy. Spectrochim. Acta Part A Mol. Biomol. Spectrosc. 2024, 321, 124683. [Google Scholar] [CrossRef] [PubMed]
  2. Elshemey, W.M.; Ismail, A.M.; Elbialy, N.S. Molecular-level characterization of normal, benign, and malignant breast tissues using FTIR spectroscopy. J. Med. Biol. Eng. 2016, 36, 369–378. [Google Scholar] [CrossRef]
  3. Zendehdel, R.; Shirazi, F.H. Discrimination of human cell lines by infrared spectroscopy and mathematical modeling. Iran. J. Pharm. Res. IJPR 2015, 14, 803. [Google Scholar] [PubMed]
  4. Wang, Y.; Dai, W.; Liu, Z.; Liu, J.; Cheng, J.; Li, Y.; Li, X.; Hu, J.; Lü, J. Single-cell infrared microspectroscopy quantifies dynamic heterogeneity of mesenchymal stem cells during adipogenic differentiation. Anal. Chem. 2020, 93, 671–676. [Google Scholar] [CrossRef] [PubMed]
  5. Xie, H.-R.; Hu, L.-S.; Li, G.-Y. SH-SY5Y human neuroblastoma cell line: In vitrocell model of dopaminergic neurons in Parkinson’s disease. Chin. Med. J. 2010, 123, 1086–1092. [Google Scholar] [PubMed]
  6. López-Terrada, D.; Cheung, S.W.; Finegold, M.J.; Knowles, B.B. Hep G2 is a hepatoblastoma-derived cell line. Hum. Pathol. 2009, 40, 1512. [Google Scholar] [CrossRef] [PubMed]
  7. Vale, N.; Silva, S.; Duarte, D.; Crista, D.M.; da Silva, L.P.; da Silva, J.C.E. Normal breast epithelial MCF-10A cells to evaluate the safety of carbon dots. RSC Med. Chem. 2021, 12, 245–253. [Google Scholar] [CrossRef] [PubMed]
  8. Lasch, P. Spectral pre-processing for biomedical vibrational spectroscopy and microspectroscopic imaging. Chemom. Intell. Lab. Syst. 2012, 117, 100–114. [Google Scholar] [CrossRef]
  9. Talari, A.C.S.; Martinez, M.A.G.; Movasaghi, Z.; Rehman, S.; Rehman, I.U. Advances in Fourier transform infrared (FTIR) spectroscopy of biological tissues. Appl. Spectrosc. Rev. 2017, 52, 456–506. [Google Scholar] [CrossRef]
  10. Ricciardi, V.; Portaccio, M.; Piccolella, S.; Manti, L.; Pacifico, S.; Lepore, M. Study of SH-SY5Y cancer cell response to treatment with polyphenol extracts using FT-IR spectroscopy. Biosensors 2017, 7, 57. [Google Scholar] [CrossRef] [PubMed]
  11. Movasaghi, Z.; Rehman, S.; ur Rehman, D.I. Fourier transform infrared (FTIR) spectroscopy of biological tissues. Appl. Spectrosc. Rev. 2008, 43, 134–179. [Google Scholar] [CrossRef]
  12. Gasper, R.; Dewelle, J.; Kiss, R.; Mijatovic, T.; Goormaghtigh, E. IR spectroscopy as a new tool for evidencing antitumor drug signatures. Biochim. Biophys. Acta (BBA)-Biomembr. 2009, 1788, 1263–1270. [Google Scholar] [CrossRef] [PubMed]
  13. Delfino, I.; Ricciardi, V.; Manti, L.; Lasalvia, M.; Lepore, M. Multivariate analysis of difference raman spectra of the irradiated nucleus and cytoplasm region of SH-SY5Y human neuroblastoma cells. Sensors 2019, 19, 3971. [Google Scholar] [CrossRef] [PubMed]
  14. Lorenz-Fonfria, V.A. Infrared difference spectroscopy of proteins: From bands to bonds. Chem. Rev. 2020, 120, 3466–3576. [Google Scholar] [CrossRef] [PubMed]
Figure 1. Average FT-IR spectrum obtained in transflection mode from SH-SY5Y cells.
Engproc 82 00054 g001
Figure 2. Average FT-IR spectrum obtained in transflection mode from HepG2 cells.
Engproc 82 00054 g002
Figure 3. Average FT-IR spectrum obtained in transflection mode from MCF-A10 cells.
Engproc 82 00054 g003
Figure 4. Difference spectrum of cell lines. The reported spectrum was evaluated by subtracting the mean spectrum of SH-SY5Y from the HepG2 spectrum.
Engproc 82 00054 g004
Figure 5. Difference spectrum of cell lines. The reported spectrum was evaluated by subtracting the mean spectrum of SH-SY5Y from the MCF-A10 spectrum.
Engproc 82 00054 g005
Figure 6. Difference spectrum of cell lines. The reported spectrum was evaluated by subtracting the mean spectrum of HepG2 from the MCF-A10 spectrum.
Engproc 82 00054 g006
Table 1. FT-IR peaks observed in the average spectrum of cell lines (SH-SY5Y, HepG2, MCF-A10), with assignments in accordance with data reported in the literature [9,10,11]. Abbreviation: as. = asymmetric, s. = symmetric, v = vibration, δ = bending.
SH-SY5YHepG2MCF-A10Assignments
Peaks (cm−1)Peaks (cm−1)Peaks
(cm−1)
DNA/RNAProteinLipidsCarbohydrate
329232923292 Amide A ( N H   v ) (O– H v)
295529542955 CH3 as. vCH3 as. v
292229222922 CH2 as. v
285228512850 CH2 s. v
-17301734 ( C = O   s . v )( C = O   s . v )
165116471649 Amide I
( C = O   s , v )
154615401545 Amide II
1467-- CH2  δ CH2  δ
-1456- CH3 as. δ CH3 as. δ
1452-1450 CH3 as. δ
1399--CH3 s. δ CH3 s. δ
-1395- CH3 s. δ
--1388 COO s. vCOO s. v
123712331234 P O 2 as. vAmide III
1170-- C O as. v
108710841085 P O 2 s. v
1058--C O v
-970967C O s. v, P O 2 s. v P O 2 s . v
Disclaimer/Publisher’s Note: The statements, opinions and data contained in all publications are solely those of the individual author(s) and contributor(s) and not of MDPI and/or the editor(s). MDPI and/or the editor(s) disclaim responsibility for any injury to people or property resulting from any ideas, methods, instructions or products referred to in the content.

