2. Exposition
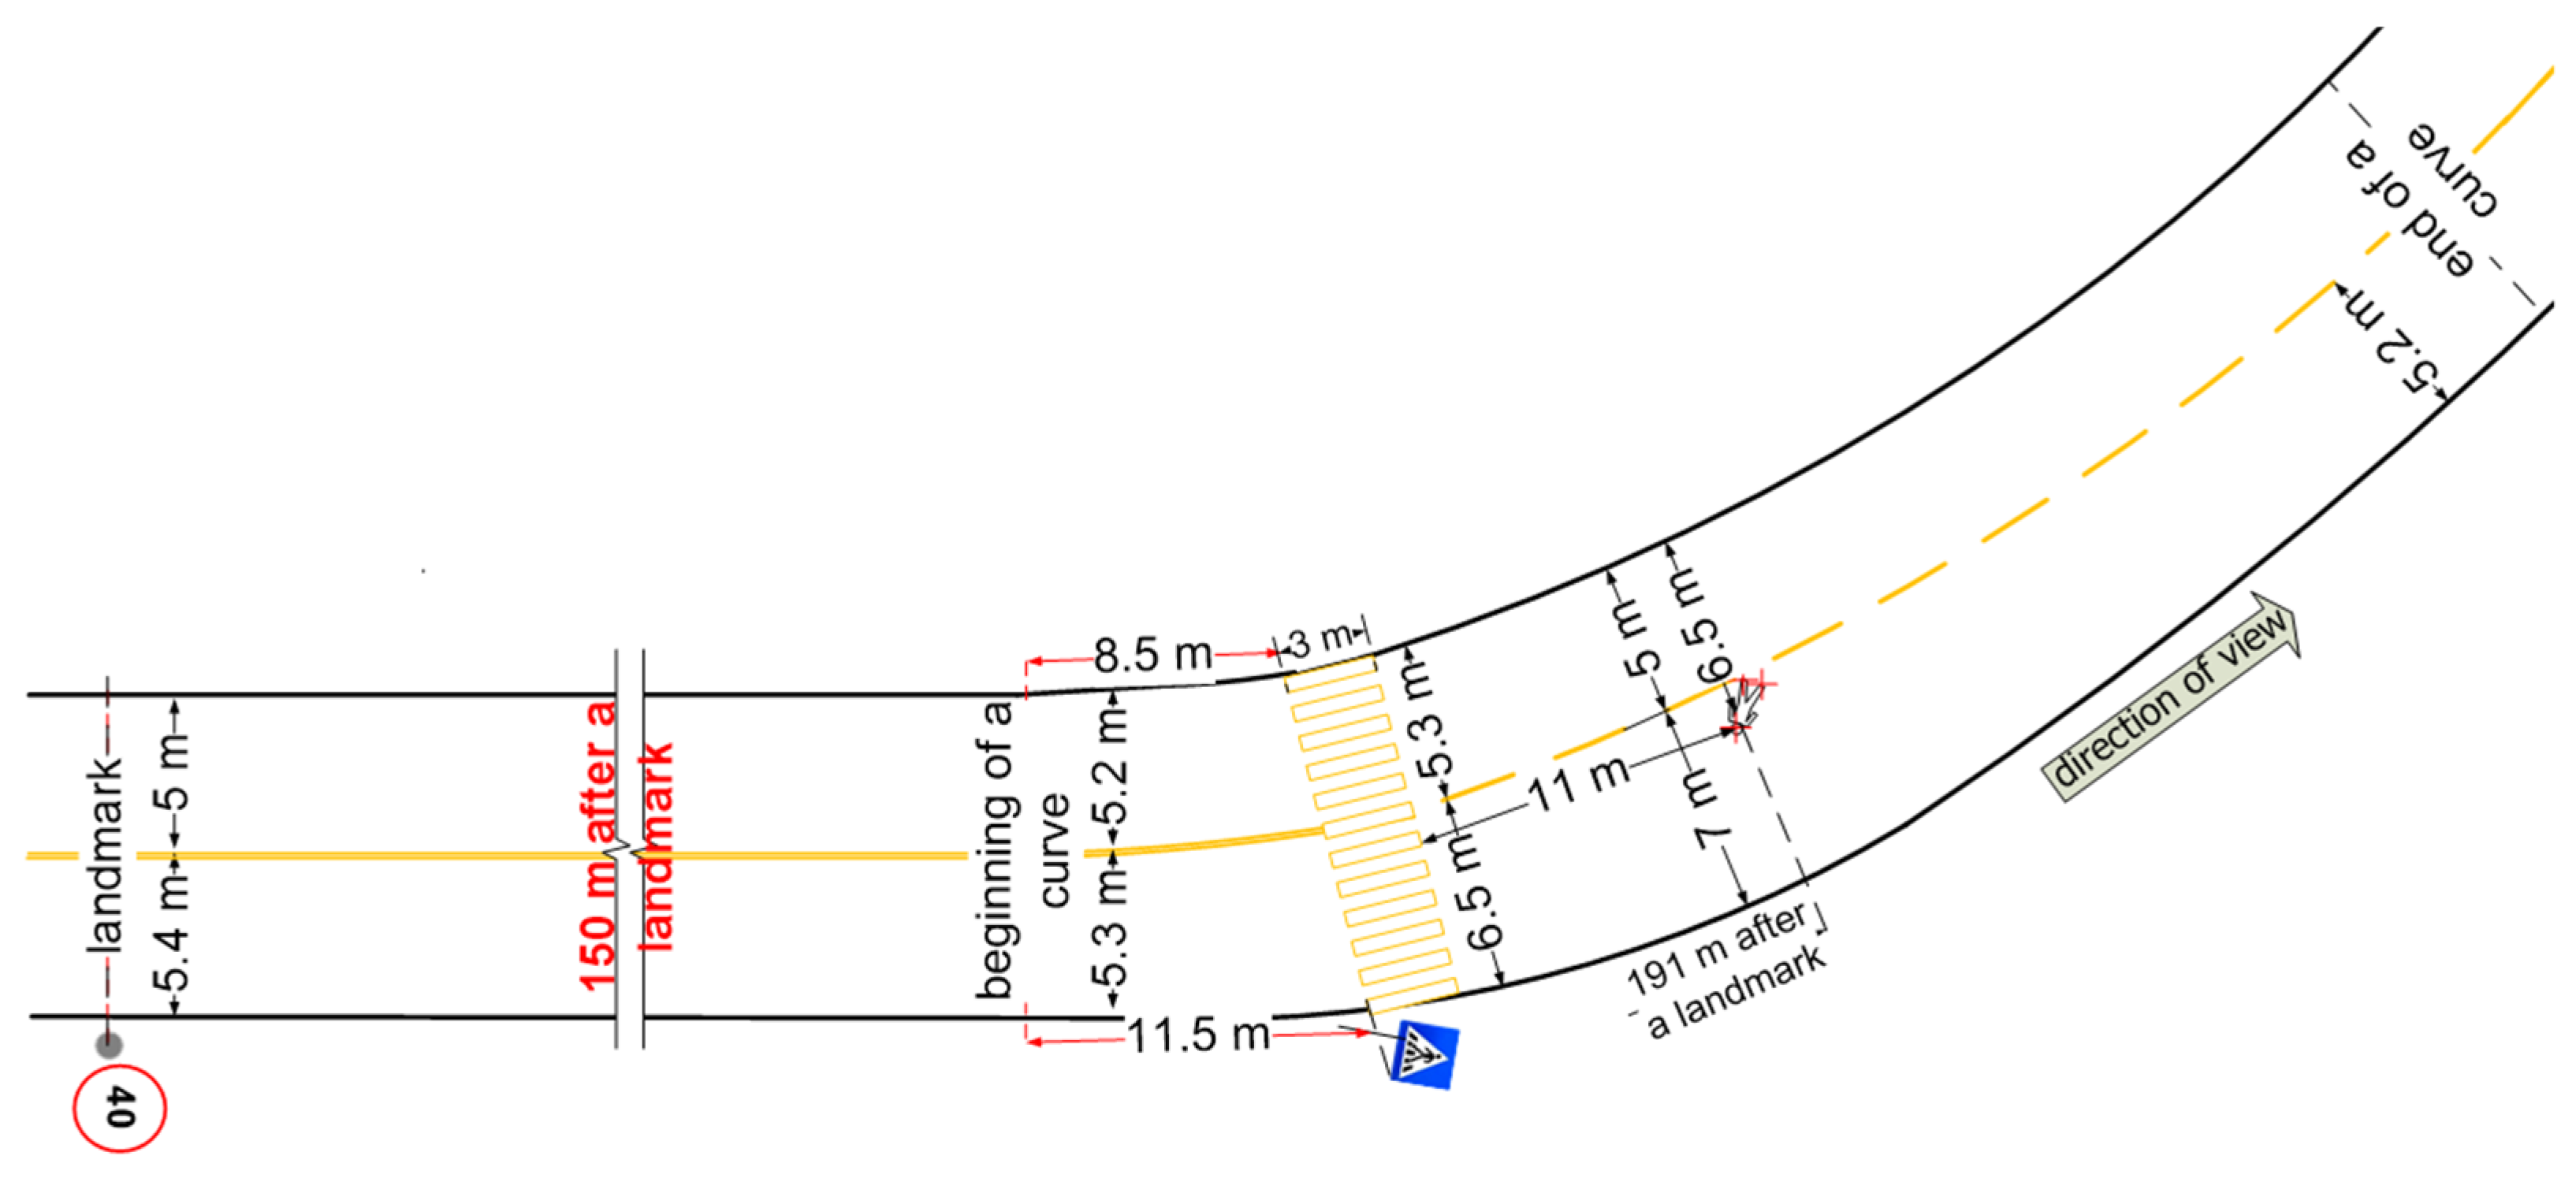
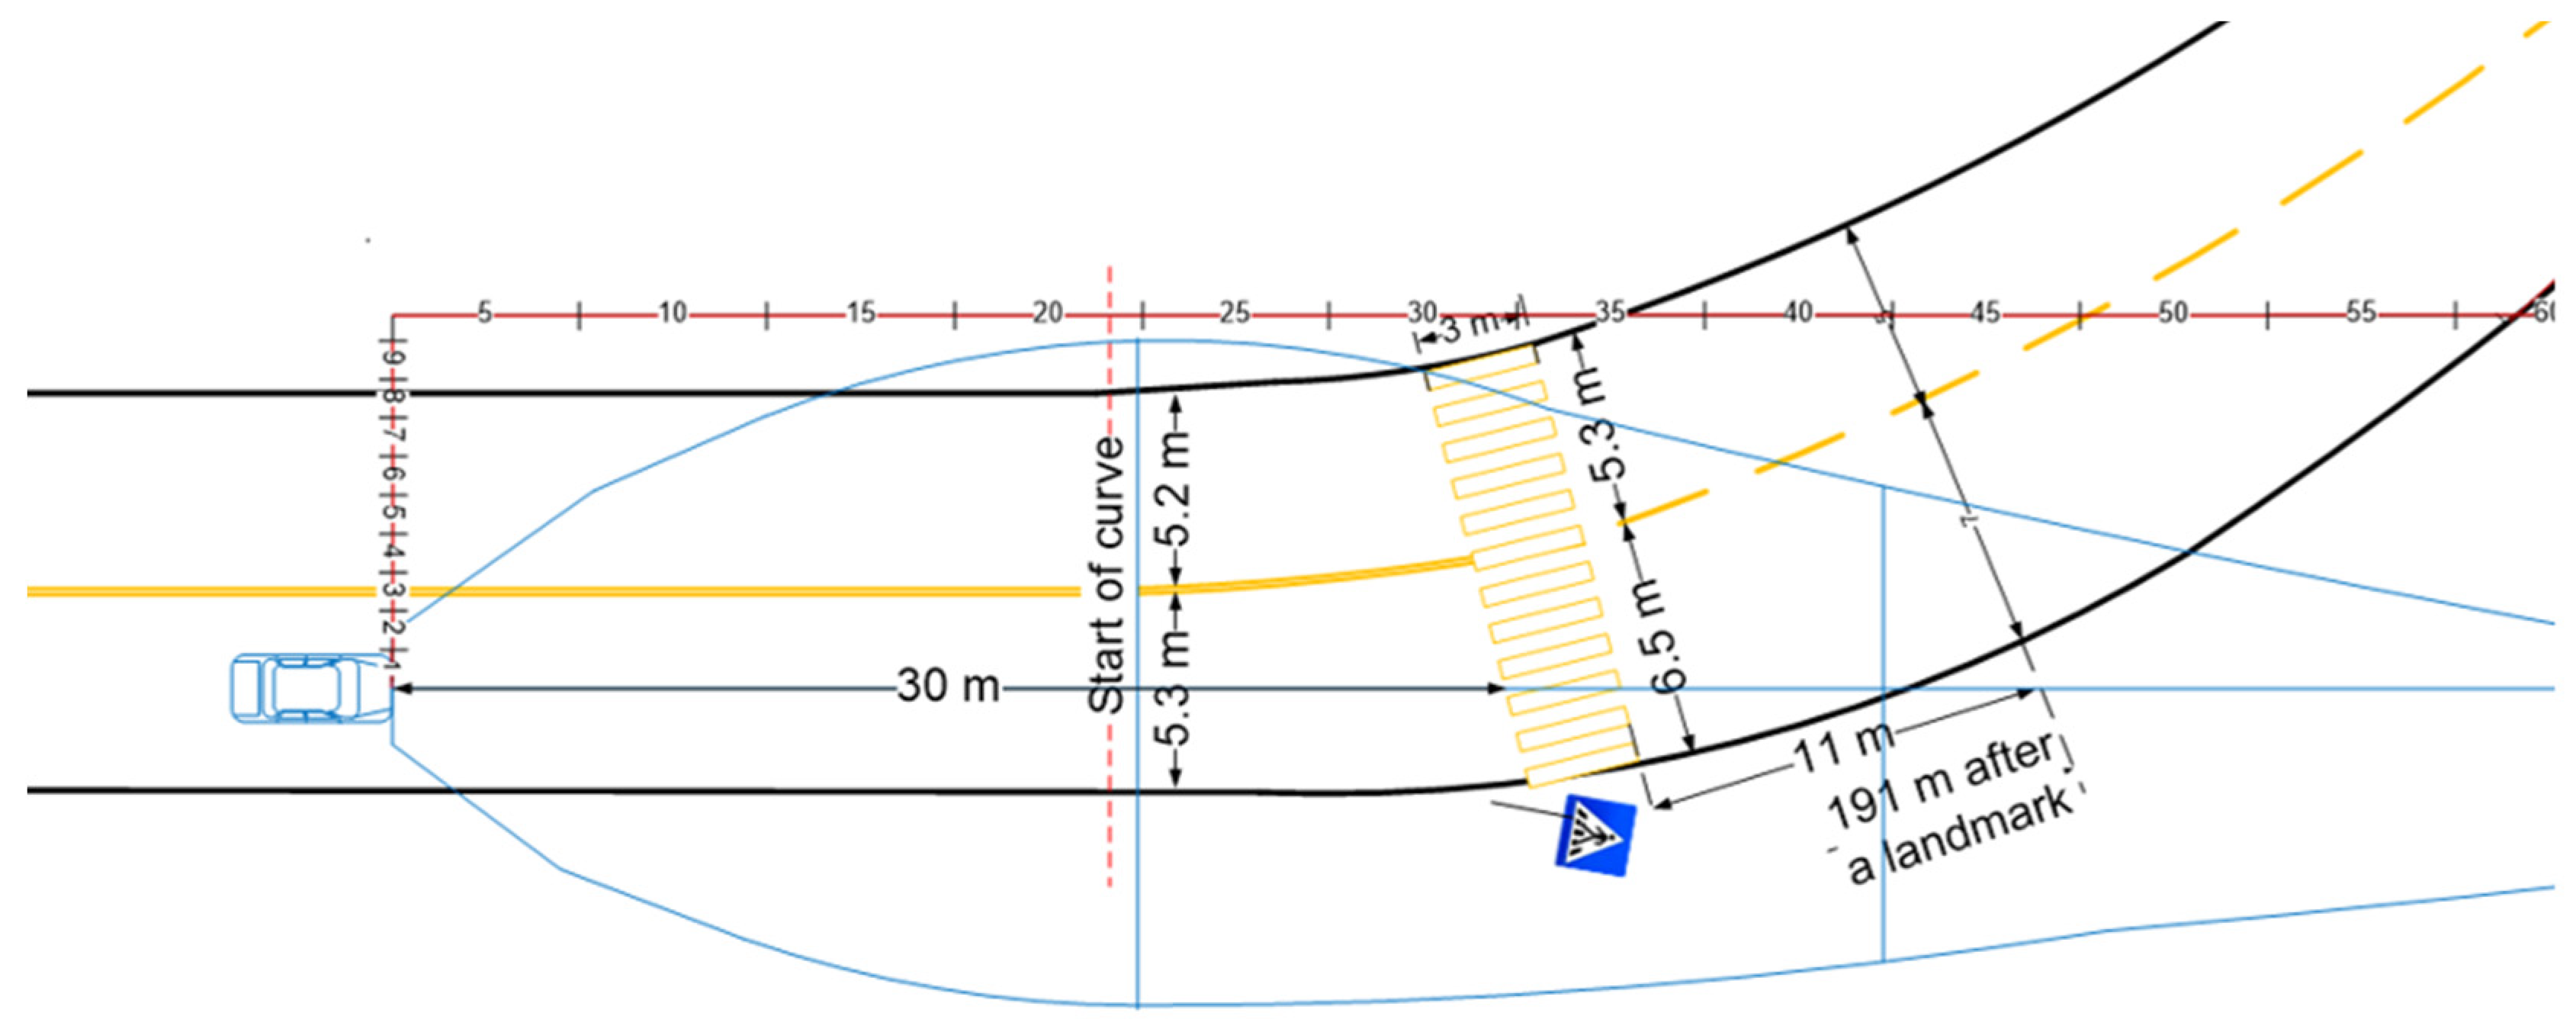
This study presents a detailed analysis of how a pedestrian is perceived by a passenger car driver in a traffic accident occurring at night in an urban area where street lighting is not functioning. According to the available data, the visibility of the drivers in the area of the accident at the time of the accident was ensured by the vehicles’ lights. The road section, measured from the reference point for the first 165.50 m, is straight; thereafter, a horizontal curve begins—a left turn. The radius of the curve, measured along the outer edge of the roadway relative to the selected direction of the curve, is 44.00 m. There is a 3.00 m-wide crosswalk in the area of the accident. The road surface consists of dry, fine-grained asphalt with slight unevenness. The roadway consists of one lane in each direction, separated by a double solid line. The lanes are of varying widths. Following the accident, an on-site inspection was conducted; the findings are shown in the scaled diagram presented in
Figure 1.
From a technical standpoint, traffic conditions at the time and location of the traffic accident were good, requiring drivers to adjust their speed to their visibility.
The point of impact is the intersection of the vehicle’s path of travel and, more specifically, the beginning of the section where evidence of contamination is collected from the vehicle and the victim’s path of travel.
The collision in question is analyzed according to collision theory. The pedestrian’s absolute velocity at the moment of impact is determined by the expression:
where
is the velocity of the passenger car;
is the velocity of the pedestrian relative to the passenger car.
A similar vector expression also holds for the pedestrian’s absolute velocity after the impact and will be written later.
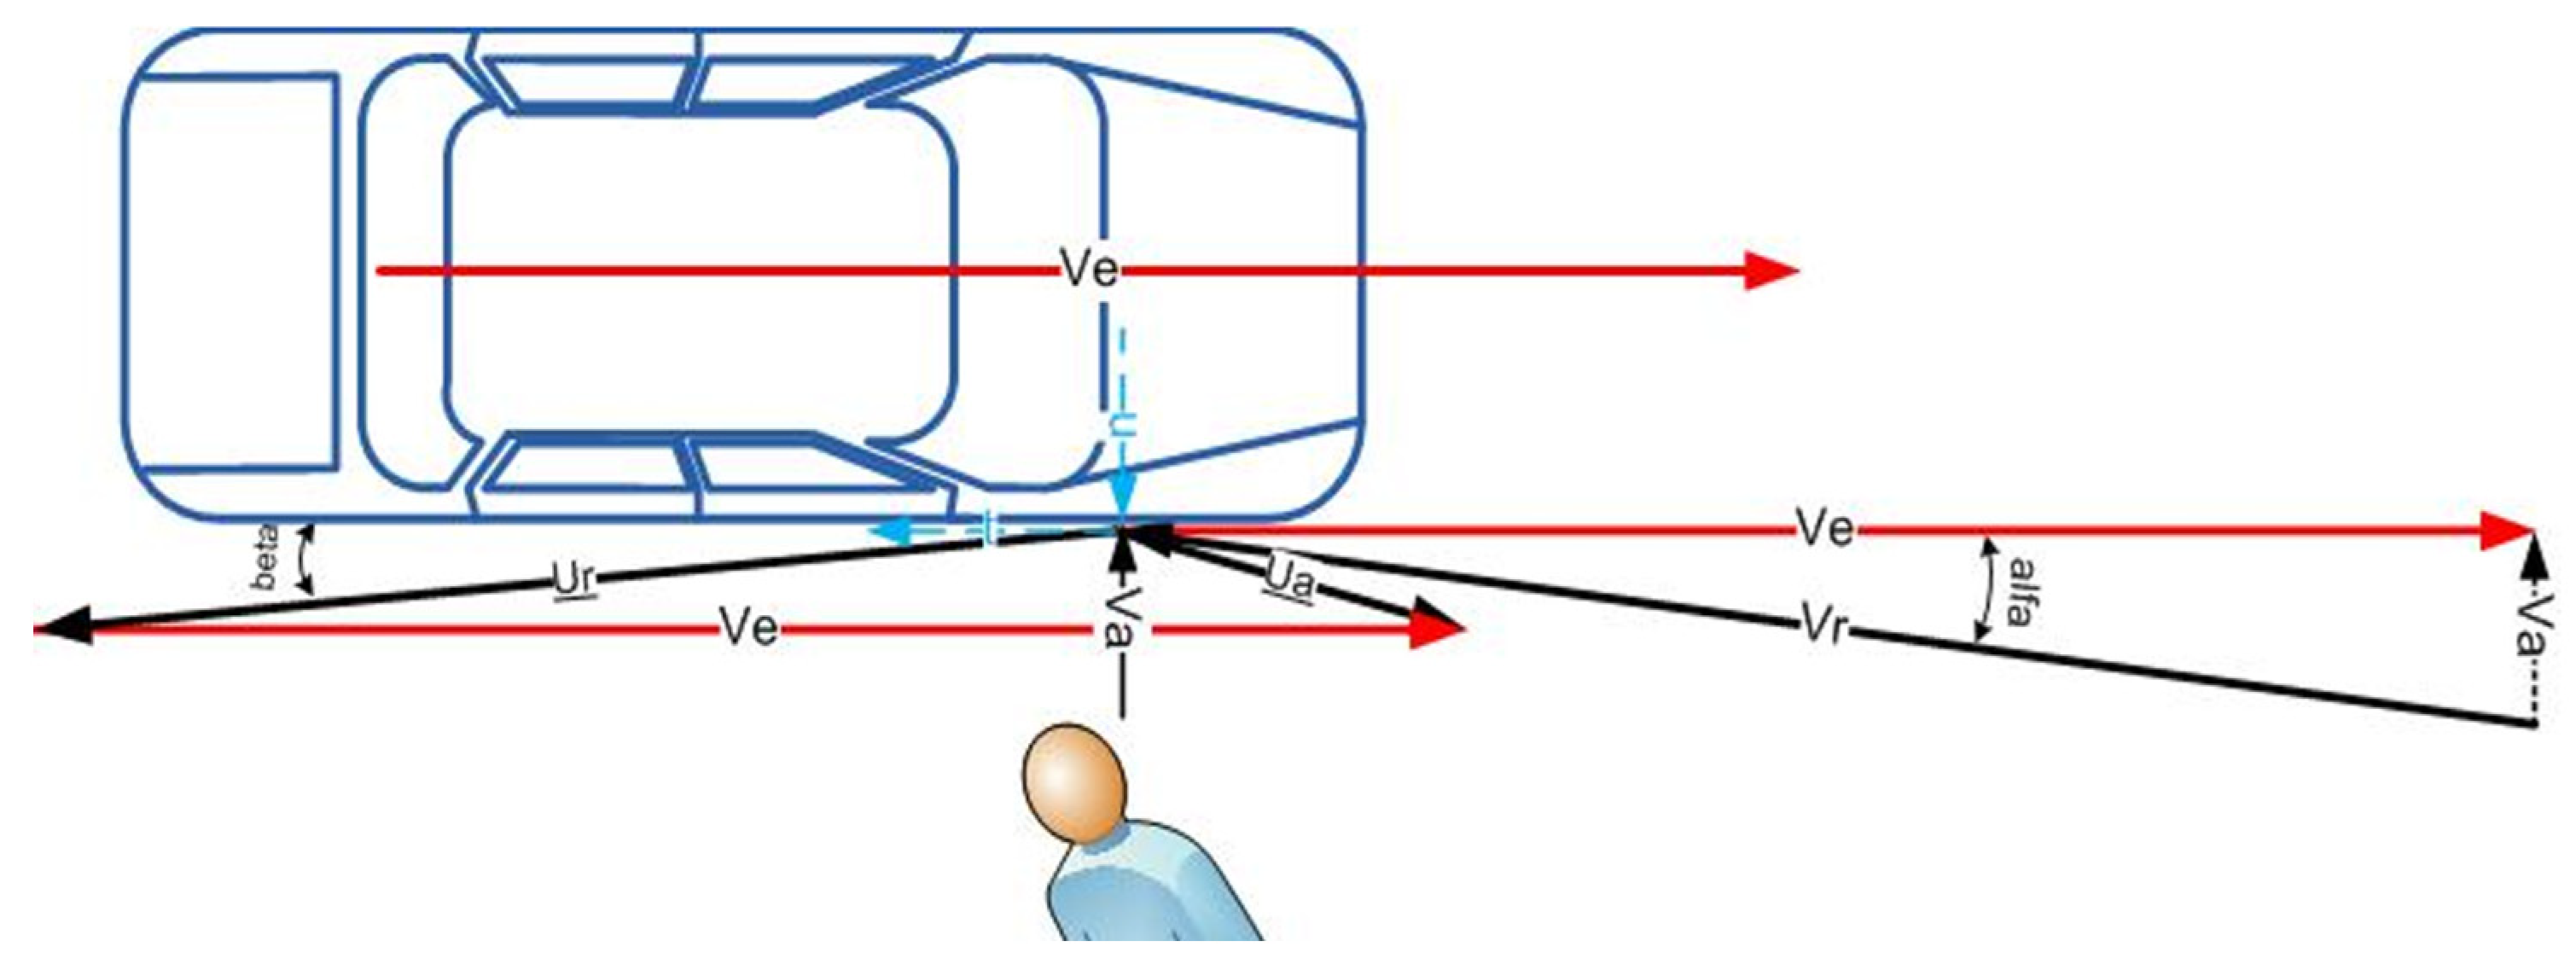
Figure 2 shows a vector diagram where the velocities before the collision are
, and after the impact are
.
The following relationships apply:
In this particular case, the coefficient of restitution, which evaluates the capacity of the impacting objects to recover after the impact, is k = 0.1—in accordance with the mechanism of impact, and the instantaneous coefficient of friction λ = 0.4 takes into account the deformation in the area of the car’s side mirror and the length of contact between the pedestrian and the vehicle (scratches were found along the entire right side of the Audi passenger car).
After transformation, the following relationships are obtained:
The pedestrian’s absolute velocity after the impact is determined by the expression:
For a side-impact mechanism between the vehicle and the pedestrian’s body, resulting in the body being propelled forward, an impact impulse must be generated, consisting of two components: the impact impulse of the normal impact force and a tangential component due to the tangential force of instantaneous friction, i.e.,
A necessary condition for the mechanism to operate (in the event of a side impact) is that there exists a relative velocity between the pedestrian and the vehicle in the direction of the pedestrian’s path of travel—in this case, an absolute velocity
. The absence of specific abrasions and the absence of scattered personal belongings suggest that, from a technical standpoint, it is more likely that the victim slid a short distance across the pavement following the collision with the passenger car. This implies that the body moved a short distance after the impact before coming to rest; given the significant difference in the masses of the two individuals, the long area of scraped-off dust on the vehicle, and the deformed right side mirror, corresponds to a relatively high speed of the pedestrian at the moment of initial contact with the vehicle. Otherwise, given the nature of the impact, the pedestrian’s body should have been thrown a greater distance at low speed, resulting in a longer slide along the pavement, which in turn would have caused specific traumatic injuries that are not found. In light of the facts presented thus far, as well as the data indicating a high blood alcohol content in the pedestrian, this expert opinion adopts the legally prescribed lower speed limit of the pedestrian absolute velocity V
a = 7 km/h = 1.94 m/s, relating to a pedestrian walking calmly while under the influence of alcohol. The car’s velocity V
e is the unknown quantity. From the graphical analysis in
Figure 2, the pedestrian’s relative speed V
r, appears to be:
Therefore, the angle of incidence is given by the expression:
After decomposing the vectors, the absolute velocity of the pedestrian’s body after the collision is given by the expression:
The distance the body is thrown is calculated using the formula:
where µ = 0.66 is the coefficient of sliding and rolling resistance of the body on the asphalt road surface; g = 9.81 m/s
2 is the acceleration due to gravity.
Given the significant difference in the speeds of the two participants and their masses, as well as the directions of their velocities at the moment of initial contact, it can be concluded that the body was propelled primarily forward/toward the mirror/and to a much lesser extent to the right, which in turn accounts for the relatively small value of the angle —within the boundaries of 5–100.
Another condition that must be met relates to the vehicle’s maximum possible speed at the moment of impact, which—in the absence of evidence of loss of stability while negotiating the curve (i.e., no skid marks)—must have been lower than the critical speed for the curve, above which, under the specific conditions, the vehicle would have skidded sideways.
Based on the determined radius of the outer edge of the right-hand curve of 44.00 m and given the described position of the pedestrian’s body after the impact, it is determined that at the moment of initial contact, the center of mass of the passenger car was approximately at the centerline. This indicates that, given the width of the right lane in this section as 7 m, the vehicle was traveling along a trajectory with a radius of 37.00 m. The critical speed at which the passenger car would have lost lateral stability is calculated using the formula:
where
0.56 is the coefficient of lateral friction (slide friction factor); β 1
—angle of superelevation of the road at the turn;
m—the radius of the trajectory of the passenger car around the moment of impact.
After substituting in (10), we get: .
When solving (3) and (7)–(9) simultaneously, the requirements are satisfied only for values of α = 8, 9, and 10 degrees: the speed of the passenger car is lower than the critical speed for the turn, and at the same time, the skid distance is within a narrow range—between 1 and 2 m. The results obtained are shown in
Table 1:
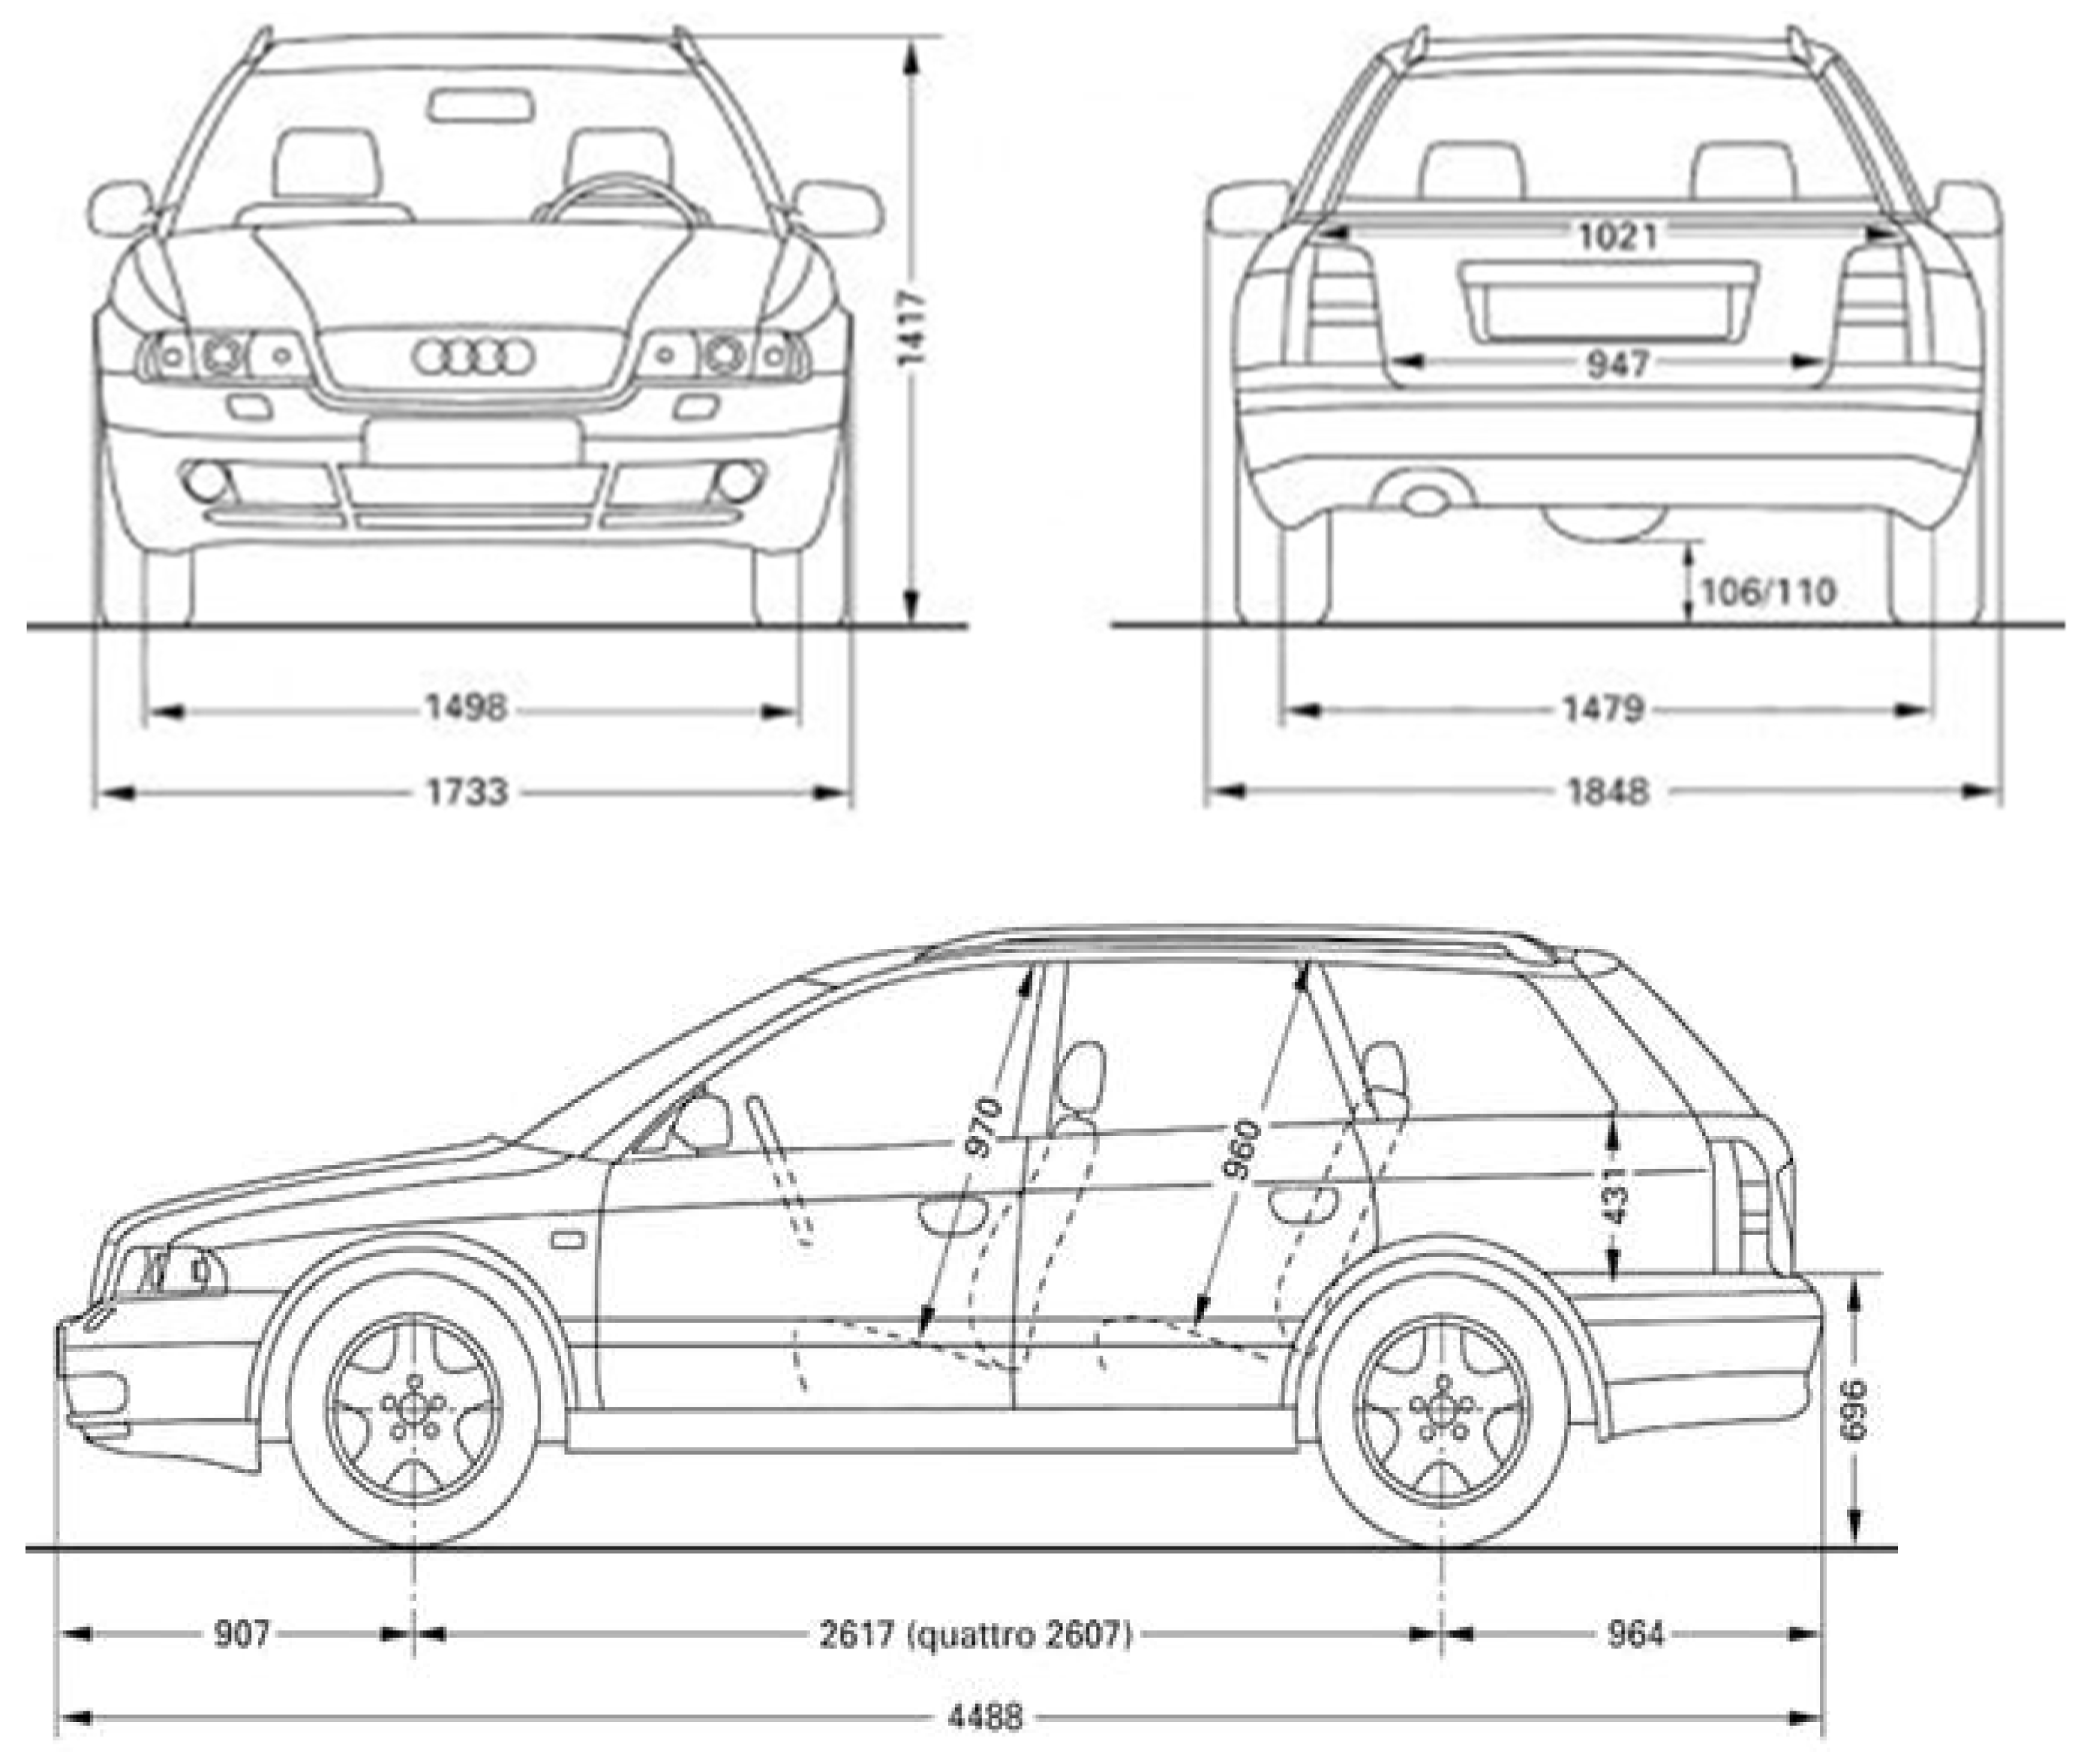
The three solutions presented are mathematically correct, but the 10 km/h difference between the calculated limit values for the vehicle’s speed at the moment of impact necessitates a more detailed analysis. The available data from the inspection report and the photo album prepared by the on-duty team, combined with known data on the vehicle’s technical parameters, shown in
Figure 3, with sufficient accuracy determine that the pedestrian’s body made initial contact with the vehicle at a distance of approximately 0.75 m behind its front bumper, with the body being thrown to the right side of the vehicle approximately 0.45 m in front of its rear bumper.
Given that the Audi passenger car is 4.488 m long, it follows that the pedestrian’s body was in contact with the car over a distance of 3.29 m. In this case, the following relationship could be derived with sufficient accuracy:
where
m is the area in contact with the vehicle;
0.6 m—the length of a pedestrian’s stride. After substitutions, the result is:
A comparison of the results in
Table 1 and (11) shows that the closest result from the table is
= 39.63 km/h, with a difference in speed of just 1.33 km/h. Since the method used to calculate (11) determines the approximate speed of the vehicle at the moment of initial contact with the pedestrian, it was used solely to identify the most technically reliable speed from among the speeds calculated in
Table 1, without being used in subsequent calculations.
Based on the analysis so far, it follows that the point of initial contact between the two parties was located approximately one meter before the spot where the vehicle came to rest following the traffic accident, and the vehicle’s speed at the moment of impact was approximately 40 km/h.
The most likely coordinates of the pedestrian’s center of mass at the moment of impact with the passenger car are approximately 9.5 m past the end of the crosswalk and approximately 0.5 m to the right of the centerline.
In the absence of other data regarding the vehicle’s movement, the analysis assumes that the speed of the passenger car prior to the accident was equal to its speed at the instant of initial contact: 39.63 km/h.
The traffic accident occurred during the night, and the collected evidence does not indicate which of the vehicle’s lights were on immediately before the accident.
It is known that the limit of the area illuminated by headlights, within which the average driver can detect an obstacle, is an illuminance of 2 to 3 lux.
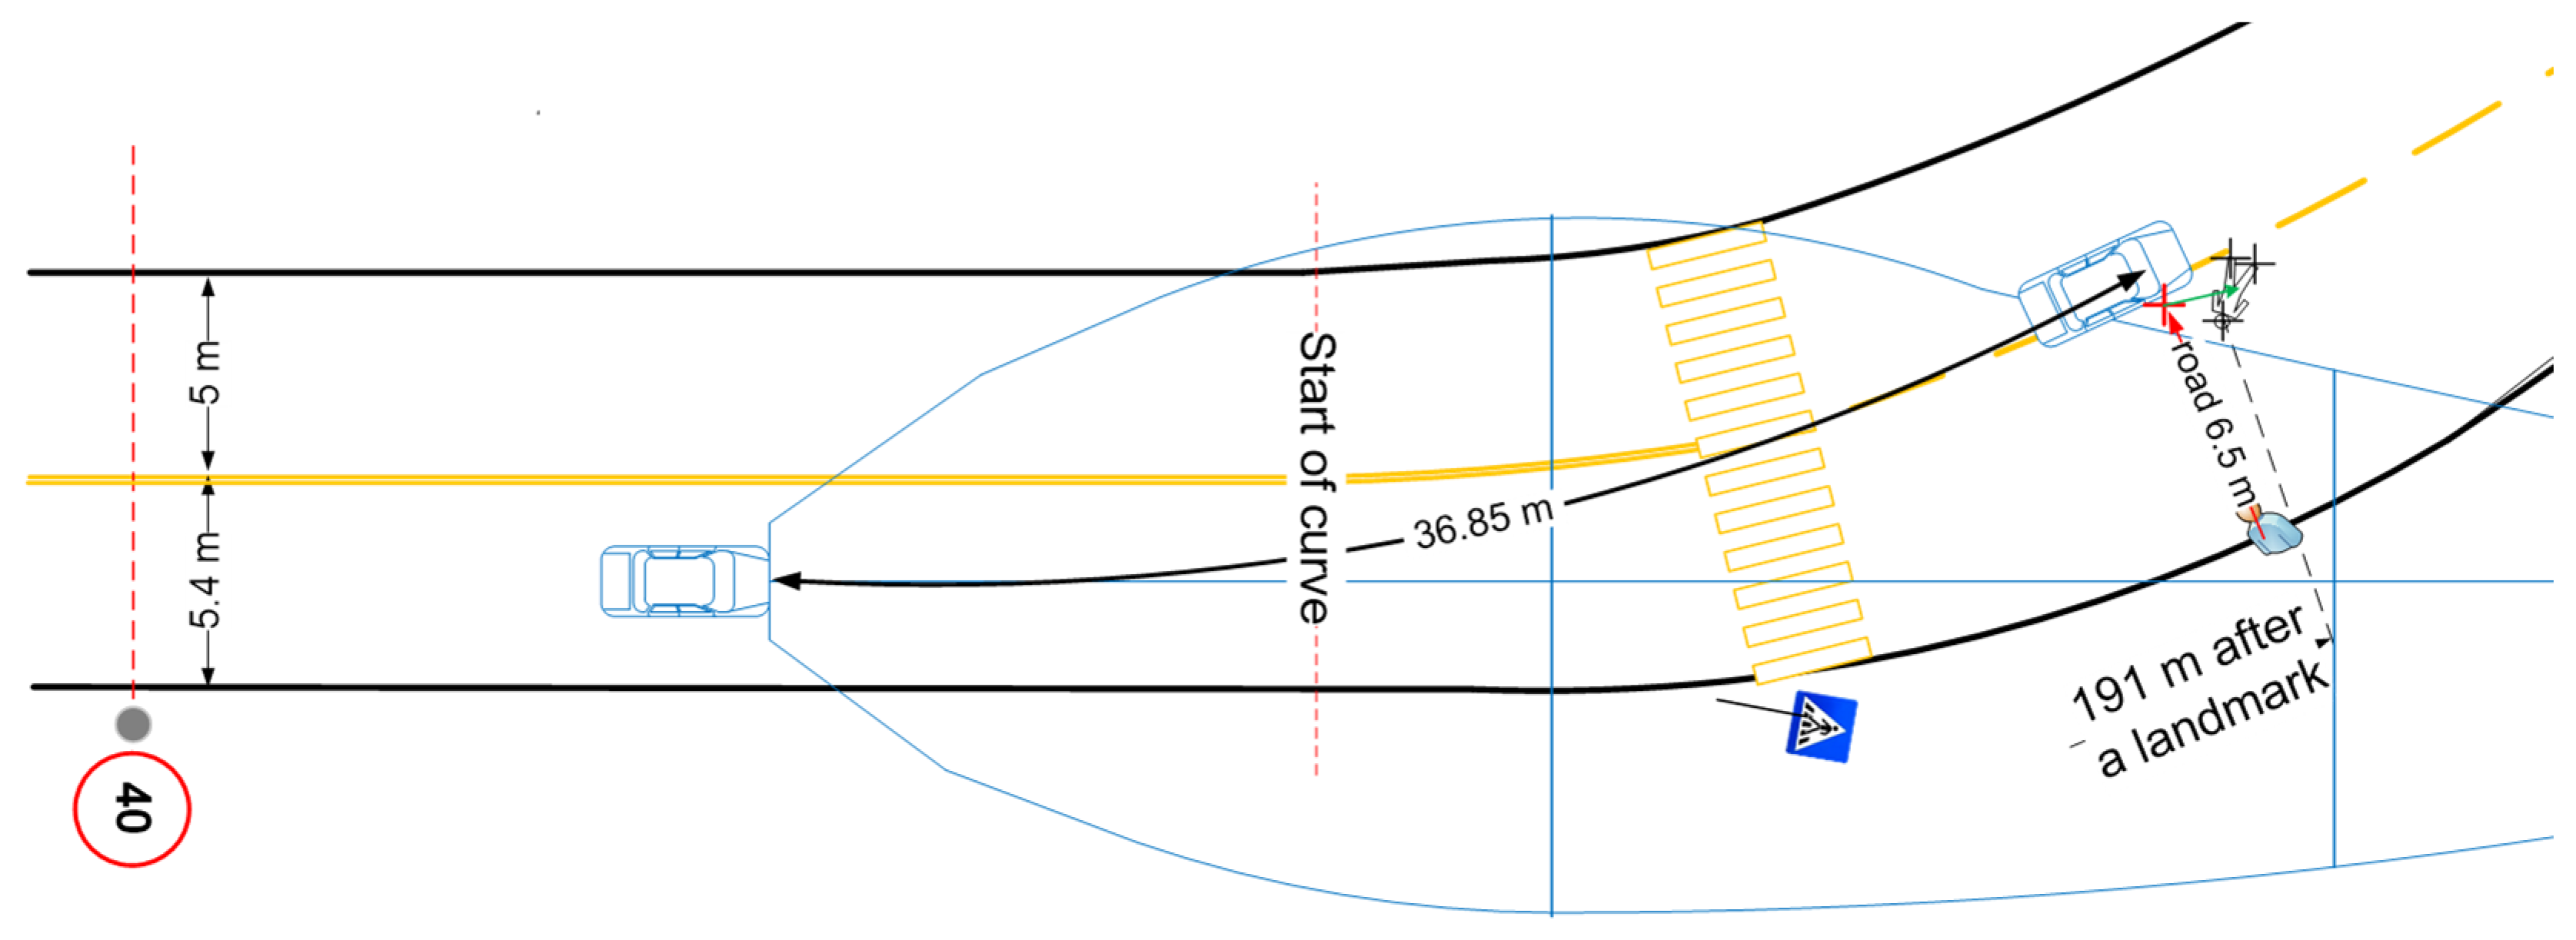
Figure 4 shows a schematic diagram of the boundaries of the illuminated area at the level of the optical axes of the low-beam headlights—blue outline (illuminance boundary of 2 lux)—for a technically sound lighting system on a vehicle with a European light distribution system.
Assuming that the vehicle was positioned approximately in the middle of its lane before entering the curve in question, while traveling in a straight line with its low beams on, the driver should have been able to perceive unlit objects ahead and to the left, along the left edge of the roadway at the start of the M 8.1-type marking (crosswalk), at a distance of approximately 28 m in front of the vehicle, as at that moment its front end was 30 m before the start of the crosswalk. Ahead, on the right, again at the start of the M 8.1 road marking, but 0.5 m to the right of its right edge, the driver could have seen an unlit object more than 75 m away.
The minimal stopping distance of a vehicle is calculated using the following formula:
where t
∑ = 1.8 s is the total time for reaction of the driver under night driving conditions and actuating the brakes with maximum braking deceleration; V
Audi = 39.63 km/h = 11 m/s—vehicle speed;
m/s
2—maximum braking deceleration for the specific road conditions.
After calculating (13), we obtain: = 28.64 m.
Comparing the shorter visibility distance to the left edge of the roadway relative to the M 8.1 marking, as shown in the diagram in
Figure 4, on the one hand, and the vehicle’s minimal stopping distance on the other, the following conclusion can be made. Assuming straight-line movement of an Audi passenger car with low beams on, under the specific road conditions, the speed at which the driver was operating the vehicle was correctly selected in relation to the visibility distance available to him at both edges of the roadway.
The above conclusions render meaningless any analysis based on the assumption of driving with high beams on, since given the described visibility distances at both ends of the roadway when driving with low beams and the calculated minimal stopping distance, it is clear that even when driving with high beams on, the vehicle’s speed was again correctly selected in relation to the visibility distance provided by the high beams.
The following graphical-analytical approach was used to determine whether the driver of the passenger car was able to perceive the pedestrian entering the roadway:
The time during which the pedestrian was moving, from the moment he crossed the right edge of the roadway until the moment of impact, is:
where
m is the distance passed by the pedestrian (as shown on the scale diagram);
—the pedestrian speed.
After substituting in (14), we obtain: .
Accordingly, 3.35 s before the impact, the vehicle was at the following distance from the point of impact:
Figure 5 shows that when the front of the passenger car was positioned in the center of its lane at the moment when it had 36.85 m remaining to travel to the point of impact, or at the moment when the pedestrian crossed the right edge of the roadway, the driver had visibility of the pedestrian provided by his low beams.
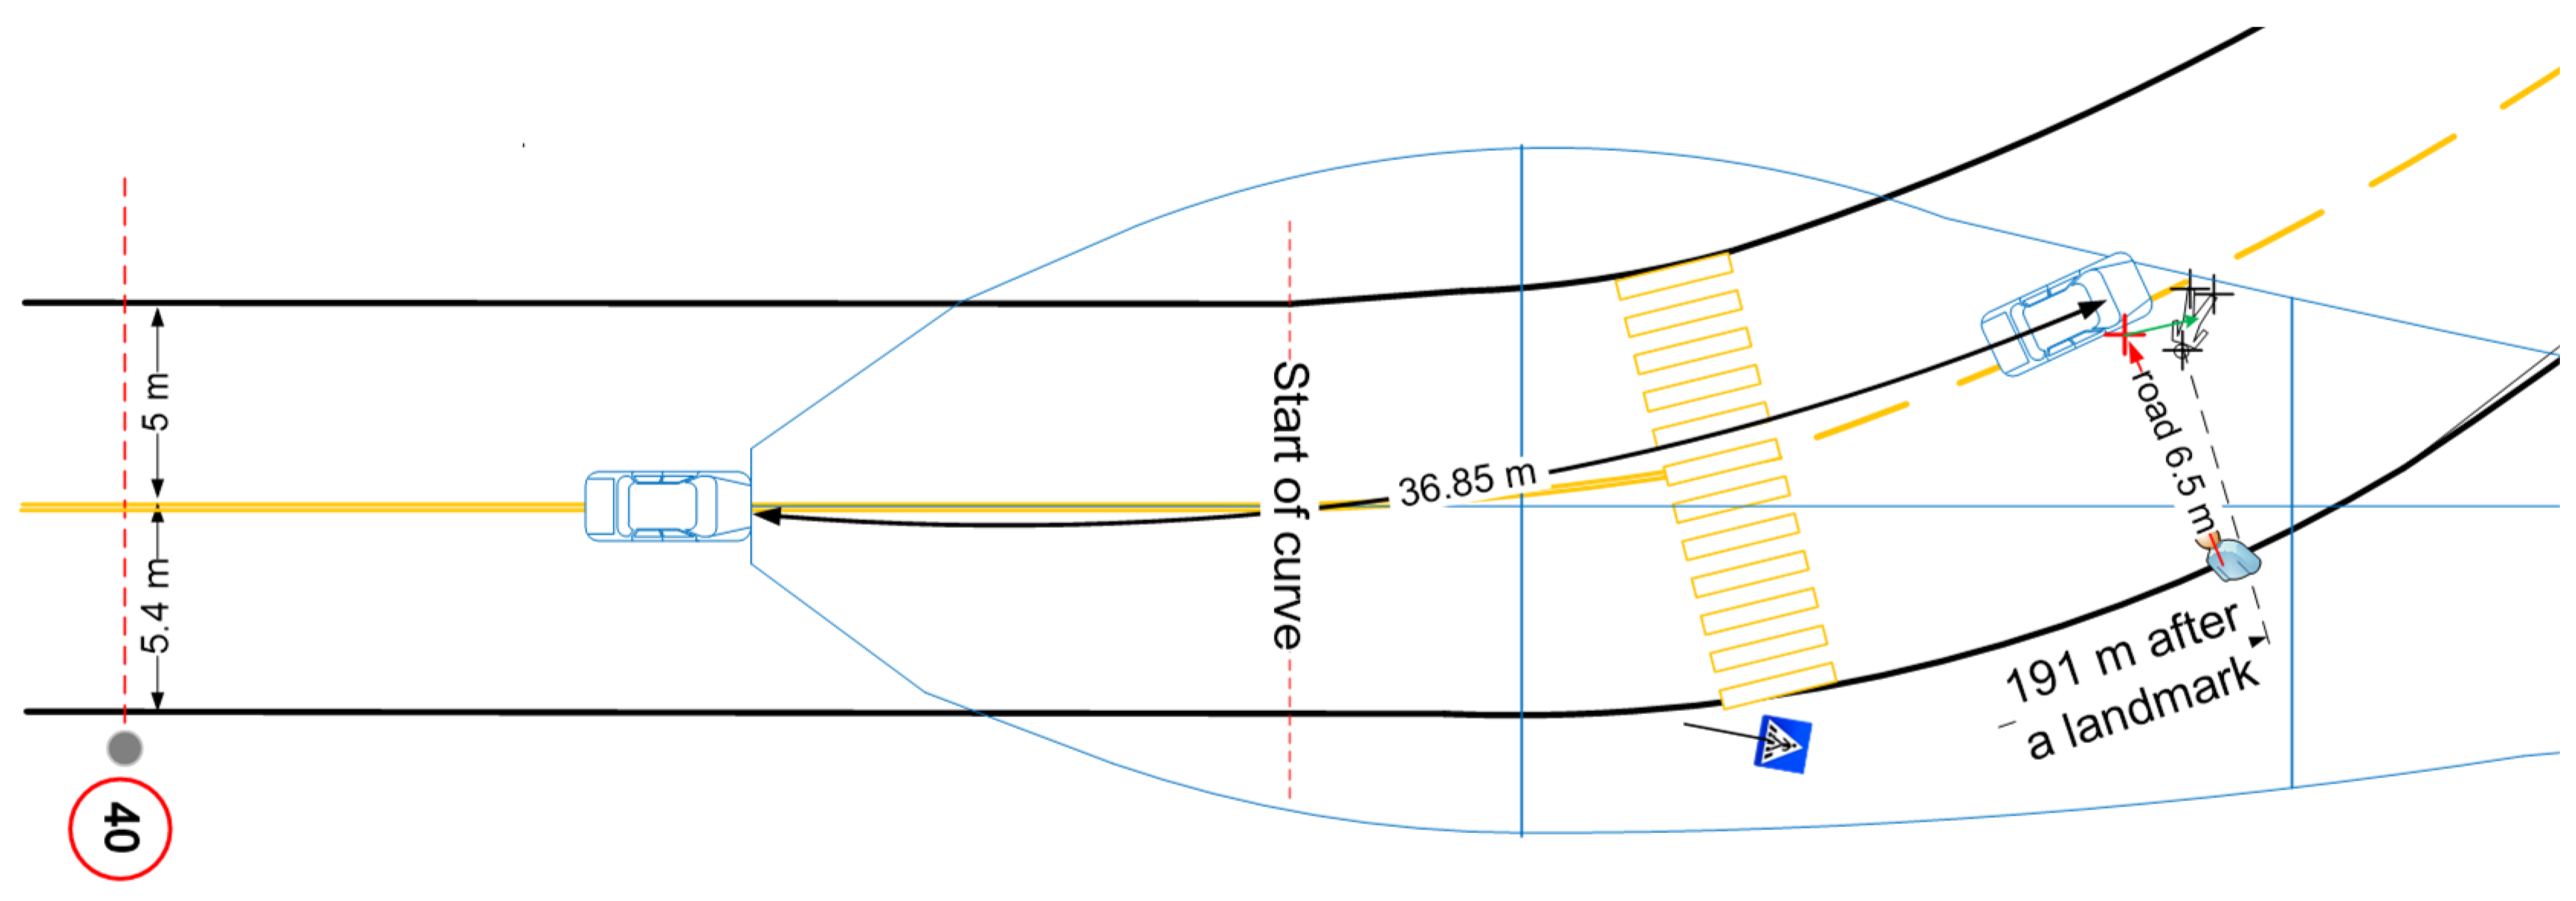
Since, at the moment of initial contact between the passenger car and the pedestrian, the passenger car’s center of mass was located approximately on the centerline of the roadway, and the exact moment when the driver steered the vehicle into the oncoming lane cannot be determined, for the sake of completeness of this study, the driver’s visibility 3.35 s before the accident will be examined, assuming that at that moment, the vehicle was positioned on the centerline—
Figure 6.
Figure 6 clearly shows that even when the front of the vehicle was positioned on the centerline at the moment when it had 36.85 m remaining to travel before the point of impact, or the moment when the pedestrian crossed the right edge of the roadway, the driver again had visibility of the pedestrian, provided by his low beams, since the pedestrian was within the illuminated area. In view of the above, a comparison of the results from (13) and (15) shows that the next inequality is satisfied:
From a technical standpoint, inequality (16) means that when the passenger car was traveling with its low beams on, and the pedestrian was walking at a steady pace, from the moment the pedestrian crossed the right edge of the roadway, the driver had the opportunity to stop before the point of impact at his actual speed and thus prevent the accident from occurring.