1. Introduction
The Fourth Industrial Revolution (Industry 4.0) calls for increasing levels of automation, digital intelligence, and data-driven operations in enterprises of all sizes. For SMEs in Southeast Asia, particularly in the booming skincare sector, competition is no longer shaped solely by product quality, but also by digital capabilities, responsiveness, and operational agility [
1,
2,
3,
4,
5]. Despite their economic significance, many Indonesian SMEs struggle with digital readiness due to limited technological literacy, low IT resources, and fragmented business processes [
6,
7,
8,
9].
Digital transformation (DT) frameworks emphasize the importance of data analytics as a foundational capability for SMEs transitioning into Industry 4.0 [
10,
11,
12]. However, many SMEs lack the infrastructure or skills to adopt advanced analytics such as machine learning, ARIMA, or deep learning [
13,
14,
15]. As a result, practical and lightweight forecasting models—such as the Trend Moment method—offer an accessible alternative that still enables data-driven decision-making [
16,
17,
18].
This study develops a web-based e-commerce system integrated with a Trend Moment demand forecasting module for Ainah Beautycare, an emerging skincare SME in Indonesia. Using 24 months of historical sales data, the system generates short-term forecasts to support inventory management and stock planning. The study contributes to the digital transformation discourse by demonstrating how simple analytics embedded in digital platforms can enhance SME competitiveness and accelerate Industry 4.0 adoption [
19,
20,
21,
22].
2. Related Work
2.1. Digital Transformation Approaches for SMEs
Prior research highlights that digital transformation (DT) is increasingly essential for SMEs to enhance efficiency, competitiveness, and long-term sustainability in the industry 4.0 era [
1,
2,
3,
4,
5]. SMEs adopting digital tools such as e-commerce platforms, cloud-based applications, and basic analytics demonstrate improved agility, customer reach, and operational performance [
6,
7,
8]. However, persistent constraints—including limited financial resources, inadequate digital skills, and fragmented IT infrastructures—continue to inhibit DT adoption in many developing regions [
9,
10,
11]. These findings collectively emphasize that SMEs require contextualized strategies that enable gradual, low-cost digital adoption.
2.2. Industry 4.0 Enablement and Readiness Models
Industry 4.0 frameworks underscore the integration of automation, cyber-physical systems, data analytics, and intelligent decision-support technologies [
12,
13,
14,
15]. For SMEs, achieving full-scale Industry 4.0 readiness remains challenging due to the complexity and cost of advanced technologies. Consequently, studies recommend phased adoption strategies where SMEs begin with accessible tools—such as web platforms, digitized workflows, and simple analytics—before transitioning to more sophisticated capabilities like IoT integration and predictive automation [
16,
17,
18]. Research further shows that incremental capability development enhances SME resilience and competitiveness while reducing technological risk [
19,
20,
21,
22,
23].
2.3. Forecasting Technologies in SME Operations
Forecasting plays a central role in optimizing inventory management, procurement planning, and production scheduling. Although machine learning and hybrid models can deliver superior accuracy, they often demand computational resources and expertise that SMEs may not possess [
24,
25]. Consequently, lightweight statistical models—such as moving averages, exponential smoothing, and Trend Moment analysis—are preferred alternatives due to their simplicity, interpretability, and minimal computational requirements [
26,
27,
28,
29]. These models are particularly suitable when SMEs have limited historical data, as is common in micro-scale retail and skincare businesses.
2.4. Integrated E-Commerce and Forecasting Systems
While the literature provides extensive discussions on forecasting methods and e-commerce adoption independently, fewer studies examine integrated systems that combine online sales platforms with embedded forecasting capabilities. Existing works highlight that embedding analytics into operational systems can enhance decision-making, but implementations for SMEs remain limited due to resource constraints [
17,
18,
30]. This creates an opportunity for practical, system-level solutions that support SMEs’ transition toward data-driven operations without requiring advanced infrastructures.
2.5. Research Gap
Across the reviewed studies, two key gaps emerge:
Limited implementation of forecasting models directly within SME e-commerce platforms, and
Lack of lightweight, accessible digital solutions tailored for micro-scale product-based businesses.
This study addresses both gaps by integrating the Trend Moment forecasting method into a web-based e-commerce system designed for Ainah Beautycare. The proposed solution demonstrates how simple statistical forecasting embedded within daily operations can support early-stage digital transformation and Industry 4.0 readiness for SMEs.
3. Methodology
3.1. Data Collection
Data was collected from Ainah Beautycare, an SME skincare retailer based in Palangkaraya, Indonesia. Sales records for monthly total units sold across all skincare product lines were obtained from August 2022 through July 2024. After cleaning for missing or anomalous entries, the dataset consisted of 24 observations as shown in
Table 1.
3.2. Trend Moment Forecasting Model
The Trend Moment method assumes a linear relationship over time:
where
= observed sales in period t.
= time index (1, 2, 3, …, n).
a = intercept (estimated as mean of Y minus b times mean of X).
Forecasts for future periods (e.g., months (n + 1, n + 2, …)) are generated by substituting (X) values accordingly.
3.3. System Development
The system is a web-based application supporting:
Customer module: product browsing, ordering.
Admin module: inventory, product management, sales records, and prediction module.
Prediction module: taking historical sales data, applying Trend Moment method, outputting forecasts and visual reports.
Technologies used: PHP 8.0 (backend), MySQL 8.0 (database), deployed on XAMPP 8.2 for development. System design uses UML artifacts: Use Case Diagram, Class Diagram, Sequence Diagrams, Activity Diagrams, ERD.
3.4. Evaluation Metrics
Forecast accuracy is evaluated using:
Mean Absolute Percentage Error (MAPE):
where
is the forecast value for period
t.
Additionally, system functionality is tested via Black-Box testing to ensure that all modules (ordering, prediction, reporting) behave correctly as per functional requirements.
4. System Design and Implementation
4.1. Architecture
The system architecture uses a three-tier design to ensure clarity and scalability. The Presentation Layer provides the web interface for customers and administrators. The Application Layer manages core business processes, including order handling, forecasting calculations, and sales reporting. The Data Layer stores essential information in a MySQL database, such as product data, user accounts, and historical sales records. This structure streamlines system operations and supports smooth integration between the e-commerce platform and the forecasting module.
4.2. UML Modeling
The system’s behavior is illustrated through several UML diagrams. The Use Case Diagram defines two main actors—Admin and Customer—where the admin manages products, views sales, and runs the forecasting feature, while the Customer browses items, places orders, and checks order history. The Activity Diagram outlines the forecasting workflow, including selecting the period, processing historical sales data, running the Trend Moment calculation, and displaying the results. The Sequence Diagram shows how the interface, application logic, and database interact when a prediction request is executed. These diagrams collectively clarify system processes and user interactions.
4.3. Prediction Module Interface
The forecasting module enables the admin to define the start and end periods of historical data, set the desired forecast horizon, and generate predictions for upcoming months. The system outputs forecasted sales values, error metrics, and a graphical visualization that includes both historical data and projected trend lines. Interface screenshots and generated graphs further illustrate the forecasting results within the platform.
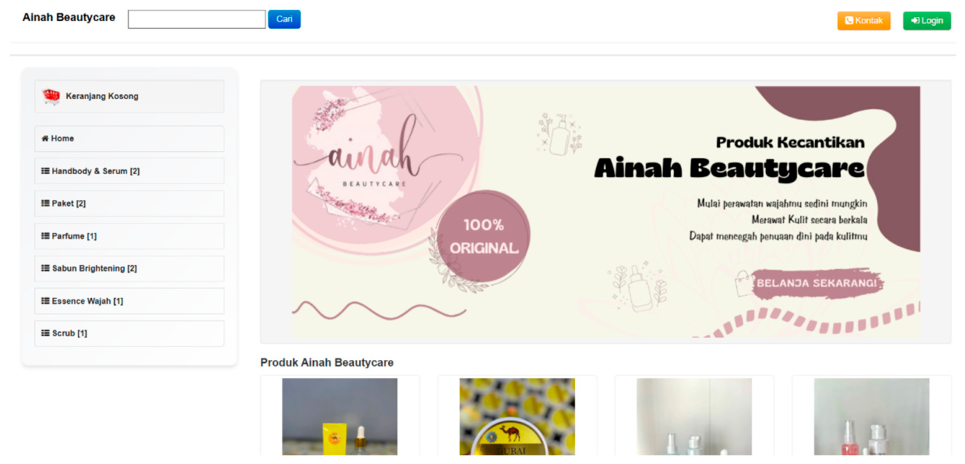
Figure 1 shows the main page of the web-based e-commerce system developed for the skincare business. The interface presents product categories, promotional banners, and featured items to facilitate user navigation and improve the overall customer experience. The design emphasizes simplicity and responsiveness, enabling customers to browse skincare products efficiently across different devices. This landing page serves as the central access point for customers and integrates seamlessly with the platform’s shopping cart, checkout process, and user account management modules.
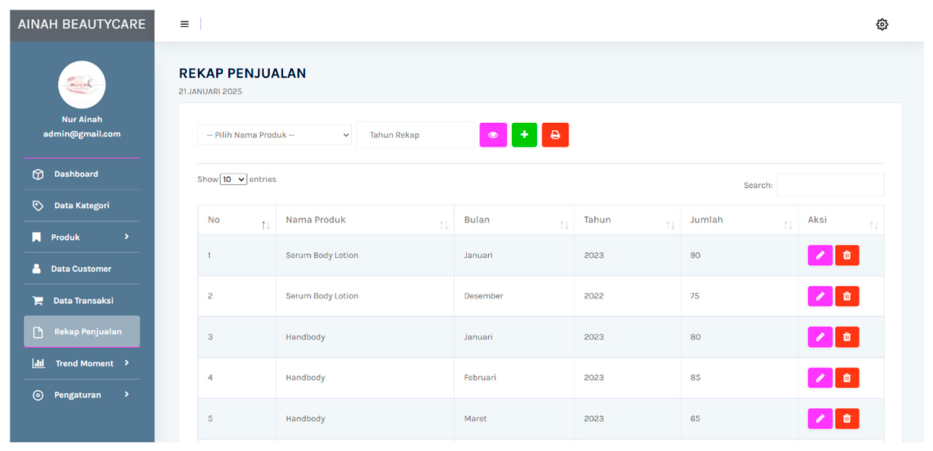
Figure 2 displays the sales report page, which provides administrators with real-time information on transaction data and historical sales trends. The page includes a tabulated summary of daily, weekly, and monthly sales, enabling the business owner to monitor performance and identify demand patterns. This reporting module acts as the primary data source for forecasting, as it automatically compiles sales records generated from the e-commerce system. By digitizing sales monitoring, the system reduces manual reporting errors and supports more informed decision-making.
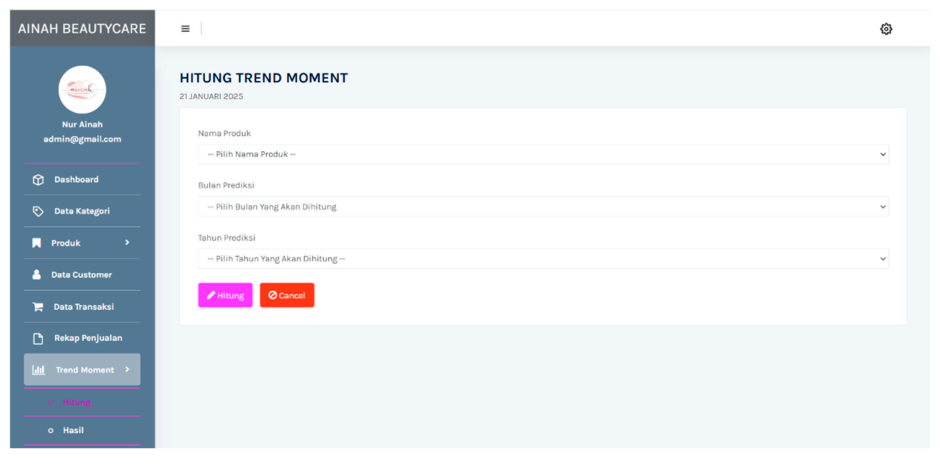
Figure 3 illustrates the sales forecasting page, where the Trend Moment forecasting method is executed using historical sales data. This page allows administrators to view input parameters, initiate forecasting processes, and access predictive outputs. The interface displays the fitted trend line, the computed forecasting parameters (intercept and slope), and visualizations of predicted values. This module bridges operational data with analytical capabilities, making forecasting accessible to users without technical expertise.
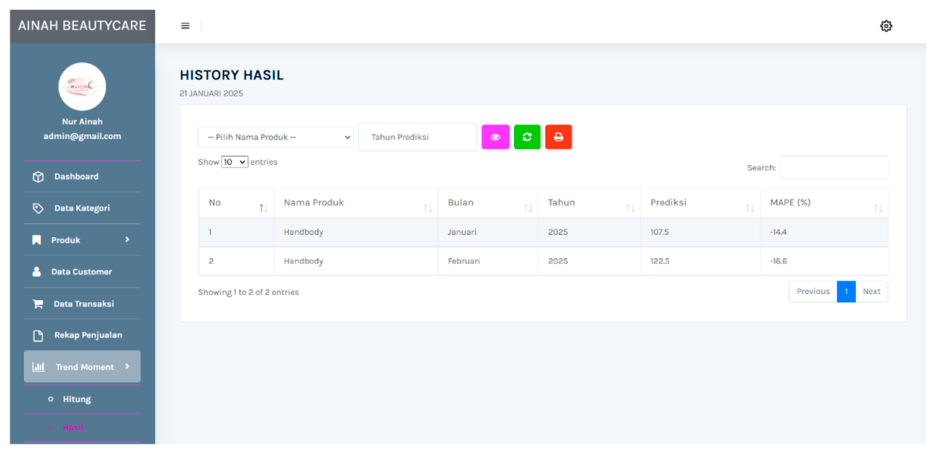
Figure 4 presents the forecasting results page, which summarizes the predicted sales values for upcoming months. The results are shown in both numerical and graphical formats, enabling users to quickly interpret expected demand. This page includes key indicators such as forecasted quantities, error metrics, and visual trend projections. By providing clear and actionable forecasting insights, the system helps skincare SMEs optimize inventory levels, streamline production planning, and enhance business responsiveness.
5. Results and Discussion
5.1. Model Fit and Accuracy
The Trend Moment model successfully captures the mild downward trend in sales (slope ). The in-sample forecasting error is relatively low:
Table 2 summarizes the key statistical parameters computed from the 24-month sales dataset, including the sums of
,
,
, and
. These values form the basis for estimating the Trend Moment model’s slope and intercept, which are essential for generating fitted and forecasted sales values.
Table 3 presents the performance metrics of the Trend Moment model. The results include the computed intercept and slope, error statistics, and the overall MAPE of 9.54%. These indicators confirm that the model provides sufficiently accurate predictions for short-term operational use.
5.2. Forecast Results (12 Months Ahead)
Table 4 presents the forecasted sales values generated by the Trend Moment method for the months following July 2024. The results show a stable and gradually declining linear trajectory, consistent with the negative slope of the fitted model. Although the changes between months are minimal, this pattern reflects the steady demand typically observed in skincare products, where customer purchasing behavior is relatively consistent over time. The model’s ability to provide smooth and predictable forecasts demonstrates its suitability for short-term planning, particularly in small-scale businesses with limited data availability.
The forecast values offer practical guidance for inventory control, production scheduling, and procurement planning. For skincare SMEs, anticipating monthly demand is essential due to product shelf life considerations and fluctuating customer interest driven by trends and promotional activities. By providing clear numerical predictions,
Table 4 helps business owners avoid overstocking or stockouts, supporting more efficient resource allocation. Furthermore, the forecasting output serves as a foundational analytical layer that can be expanded into more advanced models as the business progresses in its digital transformation journey.
Table 5 presents the short-term forecast evaluation for August to December 2024, comparing actual sales with Trend Moment predictions and calculating the monthly MAPE. The results show that the model performs reliably, with low errors in August (2.2%), October (0.3%), and December (8.4%), indicating strong alignment with typical demand levels. Higher deviations in September (12.7%) and November (8.5%) suggest temporary fluctuations likely influenced by promotional activity or seasonal shifts common in skincare markets. The Trend Moment method provides sufficiently accurate short-term forecasts to support inventory planning and production decisions for skincare SMEs.
Table 6 provides a detailed view of the in-sample performance of the Trend Moment model across 24 months of historical sales data, comparing actual values with fitted estimates and reporting the corresponding errors. The results show that the fitted values generally follow the direction of the actual sales trend, despite natural fluctuations in the skincare market caused by promotions, seasonal variations, and customer behavior shifts.
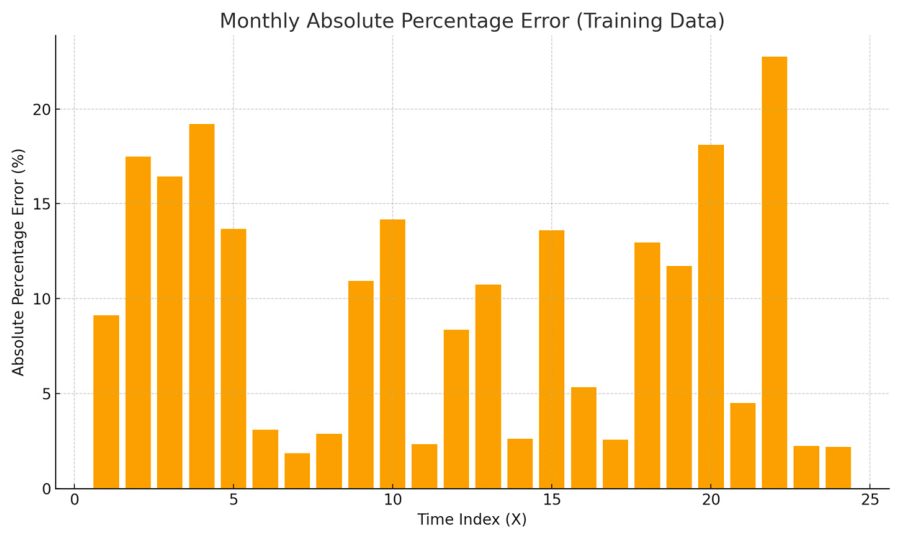
Months with higher Absolute Percentage Error—such as September 2022 (17.49%), November 2022 (19.19%), March 2024 (18.10%), and May 2024 (22.74%)—indicate irregular demand spikes that a linear model is not designed to fully capture. Nevertheless, many months exhibit low errors below 5%, demonstrating that the Trend Moment approach effectively models the overall trend. With an overall MAPE of 9.54%, the table confirms that the model provides sufficiently accurate and stable estimations for operational forecasting and decision support within the skincare business context.
5.3. Figures
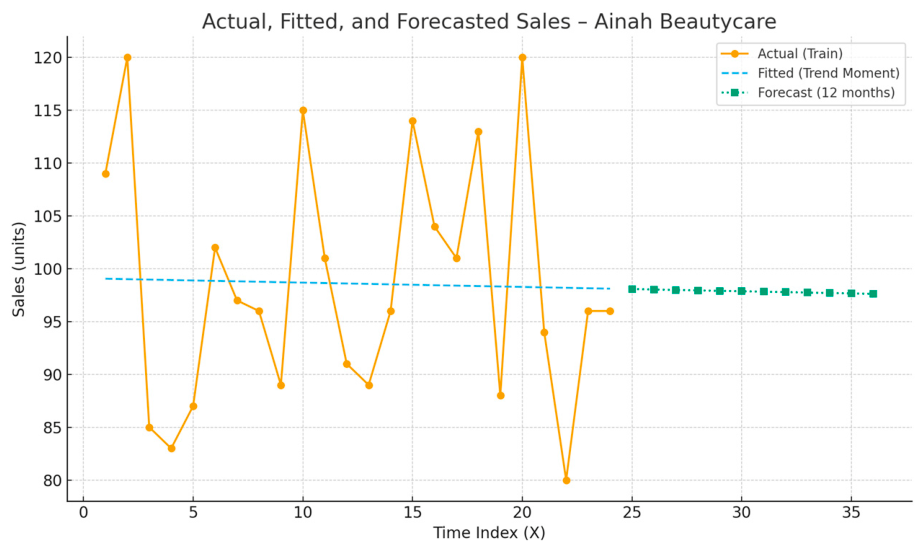
Figure 5 illustrates the comparison between actual sales values, fitted values generated by the Trend Moment model, and the 12-month ahead forecast.
The plot demonstrates that the fitted values closely follow the overall pattern of the historical data across the 24-month period, indicating that the Trend Moment model is capable of capturing the general direction and magnitude of sales fluctuations. Although minor deviations occur in months with unusually high or low demand, the fitted line successfully represents the long-term linear trend of the series. The model reveals a mild downward slope, consistent with the negative coefficient , suggesting a gradual decline in monthly sales over the observation period.
Overall,
Figure 5 confirms that the Trend Moment method provides an interpretable and sufficiently accurate representation of short-term sales dynamics, making it suitable for resource-constrained SMEs pursuing early-stage digital transformation.
Figure 6 presents the monthly Absolute Percentage Error (APE) values across the 24-month training dataset. Collectively,
Figure 6 demonstrates that the Trend Moment model provides predictable and stable error behavior, making it a practical choice for integration into SME e-commerce platforms as a lightweight forecasting tool.
5.4. Discussion
The integration of the Trend Moment forecasting method into a web-based e-commerce system offers a practical and effective approach for enhancing operational decision-making in the skincare business domain. The results indicate that the forecasting module successfully generates short-term demand estimations that align closely with historical sales patterns, achieving a MAPE of 9.54%. This level of accuracy is particularly valuable for skincare SMEs, where demand is often influenced by marketing cycles, product trends, and seasonal variations.
Embedding the forecasting engine directly into the e-commerce platform creates a seamless data flow from transaction records to predictive analytics. This integration not only automates the forecasting process but also increases the usability of the system for business owners who may not possess formal analytical expertise. Through this architecture, the system functions as an intelligent decision-support tool capable of informing stock management, production planning, and procurement activities.
From a broader perspective, the study demonstrates how simple statistical forecasting can strengthen the digital ecosystem of a skincare business. By transforming routine sales data into actionable insights, the system supports the transition from intuition-driven operations to structured, data-driven workflows. This shift contributes meaningfully to early-stage digital transformation, enabling skincare SMEs to adopt analytical capabilities without requiring advanced infrastructure or specialized human resources.
Furthermore, the integration approach highlights scalability potential. The Trend Moment model serves as an initial analytical layer that can be expanded to more advanced forecasting techniques as the business grows. This modular design ensures that the e-commerce platform can evolve into a more comprehensive digital system aligned with higher levels of Industry 4.0 maturity.
6. Conclusions
This study concludes that integrating the Trend Moment forecasting method into a web-based e-commerce system offers a practical, accessible, and impactful solution for skincare businesses seeking to enhance operational efficiency. The forecasting module demonstrated reliable performance, achieving a MAPE of 9.54%, which is sufficiently accurate for short-term decision-making related to inventory control, production scheduling, and supply planning. The seamless incorporation of forecasting into the digital sales environment ensures that insights are generated automatically and can be directly utilized by business owners without requiring analytical expertise.
The research further emphasizes that even simple forecasting methods can catalyze digital transformation within SMEs by enabling data-driven decision-making and reducing dependence on manual estimation. For skincare businesses operating in highly dynamic and trend-driven markets, this capability contributes to improved responsiveness, reduced stock-related risks, and greater competitive advantage.
Future developments may explore the incorporation of advanced forecasting models such as ARIMA, Prophet, or LSTM to account for nonlinear patterns and seasonality in skincare demand. Additional enhancements could include extending the system into multi-product environments, integrating supplier and logistics data, and adopting IoT-based monitoring for real-time inventory tracking. These extensions will further strengthen the role of forecasting as a core intelligence component in web-based e-commerce ecosystems for SMEs.
Author Contributions
Conceptualization, A.M.; Methodology, I.S.W., S.A.N.; System Design and Coding, A.M., S.; Data Curation and Sales Forecasting Analysis, S.A.N., S.; AI Narration and Concept Development, I.S.W., A.M.; Writing—Original Draft Preparation, S.A.N., A.M.; Writing—Review and Editing, S., I.S.W.; Supervision, I.S.W.; Project Administration, A.M.; Corresponding Author, I.S.W. All authors have read and agreed to the published version of the manuscript.
Funding
This research received no external funding.
Institutional Review Board Statement
Not applicable.
Informed Consent Statement
Not applicable.
Data Availability Statement
The data presented in this study are available on request from the corresponding author.
Conflicts of Interest
The authors declare no conflicts of interest.
References
- Purnomo, S.; Nurmalitasari, N.; Nurchim, N. Digital transformation of MSMEs in Indonesia: A systematic literature review. J. Manag. Digit. Bus. 2024, 4, 301–312. [Google Scholar] [CrossRef] [Scilit]
- Kallmuenzer, A.; Mikhaylov, A.; Chelaru, M.; Czakon, W. Adoption and performance outcome of digitalization in small and medium-sized enterprises. Rev. Manag. Sci. 2025, 19, 2011–2038. [Google Scholar] [CrossRef] [Scilit]
- Nazaruddin, I.; Utami, E.R.; Rahmawati, E. Digitalization challenges for SMEs: A systematic literature review perspective and future research. JBTI J. Bisnis Teor. Dan Implementasi 2024, 15, 15–43. [Google Scholar] [CrossRef] [Scilit]
- da Silva, N.A.; Abreu, J.L.; Orsolin Klingenberg, C.; Antunes Junior, J.A.V.; Lacerda, D.P. Industry 4.0 and micro and small enterprises: Systematic literature review and analysis. Prod. Manuf. Res. 2022, 10, 696–726. [Google Scholar] [CrossRef] [Scilit]
- Huang, K.; Wang, K.; Lee, P.K.; Yeung, A.C. The impact of industry 4.0 on supply chain capability and supply chain resilience: A dynamic resource-based view. Int. J. Prod. Econ. 2023, 262, 108913. [Google Scholar] [CrossRef] [Scilit]
- Satar, M.S.; Alharthi, S.; Alarifi, G.; Omeish, F. Does digital capabilities foster social innovation performance in social enterprises? Mediation by firm-level entrepreneurial orientation. Sustainability 2024, 16, 2464. [Google Scholar] [CrossRef] [Scilit]
- Choon, W.C.; Ali, S.M. Digital transformation and sustainable supply chain performance: A systematic literature review. J. Technol. Manag. Technopreneurship (JTMT) 2025, 13. [Google Scholar] [CrossRef] [Scilit]
- Anatan, L.; Nur. Micro, small, and medium enterprises’ readiness for digital transformation in Indonesia. Economies 2023, 11, 156. [Google Scholar] [CrossRef] [Scilit]
- Ben Slimane, S.; Coeurderoy, R.; Mhenni, H. Digital transformation of small and medium enterprises: A systematic literature review and an integrative framework. Int. Stud. Manag. Organ. 2022, 52, 96–120. [Google Scholar] [CrossRef] [Scilit]
- Huang, W.; Ichikohji, T. A review and analysis of the business model innovation literature. Heliyon 2023, 9, e17895. [Google Scholar] [CrossRef] [Scilit] [PubMed]
- Low, M.P.; Seah, C.S.; Cham, T.H.; Teoh, S.H. Digitalization adoption for digital economy: An examination of Malaysian small medium-sized enterprises through the technology–organization–environment framework. Bus. Process Manag. J. 2022, 28, 1473–1494. [Google Scholar] [CrossRef] [Scilit]
- Gold, K.L. Effects of industry 4.0 on small and Medium-Scale enterprises: An analytical and bibliometric review. Sage Open 2025, 15, 1–18. [Google Scholar] [CrossRef] [Scilit]
- Valdez-Juárez, L.E.; Ramos-Escobar, E.A.; Hernández-Ponce, O.E.; Ruiz-Zamora, J.A. Digital transformation and innovation, dynamic capabilities to strengthen the financial performance of Mexican SMEs: A sustainable approach. Cogent Bus. Manag. 2024, 11, 2318635. [Google Scholar] [CrossRef] [Scilit]
- Kulkarni, V.N.; Gaitonde, V.N.; Kotturshettar, B.B. Product lifecycle management (PLM): A key enabler in implementation of industry 4.0: A key enabler in implementation of industry 4.0. In Handbook of Smart Materials, Technologies, and Devices: Applications of Industry 4.0; Springer International Publishing: Cham, Switzerland, 2022; pp. 349–380. [Google Scholar] [CrossRef] [Scilit]
- Nozari, H.; Sadeghi, M.E.; Najafi, S.E. Quantitative Analysis of Implementation Challenges of IoT-Based Digital Supply Chain (Supply Chain 0/4). arXiv 2022, arXiv:2206.12277. [Google Scholar] [CrossRef] [Scilit]
- Ma, L.; Zhang, X.; Dong, L. Enhancing sustainable performance: The innovative strategy of digital transformation leading green collaborative management. Sustainability 2023, 15, 13085. [Google Scholar] [CrossRef] [Scilit]
- Windiarti, I.S.; Putri, C.; Haryadi, H.; Prabowo, A. Pemberdayaan masyarakat melalui e-commerce pemesanan buket bunga responsif di Bouqet_PKY. Abdimas Papua J. Community Serv. 2024, 6, 65–71. [Google Scholar] [CrossRef] [Scilit]
- Prabowo, A.; Hidayat, D.; Windiarti, I.S. Penguatan UMKM Kesenian melalui Digitalisasi Penyewaan Baju Adat Berbasis CodeIgniter di Sanggar Riak Renteng Tingang. Abdimas Papua J. Community Serv. 2025, 7, 21–28. [Google Scholar] [CrossRef] [Scilit]
- Gunawan, A.A.N.; Windiarti, I.S.; Nasution, U.B.; Utomo, S.T.; Asuhadi, S. Investigating the role of digital transformation, digital knowledge management and digital innovation on sustainable performance (SDG) of SMES. J. Lifestyle SDGs Rev. 2024, 4, e02047. [Google Scholar] [CrossRef] [Scilit]
- Windiarti, I.S.; Miftahurrisqi, M. Perencanaan implementasi komputasi awan pada infrastruktur Universitas Muhammadiyah Palangkaraya. J. Sains Komput. Dan Teknol. Inf. 2022, 4, 59–64. [Google Scholar] [CrossRef] [Scilit]
- Miftahurrisqi, M.; Windiarti, I.S.; Haryanto, D. Edukasi dan Peningkatan Kompetensi It-Security Dan E-Commerce Bagi Mahasiswa Ma’had Asy-Syafi’i Universitas Muhammadiyah Palangkaraya. J. Martabe 2021, 4, 963–969. [Google Scholar]
- Sommerville, I. Software Engineering, 10th ed.; Pearson Education Limited: Essex, UK, 2016. [Google Scholar]
- Al-Karkhi, M.I.; Rza̧dkowski, G. Innovative machine learning approaches for complexity in economic forecasting and SME growth: A comprehensive review. J. Econ. Technol. 2025, 3, 109–122. [Google Scholar] [CrossRef] [Scilit]
- Yang, H.; Yu, L. A method of forecasting cross-border e-commerce stocking for SMEs based on demand characteristics and sequence trends under sustainable development strategy. Int. J. Comput. Syst. Eng. 2023, 7, 57–66. [Google Scholar] [CrossRef] [Scilit]
- Zellner, M.; Abbas, A.E.; Budescu, D.V.; Galstyan, A. A survey of human judgement and quantitative forecasting methods. R. Soc. Open Sci. 2021, 8, 201187. [Google Scholar] [CrossRef] [Scilit] [PubMed]
- Hyndman, R.J.; Athanasopoulos, G. Forecasting: Principles and Practice, 3rd ed.; OTexts: Melbourne, Australia, 2021. [Google Scholar]
- Sánchez, E.; Calderón, R.; Herrera, F. Artificial intelligence adoption in SMEs: Survey based on TOE–DOI framework, primary methodology and challenges. Appl. Sci. 2025, 15, 6465. [Google Scholar] [CrossRef] [Scilit]
- Makridakis, S.; Petropoulos, F.; Spiliotis, E. Introduction to the M5 forecasting competition Special Issue. Int. J. Forecast. 2022, 38, 1279. [Google Scholar] [CrossRef] [Scilit] [PubMed]
- Koutsandreas, D.; Spiliotis, E.; Petropoulos, F.; Assimakopoulos, V. On the selection of forecasting accuracy measures. J. Oper. Res. Soc. 2022, 73, 937–954. [Google Scholar] [CrossRef] [Scilit]
- Ameen, S.; Aslam, M.; Ahmad, I.; Ali, I. Enhancing Supply Chain Resilience in Developing Country SMEs through Machine Learning-Based Demand Forecasting: An Empirical Study. Crit. Rev. Soc. Sci. Stud. 2025, 3, 3050–3088. [Google Scholar] [CrossRef] [Scilit]
| Disclaimer/Publisher’s Note: The statements, opinions and data contained in all publications are solely those of the individual author(s) and contributor(s) and not of MDPI and/or the editor(s). MDPI and/or the editor(s) disclaim responsibility for any injury to people or property resulting from any ideas, methods, instructions or products referred to in the content. |