Proceeding Paper

Infrared-Based Detection of Muscle Contraction for Control Signal Generation †
by
Ana Cristina Feneșan
*,
Alexandru Ianoși-Andreeva-Dimitrova
and
Silviu Dan Mândru
Department of Mechatronics and Machine Dynamics, Technical University of Cluj-Napoca, 400641 Cluj-Napoca, Romania
*
Author to whom correspondence should be addressed.
Presented at the International Conference on Electromagnetic Fields, Signals and BioMedical Engineering (ICEMS-BIOMED), Suceava, Romania, 7–9 May 2026.
Eng. Proc. 2026, 148(1), 11; https://doi.org/10.3390/engproc2026148011

Published: 6 July 2026

Abstract

This study presents the development of a photoplethysmography (PPG)-based system for detecting muscle contractions. Utilizing a non-invasive approach, the system measures blood volume variations in tissues, which correlate with muscle activity. A photodiode connected to a National Instruments data acquisition system captures PPG signals, which are then analyzed using signal processing software. The processed signals generate control commands for a motor integrated into rehabilitation devices. This innovative method facilitates the monitoring and stimulation of muscle activity, enhancing the efficacy of rehabilitation technologies while ensuring a non-invasive experience for patients.

1. Introduction

Photoplethysmography (PPG) is a non-invasive technique used to assess variations in blood volume within tissues, with applications in the medical field, ranging from monitoring vital signs to evaluating patient health. This method relies on the principle of light absorption, in which a sensor emits a light source, typically in the infrared spectrum, which is then reflected by biological tissues and captured by a detector. Differences in light absorption by oxygenated and deoxygenated hemoglobin enable the identification of volumetric fluctuations in blood, essential for determining circulatory activity and muscle health [1,2,3].
The application of photoplethysmography in detecting muscle contractions is based on the fact that, during muscle activity, blood flow to the muscles varies significantly [4]. When a muscle contracts, the demand for oxygen increases, leading to an increase in blood volume in that area, resulting in a variation in the PPG signal. This variation correlates with the characteristics of different forms of hemoglobin, which absorb light in distinct manners. Oxygenated hemoglobin (HbO2) has lower absorption in the infrared spectrum compared to deoxygenated hemoglobin (Hb), and this difference allows for the detection of muscle activity through the analysis of the reflected signal [5,6].
In this study, the objective is to develop a system based on photoplethysmography that detects these variations in PPG signals as indicators of muscle contraction. Through a photodiode connected to a data acquisition system from National Instruments and signal processing software, the obtained signals will be analyzed, and control commands will be generated for a motor that will be subsequently integrated into various rehabilitation engineering devices. This approach allows for the integration of PPG technology into rehabilitation devices, providing a method for monitoring and stimulating muscle activity as well as controlling recovery devices.

2. Materials and Methods

The developed system was designed as a portable device for monitoring muscular hemodynamics through the use of near-infrared light. The configuration includes an emission module and a reception module, both mounted on a Velcro strap that can be attached circumferentially around the arm. This setup allows for easy repositioning of the optodes on the skin surface, thus facilitating measurements at multiple locations of the same muscle without the need to remove the device. Consequently, comparable data series can be collected from different points, enabling spatial analysis of hemodynamic parameters.
The emission module integrates three infrared LEDs, each with a radiant intensity of 21 mW/sr and a peak wavelength of 940 nm. These optical sources provide continuous illumination of the muscle tissue, with light being absorbed differentially based on the local hemodynamic state. Therefore, variations in absorption reflect relative changes in the concentrations of oxygenated and deoxygenated hemoglobin. The reception module employs an LL503 photodetector, sensitive to the same wavelength, which detects changes in the intensity of transmitted or reflected light generated by variations in blood volume and tissue oxygenation.
Utilizing a Velcro fastening system offers several methodological advantages. Firstly, it ensures stable contact between the skin and the optodes, even when they are repositioned. Secondly, the design allows for consistent alignment between the emitter and receiver, reducing measurement errors associated with motion-induced variations. Furthermore, the adjustable circumference of the strap allows the system to be used on subjects with different arm sizes, thus ensuring reproducibility and reliability in the recordings.
Signal acquisition was performed using the NI cDAQ-9172 data acquisition system, equipped with the NI 9219 module for analog-to-digital conversion, at a sampling frequency of 30 Hz and a resolution of 100 nV (National Instruments, Austin, TX, USA). These technical specifications allow for the detection of subtle changes in the signal associated with the hemodynamic dynamics of the muscles.
Data processing was carried out using MATLAB, version R2021b. A custom script was developed to analyze, filter, and visualize the signals collected by the bracelet used for monitoring hemodynamic activity, subsequently saving the processed data in Excel files. The primary goal of the script is to automatically extract relevant information from the measured signals, such as the number of pulses, noise level, rise and fall times, and average amplitude, presenting the results visually and generating summary files for further interpretation.

3. Results

We conducted experiments on a subject who performed various series of muscle contractions, allowing us to evaluate the effectiveness of the developed system. Each testing session was carefully monitored, and the PPG signals were captured using a photodiode connected to the data acquisition system. After recording the signals, we utilized the software developed in MATLAB to analyze the data and generate informative graphs.
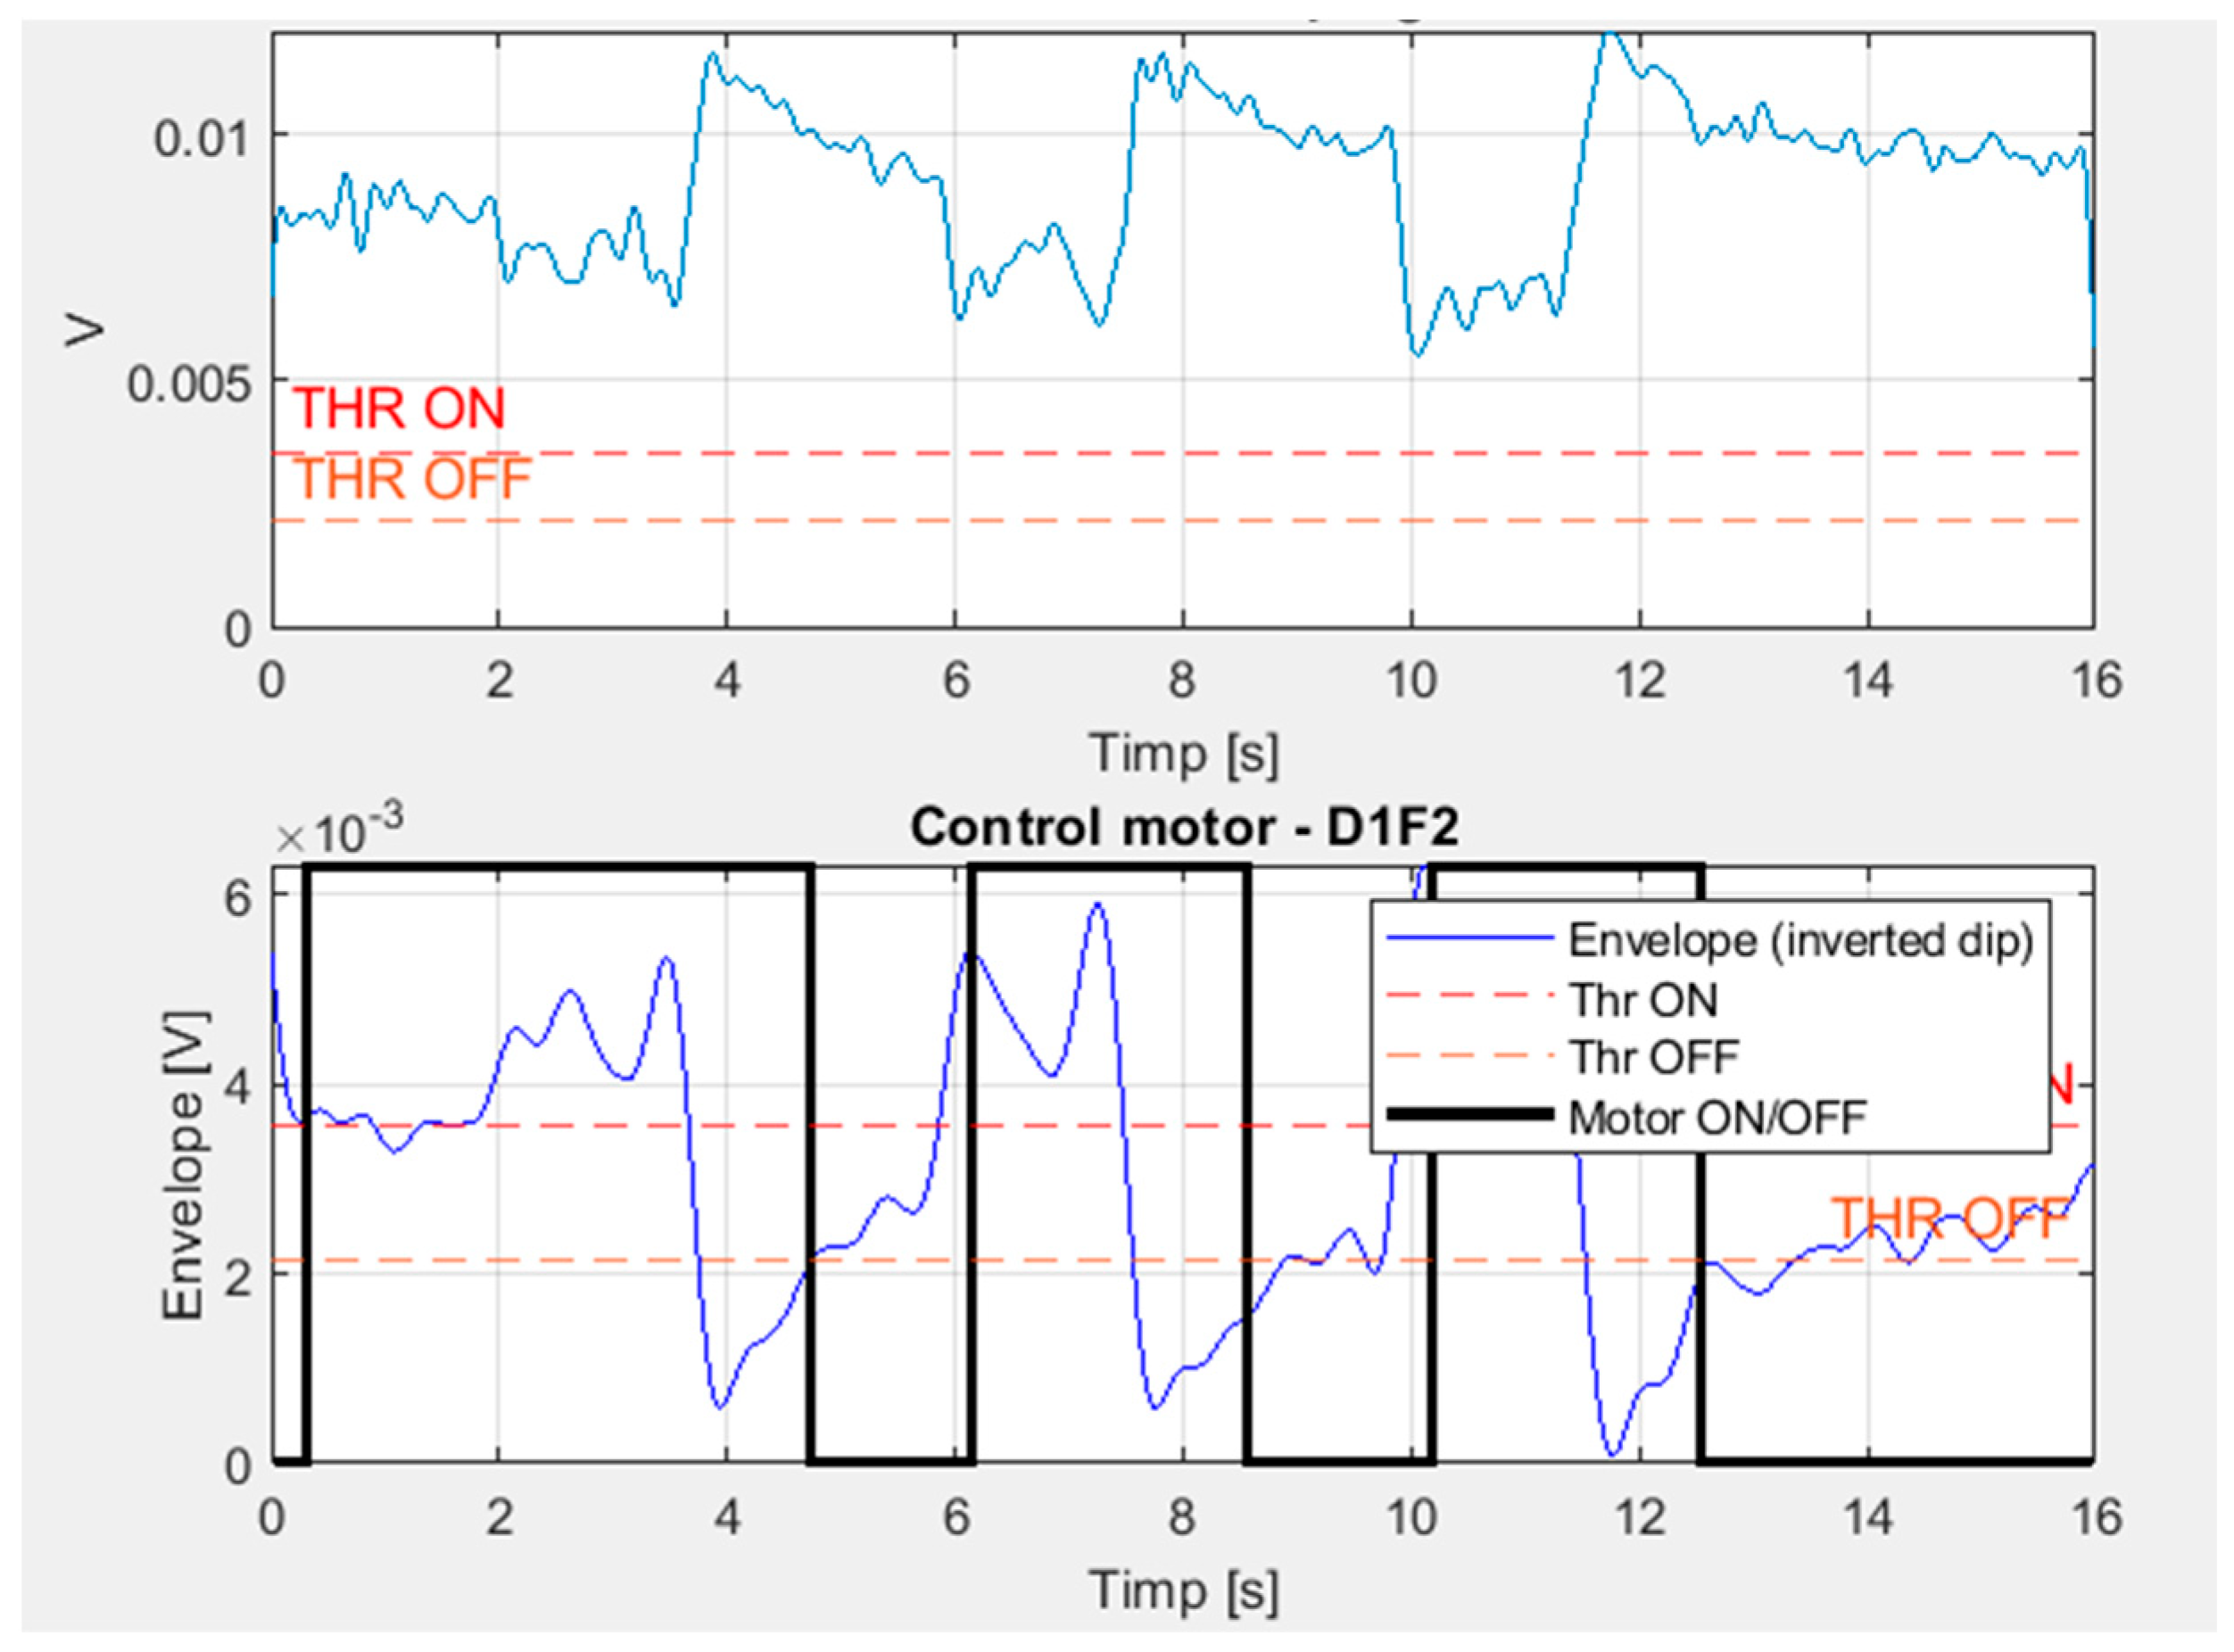
The generated graphs clearly illustrate the variations in the PPG signal during muscle contractions. These variations help us understand the circulatory activity and the muscular state of the subject. Additionally, we included the control signal for the motor in the graphs, represented by a black line. This visual representation allows for a direct observation of the interaction between muscle activity and the response of the control system (Figure 1).
We also established predetermined thresholds for the activation and deactivation of the motor. When the PPG signal exceeds the first threshold, the motor is activated, thereby generating a mechanical response Once the signal returns below the second threshold, the motor is deactivated, thus preventing overexertion and ensuring a controlled and safe reaction.
The analysis of the graphs highlighted not only the system’s efficiency but also the direct correlation between muscle activity and the control signals generated. This visual approach facilitates data interpretation and underscores the practical applicability of PPG technology in the rehabilitation field. The results obtained confirm the potential of this non-invasive method to contribute to the development of effective solutions for monitoring and stimulating muscle activity in recovery therapies.
This should be considered a proof of concept, highlighting the need for further research with a larger and more diverse sample size to validate the findings.

4. Discussion

The processing of PPG signals is an essential step in extracting meaningful information from raw data, considering their noisy nature and inherent physiological variabilities. The techniques employed in PPG signal processing include frequency filtering, time-frequency analysis, and the application of denoising algorithms, which contribute to the enhancement of the signal-to-noise ratio [7]. These methods enable the extraction of signal characteristics, such as amplitude and pulse frequency, which are vital for assessing the hemodynamic state of the patient. By optimizing the processing of PPG signals, the detection of cardiovascular anomalies is also facilitated, significantly impacting the early diagnosis of health conditions [8,9].
Furthermore, the integration of machine learning algorithms and artificial intelligence techniques into PPG signal processing has become increasingly relevant. These advanced approaches enhance the accuracy and efficiency of signal analysis, providing the potential for the development of predictive models capable of anticipating hemodynamic variations in real-time. The implementation of these technologies in wearable health monitoring devices has the potential to transform patient care by delivering real-time data regarding cardiovascular status and enabling rapid interventions in emergency situations. Thus, the processing of PPG signals not only optimizes the use of this biosignal but also considerably expands its applications in the fields of health and rehabilitation [10,11].
Within the MATLAB script, the captured signal is processed to generate a control signal that activates the motor. The transformation of the signal captured by the PPG sensor into a control signal for the motor is a fundamental step in the operation of the developed system. This step involves processing the biological signals obtained to generate precise commands that activate the motor during muscle contractions.
In the first phase, the PPG signal is acquired and subjected to a filtering process. This process serves to eliminate noise and external interferences that may affect the accuracy of the measurements. Biological signals are often influenced by noise sources, including subject movement or ambient variations. The application of signal processing techniques ensures that only relevant variations reflecting changes in blood volume and tissue oxygenation are preserved.
Subsequently, the analysis of the signal is performed to determine the moments when muscle contractions occur. This is accomplished by establishing a specific threshold that serves as a reference for motor activation. The threshold is configured based on the characteristics of the PPG signal and the physiological parameters of the subject, ensuring that the motor is activated only at the appropriate moments of muscle contraction. When the signal exceeds this threshold, an activation command for the motor is generated.
The MATLAB script includes a section dedicated to generating the control signal for the motor based on the detection of muscle activation. This is a step within the rehabilitation system that monitors and responds to muscular activity, playing a role in transforming the information obtained from the PPG signals into commands for the motor. Calibration may be required to optimize the performance of the system for individual users, ensuring that the thresholds are appropriately set for varying muscle activation patterns.
The process begins with the detect_muscle_activation function, which analyzes the filtered signal to identify muscle contractions. The signal is transformed through inversion and rectification, so that “dips” become positive peaks. This process allows for the application of filtering techniques that generate a smooth envelope of the signal, essential for precise activation detection.
A fundamental aspect of generating the control signal is the auto-calibration of the activation (thr_on) and deactivation (thr_off) thresholds. The activation threshold is determined by searching for a level that generates exactly three muscle activations, a pre-established criterion for system efficiency. The deactivation threshold is set by a hysteresis ratio, ensuring that thr_off is always lower than thr_on. This approach prevents false activations, ensuring a stable reaction from the system.
Once the thresholds are established, the control signal is constructed through a state machine in the build_motor_cmd function. This state machine continuously analyzes the activity signal (the inverted envelope) and determines when the motor should be activated or deactivated. It operates based on a timing system that imposes minimum time conditions for activation (min_on_time) and deactivation (min_off_time). These timing constraints help prevent rapid fluctuations of the control signal, which could lead to uncontrolled motor behavior.
The generated control signal is a binary vector, where 1 indicates that the motor should be activated, and 0 indicates that it should be turned off. This signal is produced through continuous evaluation of the activity signal and the application of the activation and deactivation thresholds. If the activity signal exceeds thr_on for a duration longer than min_on_time, the motor is activated. Similarly, if the signal drops below thr_off for a duration longer than min_off_time, the motor is deactivated.
During the control signal generation process, the script monitors and calculates various performance metrics, such as jitter and rise and fall times of the pulses. These data are essential for evaluating how effectively the system responds to muscular activity. For example, jitter is an indicator of the variation in activation intervals, providing insights into the stability of the control signal.
The script also includes the generation of graphs that illustrate the control signal, along with the activation and deactivation thresholds. These visualizations are vital for understanding how muscular activity signals translate into commands for the motor. The graphs clearly show when the motor is activated and deactivated, highlighting the efficiency of the control system.

5. Conclusions

The purpose of this work was to create software in MATLAB capable of generating a control signal for rehabilitation devices by utilizing PPG to capture a biosignal from the muscular level. The implementation of this system not only facilitates analysis of muscular state but also allows for the generation of precise control signals, essential for the effective operation of rehabilitation devices. Thus, we contribute to the development of non-invasive solutions that can significantly improve the recovery process for patients, adapting to their individual needs.
The results obtained demonstrate the potential of this technology to transform traditional approaches in rehabilitation, providing an effective means of integrating biosignals into therapeutic processes. This research opens new perspectives for the development of advanced tools in the fields of biomechanics and biomedical engineering, aimed at enhancing patients’ quality of life following personalized therapeutic interventions. The results of this study demonstrate the feasibility of using the proposed method for muscle activation detection. These findings serve as preliminary evidence rather than validated performance across various subjects or conditions.
Furthermore, the next step in our project is to enable the generation of the control signal in real-time, which will further enhance the responsiveness and effectiveness of the rehabilitation devices we are developing.

Author Contributions

Conceptualization, A.C.F., A.I.-A.-D. and S.D.M.; methodology, A.C.F., A.I.-A.-D. and S.D.M.; software, A.C.F., A.I.-A.-D. and S.D.M.; validation, A.C.F., A.I.-A.-D. and S.D.M.; formal analysis, A.C.F., A.I.-A.-D. and S.D.M.; investigation, A.C.F., A.I.-A.-D. and S.D.M.; resources, A.C.F., A.I.-A.-D. and S.D.M.; data curation, A.C.F., A.I.-A.-D. and S.D.M.; writing—original draft preparation, A.C.F., A.I.-A.-D. and S.D.M.; writing—review and editing, A.C.F., A.I.-A.-D. and S.D.M.; visualization, A.C.F., A.I.-A.-D. and S.D.M.; supervision, A.C.F., A.I.-A.-D. and S.D.M.; project administration, A.C.F., A.I.-A.-D. and S.D.M.; funding acquisition, A.C.F., A.I.-A.-D. and S.D.M. All authors have read and agreed to the published version of the manuscript.

Funding

This research received no external funding.

Institutional Review Board Statement

Not applicable.

Informed Consent Statement

Not applicable.

Data Availability Statement

The raw data supporting the conclusions of this article will be made available by the authors on request.

Conflicts of Interest

The authors declare no conflicts of interest.

Abbreviations

The following abbreviations are used in this manuscript:
PPGPhotoplethysmography
HbO2Oxygenated hemoglobin
Hbdeoxygenated hemoglobin

References

  1. Taha, Z.; Shirley, L.; Razman, M.A.M. A review on non-invasive hypertension monitoring system by using photoplethysmography method. Malays. J. Mov. Health Exerc. 2017, 6, 47–57. [Google Scholar] [CrossRef]
  2. Alian, A.A.; Shelley, K.H. Photoplethysmography. Best Pract. Res. Clin. Anaesthesiol. 2014, 28, 395–406. [Google Scholar] [CrossRef]
  3. Mejia-Mejia, E.; Allen, J.; Budidha, K.; El-Hajj, C.; Kyriacou, P.A.; Charlton, P.H. Photoplethysmography signal processing and synthesis. In Photoplethysmography; Academic Press: London, UK, 2022; pp. 69–146. [Google Scholar]
  4. Kyriacou, P.A.; Allen, J. (Eds.) Photoplethysmography: Technology, Signal Analysis and Applications; Academic Press: London, UK, 2021. [Google Scholar]
  5. Moraes, J.L.; Rocha, M.X.; Vasconcelos, G.G.; Vasconcelos Filho, J.E.; De Albuquerque, V.H.C.; Alexandria, A.R. Advances in photopletysmography signal analysis for biomedical applications. Sensors 2018, 18, 1894. [Google Scholar] [CrossRef] [PubMed]
  6. Feneșan, A.C.; Ianoși-Andreeva-Dimitrova, A.; Mandru, S.D. A Photoplethysmography—Based Affordable Demonstrator for Monitoring Muscle Oxygenation Using Infrared Light. In International Conference on Advancements of Medicine and Health Care through Technology; Springer Nature: Cham, Switzerland, 2024; pp. 84–89. [Google Scholar]
  7. Joseph, G.; Joseph, A.; Titus, G.; Thomas, R.M.; Jose, D. Photoplethysmogram (PPG) signal analysis and wavelet de-noising. In 2014 Annual International Conference on Emerging Research Areas: Magnetics, Machines and Drives (AICERA/iCMMD); IEEE: New York, NY, USA, 2014; pp. 1–5. [Google Scholar]
  8. Addison, P.S. A review of signal processing used in the implementation of the pulse oximetry photoplethysmographic fluid responsiveness parameter. Anesth. Analg. 2014, 119, 1293–1306. [Google Scholar] [CrossRef] [PubMed]
  9. Kim, K.B.; Baek, H.J. Photoplethysmography in wearable devices: A comprehensive review of technological advances, current challenges, and future directions. Electronics 2023, 12, 2923. [Google Scholar] [CrossRef]
  10. Nardelli, M.; Bailón, R. Advances in wearable photoplethysmography applications in health monitoring. Sensors 2023, 23, 7064. [Google Scholar] [CrossRef] [PubMed]
  11. Charlton, P.H.; Kyriacou, P.A.; Mant, J.; Marozas, V.; Chowienczyk, P.; Alastruey, J. Wearable photoplethysmography for cardiovascular monitoring. Proc. IEEE 2022, 110, 355–381. [Google Scholar] [CrossRef]
Figure 1. The graph generated by the MATLAB software based on three muscle contractions.
Engproc 148 00011 g001
Disclaimer/Publisher’s Note: The statements, opinions and data contained in all publications are solely those of the individual author(s) and contributor(s) and not of MDPI and/or the editor(s). MDPI and/or the editor(s) disclaim responsibility for any injury to people or property resulting from any ideas, methods, instructions or products referred to in the content.