1. Introduction
E-commerce webpages serve as the primary medium for user interaction with online platforms, and the visual design of recommender systems directly influences users’ attention allocation and decision-making behavior. On such platforms, category-based recommendation sections are commonly found on homepages or thematic subpages. These sections typically present multiple product lists organized by categories, supporting exploratory browsing when users do not have a specific search goal in mind [
1].
However, most category-based recommender interfaces still adopt conventional product list formats, lacking visual design elements that guide user attention or enhance exploratory motivation. Search-based interfaces rely on textual input and goal-oriented interaction. By contrast, category-based recommendation sections depend more heavily on visual layout and content grouping to attract attention and stimulate exploration. When displayed items and target products belong to the same category, their perceived attractiveness and recommendation effectiveness can be significantly enhanced [
2]. Strategic use of visual modules—such as category-consistent image groups, prominent headlines, and visual segmentation—can further enhance users’ exploratory motivation and perceived value. These characteristics also make category-based recommendation sections a suitable setting for evaluating the impact of visual design.
Using the category-based recommendation sections on Amazon as a design reference, we constructed an experimental interface with added interaction modules, including a category-themed image and a semantic slogan. We compared an A/B test with a baseline product list-only interface. Eye-tracking was used to capture users’ visual behavior (e.g., first fixation, dwell time) and assess how different module designs affect attention distribution. We assessed the visual guidance mechanism of modules in recommender interfaces for future interface optimization. Specifically, we evaluated how adding interaction modules to a category-based recommendation interface effectively directs users’ visual attention and helps exploratory browsing.
2. Background Knowledge
2.1. Visual Appeal in e-Commerce User Interface
Visual elements—such as product images and persuasive slogans—significantly influence user engagement and purchase decisions in e-commerce contexts [
3,
4]. However, most studies focus on the persuasive effects of isolated elements. Little is known about how such visual components collectively influence visual attention within curated recommender interfaces. While recent studies have incorporated eye-tracking in recommender systems to better understand user attention [
5,
6], few have examined how visual components in curated interfaces collectively guide exploratory behavior.
2.2. Amazon’s Category-Based Recommendation Sections and User Behavior
Category-based recommendation sections on platforms like Amazon group products by themes (e.g., Home Decor, Gift Ideas) to support exploratory browsing for users without specific purchase goals. These sections rely on visual design than search-driven interfaces to attract attention and convey value. In this study, we treated them as representative environments for exploratory browsing. Although they are common, few studies have examined how visual layout in these sections shapes attention and interaction. Amazon serves as the design reference here due to its representative patterns and its alignment with prior research distinguishing exploratory from goal-directed shopping behaviors [
7].
2.3. Eye-Tracking in Interface Evaluation
Eye-tracking has been widely used in human–computer interface studies to evaluate visual attention and interaction strategies, providing objective metrics such as fixation duration, gaze path, and time to first view for analyzing how users process visual layouts [
8,
9].
3. Method
Experiment
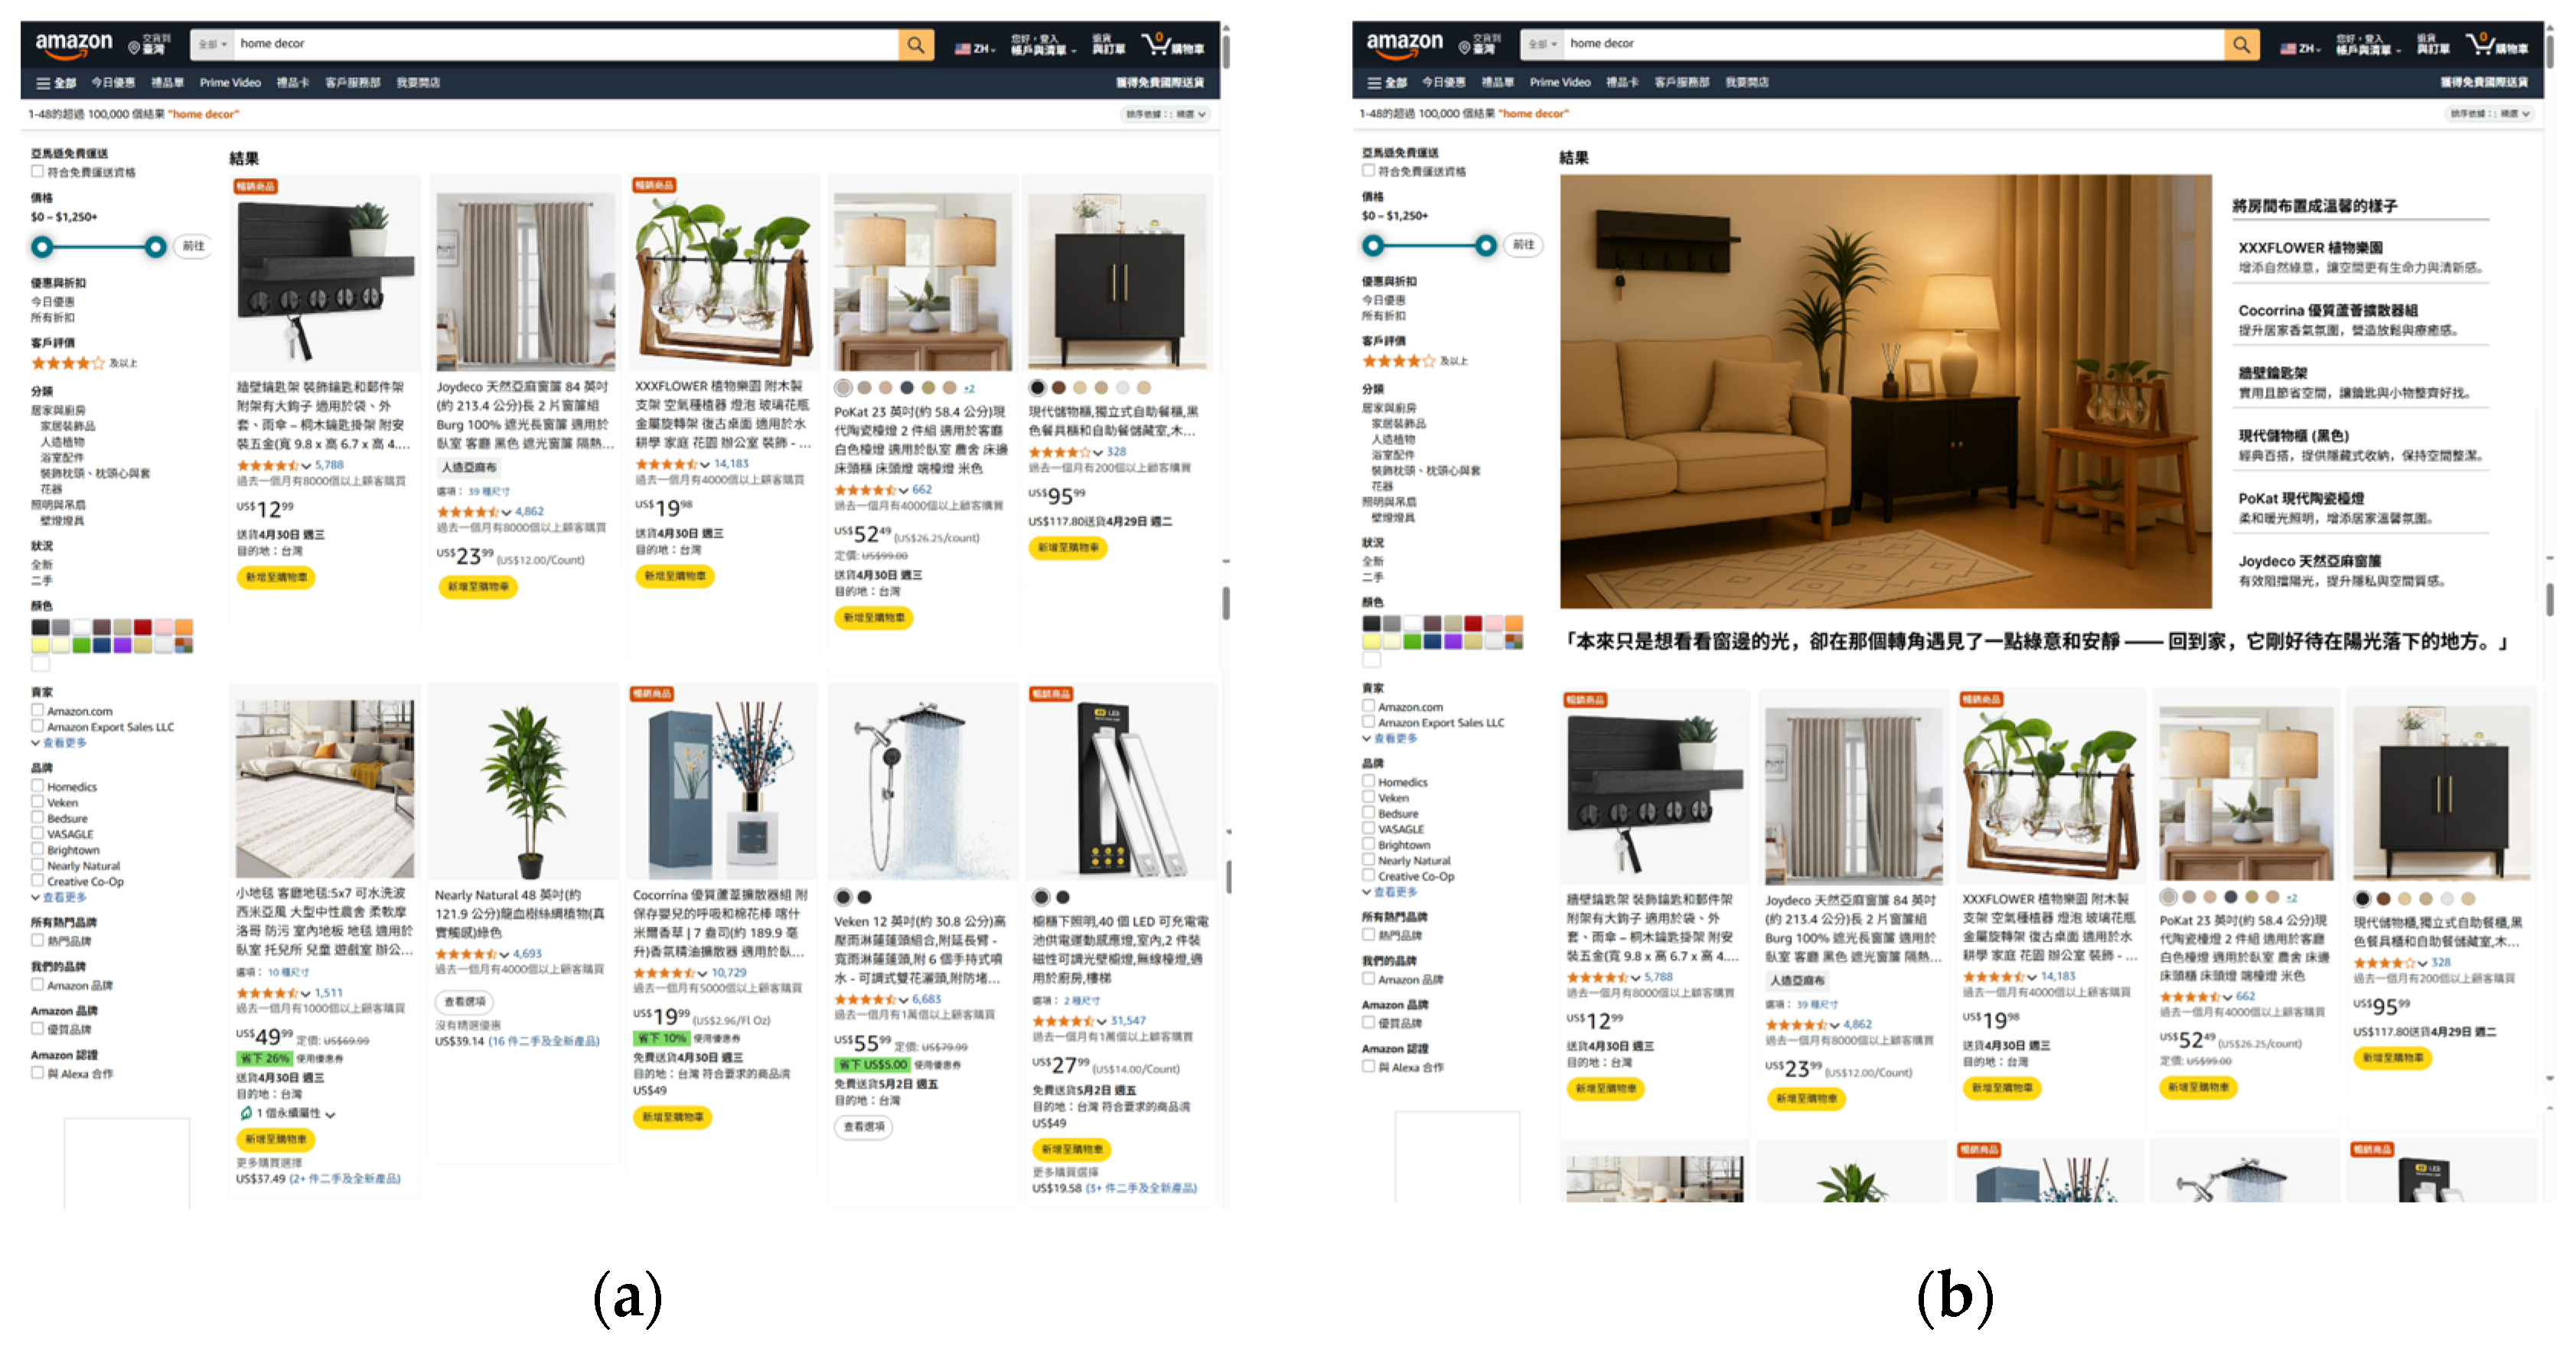
We adopted an A/B testing design (
Figure 1) to examine how interaction modules influence users’ attention distribution within e-commerce recommender interfaces. Based on the layout patterns commonly found in Amazon’s category-based recommendation sections, the experiment simulated a representative exploratory shopping scenario. Two static user interface prototypes were created: a baseline version (A) and a module-enhanced version (B). As shown in
Figure 1b, Version B included a category-themed image, slogan, and narrative text. Each participant viewed both versions in a randomized order for 50 s per screen.
Both interfaces simulated the Home Decor category section on Amazon. The recommended products consisted of visually coherent room decor items selected manually by the researchers. The interaction modules in Version B were generated using ChatGPT-4o, guided by actual product images in the list. Specifically, the category-themed image was generated to visually represent the grouped items; the slogan was designed to deliver a persuasive marketing message; and the narrative text provided a brief contextual rationale for the recommendation.
Eight participants aged between 20 and 30 were recruited in this study. All participants had prior experience with online shopping and must have made at least one online purchase within the past two months. The experiment was conducted individually. Each participant viewed both versions of the interface (Version A: List Only; Version B: List + Modules), which were displayed in sequence on a 24-inch monitor. Each interface was shown for a fixed duration of 50 seconds to ensure comparability across conditions. Participants were instructed to browse the interfaces naturally, simulating an exploratory browsing scenario in the Home Decor category section of Amazon.
During the experiment, eye movements were recorded using the Gazepoint GP3 eye tracker (Vancouver, BC, Canada), which automatically captured visual metrics including first fixation, dwell time, and gaze paths. These data served as the basis for subsequent area of interest (AOI) analysis. Additionally, brief post-experiment interviews were conducted with selected participants to collect subjective feedback regarding the module design and browsing behavior. Representative quotes are included in the Discussion section to support the interpretation of eye-tracking results.
We used AOI summary data exported from the eye-tracking software as the basis for analysis.
Table 1 summarizes the metrics obtained from the AOI analysis used in this study.
Four AOIs were defined in this study: (1) category-themed image, (2) slogan, (3) narrative text, and (4) product list. Only Version B contained modules corresponding to AOIs 1–3, while Version A presented only AOI 0 (the product list). The AOI 0 in both versions represented the same product layout and order. Therefore, we determined differences in gaze behavior on AOI 0 (product list) between Version A and Version B, to examine whether the presence of modules influenced attention allocation to the product list and Gaze distribution across AOIs 1–3 in Version B, and their comparison with AOI 0, to assess the relative visual appeal and engagement of different module elements. The eye-tracking data were analyzed using both descriptive statistics and inferential tests. To compare attention across AOIs in Version B, the Friedman test was applied due to the small sample size and the repeated-measures design.
4. Results
4.1. Comparison of AOI 0 Between Version A and B
To investigate whether the interaction modules affected users’ attention to the product list (AOI 0), we compared eye-tracking metrics for AOI 0 between Version A (List Only) and Version B (List + Modules). Descriptive results are presented in
Table 2. In Version A, participants fixed on AOI 0 significantly earlier (first fixation: mean score (M) = 0.082 s), and both the dwell time (M = 29.24 s) and fixation count (M = 88.25) were notably higher than in Version B (6.29 s and 45.75, respectively). Although the number of viewers and revisit frequency were comparable across versions, users in Version B exhibited a marked decrease in overall attention to the product list.
Given the small sample size (N = 8), the statistical power was limited, and no inferential tests were conducted. However, the large differences observed in dwell time and fixation count suggest that the presence of additional modules may have influenced users’ attention distribution and gaze transitions. These results are consistent with previous findings that introducing new visual elements into an interface can reallocate users’ attentional resources, potentially reducing concentrated focus on the product list.
4.2. Visual Attention Among AOIs in Version B
To assess the visual salience of different module elements in Version B, we compared users’ gaze behavior across AOI 0 (Product List), AOI 1 (Category-themed image), AOI 2 (Slogan), and AOI 3 (Narrative Text). Among various gaze metrics, dwell time served as the primary basis for analysis.
Table 3 presents the descriptive results.
A Friedman test results revealed a statistically significant difference in dwell time across the four AOIs, χ2(3) = 14.70, p = 0.002, indicating that users’ attention was not evenly distributed among the interface regions. Overall, AOI 0 (Product List) received the longest average dwell time (M = 14.68 s), suggesting that users ultimately concentrated on evaluating specific items. However, AOI 1 (Category-themed image) was the most prominent among the modules. It achieved the second-highest dwell time (M = 11.00 s) and the earliest first fixation (M = 0.20 s), demonstrating its strong visual guiding effect. AOI 3 (Narrative Text) received a moderate level of attention (M = 7.87 s), while AOI 2 (Slogan) showed the shortest dwell time (M = 2.75 s).
Despite its low dwell time, AOI 2 had a relatively high revisit count. Interview data suggest that users found the slogan memorable even without prolonged viewing: You only need to read it once to get the idea. This implies that the slogan relies more on quick semantic recognition than sustained visual engagement. Its high revisit frequency may be due to its spatial placement—positioned between the image and the product list—making it a frequent transitional point during users’ visual pairing behavior. This finding suggests that the spatial positioning of modules may influence gaze patterns, and revisit frequency may not necessarily indicate deliberate reading behavior.
The inclusion of interaction modules redistributed users’ visual attention across interface regions. The category-themed image module effectively captured early attention, while the product list continued to serve as the central focus for decision-making. Although the slogan and narrative text received less attention overall, they may still play a supportive role in guiding the visual flow and contributing to cognitive recall.
4.3. Gaze Plots and Heatmaps
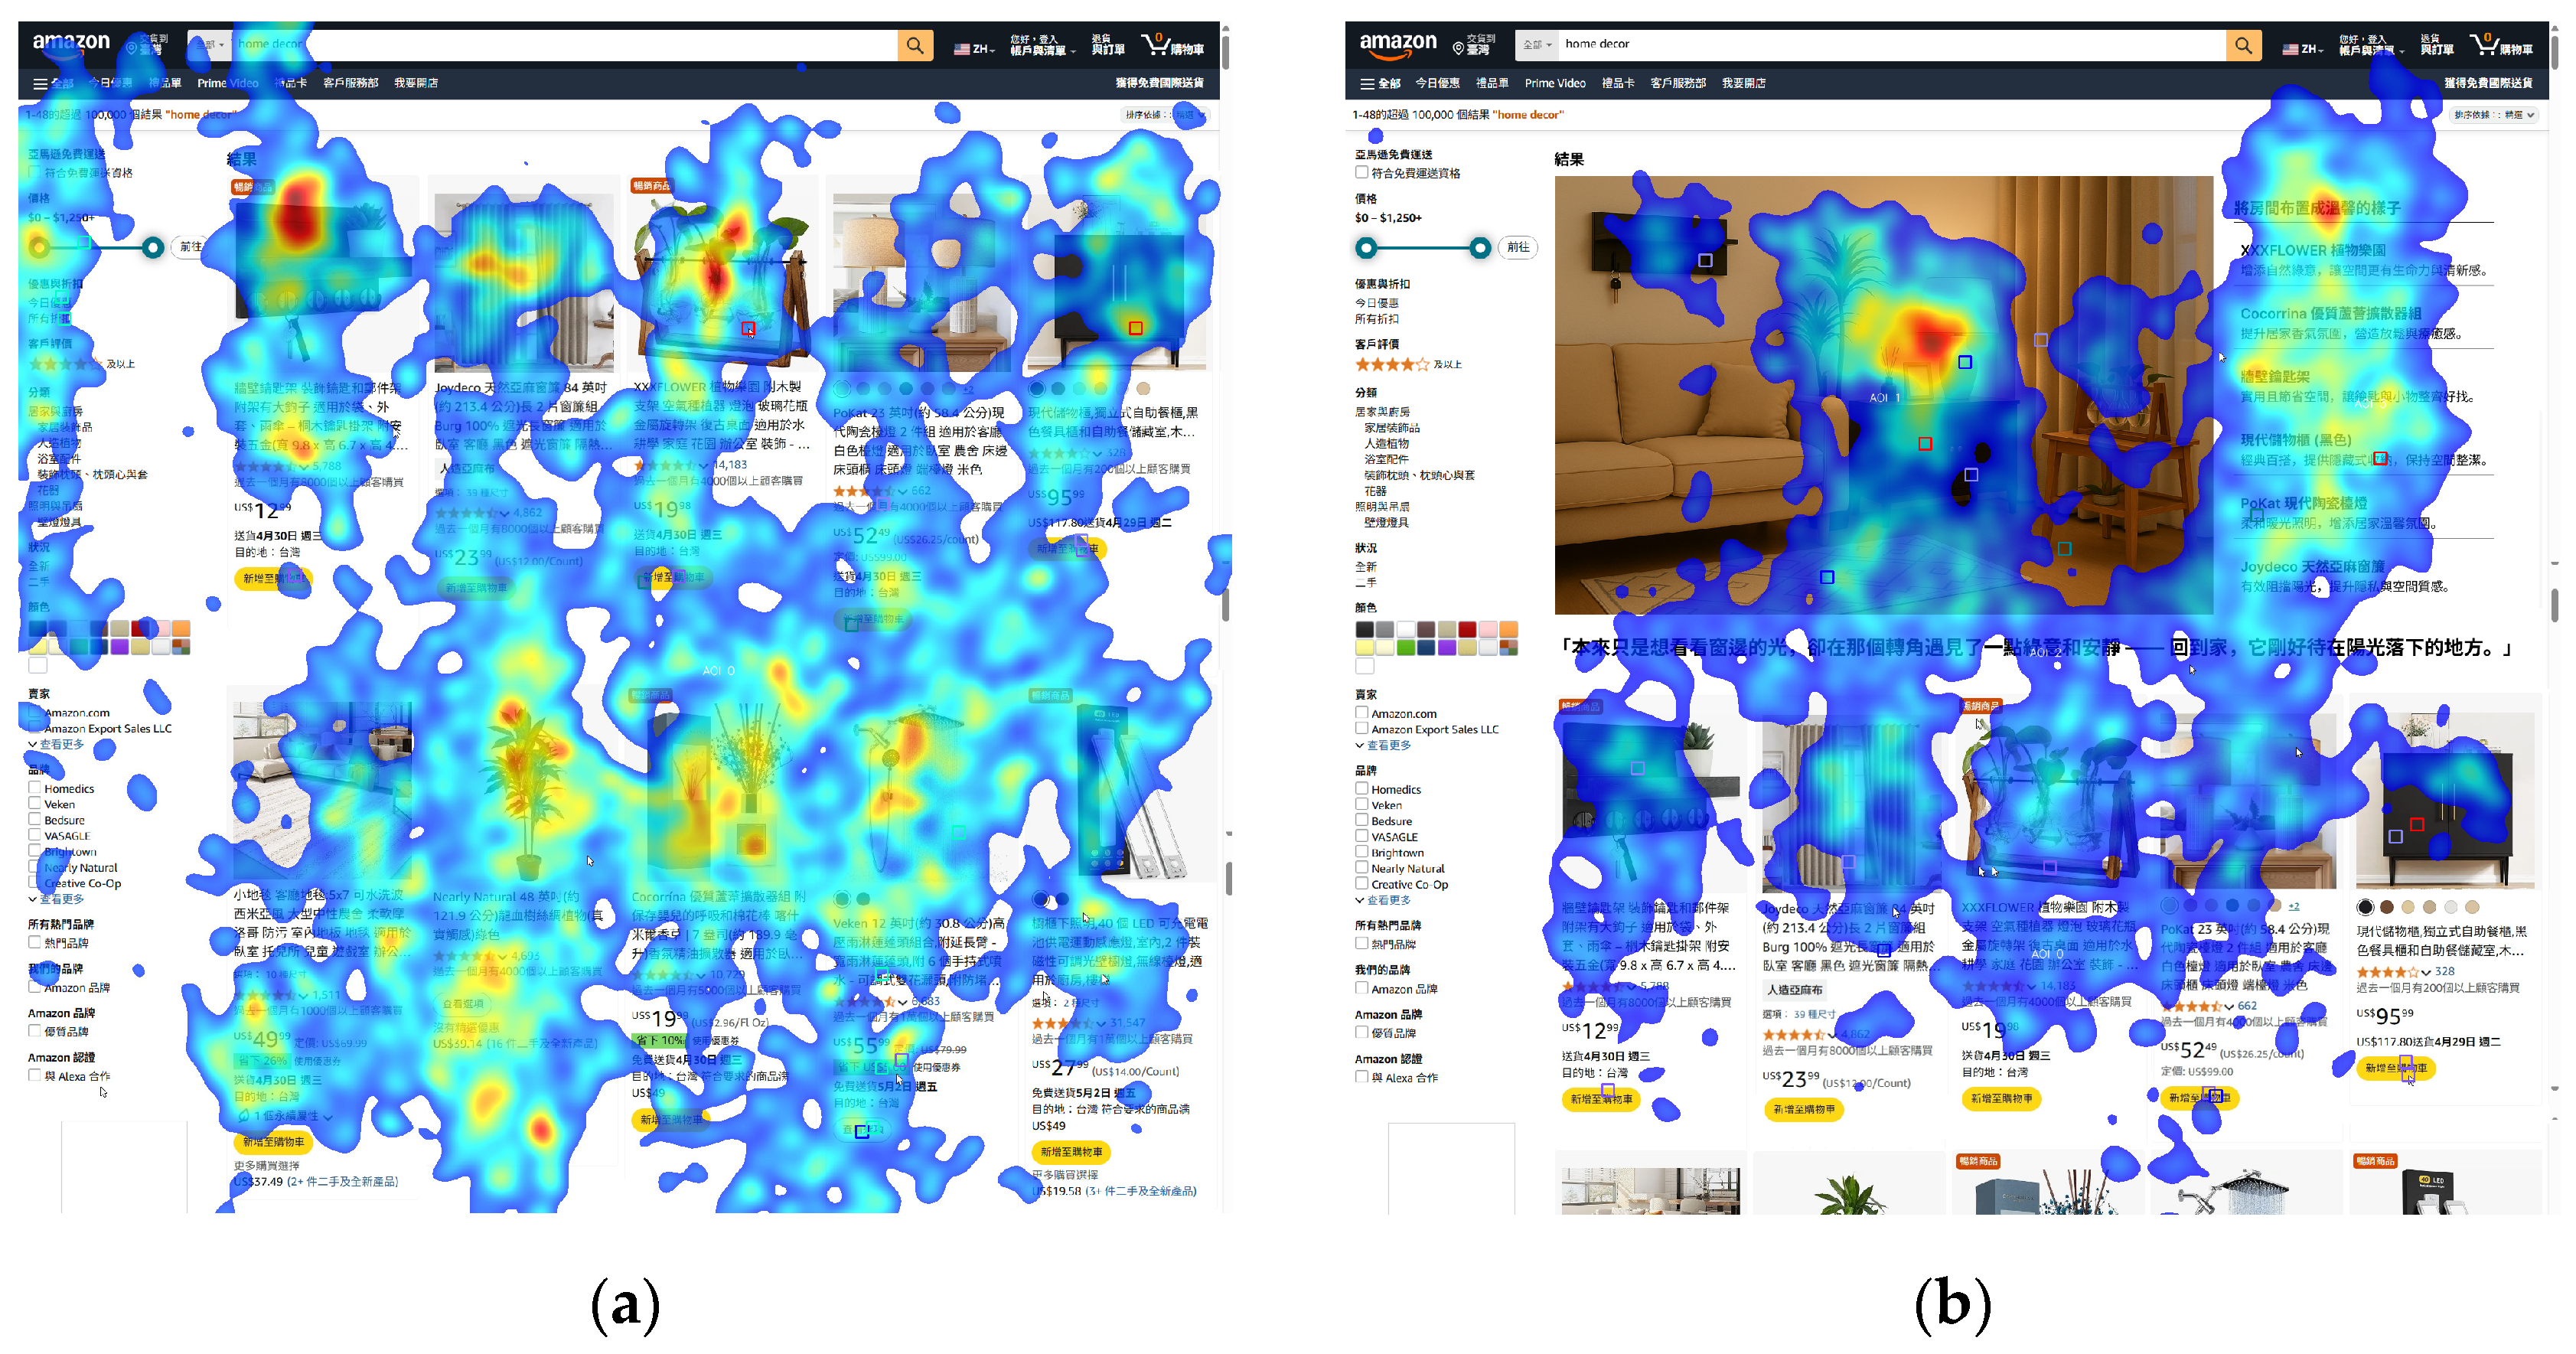
To complement the statistical metrics with visual scanpath dynamics, we analyzed aggregated heatmaps and individual gaze paths for both Version A and Version B. As shown in
Figure 2, users’ gaze in Version A was relatively evenly distributed across the listed products. In contrast, the heatmap for Version B revealed more concentrated areas of visual focus. While the product list still received substantial attention, the image module (AOI 1) emerged as the most prominent hotspot. Notably, gaze concentration was primarily directed toward products in the image that also appeared in the actual product list, indicating its high visual salience within the overall layout. The narrative text module (AOI 3) also attracted attention as a secondary hotspot. A few participants mentioned in interviews that they had higher expectations for functional content in that area.
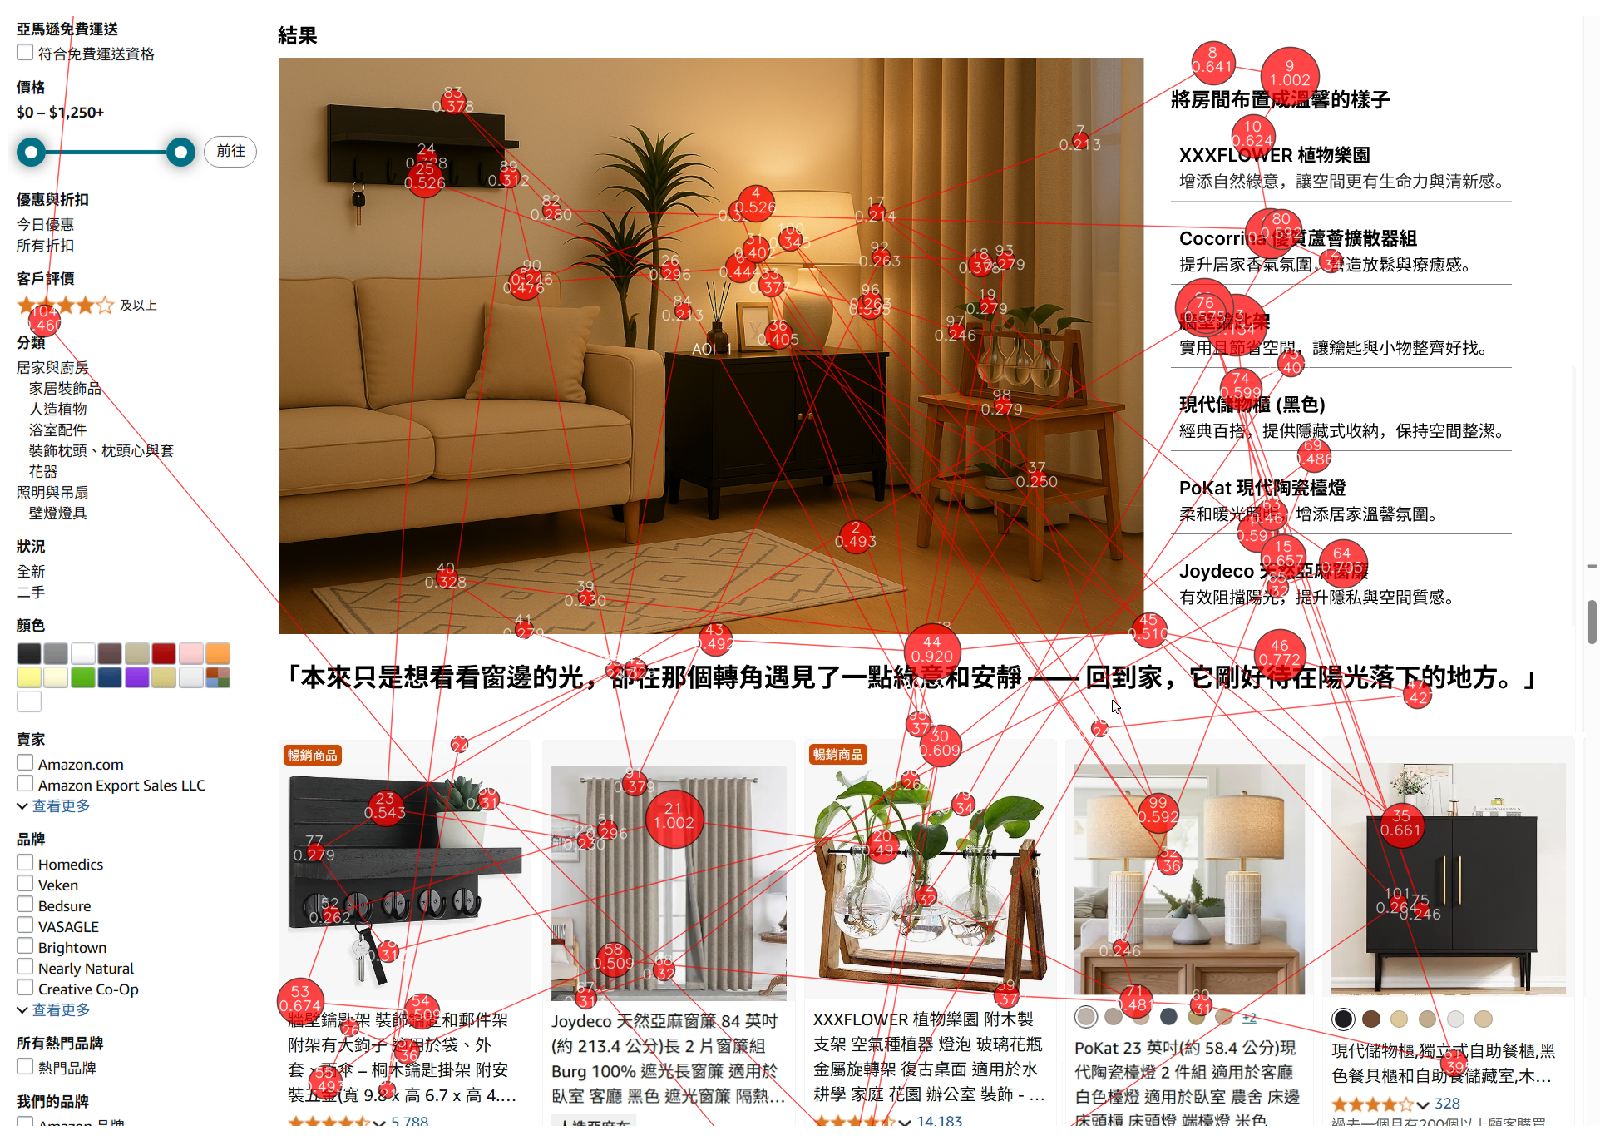
In addition, observations of individual gaze paths revealed that some participants demonstrated a clear back-and-forth gaze pattern between the image module and the product list (
Figure 3), often revisiting the same items repeatedly. This visual pairing behavior suggests that users, after recognizing certain items in the image module, actively returned to the product list to locate the corresponding items. This phenomenon is discussed in greater detail in the following section.
5. Discussion
We identified visual pairing behavior, in which users, as shown in
Figure 3, recognized specific products in the category-themed image module (AOI 1) and subsequently matched them to the corresponding items in the product list (AOI 0). This behavior can be further explained through the concept of information scent in the Information Foraging Theory proposed by Pirolli and Card [
10]. Information scent refers to users’ perceived utility of a particular interface cue—such as an image, title, or label—that suggests potentially valuable content. The stronger the scent, the more likely users are to focus their attention and initiate goal-directed search strategies. In this study, the category-themed image module served as a high-scent visual cue: after identifying familiar items in the image (AOI 1), participants actively searched for corresponding items in the product list (AOI 0), forming a dynamic back-and-forth gaze pattern. This visual pairing behavior illustrates a semantic search process triggered by perceived relevance, demonstrating how information scent operates in exploratory browsing interfaces. This aligns with recent findings that eye-tracking data can inform recommender interface design. Al-Omair emphasizes that gaze-informed modules enhance exploratory engagement [
5], while RecGaze data demonstrate that visual anchor placement strongly influences scanpath transitions, supporting our interpretation of the visual pairing behavior [
6].
To address the limitations of the small sample size, we conducted a preliminary semantic analysis of participants’ interview responses. Thematic analysis revealed that most users showed strong interest in the category-themed image module (AOI 1), viewing it as a key contextual cue for understanding the recommendation theme. One participant noted, “The large image is more attractive to me because it creates a nicer atmosphere. I tend to look at it several times and then try to find which item it corresponds to in the list below—where it is placed.” Another participant shared. “I usually look at what’s shown in the image first, then go through the list to see if I can find the same item and compare.” These statements are consistent with the scanpath data, suggesting that the image module not only captured attention but also prompted users to establish visual and semantic associations between the module and the product list.
Building on both gaze data and interview responses, the proposed concept of visual pairing behavior is not merely a spatial shift in attention. Instead, it reveals an active cognitive process of inference and semantic matching based on interface cues. Traditional recommender interfaces typically rely on passive exposure to suggested content. In contrast, this behavior demonstrates that even in non-task-oriented contexts, users actively engage in a cognitive chain of exploration, recognition, and confirmation. From the user experience perspective, the category-themed image module serves not only as a visual attention anchor but also as a trigger that initiates product exploration and shapes user motivation. This finding enables the interpretation of interaction in recommender interface design: by strategically arranging visual cues with semantic meaning, designers can facilitate deeper user engagement and understanding of the recommended content, ultimately enhancing the quality of decision-making in exploratory browsing scenarios. One participant commented, “Because the image shows how the products are arranged, I feel like I can simply follow the picture and recreate it at home.” Another added, “My room already has a similar style, and I own most of the items shown—but it made me want to add that little plant from the image.”
This study was conducted with a limited sample size (N = 8) and employed static interface screenshots, thereby excluding interactive behaviors such as clicking. Although the data revealed discernible trends, the findings should be interpreted with caution due to limited generalizability. Furthermore, the close spatial proximity between the image module and the product list may have contributed to visual misattributions, potentially amplifying the observed visual pairing behaviors. To address these limitations, future research should consider employing a larger and more diverse sample, integrating real-time interactive interfaces, and incorporating measures of semantic comprehension and decision-making. Such enhancements would enable a more comprehensive evaluation of how module configuration influences user strategies and the overall effectiveness of recommender system interfaces.
6. Conclusions
We investigated how the addition of interaction modules—namely images, slogans, and narrative texts—affects users’ visual behavior within category-based recommender interfaces on e-commerce platforms. Through an eye-tracking experiment and post-task interviews, it was found that the modular interface effectively attracted initial attention, with the category-themed image, which demonstrated strong visual guidance. Although the product list remained the most frequently viewed area, its overall dwell time significantly decreased when modules were present, indicating a redistribution of users’ attention. Moreover, the participants exhibited visual pairing behavior between the image module and the product list, reflecting an active exploratory process based on semantic cues. These findings not only validate the visual guiding role of interaction modules but also suggest their potential to foster exploratory browsing behaviors. The study provides empirical support for visual design strategies in recommender interfaces and recommends that designers consider incorporating semantically coherent visual modules to enhance interface interactivity. It is required to expand the sample size and incorporate interactive behavioral data, such as clicks and purchase actions, to gain a deeper understanding of the relationship between module design and user behavior.
Author Contributions
Conceptualization, Q.-Y.L.; methodology, Q.-Y.L.; software, Q.-Y.L.; validation, Q.-Y.L. and H.-H.W.; formal analysis, Q.-Y.L.; resources, H.-H.W.; writing—original draft preparation, Q.-Y.L.; writing—review and editing, H.-H.W.; visualization, Q.-Y.L.; supervision, H.-H.W.; project administration, H.-H.W.; funding acquisition, H.-H.W. All authors have read and agreed to the published version of the manuscript.
Funding
This research was funded by the National Science and Technology Council (NSTC), Taiwan, R.O.C., grant number NSTC 113-2410-H-027-007-MY2.
Institutional Review Board Statement
Not applicable.
Informed Consent Statement
Not applicable.
Data Availability Statement
Data are contained within the article.
Conflicts of Interest
The authors declare no conflict of interest.
References
- Chen, L.; Pu, P. Eye-Tracking Study of User Behavior in Recommender Interfaces. In Lecture Notes in Computer Science; Springer: Berlin/Heidelberg, Germany, 2010; pp. 375–380. ISBN 978-3-642-13469-2. [Google Scholar]
- Karmarkar, U.R.; Carroll, A.L.; Burke, M.; Hijikata, S. Category Congruence of Display-Only Products Influences Attention and Purchase Decisions. Front. Neurosci. 2021, 15, 610060. [Google Scholar] [CrossRef] [PubMed]
- Di, W.; Sundaresan, N.; Piramuthu, R.; Bhardwaj, A. Is a Picture Really Worth a Thousand Words?:-On the Role of Images in e-Commerce. In Proceedings of the 7th ACM International Conference on Web Search and Data Mining, New York, NY, USA, 24–28 February 2014; ACM: New York, NY, USA, 2014. [Google Scholar]
- Schoenmakers, G.-J.; Hachimi, J.; De Hoop, H. Can You Make a Difference? The Use of (In)Formal Address Pronouns in Advertisement Slogans. J. Int. Consum. Mark. 2024, 36, 2215472. [Google Scholar] [CrossRef]
- Al-Omair, O.M. A Comparative Study on the Integration of Eye-Tracking in Recommender Systems. Sensors 2025, 25, 2692. [Google Scholar] [CrossRef] [PubMed]
- De Leon-Martinez, S.; Kang, J.; Moro, R.; De Rijke, M.; Kveton, B.; Oosterhuis, H.; Bielikova, M. RecGaze: The First Eye Tracking and User Interaction Dataset for Carousel Interfaces. In Proceedings of the 48th International ACM SIGIR Conference on Research and Development in Information Retrieval, Padua, Italy, 13–17 July 2025; ACM: Padua, Italy, 2025; pp. 3702–3711. [Google Scholar]
- Ma, L.; Sinha, N.; Cho, J.H.D.; Kumar, S.; Achan, K. Personalized Diversification of Complementary Recommendations with User Preference in Online Grocery. Front. Big Data 2023, 6, 974072. [Google Scholar] [CrossRef] [PubMed]
- Pengnate, S.; Sarathy, R. An Experimental Investigation of the Influence of Website Emotional Design Features on Trust in Unfamiliar Online Vendors. Comput. Hum. Behav. 2017, 67, 49–60. [Google Scholar] [CrossRef]
- Boardman, R.; McCormick, H.; Henninger, C.E. Exploring Attention on a Retailer’s Homepage: An Eye-Tracking & Qualitative Research Study. Behav. Inf. Technol. 2023, 42, 2059396. [Google Scholar] [CrossRef]
- Pirolli, P.; Card, S.K.; Van Der Wege, M.M. Visual Information Foraging in a Focus + Context Visualization. In Proceedings of the SIGCHI Conference on Human Factors in Computing Systems, Seattle, WA, USA, 31 March–5 April 2001; ACM: Seattle, WA, USA, 2001; pp. 506–513. [Google Scholar]
| Disclaimer/Publisher’s Note: The statements, opinions and data contained in all publications are solely those of the individual author(s) and contributor(s) and not of MDPI and/or the editor(s). MDPI and/or the editor(s) disclaim responsibility for any injury to people or property resulting from any ideas, methods, instructions or products referred to in the content. |
© 2026 by the authors. Licensee MDPI, Basel, Switzerland. This article is an open access article distributed under the terms and conditions of the Creative Commons Attribution (CC BY) license (https://creativecommons.org/licenses/by/4.0/).