Article

The Effect of Somatostatin on Mediators of Liver Inflammation and Fibrosis in Viral Cirrhosis

by
Angeliki Tsakou
1,2,
George Notas
3,
Constantinos Xidakis
2,
Ioannis Tsomidis
2,
Argyro Voumvouraki
1 and
Elias Kouroumalis
2,4,*
1
1st Department of Internal Medicine, AHEPA University Hospital, 54621 Thessaloniki, Macedonia, Greece
2
Laboratory of Gastroenterology and Hepatology, School of Medicine, University of Crete, Voutes Campus, 70013 Heraklion, Crete, Greece
3
Laboratory of Experimental Endocrinology, School of Medicine, University of Crete, Voutes Campus, 70013 Heraklion, Crete, Greece
4
Department of Gastroenterology, PAGNI University Hospital, University of Crete School of Medicine, 71500 Heraklion, Crete, Greece
*
Author to whom correspondence should be addressed.
Livers 2026, 6(2), 16; https://doi.org/10.3390/livers6020016
Submission received: 21 December 2025 / Revised: 9 February 2026 / Accepted: 26 February 2026 / Published: 3 March 2026
(This article belongs to the Special Issue Epidemiology of Chronic Liver Disease and Cirrhosis)

Abstract

Background. Somatostatin and its synthetic analog octreotide are suppressive hormones that have been used in the treatment of variceal bleeding or bleeding from portal hypertensive gastropathy. They are also used in the treatment of some cancers, including hepatocellular carcinoma (HCC). Experimental evidence reported that they have potentially useful effects on liver inflammation and fibrosis, acting on Kupffer cells (KCs) and hepatic stellate cells (HSCs). However, clinical data is missing. Therefore, the effect of somatostatin and octreotide was studied on several fibrosis mediators in patients with compensated cirrhosis. Patients and Methods. Fifty-eight patients with HCV-related compensated cirrhosis treated with either somatostatin or octreotide for bleeding from portal gastropathy were compared with twenty-nine healthy controls matched for age and sex. Serum levels of three metalloproteases (MMP1, MMP2 and MMP9) and their inhibitors, TIMP1 and TIMP2, were measured. Additional fibrosis and inflammation mediators—such as nitric oxide (NO), TNFα, soluble ICAM-1, and the CC chemokines RANTES (CCL5) and MIP1a (CCL3)—were also measured. Results. Serum levels of MMP1, MMP2, MMP9 and TIMP1 were significantly decreased in cirrhosis (p < 0.01). TIMP2 levels were increased (p < 0.01). RANTES levels were also significantly decreased (p < 0.01), but NO, TNFα, MIP1a and sICAM-1 were significantly increased (p < 0.01). Administration of somatostatin had no effect on MMP2 or MMP9 but significantly decreased all other mediators. Octreotide had similar but milder effects, but it had no effects on MIP1a and sICAM-1 were demonstrated. Conclusions. Somatostatin and octreotide modulate factors implicated in the progression of fibrosis in the short term. Whether they could be used in the long term as treatment for liver diseases with progressive fibrosis or in cases with intense inflammatory reactions, such as alcoholic hepatitis, requires further investigation.

1. Introduction

Fibrosis and cirrhosis are common results of chronic liver diseases, irrespective of etiology [1]. The critical initiating event of fibrosis is injury to hepatocytes, leading to sterile inflammation and the activation of inflammasomes caused by damage-associated molecular patterns (DAMPs) [2]. The progression of fibrosis is regulated by several exogenous and endogenous factors [3], such as serum exosomes, which may either favor the activation of HSCs through miR-574-5p [4] or ameliorate fibrosis through the release of anti-apoptotic factors caused by natural killer cells [5]. Whatever the mechanisms might be, liver fibrosis is the result of the accumulation of extracellular matrix (ECM) due to an imbalance between increased synthesis and decreased degradation of ECM, which is regulated by matrix metalloproteinases (MMPs) and their natural tissue inhibitors (TIMPs) [6,7].
MMPs are a group of zinc-dependent peptidases that degrade ECM and basement membrane collagen [8]. MMPs are highly regulated either at the level of gene expression or by the conversion of latent pro-MMPs into active enzymes in the extracellular environment. MMP activity is regulated by TIMPs, which form conglomerates with active MMPs [9]. Twenty-four MMPs have been described in humans so far. They are classified into six classes. The first two classes, namely collagenases and gelatinases, have been extensively studied in association with fibrosis [10]. MMP-1 (EC 3.4.24.7) degrades native collagen. The initial degradation of fibrillar collagens caused by MMP-1 allows for further degradation into smaller fragments caused by gelatinases [11,12]. MMP-2 (gelatinase A; EC 3.4.24.24, 72-kDa) and MMP-9 (gelatinase B; EC 3.4.24.35, 92-kDa) are involved in the degradation of collagen IV in the basement membranes and, therefore, are involved in the early steps of fibrosis development in chronic liver disease [10,13]. Dysregulated MMPs are implicated in cirrhosis irrespective of etiology [12,14,15]. A detailed review of the functions of MMPs in liver disease has recently been published [16].
Four physiological inhibitors (TIMPs 1–4) regulate the proteolytic activities of MMPs and participate in ECM accumulation [8]. TIMP-1 binds to the active form of MMP-9 in a 1:1 ratio [17]. Moreover, a second pro-fibrotic mechanism has been attributed to TIMP-1. It was shown that TIMP-1 inhibits the apoptosis of activated HSCs, thus favoring the continuation of fibrosis [18].
Nitric oxide (NO) is a molecule that regulates the sinusoidal tone caused by the nitric oxide–cyclic guanosine monophosphate (NO-cGMP) system. Liver NO is produced by sinusoidal endothelial cells (LSECs) through the action of the enzyme endothelial NO synthase (eNOS) and in KCs by inducible NO synthase (iNOS). NO is transported to HCSs where it activates soluble guanylate cyclase (sGC), leading to the formation of cGMP. In cirrhosis, NO formation is compromised, which results in sinusoidal constriction and increased intrahepatic flow resistance [19,20], but in cirrhosis, the so-called NO paradox exists, referring to decreased hepatic NO, leading to the constriction of the sinusoids and increased NO in the peripheral circulation [21,22]. At the same time, NO is involved in liver fibrosis through an interplay with TNF-a. TNF-a may either induce NO or be induced by NO. In a murine study, iNOS-derived NO caused upregulation of pro-inflammatory genes, leading to liver inflammation by stimulating TNF-a production [23]. The balance between NO and reactive oxygen species (ROS) under physiological circumstances maintains homeostasis in LSECs. ROS can suppress NO, limiting NO bioavailability, which favors liver fibrosis. After liver damage, a switch from a pro-regenerative phenotype to a pro-fibrotic phenotype in LSECs is observed, increasing liver fibrosis through the ERK1/2-AKT axis. ERK1/2 switches the balance between NO and ROS toward NO-favoring regeneration. AKT switches the balance toward ROS, leading to fibrosis [24].
Increased expression of adhesion molecules at the surface of liver sinusoidal endothelial cells (LSECs), such as ICAM-1 and VCAM-1, indicates dysfunctional LSECs [25,26,27]. ICAM-1 and VCAM-1 on KCs are involved in direct KC-LSEC adhesion by binding to integrins [28]. Abnormal activation of LSECs interrupts their interplay with HSCs and KCs and promotes liver fibrosis [29].
An additional regulator of liver fibrosis is the secretion of several chemokines. CC chemokines, such as macrophage inflammatory protein MIP-1a (CCL3) and the regulated on activation normal T expressed and secreted chemokine (RANTES, CCL5), recruit immune cells into the liver [30]. Hepatic fat accumulation induces the production of CCL5 synthesis [31]. CCL5 is the ligand for both CCR1 on liver macrophages and CCR5 on HSCs, leading to increased fibrosis [32,33].
Somatostatin (SST) is a hormone with various mostly suppressive effects in several parts of the body. SST circulates in two active forms: a 14-amino-acid molecule (somatostatin-14) and a 28-amino-acid molecule (somatostatin-28). They are high-affinity ligands for the five receptor subtypes identified so far [34]. The synthetic SST analog octreotide only binds to SST receptor subtypes 2 and 5, with reduced affinity to sstr3. Somatostatin and octreotide may affect inflammation and fibrosis [35]. Octreotide was recently shown to attenuate liver fibrosis in a rat fibrosis model [36]. Earlier in vitro studies demonstrated that octreotide significantly reduced the secretion of pro-inflammatory cytokines and pro-fibrotic mediators by rat KCs [37,38], similarly to natural SST [39,40]. However, data from clinical studies are missing, particularly from advanced fibrosis and cirrhosis, where somatostatin or octreotide are frequently used as a treatment of variceal bleeding and bleeding from hypertensive portal gastropathy [41], or in trials of hepatocellular carcinoma (HCC) [35]. Therefore, we studied three important metalloproteases and their inhibitors in association with certain inflammatory mediators, such as ICAM-1, nitric oxide, TNFα, and the CC chemokines RANTES and MIP-1a, to examine the basic levels of these factors in a selected group of compensated cirrhosis and to see if somatostatin and its analog octreotide have similar effects on these patients after their administration.

2. Materials and Methods

2.1. Patients

This was a retrospective clinical–laboratory cohort analysis.
Inclusion criteria: Age range, 18–70 years, HCV RNA positivity. Abstinence from or use of alcohol less than 10 g per day for women and 20 g per day for men. Compensated cirrhosis.
Exclusion criteria: Presence of autoantibodies related to liver diseases. Presence of viral liver disease other than HCV. Any indication of portal vein thrombosis. Presence of decompensated cirrhosis. Patients under 18 years old. Active infections, autoimmune conditions, or other comorbidities known to interfere with fibrosis. Absence of metabolic syndrome. Absence of prior informed consent for participation.
Fifty-eight patients with HCV-related compensated cirrhosis (age, 38–67 years; males, 38) received either somatostatin or octreotide for portal hypertensive gastropathy bleeding (an intravenous bolus of 250 μg SST was followed by a continuous infusion of 250 μg/h for 4 days) [41] or a 250 μg bolus of octreotide followed by a continuous infusion of 125 μg/h for 4 days). All patients responded to treatment, and no other supportive treatment, including blood transfusions, was used. They were compared to 29 healthy controls matched for age and sex, selected from the hospital staff. Demographics of patients are presented in Table 1.
Decompensated cirrhosis was excluded on the basis of the presence or history of one or more of the following: ascites, variceal bleeding, hepatic encephalopathy, or jaundice due to disease progression [42]. Bleeding from portal gastropathy alone was not considered decompensation. Blood samples were collected on day 5 after drug initiation. Samples were centrifuged at 1100 g for 10 min, and sera were stored at −80 °C until measured. The research protocol was approved by the Ethics Committee of the University Hospital (23753/2025 and 836/2025), and the study was performed in accordance with the principles of the Declaration of Helsinki.

2.2. Materials

All chemicals were purchased from Sigma-Aldrich (Munchen, Germany). Only HEPES was purchased from MERCK (Darmstadt, Germany).

2.3. Methods

NO serum levels were measured by the determination of their metabolite nitrite (NO2) plus nitrate (NO3), as the parent compound is very short-lived with a half-life of 2–3 s. A slightly modified Griess reaction was used. In total, 100 μL of serum was incubated for 30 min at 37 °C in an incubation mixture containing 0.2 U/mL Aspergillus nitrate reductase, 5 μM FAD, and 0.1 mM NADPH in 50 mM HEPES buffer (total volume 500 μL) for the conversion of nitrate into nitrite. After incubation, 5 μL of lactate dehydrogenase (1500 U/mL) and 50 μL of 100 mM pyruvic acid were added to each tube to oxidize any unreacted NADPH (reduced pyridine nucleotides strongly inhibit the Griess reaction). Samples were then incubated for an additional 10 min at 37 °C. Finally, 1 mL of pre-mixed Griess reagent was added to each tube. After a 10 min incubation at room temperature, samples were measured at 543 nm with a Hitachi U-2000 Spectrophotometer (Hitachi High-Technologies Corporation, Tokyo, Japan) [43].
Serum levels of MMP-1, MMP-2, MMP-9, TIMP-1, TIMP-2, ICAM-1, RANTES, MIP1a and TNFα were measured using Human Quantikine ELISA kits according to the manufacturer’s instructions (all from R&D Systems, Minneapolis, MN, USA). MMP2 ELISA recognizes human active, pro-, and TIMP-complexed MMP-2. MMP9 ELISA measures natural 92 kDa, Pro-MMP-9 and the 82 kDa active MMP-9 but not the 65 kDa form. Data were read in a Biotek ELx800 microplate reader (Winooski, VT, USA).
MMP-2 and -9 were also measured by zymography, which recognizes both active enzyme and pro-enzyme forms, either free or attached to TIMPs. The assay was performed in 10% sodium dodecyl sulfate (SDS)–polyacrylamide gels containing 0.1% gelatin (Zymogram ready gels, Bio-Rad Laboratories, Hercules, CA, USA). After electrophoresis, gels were washed with 1.5% Triton X-100 for 60 min to remove SDS. After an overnight incubation in a mixture containing 50 mM Tris/HCl, pH 8.0, 200 mM NaCl, 5 mM CaCl2, 0.2% Brij 35 at 37 °C, gels were stained with Coomasie brilliant blue R-250 and extensively destained with 10% acetic acid/20% methanol in water. Clear bands of gelatin proteolysis against a blue background were quantified using densitometry connected to a gel documentation (Gel-doc 2000) and analysis system (QuantiscanTM, Biosoft, Cambridge, UK). Recombinant activated MMP-2 and MMP-9 (Oncogene Research Products, San Diego, CA, USA) were incorporated into every gel, and only the free active forms were calculated from standard curves [44].

2.4. Statistical Analysis

Results are presented as means ± SD. Results before treatment are presented as bar plots. Absolute biomarker levels are shown as mean ± SD, while treatment-related changes are illustrated using group-level percent change (Δ%).

2.4.1. Comparison Analysis (Baseline Group Comparisons, Before Treatment Administration)

Data distribution was assessed using the Shapiro–Wilk test, and all biomarkers were found to follow a normal distribution.
Baseline differences between healthy controls and patients with cirrhosis were assessed using independent samples t-tests. Effect sizes were calculated using Cohen’s d to quantify the magnitude of between-group differences. A p-value < 0.05 was considered statistically significant.

2.4.2. Paired Analysis

Data distribution was assessed using the Shapiro–Wilk test, and all biomarkers were found to follow a normal distribution.
Within-group treatment effects were assessed by comparing pre- and post-treatment biomarker levels separately in the somatostatin and octreotide groups using a paired Student’s t-test.

2.4.3. Between-Treatment Comparison

Differences in treatment response between somatostatin and octreotide were evaluated using independent samples t-tests based on pre-to-post-treatment changes. Effect sizes were reported as Cohen’s d.
All statistical tests were two-sided, and a p-value < 0.05 was considered statistically significant. Exact p-values are reported. All statistical analyses were predefined and performed on a per-biomarker basis using targeted pairwise (1-vs.-1) comparisons, using independent or paired Student’s t-tests, following confirmation of normal data distribution by the Shapiro–Wilk test. No omnibus testing or post hoc multiple comparisons were conducted, and each biomarker represented an independent, hypothesis-driven endpoint. Therefore, a formal correction for multiple testing was not applied.
Given the retrospective design of the study and the limited sample size in certain subgroups, no a priori power calculation was performed. The potential risk of type II error, particularly in non-significant comparisons, is acknowledged and considered in the interpretation of the results.

3. Results

3.1. MMP2 Zymography

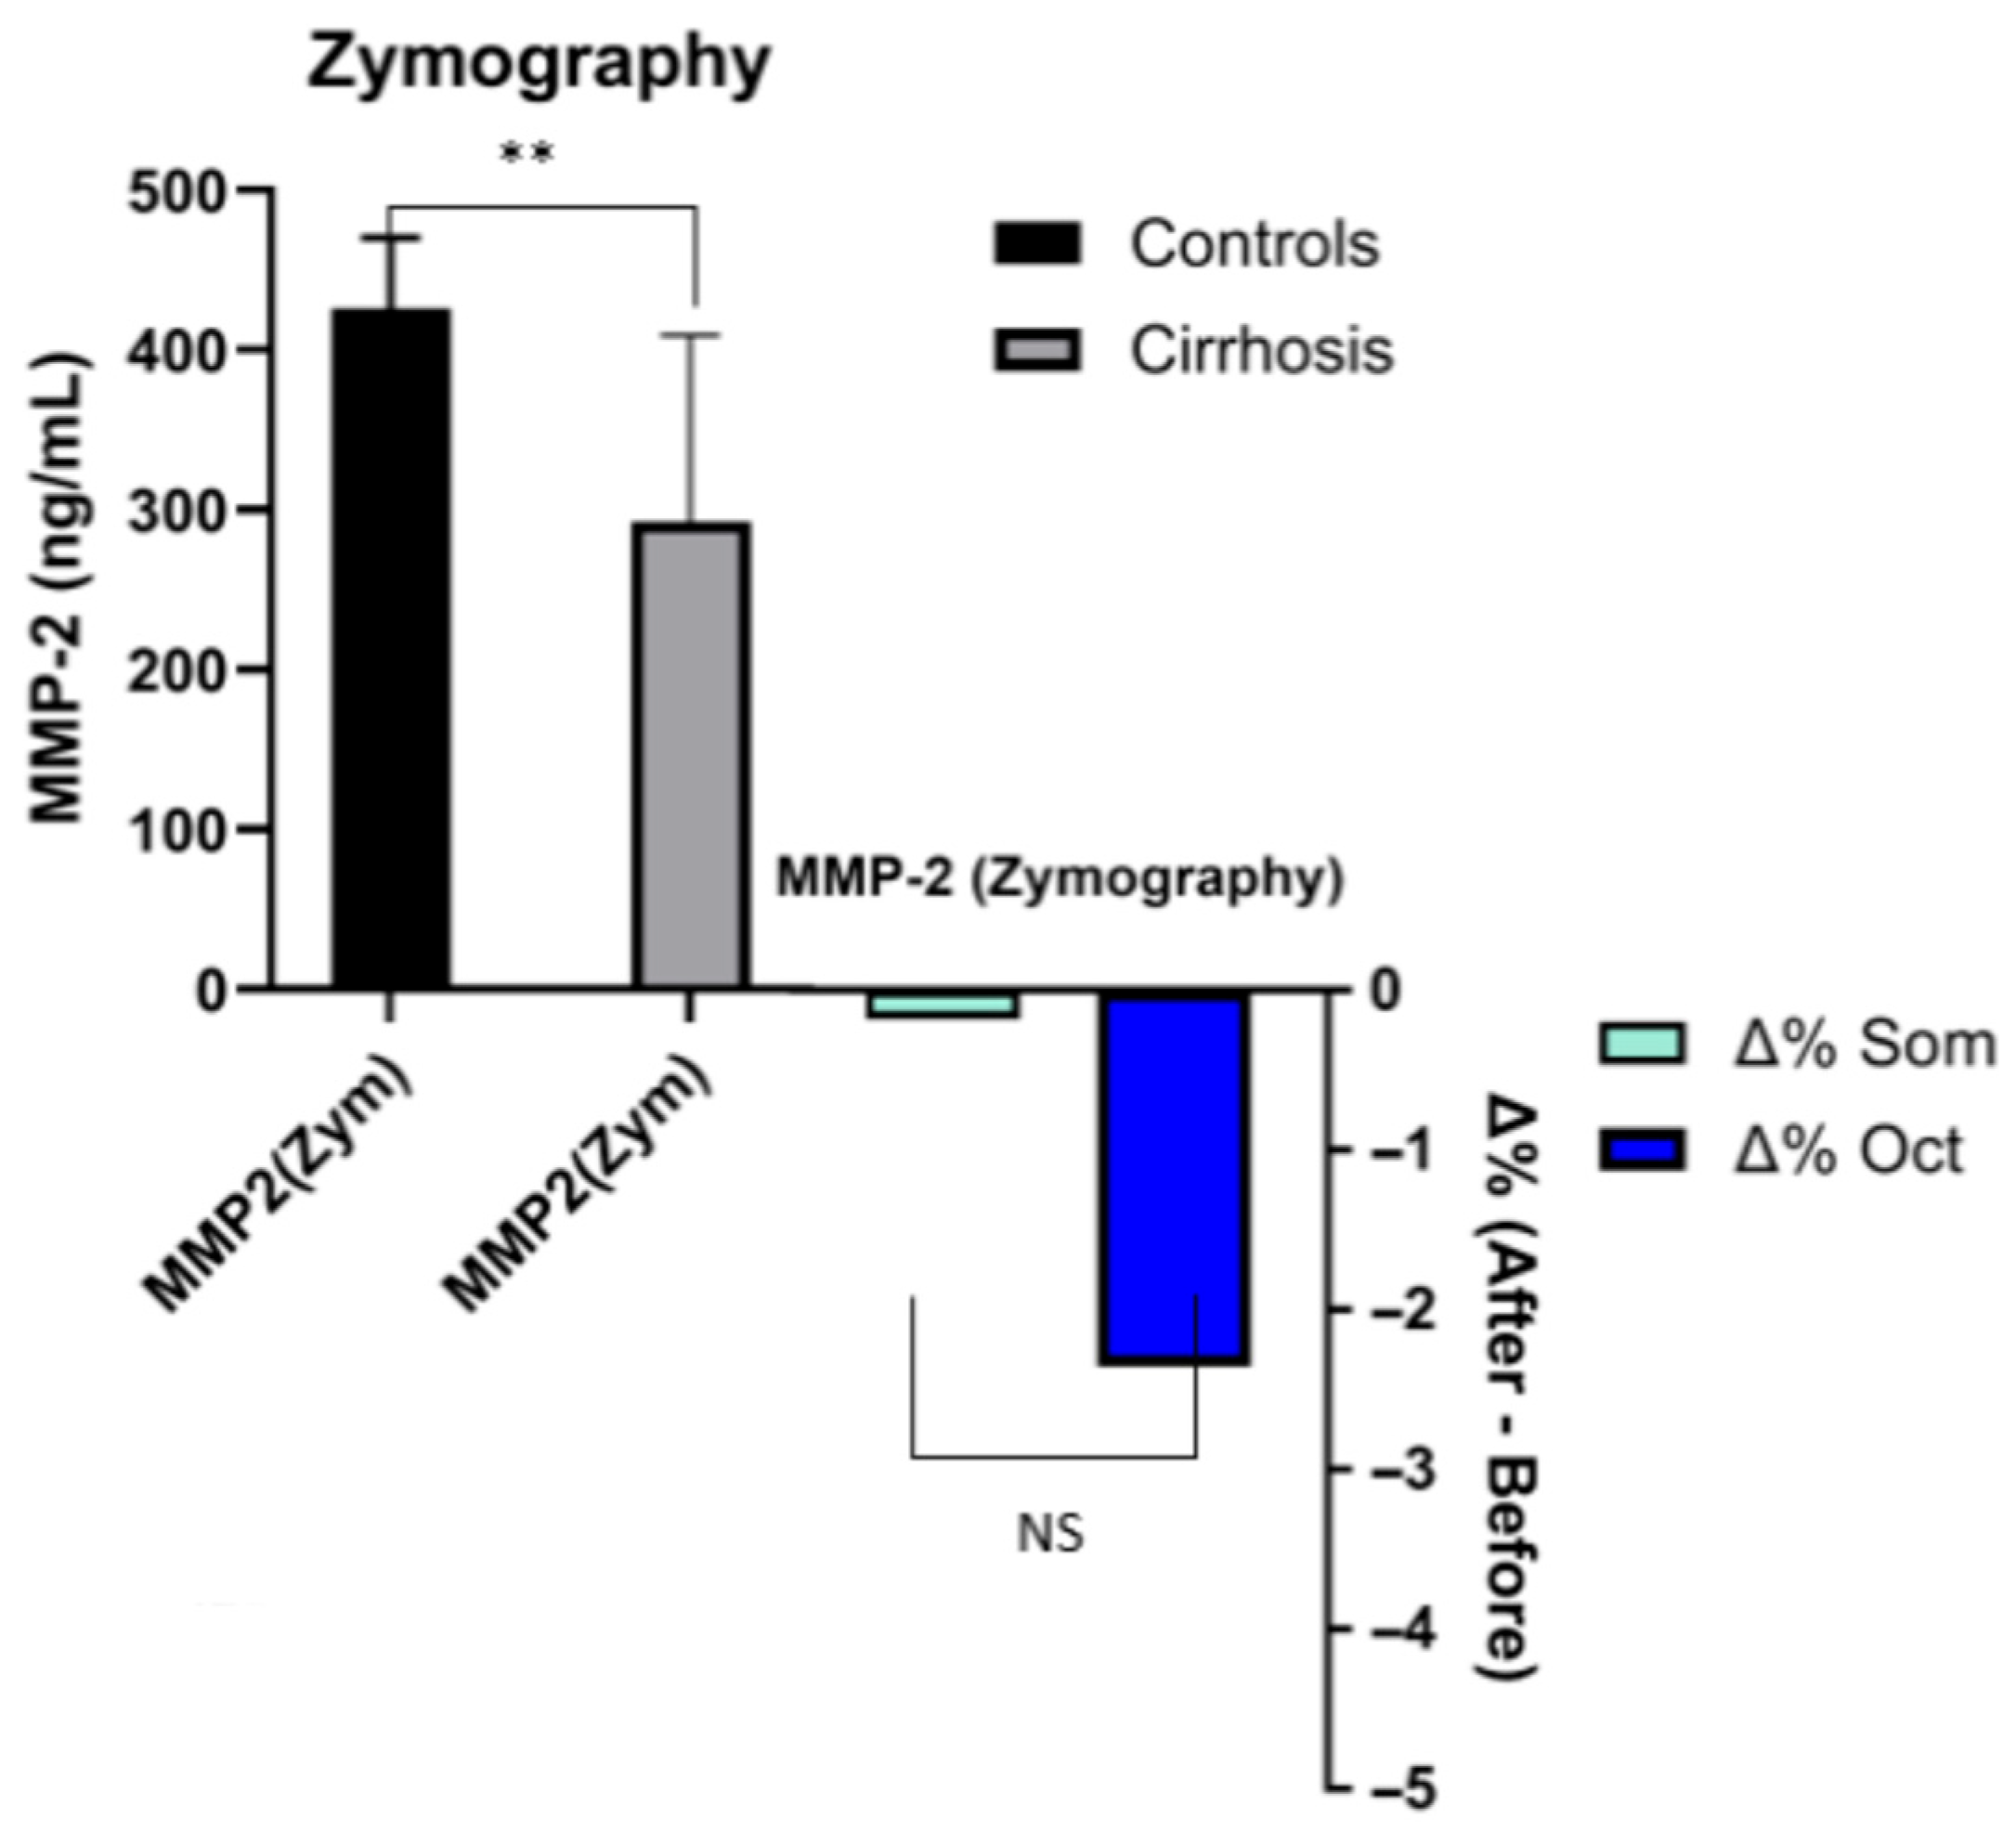
Mean values for the total number of patients with cirrhosis (58) were 292.9± 116.6 ng/mL. They were significantly lower (p < 0.01) compared to normal controls (426 ± 44), with a large effect size (Cohen’s d = 1.3). There was no difference (p = 0.95) before (330.5 ± 150.3) or after somatostatin administration (329.7 ± 142.7) or before (287.4 ± 72.3) or after octreotide administration (280.6 ± 75.2, p = 0.6). No statistical change in response was also found between somatostatin and octreotide (p = 0.7) (Figure 1).

3.2. MMP2 ELISA

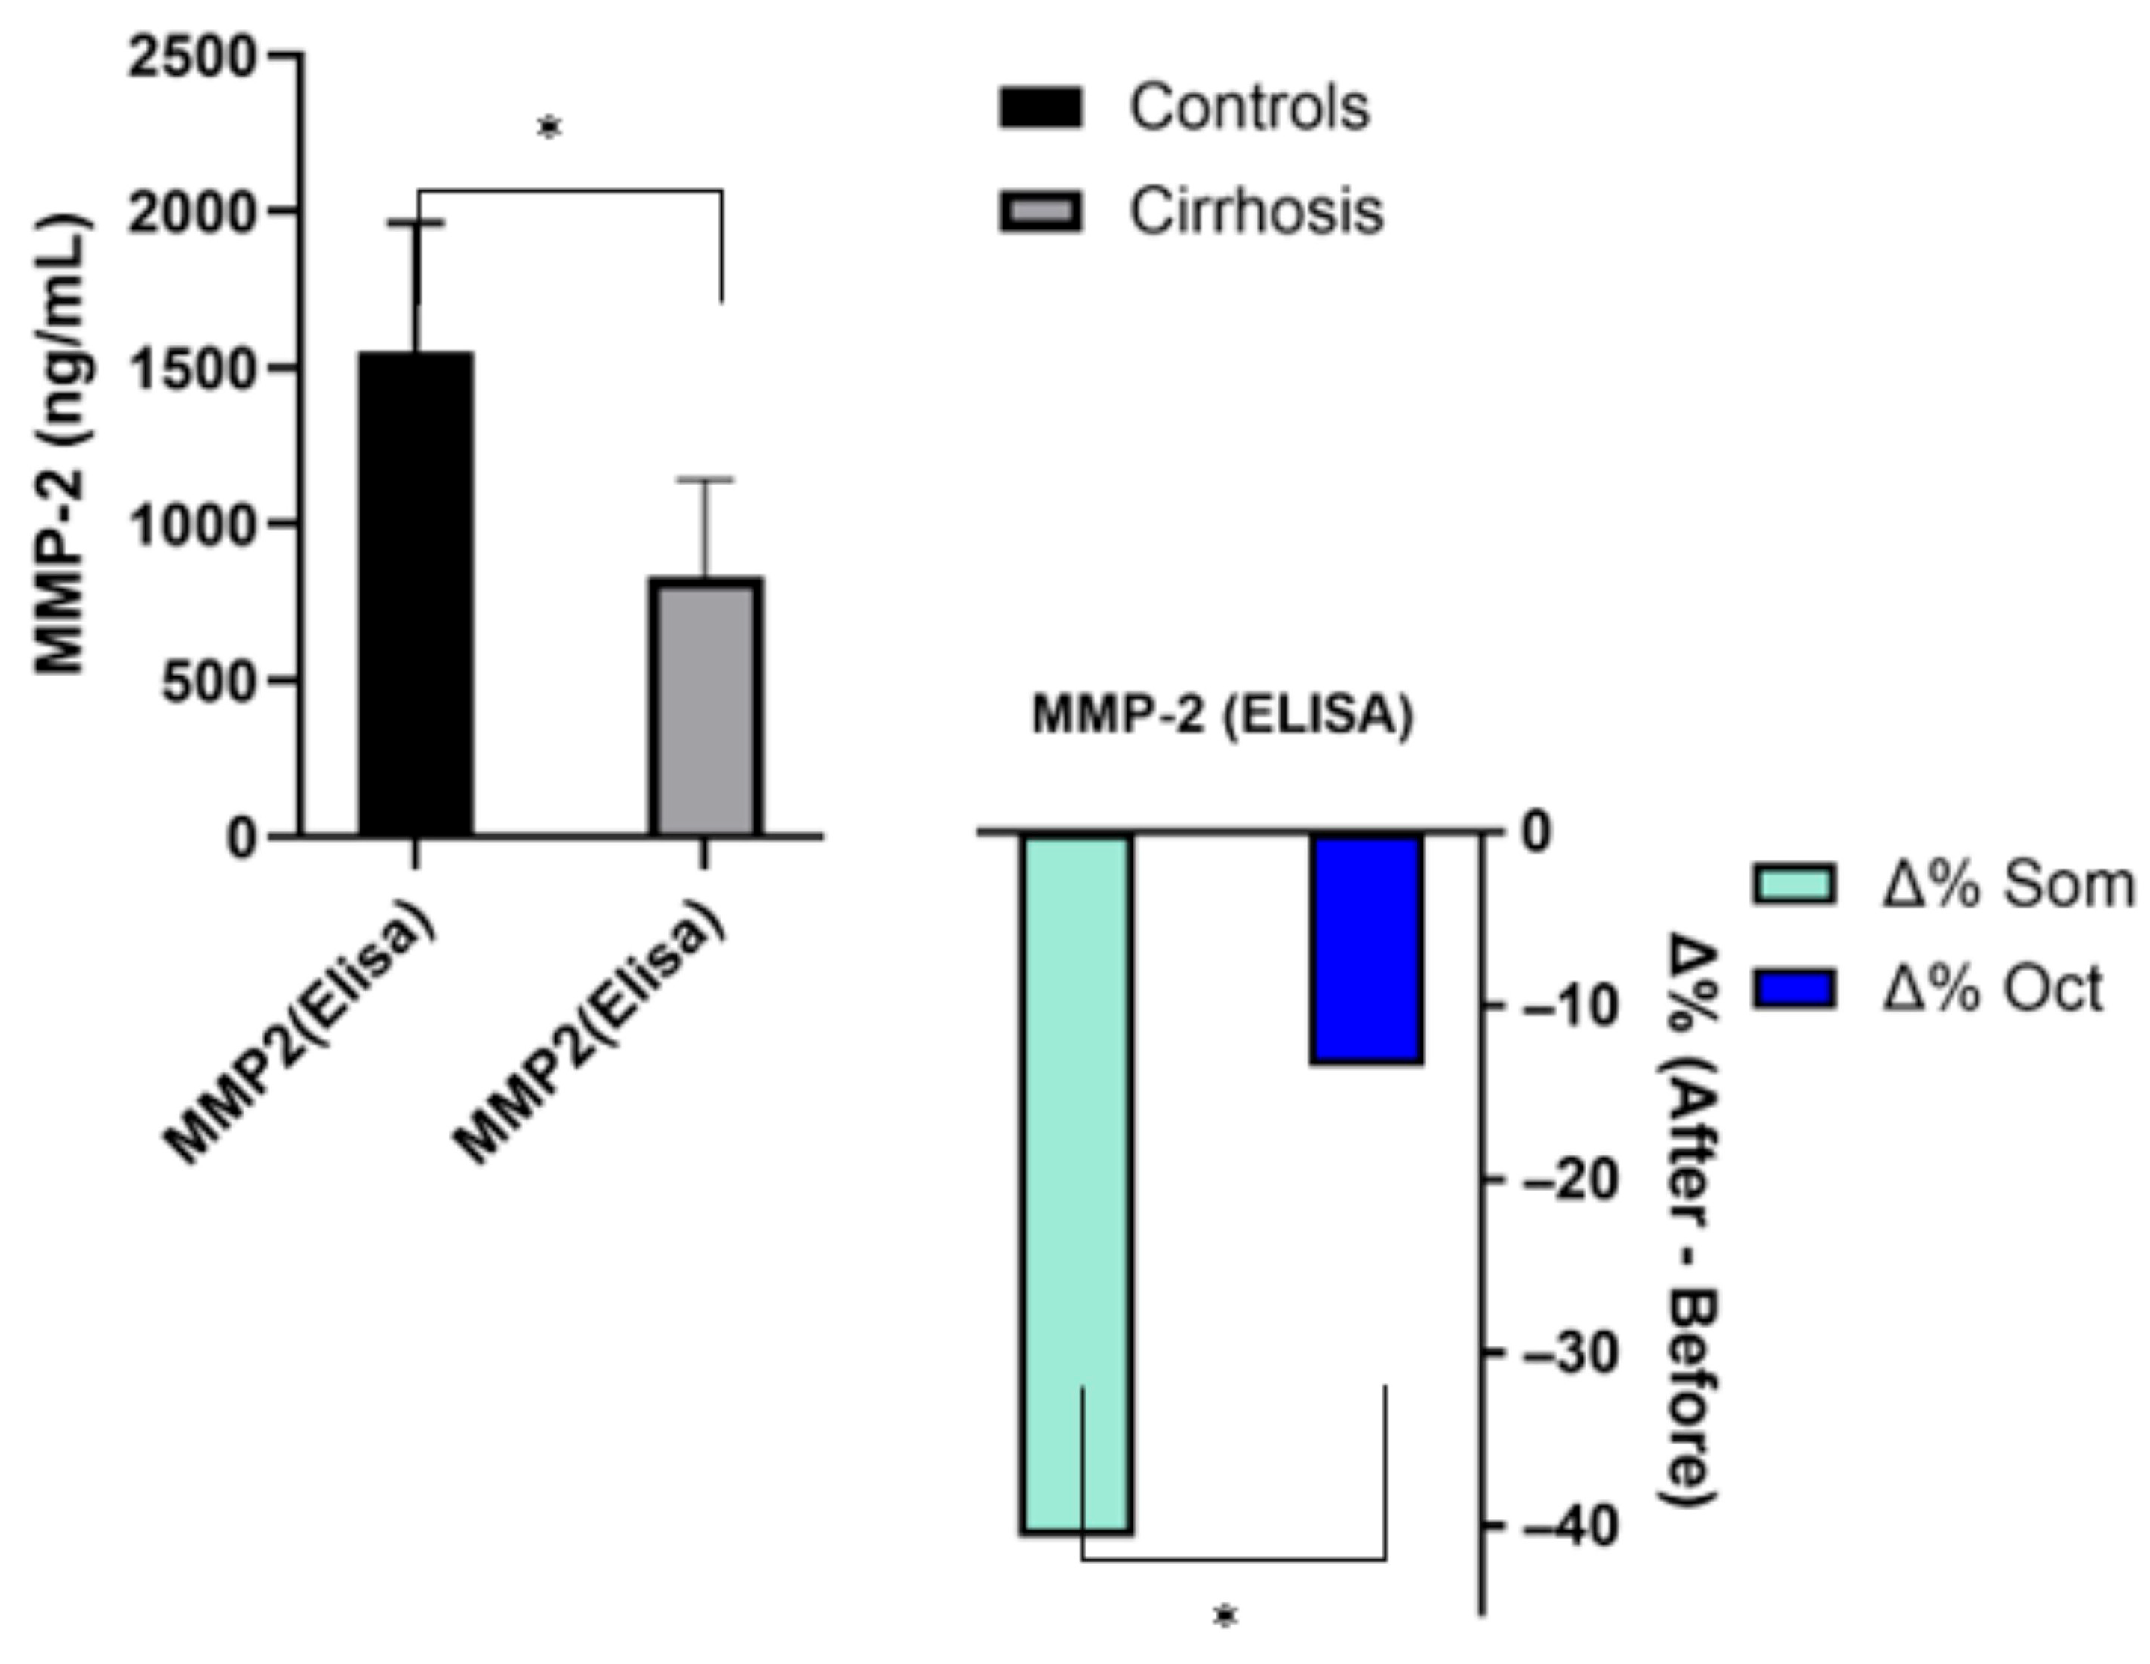
Mean values for the total number of patients with cirrhosis (58) were 830.8 ± 313.6 ng/mL. They were significantly lower (p < 0.05) compared to normal controls (1554 ± 410), with a large effect size (Cohen’s d = 2). There was a significant difference (p < 0.01) before (937.2 ± 259.4) or after somatostatin administration (558.8 ± 293.3) but not before (784.4 ± 330.8) or after octreotide administration (677.8 ± 252.6, p = 0.6). There was a statistical difference in the response between somatostatin and octreotide (p < 0.03), with a large effect size (Cohen’s d = 1.2) (Figure 2).

3.3. MMP9 Zymography

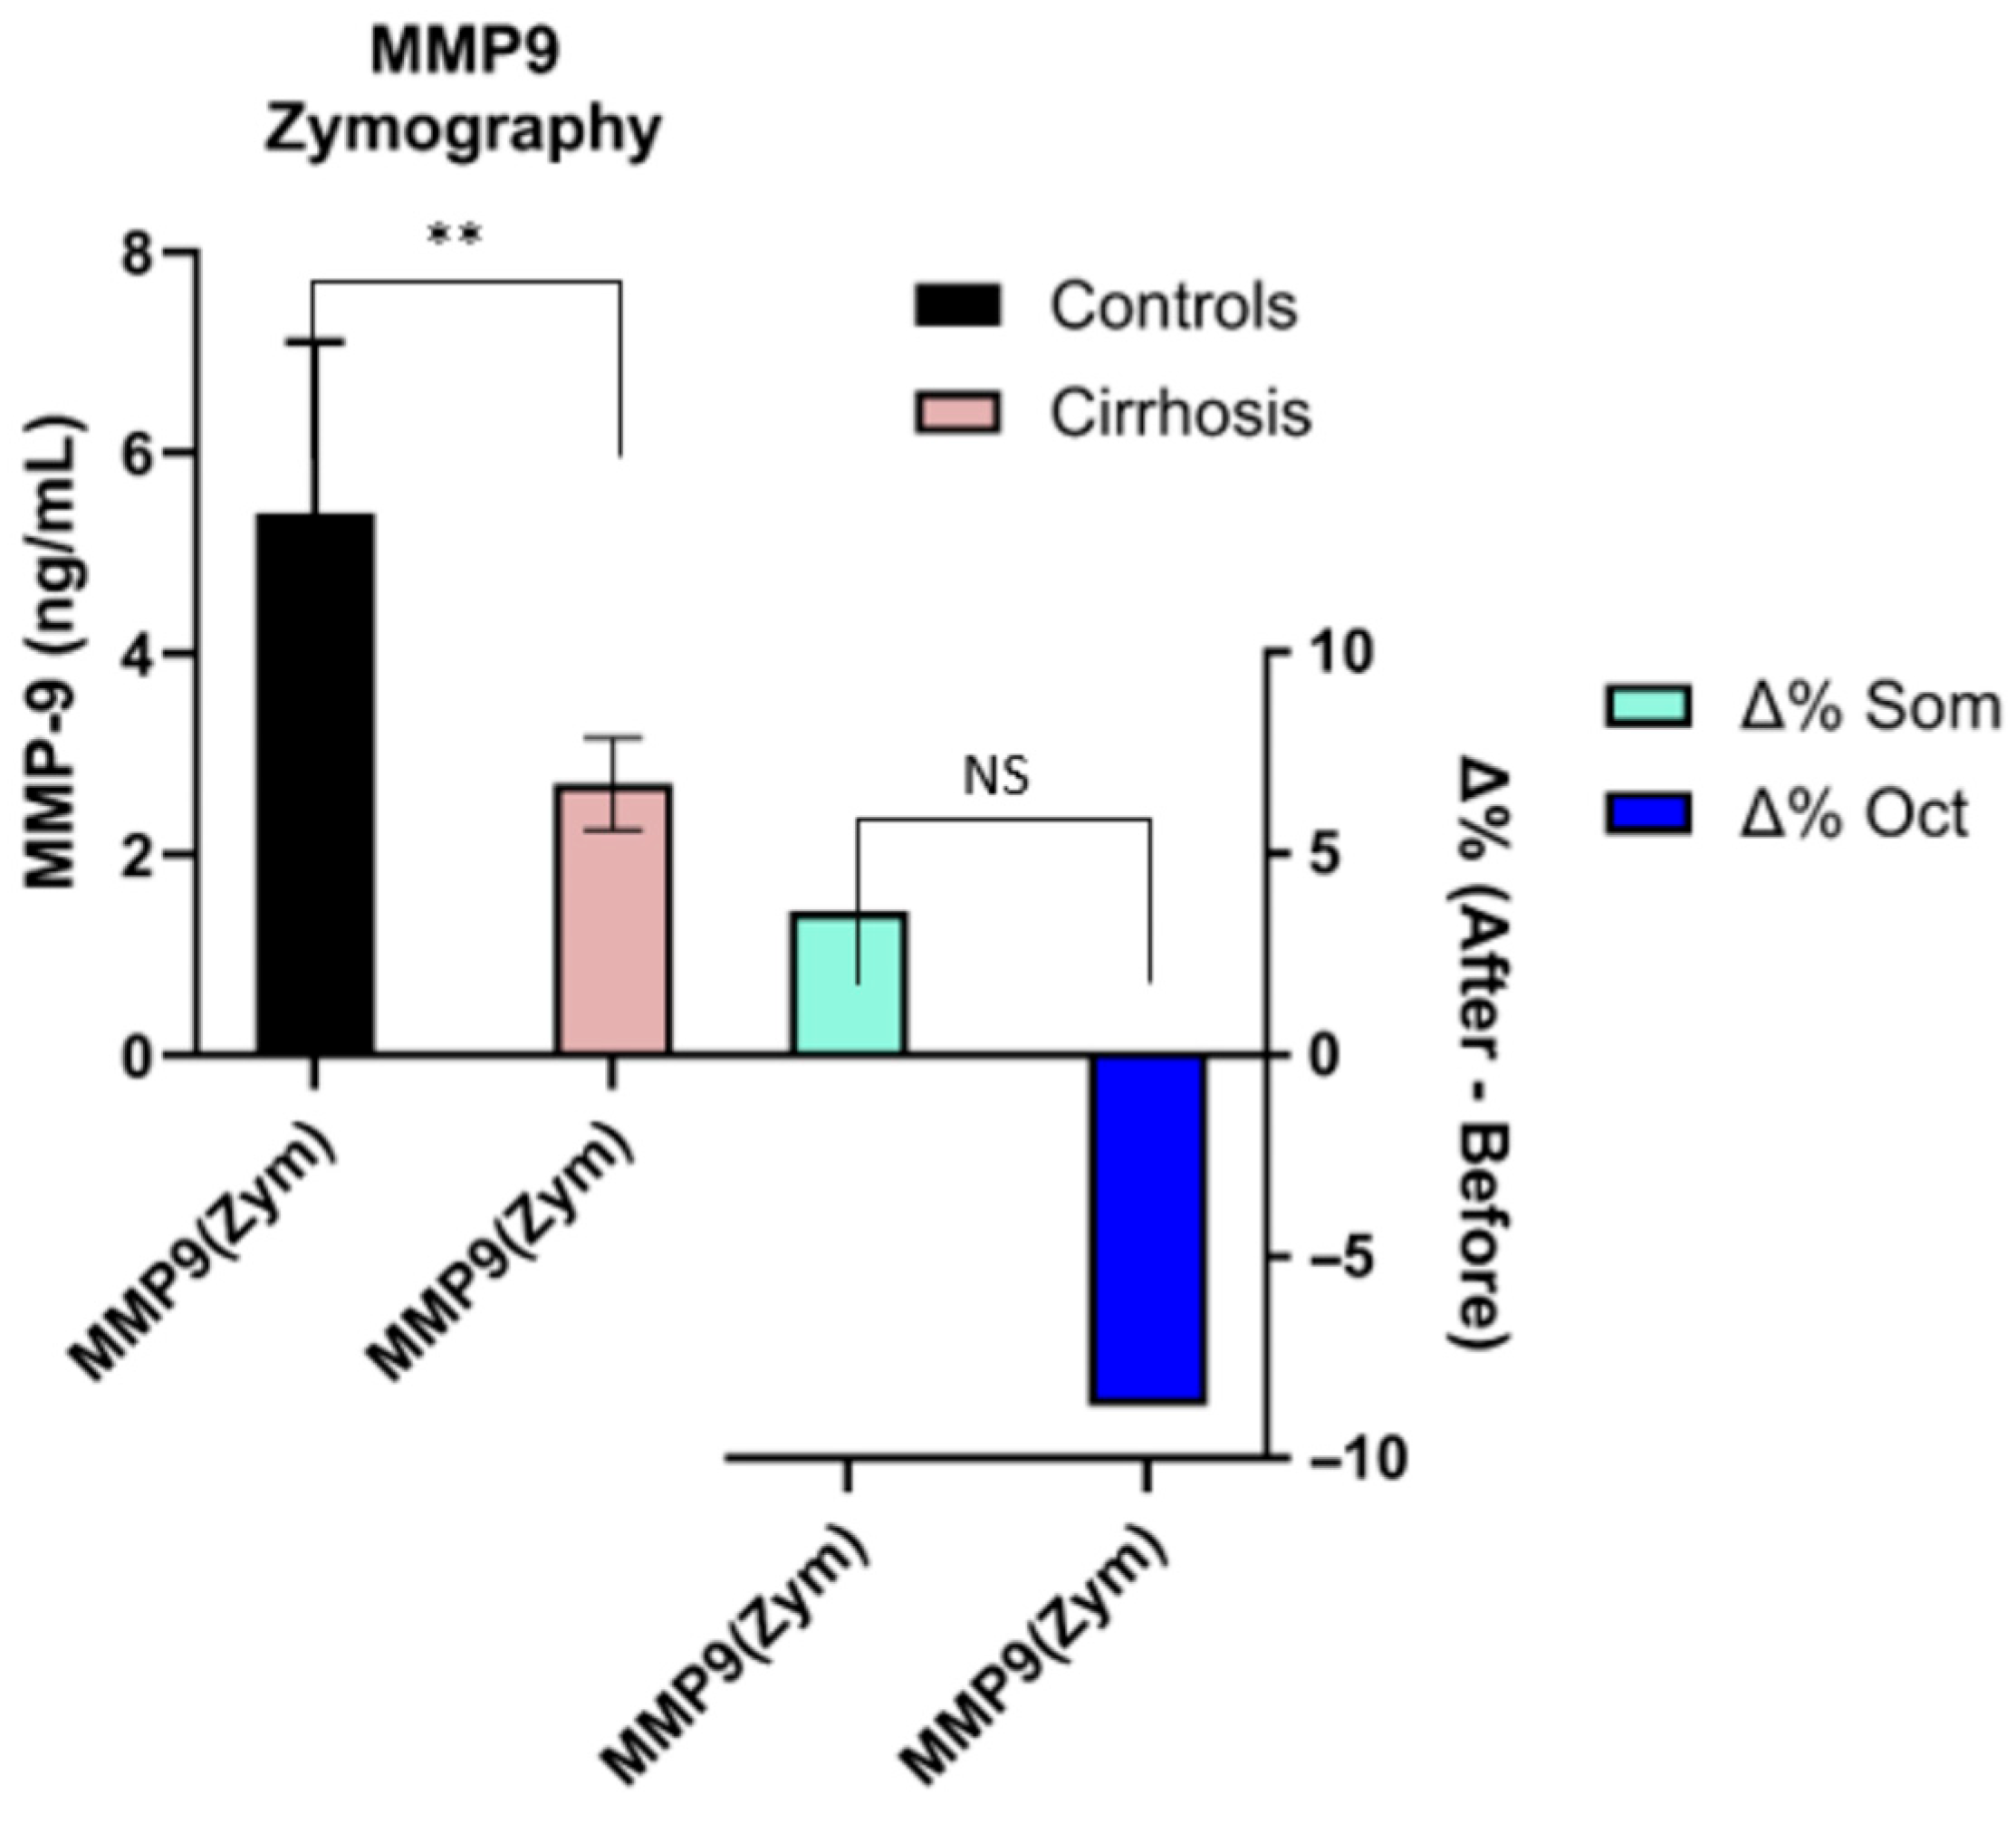
Mean values for the total number of patients with cirrhosis (58) were 2.7 ± 0.46 ng/mL. They were significantly lower (p < 0.01) compared to normal controls (5.4 ± 1.7), with a very large effect size (Cohen’s d = 2.5). There was no difference (p = 0.90) before (2.8 ± 0.36) or after somatostatin administration (2.9 ± 0.22) or before (2.3 ± 0.97) or after octreotide administration (2.1 ± 0.71, p = 0.8). No statistical difference in response was also found between Somatostatin and octreotide (p = 0.7) (Figure 3).

3.4. MMP9 ELISA

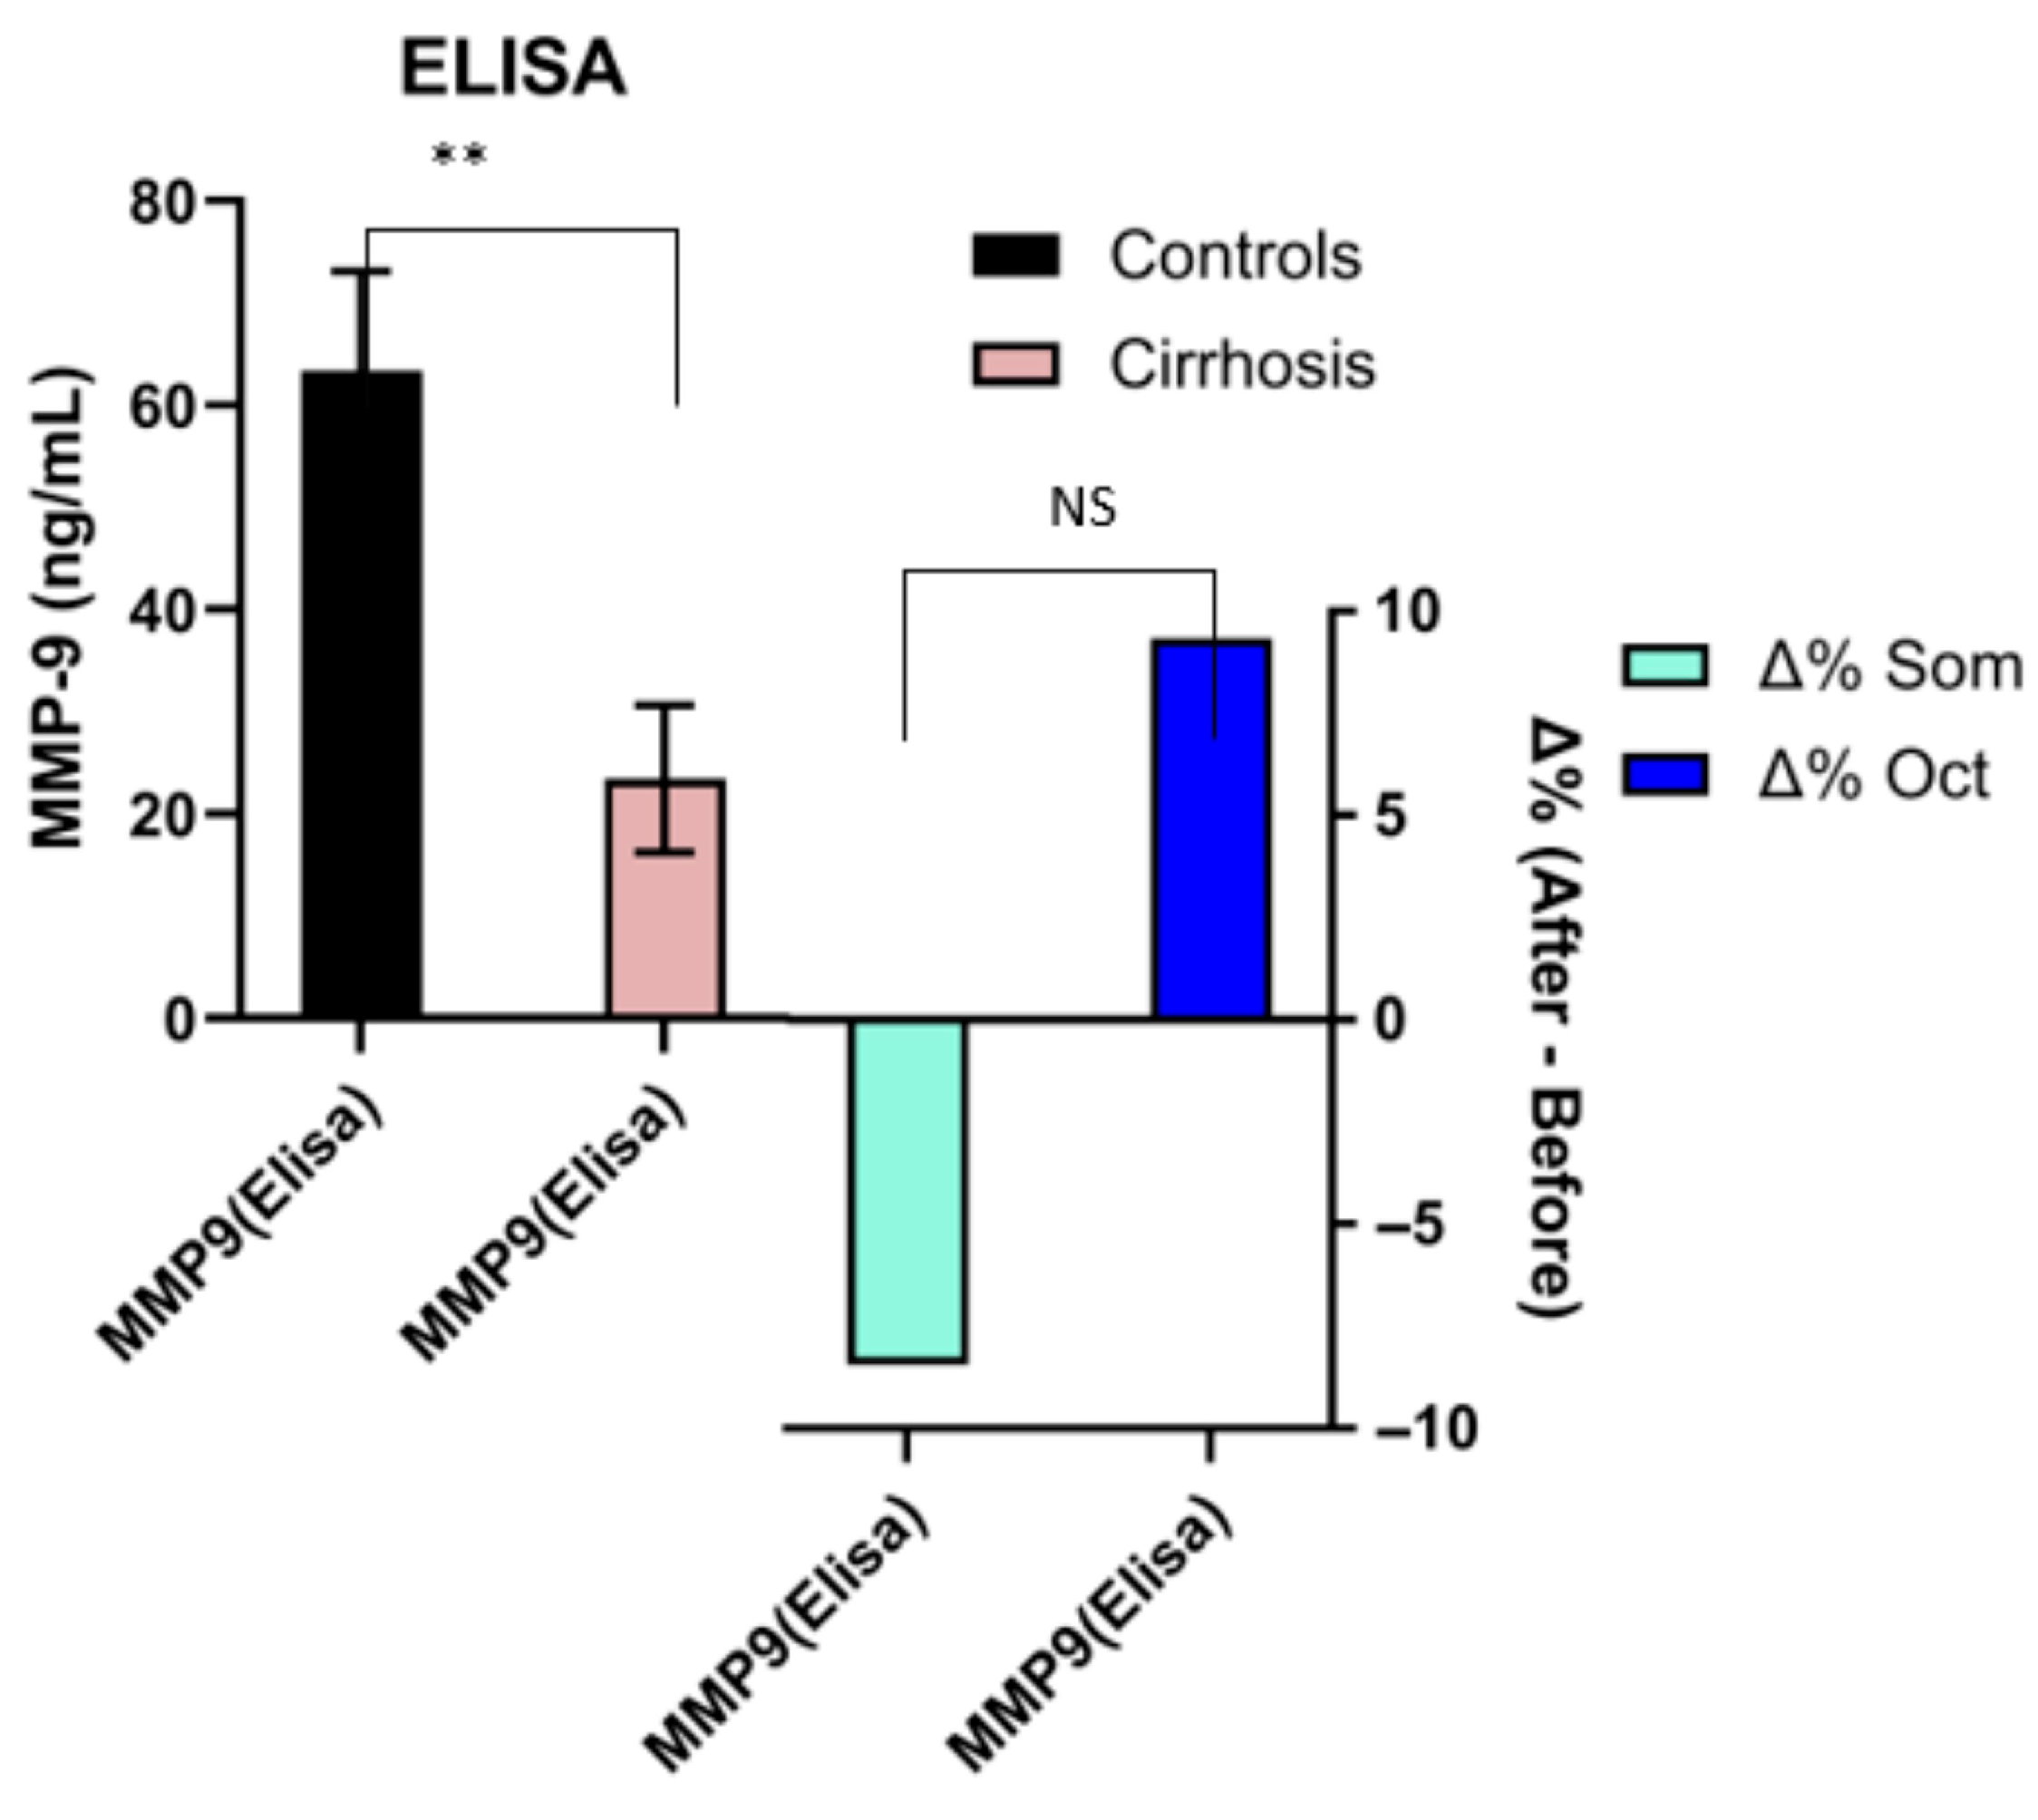
These results were similar to the zymography results. Mean values for the total number of patients with cirrhosis (58) were 23.4 ± 7.2 ng/mL. They were significantly lower (p < 0.01) compared to normal controls (63.4 ± 9.7), with a very large effect size (Cohen’s d = 4.9). There was no difference (p = 0.84) before (21.3 ± 6.8) or after somatostatin administration (19.3 ± 7.3) or before (24.6 ± 5.5) or after octreotide administration (26.9 ± 7.1, p = 0.70). No statistical difference in response was also found between somatostatin and octreotide (p = 0.69) (Figure 4).

3.5. MMP1

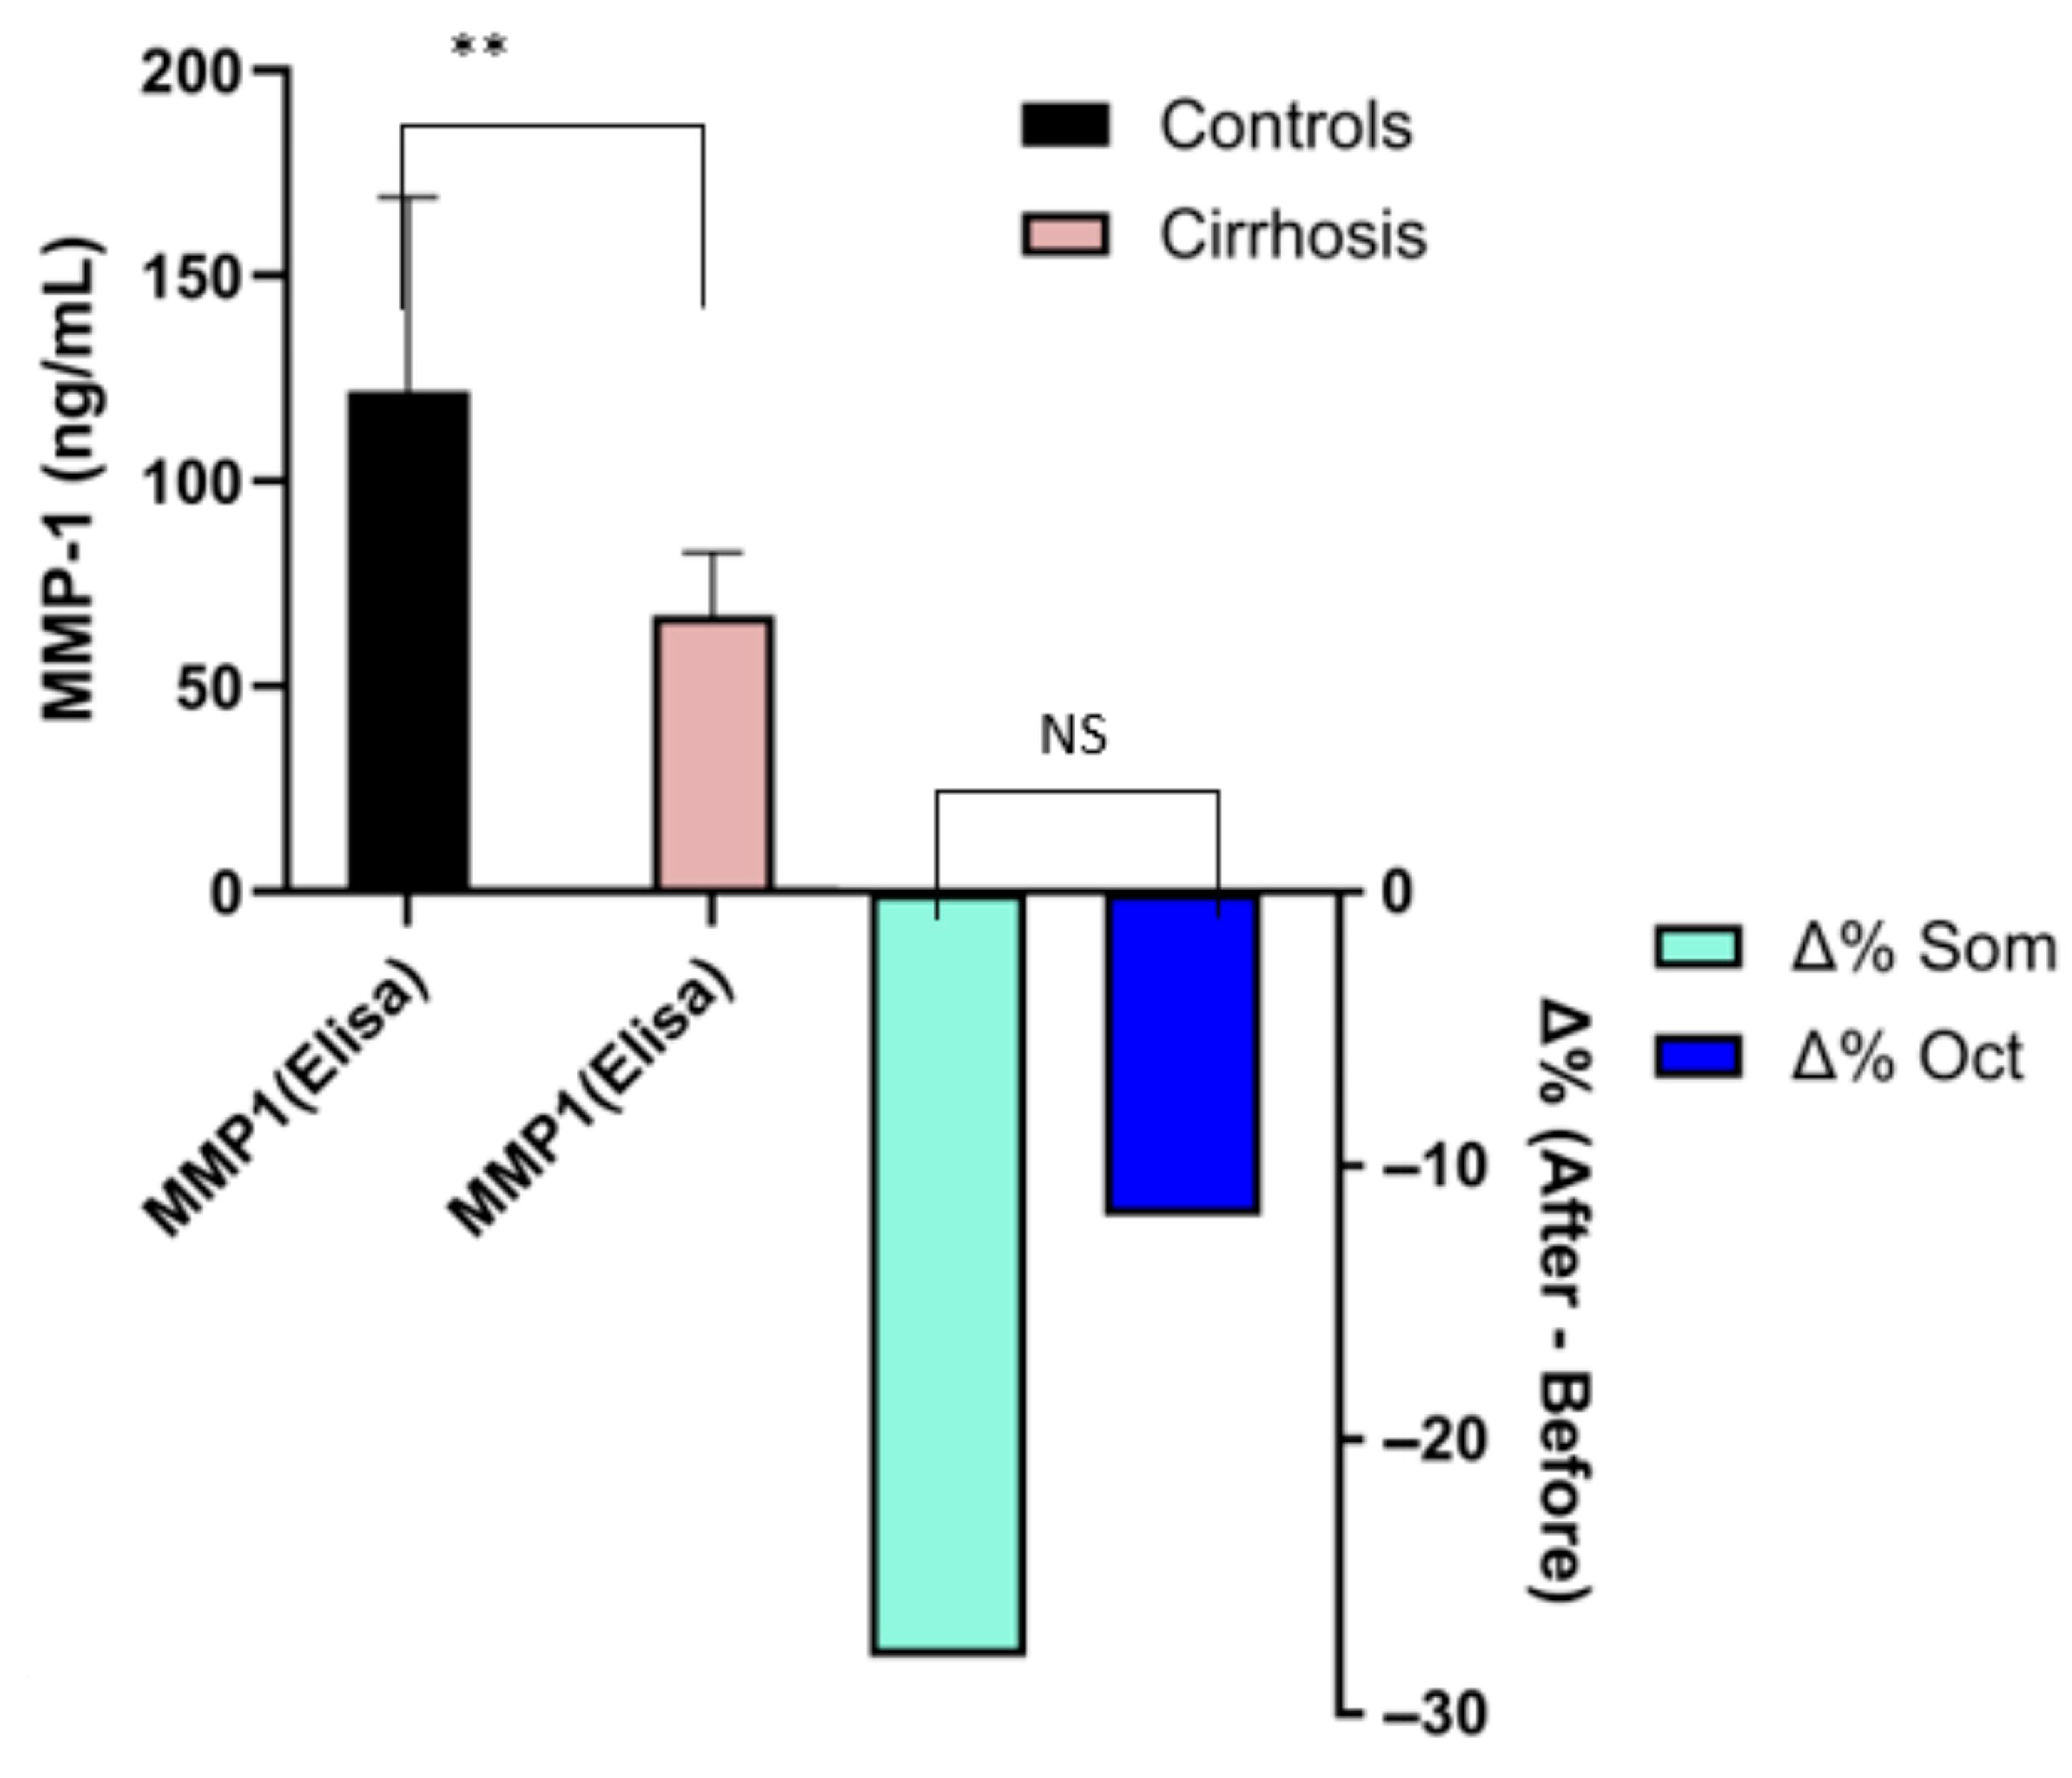
Mean values for the total number of patients with cirrhosis (58) were 67.33 ± 15.2 ng/mL. They were significantly lower (p < 0.01) compared to normal controls (121.8 ± 47.3), with a large effect size (Cohen’s d = 1.8). There was a significant difference (p < 0.01) before (68.45 ± 18.5) or after somatostatin administration (49.34 ± 24.8) or before (66.8 ± 5.2) or after octreotide administration (58.95 ± 22.6, p = 0.04). However, there was no statistical difference in response between somatostatin and octreotide (p = 0.087) (Figure 5).

3.6. TIMP1

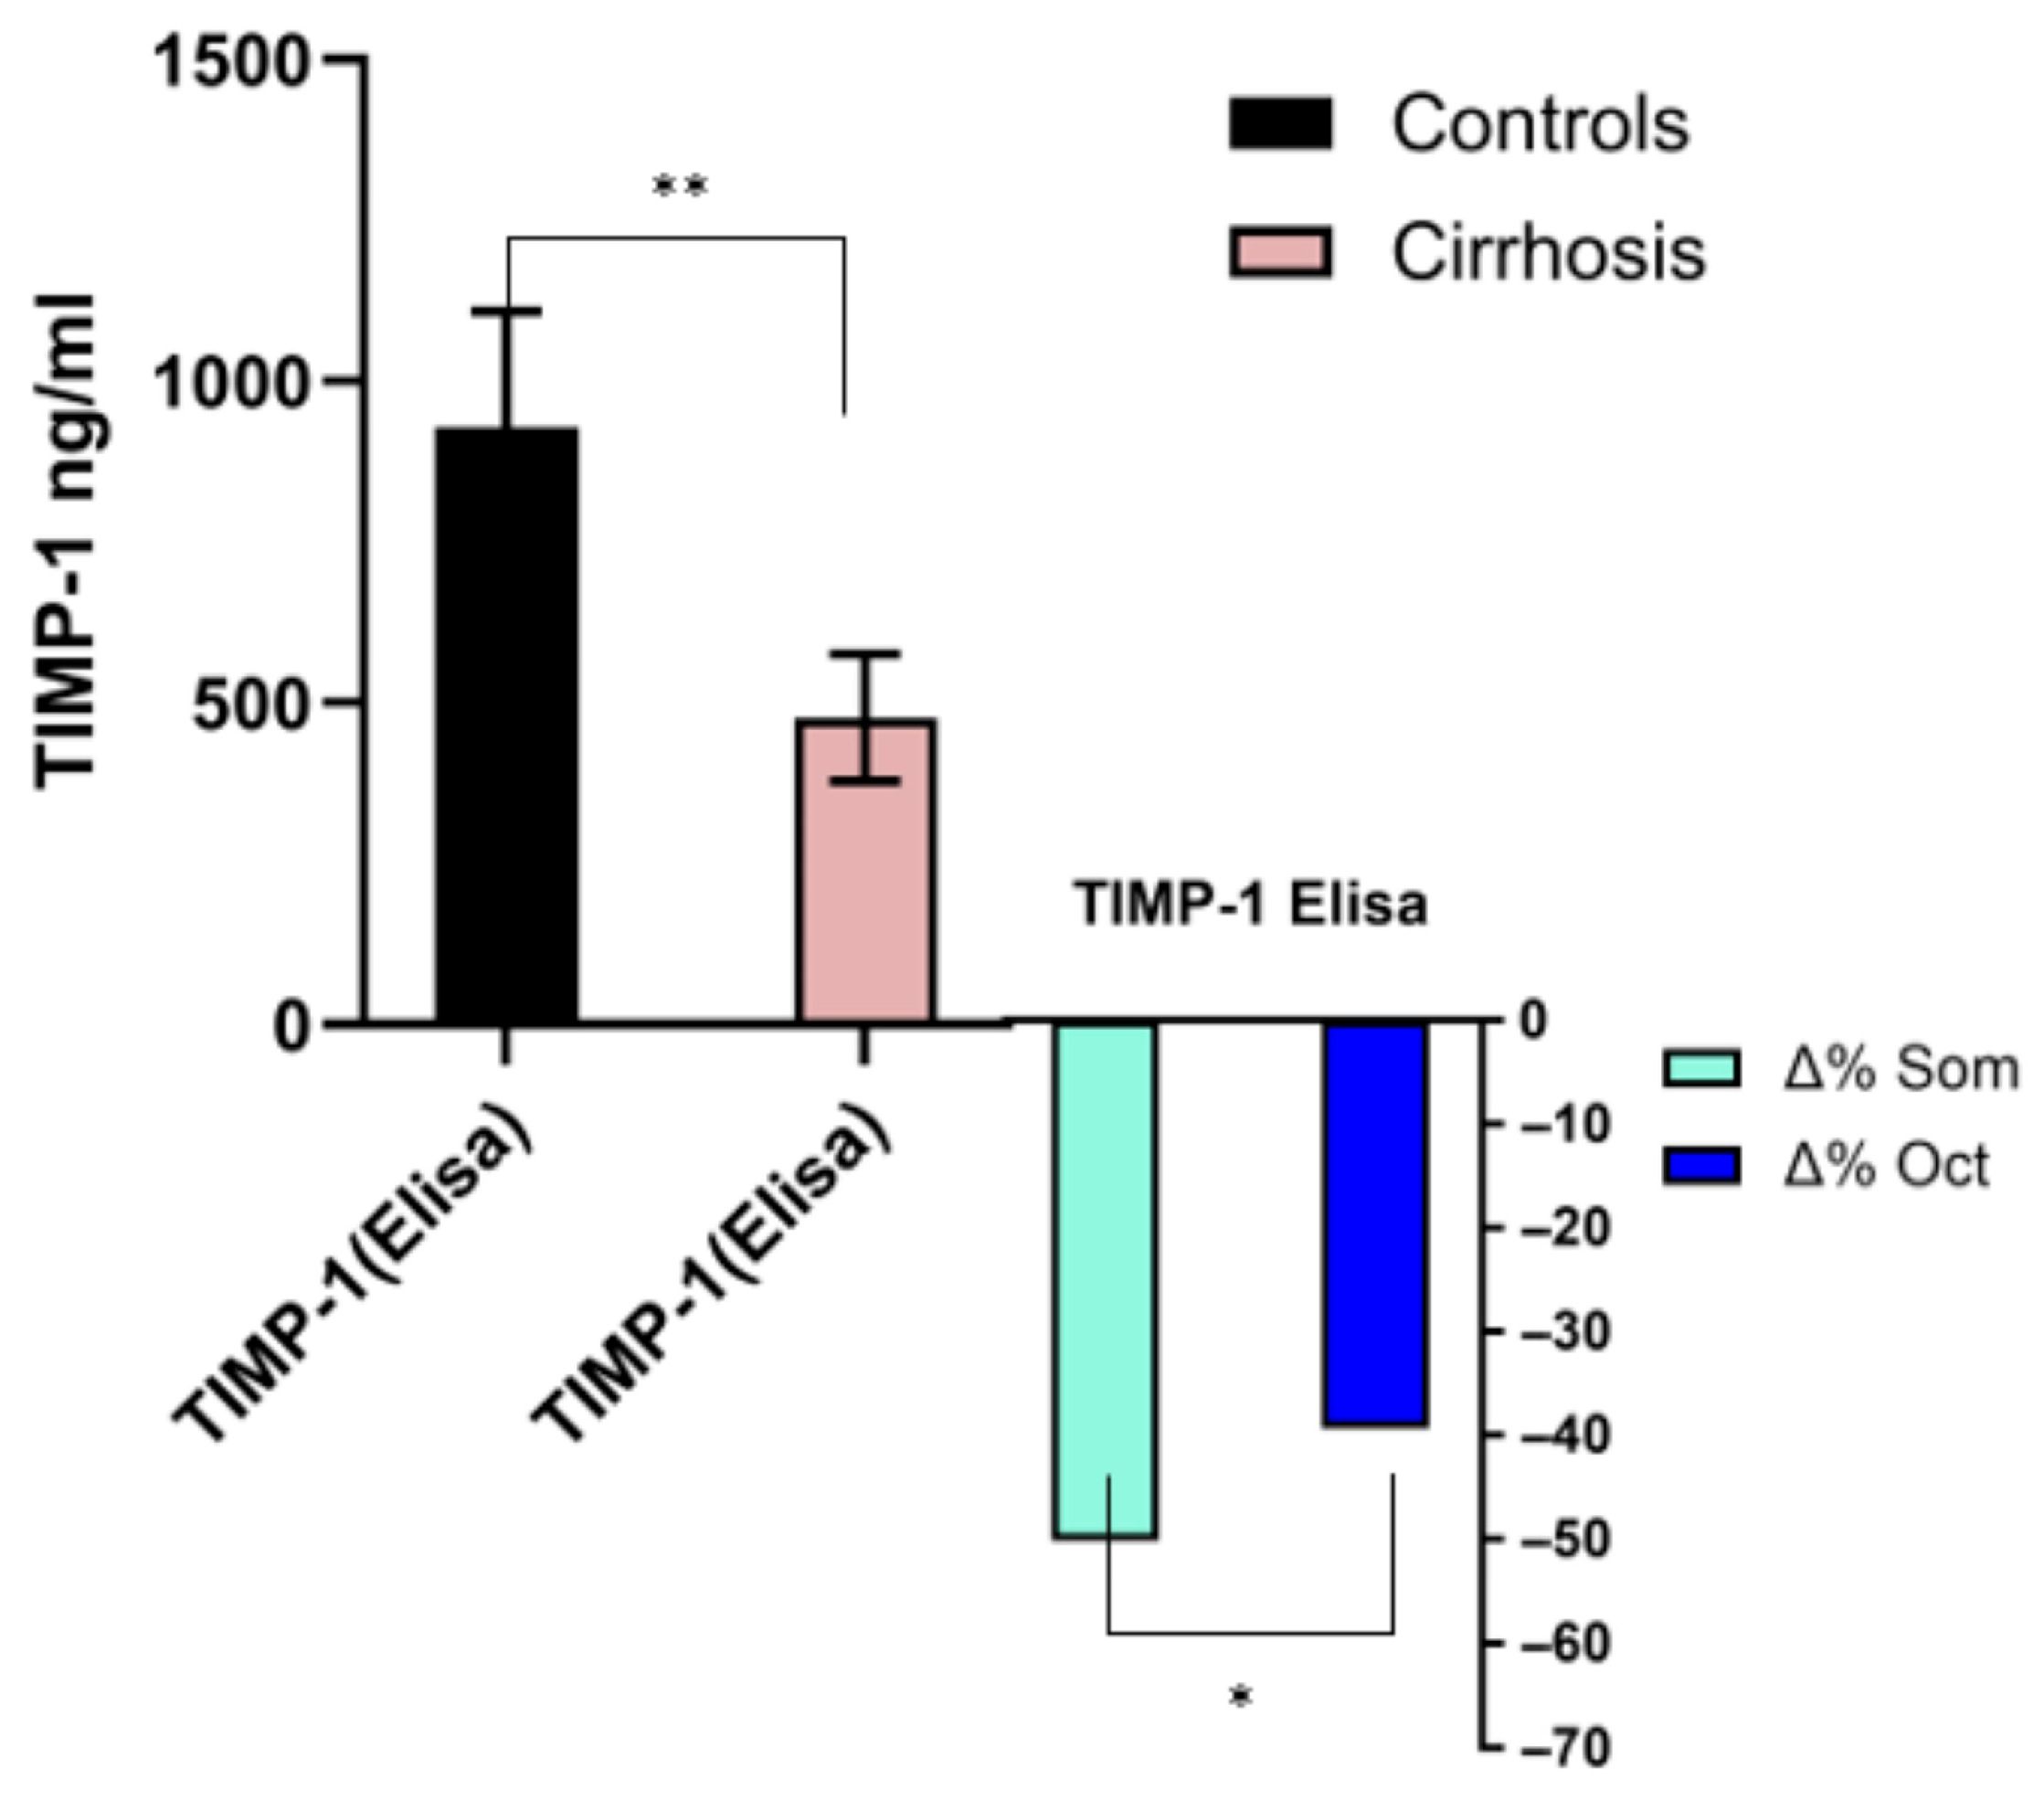
Mean values for the total number of patients with cirrhosis (58) were 477.7 ± 99.6 ng/mL. They were significantly lower (p < 0.01) compared to normal controls (928 ± 180.8), with a very large effect size (Cohen’s d = 3.43). There was a significant difference (p < 0.01) before (496.7 ± 126.1) or after somatostatin administration (247.5 ± 69.6) or before (466.4 ± 97.5) or after octreotide administration (282.6 ± 89.4, p < 0.01). However, there was a significant statistical difference in response between somatostatin and octreotide (p < 0.05), with a moderate effect size (Cohen’s d = 0.79) (Figure 6).

3.7. TIMP2

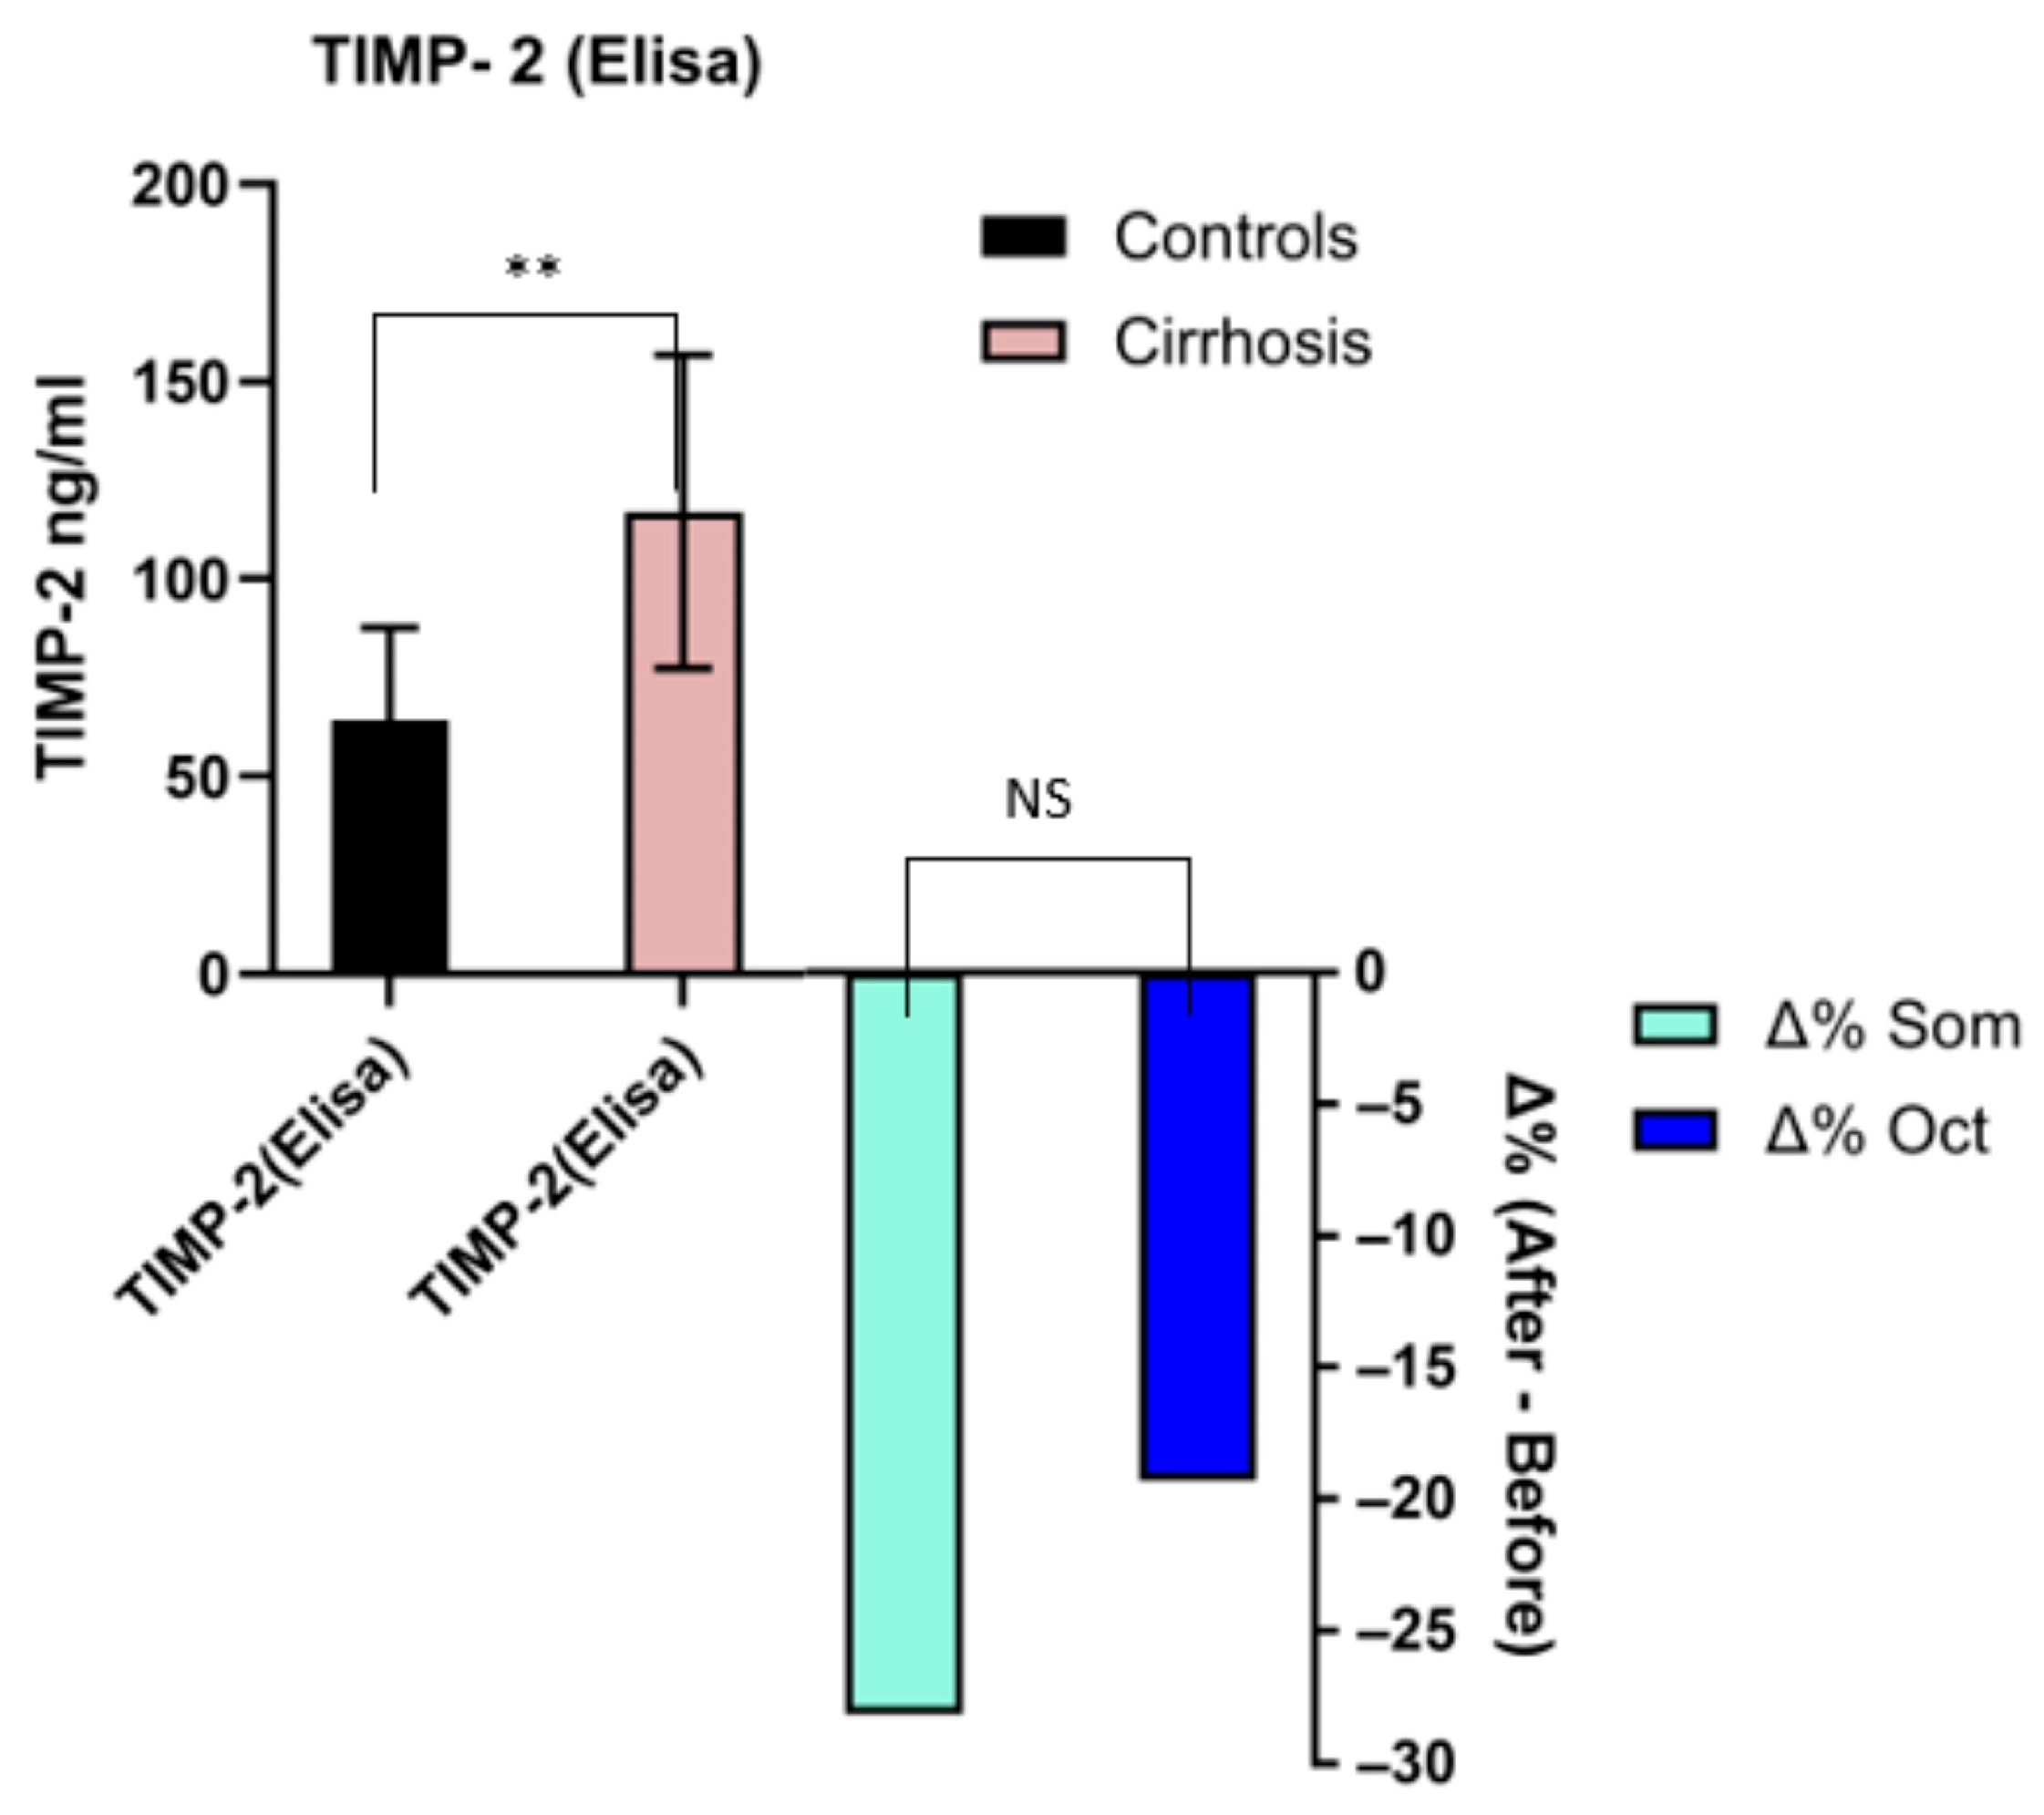
Mean values for the total number of patients with cirrhosis (58) were 117.1 ± 39.7 ng/mL. They were significantly higher (p < 0.01) compared to normal controls (64.2 ± 23.6), with a large effect size (Cohen’s d = 1.5). There was a significant difference (p < 0.01) before (117.9 ± 48.8) or after somatostatin administration (84.7 ± 24.9) or before (116.7 ± 36.9) or after octreotide administration (94.2 ± 14.9, p < 0.01). There was no statistical difference in response between somatostatin and octreotide (p = 0.3) (Figure 7).

3.8. NO

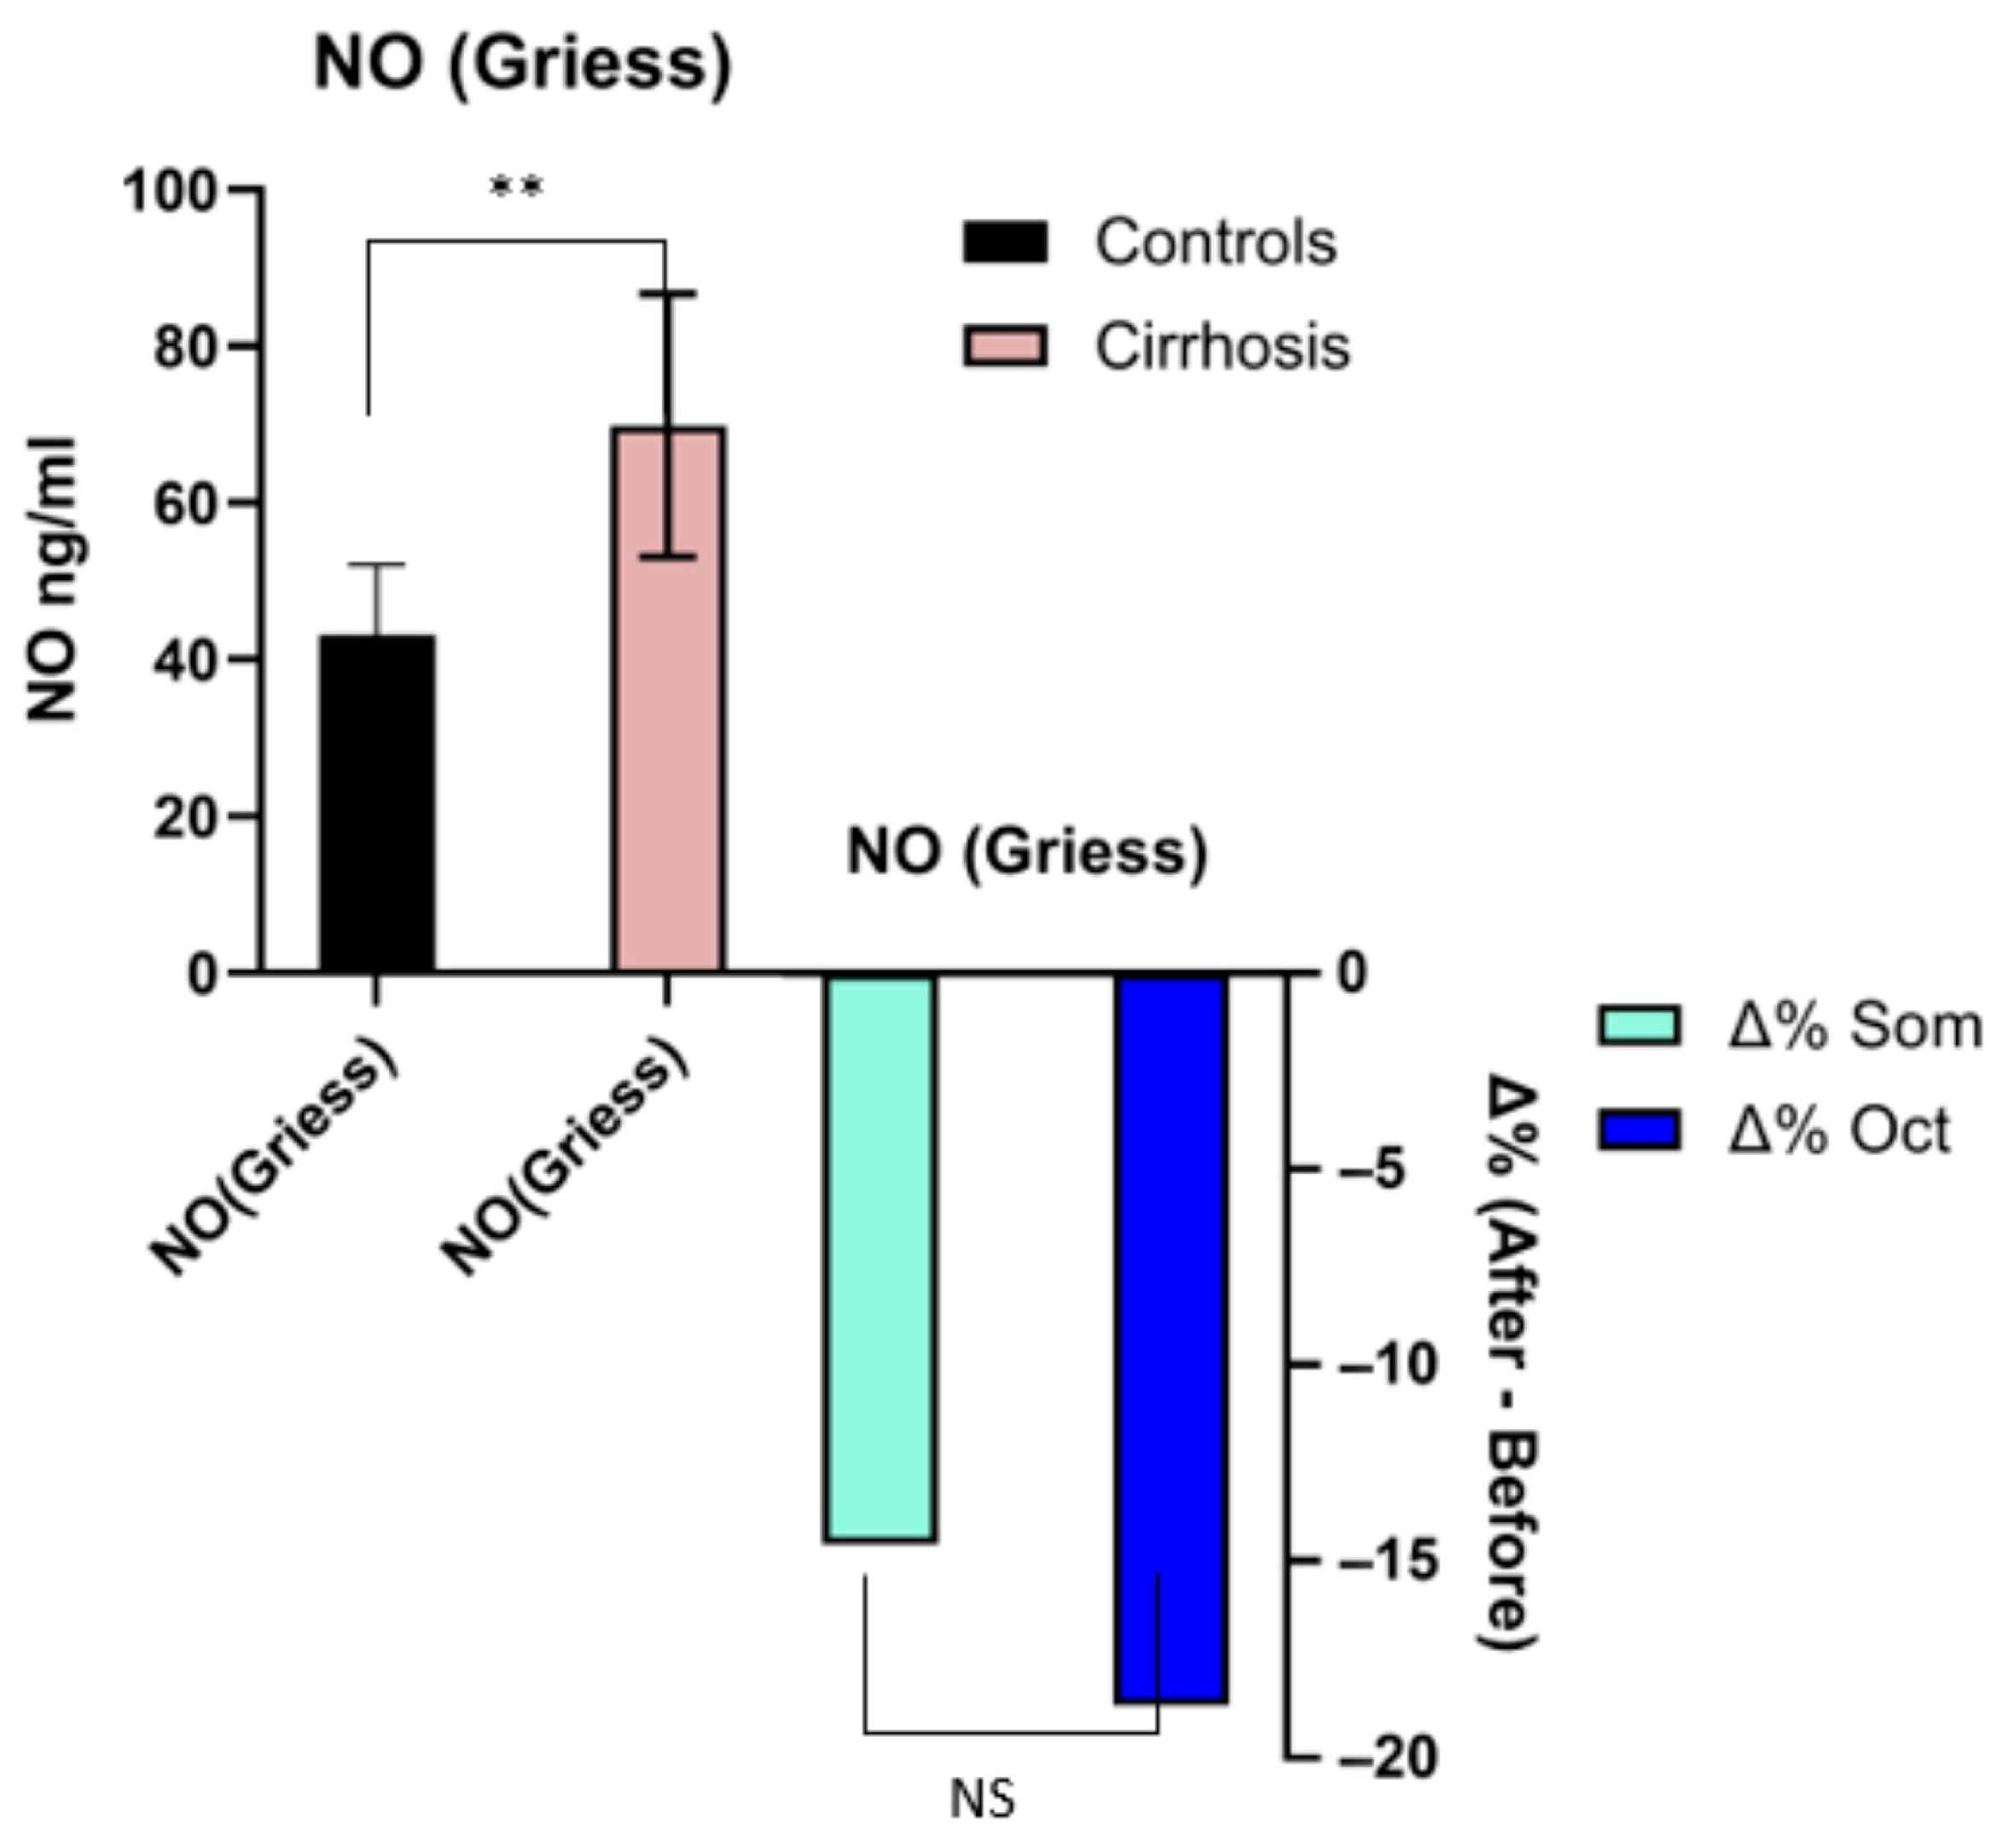
Mean values for the total number of patients with cirrhosis (58) were 69.9 ± 16.8. They were significantly higher (p < 0.01) compared to normal controls (43.2 ± 8.9), with a large effect size (Cohen’s d = 1.8). There was a significant difference 4 (p < 0.02) before (66.1 ± 16.9) or after somatostatin administration (56.4 ± 20.3) or before (72.2 ± 17.3) or after octreotide administration (58.7 ± 16.2, p < 0.01). There was no statistical difference in response between somatostatin and octreotide (p = 0.3) (Figure 8).

3.9. RANTES/CCL5

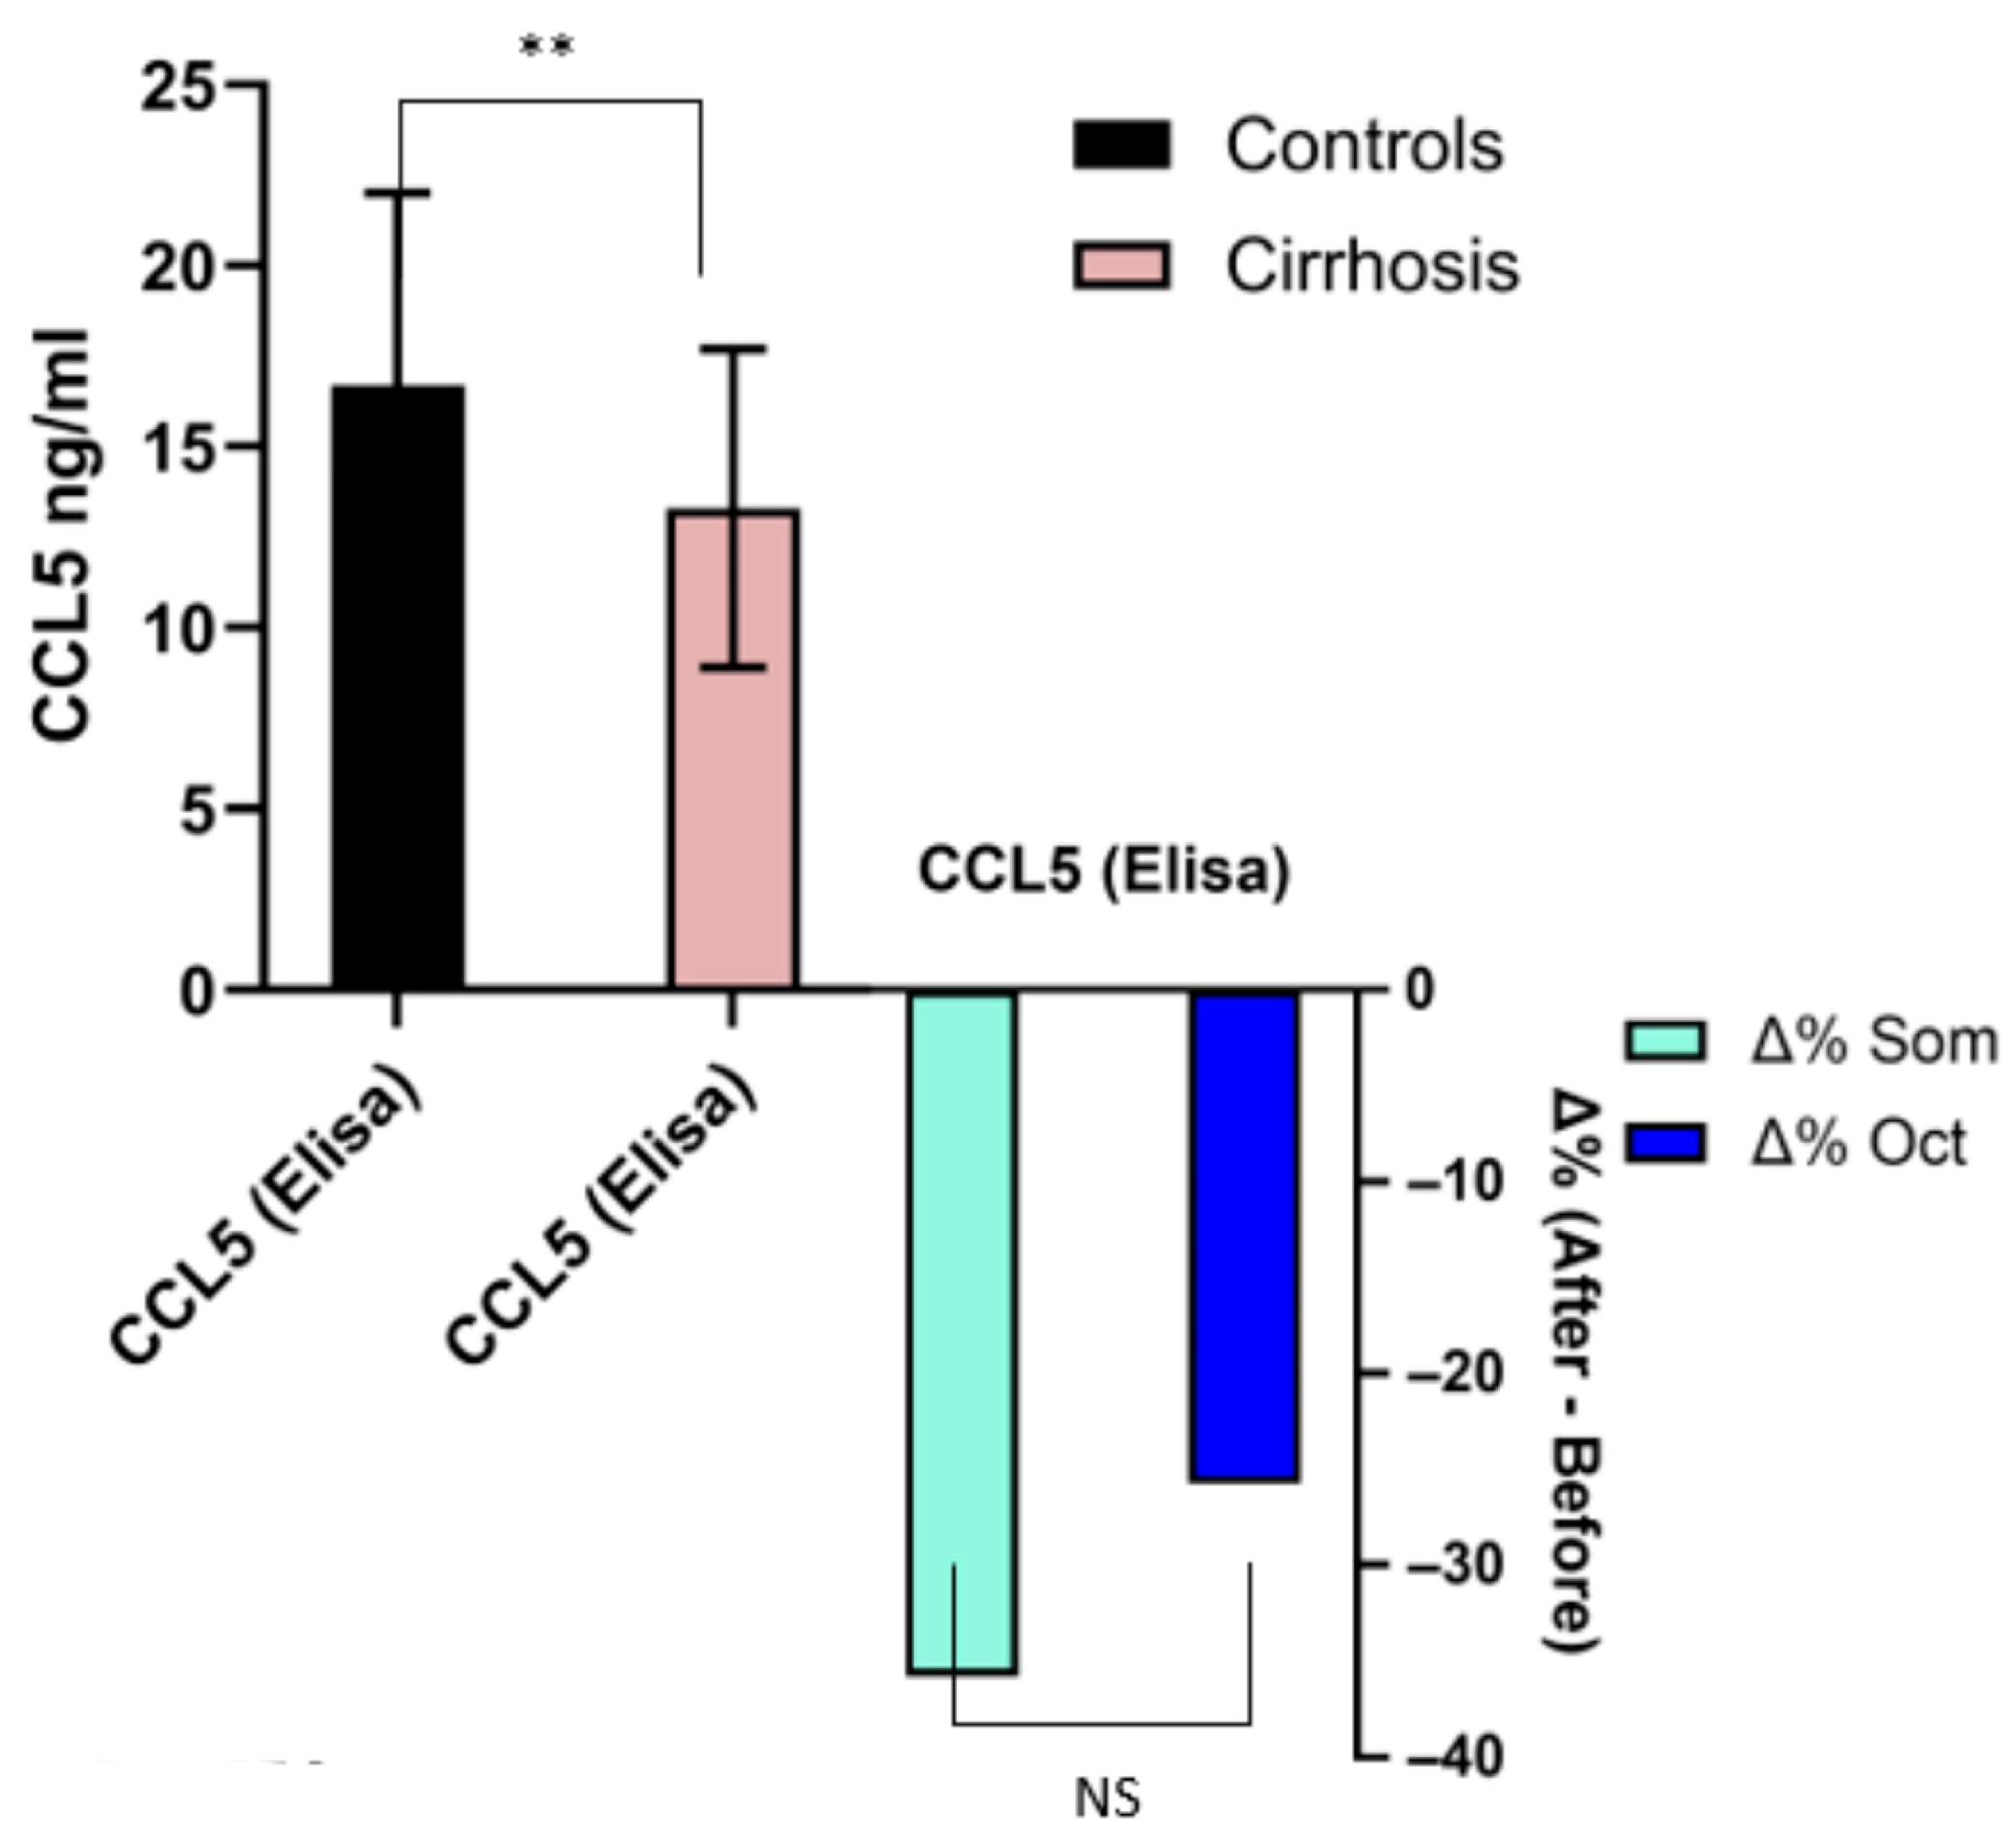
Mean values for the total number of patients with cirrhosis (58) were 16.7 ± 5.3 ng/mL. They were significantly lower (p < 0.01) compared to normal controls (13.3 ± 4.4), with a moderate effect size (Cohen’s d = 0.72). There was a significant difference (p < 0.01) before (13.4 ± 4.1) or after somatostatin administration (8.6 ± 5.3) or before (13.2 ± 6.1) or after octreotide administration (9.8 ± 14.1, p < 0.01). There was no statistical difference in response between somatostatin and octreotide (p = 0.19) (Figure 9).

3.10. MIP1a

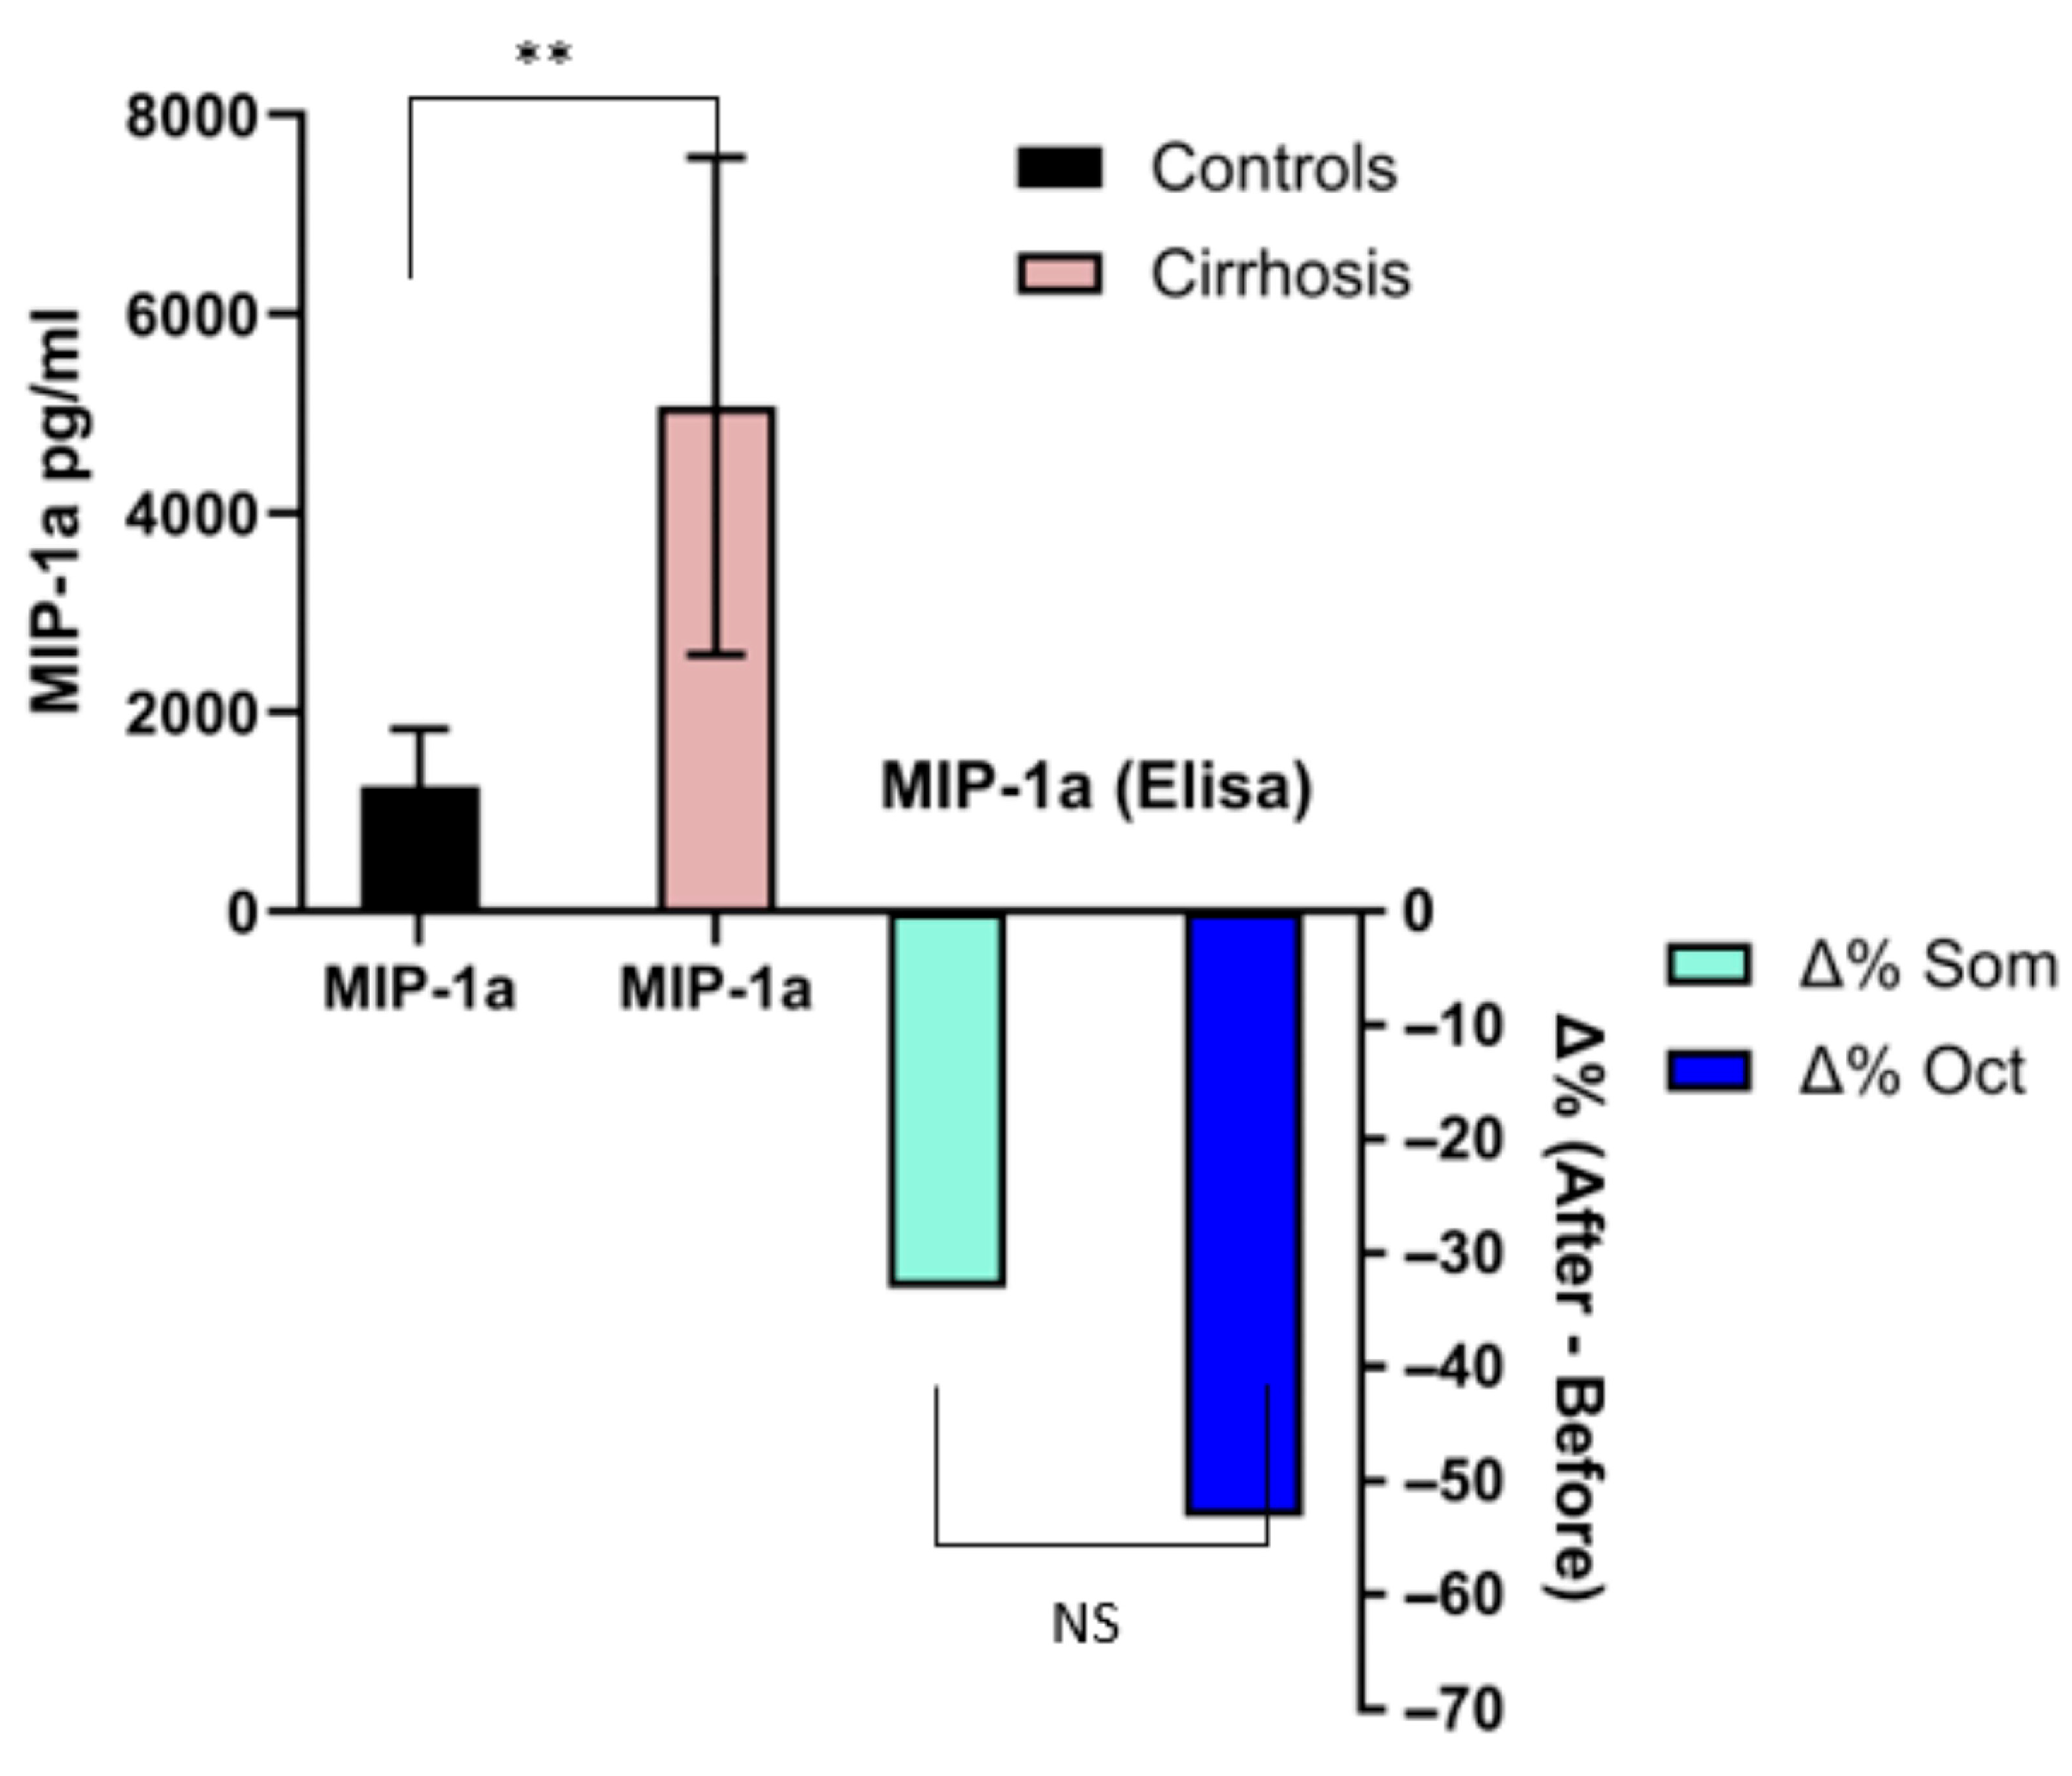
Mean values for the total number of patients with cirrhosis (58) were 5073.3 ± 2494.8 pg/mL. They were significantly higher (p < 0.01) compared to normal controls (1254.4 ± 579.3), with a large effect size (Cohen’s d = 1.8). There was a significant difference (p < 0.01) before (4437.5 ± 1529.4) or after somatostatin administration (2972.6 ± 1437.8), but not before (6031.8 ± 2825.4) or after octreotide administration (5075.2 ± 2796.9, p = 0.13). There was no statistical difference in response between somatostatin and octreotide (p = 0.20) (Figure 10).

3.11. ICAM-1

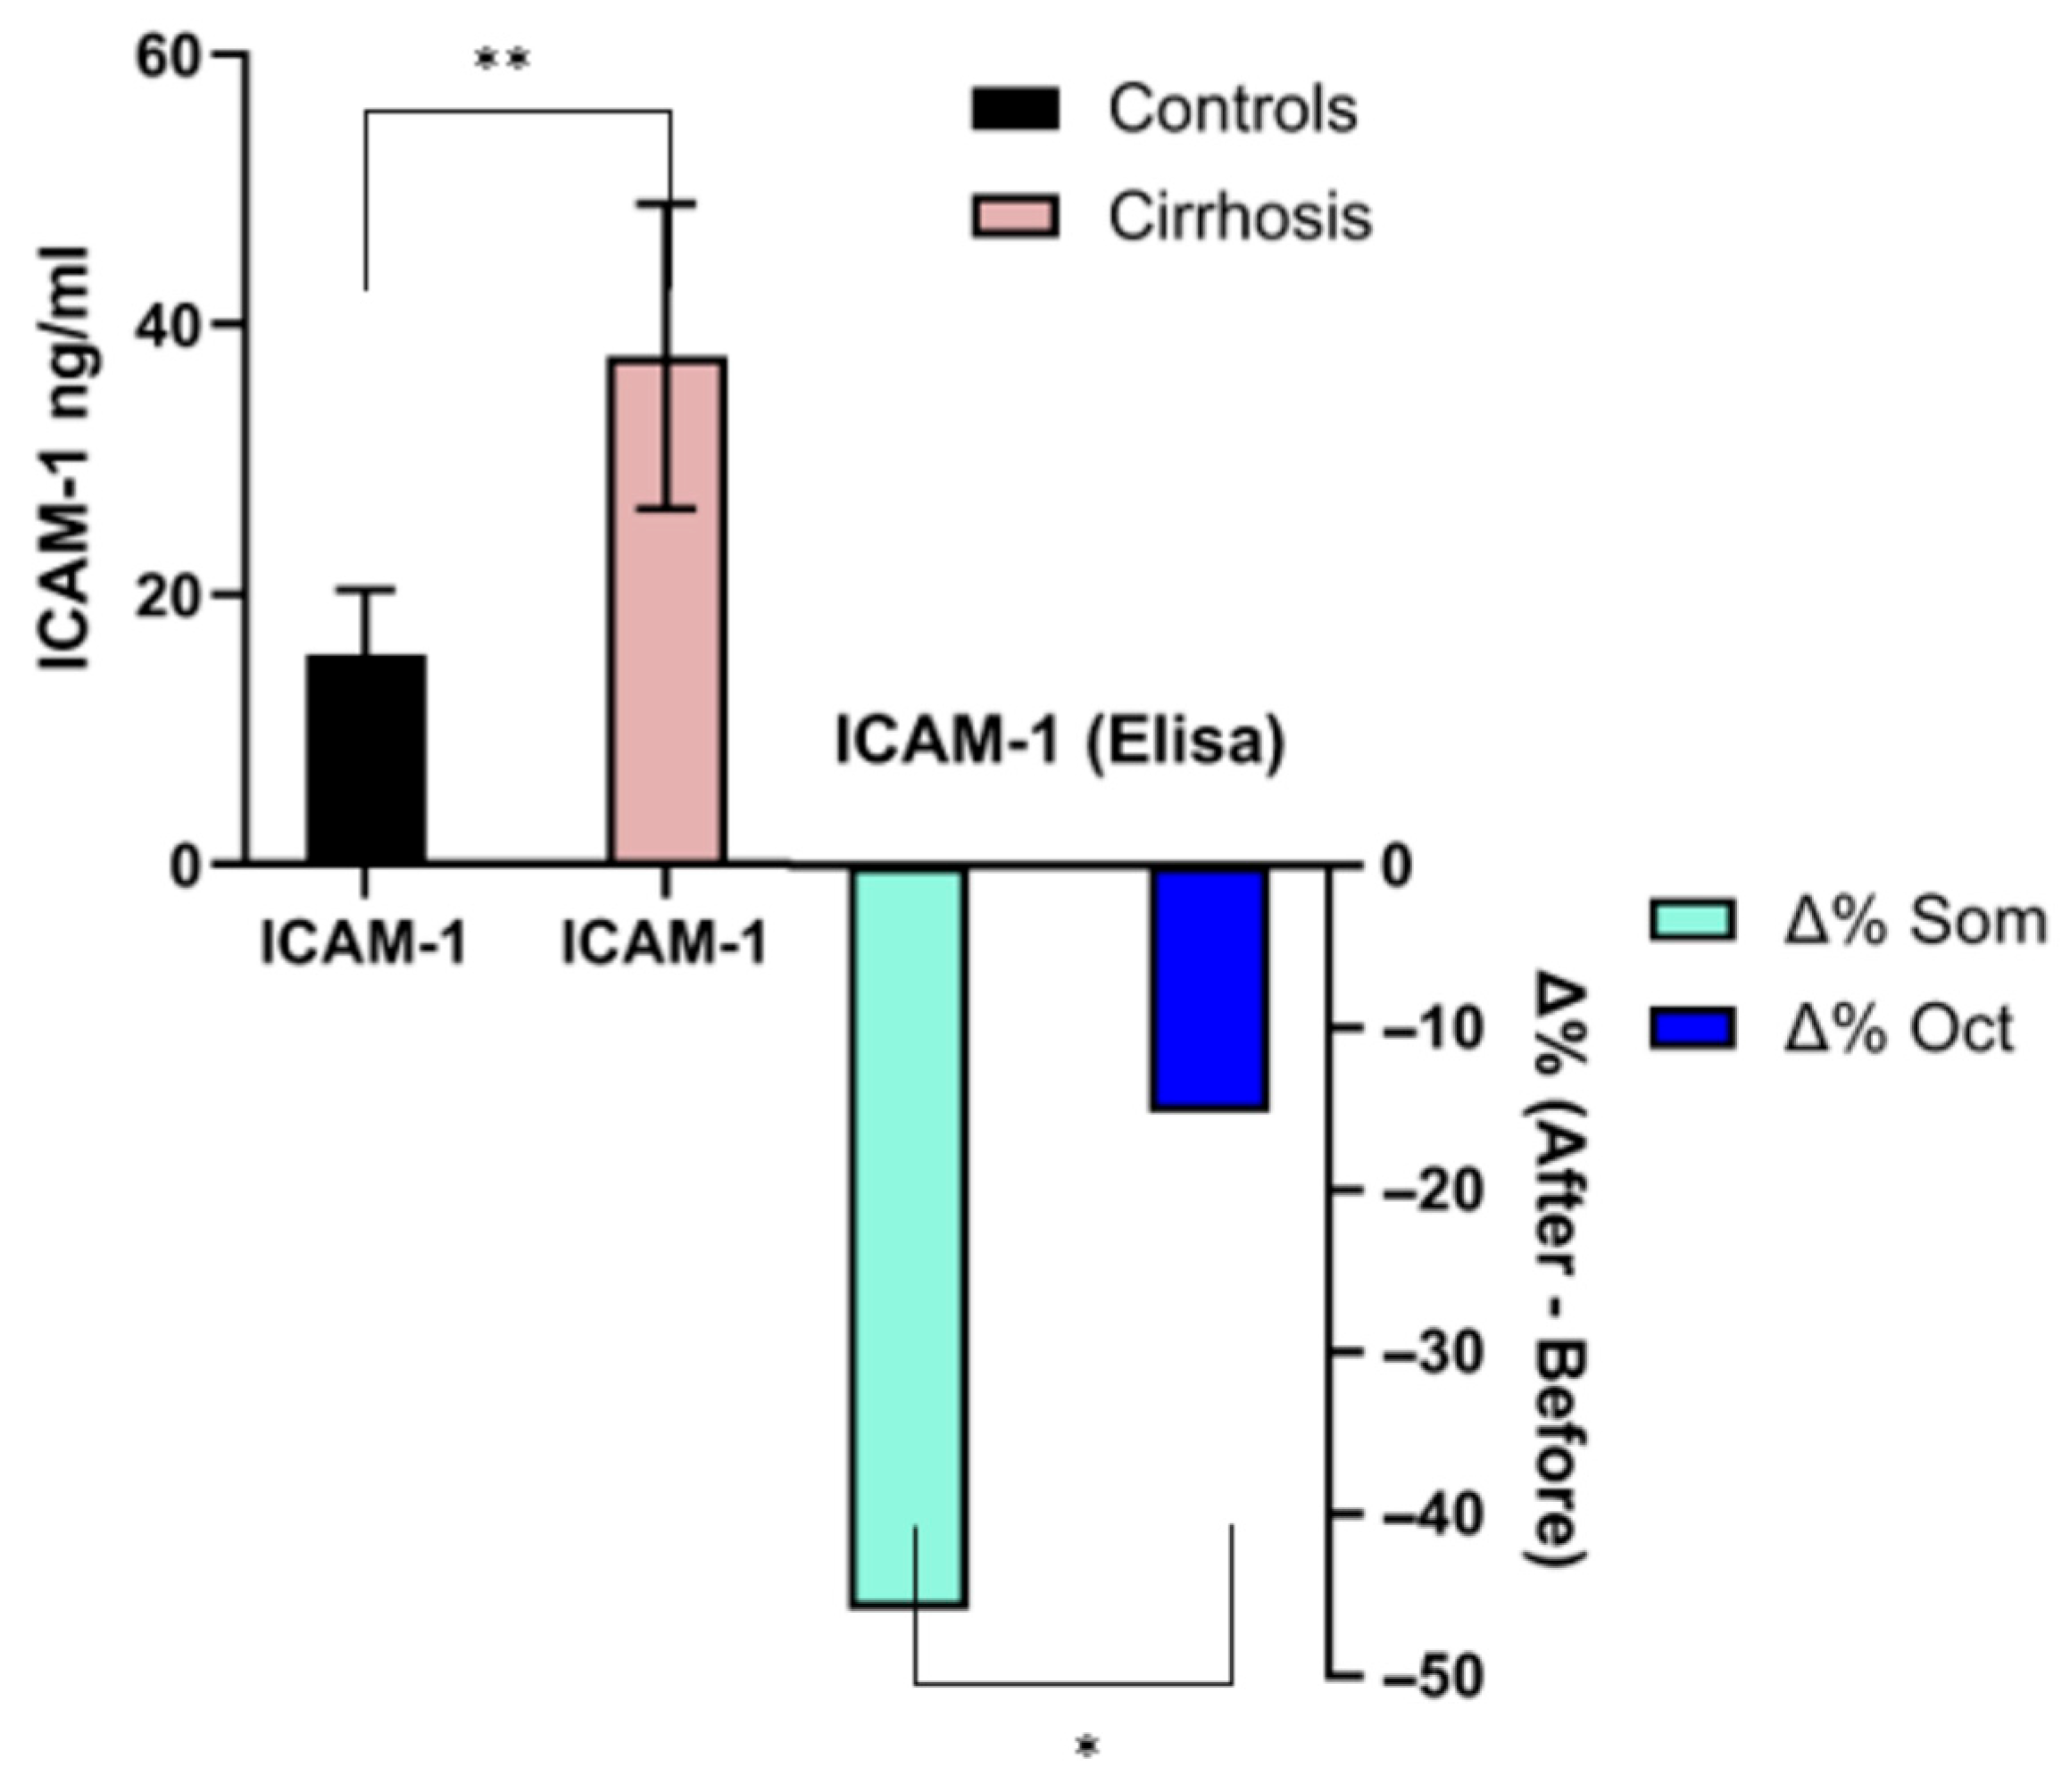
Mean values for the total number of patients with cirrhosis (58) were 37.6 ± 11.3 ng/mL. They were significantly higher (p < 0.01) compared to normal controls (15.5 ± 4.8), with a large effect size (Cohen’s d = 2.2). There was a significant difference (p < 0.01) before (36.2 ± 16.1) or after somatostatin administration (19.6 ± 15.6) but not before (38.2 ± 13.8) or after octreotide administration (32.4 ± 16.1, p = 0.09). There was a significant statistical difference in response between somatostatin and octreotide (p < 0.02), with a large effect size (Cohen’s d = 0.93) (Figure 11).

3.12. TNFα

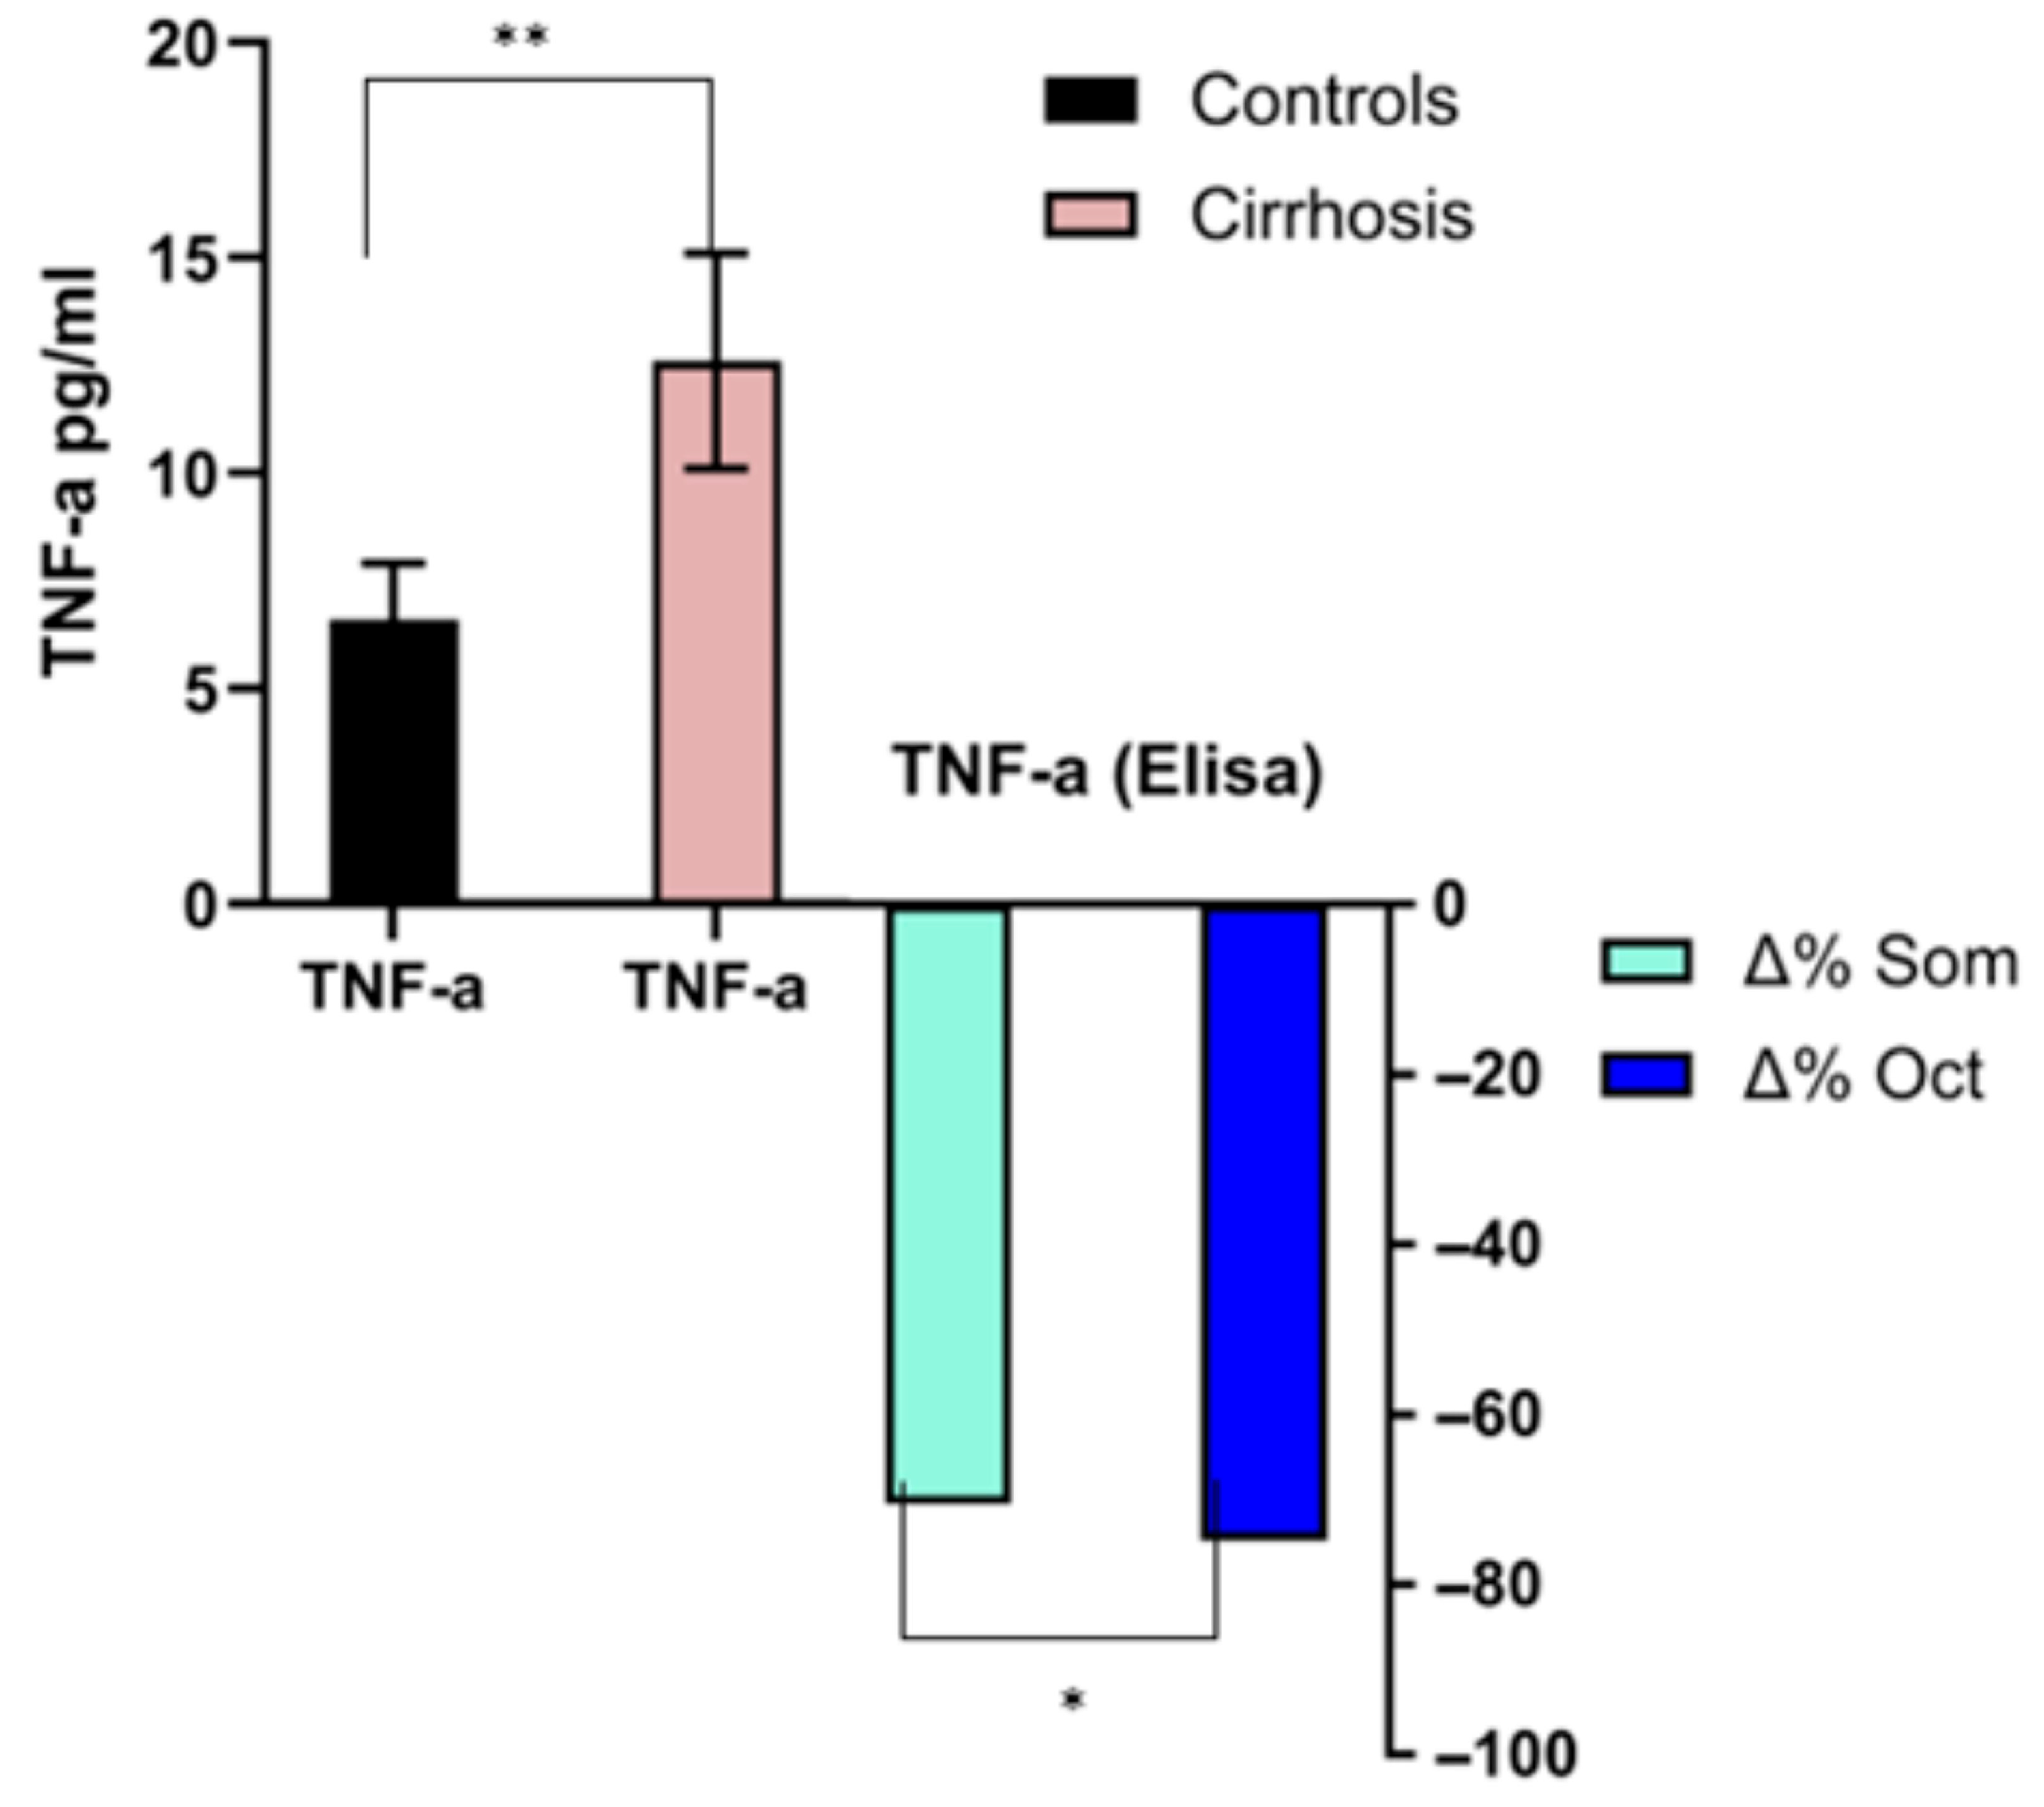
Mean values for the total number of patients with cirrhosis (58) were 12.6 ± 2.5 pg/mL. They were significantly higher (p < 0.01) compared to normal controls (6.6 ± 1.3), with a very large effect size (Cohen’s d = 2.7). There was a significant difference (p < 0.01) before (11.9 ± 1.9) or after somatostatin administration (3.5 ± 0.8) or before (13.1 ± 3.1) or after octreotide administration (3.3 ± 1.1, p < 0.01). There was a statistical difference in response between somatostatin and octreotide (p < 0.03), with a moderate effect size (Cohen’s d = 0.69) (Figure 12).

4. Discussion

This study demonstrated that several factors that are either implicated in ECM degradation or indirectly promote fibrosis through inflammation are deranged in a select group of HCV-related compensated cirrhotic patients. Moreover, short-term administration of either somatostatin or its analog octreotide has a significant effect on these factors. Irrespective of the multiple molecular mechanisms leading to cirrhosis, the final outcome depends on the balance between the production and degradation of ECM [45,46]. It should be noted that all patients responded to treatment, and no other supportive treatment, including blood transfusions, was used. Therefore, the possibility that other confounding factors were responsible for the results is minimal, although it cannot be completely dismissed.
In this study, three of the most important MMPs were studied by immunological ELISA assays. ELISAs can accurately measure the amount of an individual MMP present but often do not distinguish between proenzymes, active enzymes, or inhibitor-complexed enzymes. This is why the active forms of MMP2 and MMP9 were also measured by gel zymography. The two important natural inhibitors of MMPs were also studied, as the enhancement of matrix degradation may be achieved by either reducing the level of TIMPs or by increasing the concentration of MMPs [47]. Interestingly, we found decreased levels of TIMP1 but significantly increased levels of TIMP2. Serum levels of all three MMPs were significantly decreased in compensated cirrhosis compared to healthy controls. Moreover, this was true for both the active forms, MMP2 and MMP9, as measured by zymography and the levels measured by ELISAs.
Earlier results for chronic HCV are conflicting. Variations in circulating and liver MMPs and TIMPs have been attributed to the initiation and progression of fibrosis and cirrhosis [48,49], but the reported results are controversial. In agreement with our findings, MMP-1 was significantly decreased in several studies of either chronic HCV or HBV, particularly in advanced METAVIR stages [50]. MMP-9 levels were decreased in advanced fibrosis in HCV infection, similar to our results [51], but MMP2 was increased [52]. A zymographic study reported that levels of MMP2 and MMP9 were significantly lower in HBV patients compared to patients with chronic HCV [53]. To avoid such differences, we chose only HCV-related cirrhosis in our study. The opposite results have also been reported. A gradual higher expression of MMP-9 was demonstrated in parallel with an increasing degree of liver fibrosis [54]. Also in disagreement with our study, MMP1, MMP2, MMP9 and TIMP1 were increased in chronic HCV. However, in a longitudinal analysis according to fibrosis stage, a non-significant decrease in MMPs was observed in advanced fibrosis, but the discrepancy with our study remained for TIMP1 [55]. In general, levels of MMP1, MMP2 and MMP9 were reported as being increased, reduced or similar to controls [56,57,58,59]. However, it should be noted that in the early stages of liver injury, increased levels of certain MMPs may be related to hepatocyte damage rather than fibrosis [13,60]. This was supported by experimental evidence in a murine model, where deletion of MMP-9 attenuated acute liver injury [61]. An increase in TIMP1 was also found in chronic HCV, particularly in cirrhosis, unlike our findings [62]. By contrast, results for TIMP-2 agree with our findings, as in previous studies, TIMP 2 was uniformly increased with advanced fibrosis [63]. The reason for the discrepancies is not apparent. A possible explanation for the conflicting results is the variability of the assays used and their capability to measure different fractions of MMPs in serum. Inclusion criteria and fibrosis staging could also be additional factors. It should be noted that we used the Ishak classification, which is based on both fibrosis and inflammation. Previous studies classify patients according to fibrosis only. Another, more plausible explanation is that the discrepancies are due to the different fibrosis stages during which the measurements were made, as recently demonstrated. In HCV patients, TIMP1 levels were found to be upregulated in the F0 and F1 fibrotic stages but were downregulated in F2, F3, and F4 compared to normal controls, in agreement with our findings. MMP2 increased in F3-F4 compared to F0, but MMP9 decreased. Interestingly, the assessment of collagenolytic activity by zymography was significantly reduced in F2, F3 and F4 compared to F0 and F1 [64].
However, explanations for the reduced levels of MMPs can only be speculative. They may indicate that KCs are not functioning properly in chronic liver disease. This has been shown in animal experiments, where the production of MMP-9 during fibrosis resolution was significantly reduced after the depletion of KCs [65,66]. In addition, dysregulation of regulatory T cells may affect gelatinases and TIMPs, as shown in a murine model [67]. However, data on humans are missing. MMP-9 and TIMP-1 are expressed in other organs as well. However, due to the fact that no concomitant diseases were present in our patients, it is plausible that the results are due to liver disease only [68].
The effects of somatostatin or octreotide administration showed that there was no effect on the active MMP2 and MMP9, as measured by zymography. The same results were obtained with the MMP9 immuno-assay. By contrast, MMP2 was reduced after somatostatin but not after octreotide when measured by ELISA. MMP1 was significantly reduced after both somatostatin and octreotide. In vitro experiments may form the background for these findings. Experimental in vitro evidence demonstrates that KCs secrete substantial amounts of MMP-1 and MMP9 after lipopolysaccharide stimulation. Octreotide causes an increase in MMP-1 production, but MMP-9 secretion is repressed by octreotide. KCs do not produce MMP-2 [38]. Octreotide has also been reported to affect HSCs in association with the expression of SSTRs. Activated HSCs express SSTR subtypes 1, 2A, 2B, 3 and 4 [69]. It was demonstrated that the effects of octreotide on HSCs were influenced by the cytokine microenvironment, but collagen production was reduced, in agreement with previous results that used natural somatostatin on the same cell line [70].
The effects of somatostatin or octreotide administration may be beneficial in liver fibrosis. MMP-9 is related to the severity of fibrosis, and its downregulation may attenuate fibrosis progression [58,71]. Additionally, active MMP-2 may promote HSC apoptosis in association with decreased levels of TIMP-1 [72,73]. TIMP-1 overexpression, on the other hand, as found in previous reports, will promote fibrosis [74]. Therefore, a reduction in TIMP1, in association with the unaffected levels of active MMP2, as found in the present study, may reduce fibrosis. It has been shown that the administration of synthetic siRNA targeting TIMP-2 attenuates fibrosis by reducing HSC activation and collagen deposition [75]. Therefore, the reduction in TIMP2 caused by somatostatin and octreotide may also attenuate fibrosis progression.
All other factors we measured were significantly dysregulated in compensated cirrhosis. In our study, cirrhotic patients have significantly higher levels of NO, a finding that has also been reported before [76,77] in both compensated and decompensated cirrhosis [78], as well as in patients with hepatocellular carcinoma [79]. By contrast, another study on HCV and HBV patients found reduced serum levels of NO compared to controls [80], but they measured only nitrites and not nitrates.
Interestingly, NO synthesized by eNOS maintains functional homeostasis and prevents activation of HSCs [24]. However, excess NO synthesized by induced iNOS can provoke or exacerbate hepatic pathology [81]. Inhibition of iNOS activity alleviated damage to the liver and kidneys in bile duct-ligated rats in [82]. Apart from effects on liver fibrosis, increased NO levels lead to systemic cardio-vascular changes that initiate a hyperdynamic state in the circulation, characterized by high cardiac output and low peripheral resistance. In portal hypertension, the so-called NO paradox exists, referring to decreased hepatic NO leading to the constriction of the sinusoids and increased NO in the peripheral circulation [21,22]. As a consequence, an increased volume of blood reaches the liver, combined with increased intrahepatic resistance, leading to clinically significant portal hypertension [83]. In our study, both somatostatin and octreotide reduced increased levels of NO. Our findings do not clarify the origin of serum NO in our patients. Therefore, we can only speculate that this reduction could inhibit fibrosis by reducing HSC activation, provided that the increased NO originates from iNOs. On the other hand, increased levels of NO produced by iNOS in KC may be beneficial, as they maintain CD8+ T cell tolerance. Thus, increased autophagy in primary biliary cholangitis (PBC) led to a reduction in iNOS in KCs and the elimination of their suppressive activity against CD8+ T cells, promoting liver disease. Whether this is true for other liver diseases is not known [84]. In summary, therefore, a reduction in NO could be beneficial or detrimental, probably depending on its origin. This point requires further investigation.
TNFα is a critical mediator of liver inflammation and, therefore, an indirect mediator of liver fibrosis as well [85]. HSCs spontaneously secrete TNF-α, which is increased after stimulation with IL-1b and TNFα. Somatostatin suppresses the basic and TNFα-induced production of TNF-α, repressing IL-1b and TNF-α mRNA [40]. In a previous study, octreotide repressed TNFα production from KCs without modifying TNFα mRNA expression [37]. In our study, TNFα was significantly increased in the cirrhosis group compared to controls, and it was profoundly reduced by somatostatin and slightly more reduced by octreotide. This finding suggests that octreotide could be useful in liver diseases with increased inflammation, such as alcoholic hepatitis and viral diseases. Further investigation is required.
There is an association of adhesion molecules, such as ICAM-1, with liver fibrosis. Increased ICAM-1 and VCAM-1 expressions in KCs indicate direct KCs-LSECs communication contributing to hepatic fibrosis [86]. An increase in ICAM-1 in the membrane of LSECs is considered an indication of dysfunctional LSECs [25,27]. In our study, soluble ICAM was significantly increased compared with healthy controls. Previous studies are in agreement with our results. Upregulated expression of ICAM was demonstrated in alcoholic hepatitis [87] and was correlated with poor prognosis [88]. In a study of HBV- and HCV-associated chronic hepatitis and cirrhosis patients, sICAM was increased compared with the controls. Levels were higher in cirrhosis [89]. Additional studies of HCV patients report increased serum levels of sICAM [90,91]. In HCV patients, sICAM-1 levels decreased after 6 months of interferon alpha and ribavirin therapy in contrast to sVCAM-1 levels [92,93]. In our study, somatostatin, but not octreotide, significantly decreased sICAM-1 levels, indicating that it could be used in severe alcoholic hepatitis where a short- term intravenous treatment could be beneficial. Again, further investigation is required.
Chemokines, and in particular RANTES, are additional molecules that are implicated in the induction of liver inflammation and fibrosis in chronic liver diseases [94]. Experimental evidence demonstrated that LPS-stimulated KCs secreted significantly increased amounts of chemokines such as MCP-1 and RANTES. Octreotide inhibited LPS-induced secretion of the CC chemokines MCP-1 and RANTES but not the CXC chemokines [95]. LSECs also secrete RANTES and MCP-1 to promote HSCs activation [24]. Our study was partially compatible with the experimental findings. Somatostatin reduced the levels of RANTES and MIP1a (also a CC chemokine), but octreotide reduced only the levels of RANTES. Differences were also found between RANTES and MIP1a in our patients with cirrhosis. RANTES was reduced, and MIP1a was increased compared to healthy controls. This may be explained by the reported discordance between the levels of RANTES in serum and liver in PBC patients. Hepatic expression of RANTES was increased in patients compared with controls, but it was downregulated in peripheral blood mononuclear cells (PBMCs). This discordance may indicate that RANTES accumulates inside the liver during inflammation [96,97,98], as intrahepatic RANTES was closely associated with the histological activity in HCV [99]. This finding may explain the reduced levels of RANTES we found in this study. Liver damage upregulates the production of inflammatory chemokines from LSECs, including MIP-1α and RANTES, which contribute to fibrosis progression [100].
A limitation of our study is that it reflects serum changes that might be different from the intrahepatic behavior of the same markers.
Finally, our findings demonstrate that somatostatin and octreotide have, in general, the same suppressive effects on fibrosis and inflammation mediators. However, octreotide is frequently slightly less effective than natural somatostatin. Whether this may be important in the clinical setting remains to be investigated, although an earlier study from our unit has shown that natural SST reduces the hepatic venous pressure more effectively compared to octreotide [43]. Moreover, it should be stressed that these results reflect a short-term effect on factors implicated in the process of fibrosis. Whether this may be relevant in the long term as a therapeutic modality in fibrosis requires further investigation, both experimental and clinical.

Author Contributions

Conceptualization: A.V. and E.K. Original draft preparation: A.T., I.T. Statistical analysis: A.T. Laboratory work: C.X. and G.N. Review and editing: A.V., I.T. and E.K. Supervision: G.N. and E.K. All authors have read and agreed to the published version of the manuscript.

Funding

This research received no external funding.

Institutional Review Board Statement

This study was conducted in accordance with the Declaration of Helsinki and approved by the Ethics Committee of the University Hospital of Heraklion, Crete (approval code: 23753 and 836, approval dates 1 August 2025 and 12 August 2025).

Informed Consent Statement

Informed consent was obtained from all subjects involved in the study.

Data Availability Statement

The raw data supporting the conclusions of this article will be made available by the authors upon request.

Conflicts of Interest

The authors declare no conflicts of interest.

References

  1. Wang, F.D.; Zhou, J.; Chen, E.Q. Molecular Mechanisms and Potential New Therapeutic Drugs for Liver Fibrosis. Front. Pharmacol. 2022, 13, 787748. [Google Scholar] [CrossRef] [PubMed]
  2. Ignat, S.R.; Dinescu, S.; Hermenean, A.; Costache, M. Cellular Interplay as a Consequence of Inflammatory Signals Leading to Liver Fibrosis Development. Cells 2020, 9, 461. [Google Scholar] [CrossRef]
  3. Acharya, P.; Chouhan, K.; Weiskirchen, S.; Weiskirchen, R. Cellular Mechanisms of Liver Fibrosis. Front. Pharmacol. 2021, 12, 671640. [Google Scholar] [CrossRef]
  4. Zhou, X.; Liang, Z.; Qin, S.; Ruan, X.; Jiang, H. Serum-derived miR-574-5p-containing exosomes contribute to liver fibrosis by activating hepatic stellate cells. Mol. Biol. Rep. 2022, 49, 1945–1954. [Google Scholar] [CrossRef]
  5. Wei, Y.; Bingyu, W.; Lei, Y.; Xingxing, Y. The antifibrotic role of natural killer cells in liver fibrosis. Exp. Biol. Med. 2022, 247, 1235–1243. [Google Scholar] [CrossRef]
  6. Kisseleva, T.; Brenner, D. Molecular and cellular mechanisms of liver fibrosis and its regression. Nat. Rev. Gastroenterol. Hepatol. 2021, 18, 151–166. [Google Scholar] [CrossRef]
  7. Caligiuri, A.; Gentilini, A.; Pastore, M.; Gitto, S.; Marra, F. Cellular and Molecular Mechanisms Underlying Liver Fibrosis Regression. Cells 2021, 10, 2759. [Google Scholar] [CrossRef] [PubMed]
  8. Visse, R.; Nagase, H. Matrix metalloproteinases and tissue inhibitors of metalloproteinases: Structure, function, and biochemistry. Circ. Res. 2003, 92, 827–839. [Google Scholar] [CrossRef]
  9. Arpino, V.; Brock, M.; Gill, S.E. The role of TIMPs in regulation of extracellular matrix proteolysis. Matrix Biol. 2015, 44–46, 247–254. [Google Scholar] [CrossRef]
  10. Duarte, S.; Baber, J.; Fujii, T.; Coito, A.J. Matrix metalloproteinases in liver injury, repair and fibrosis. Matrix Biol. 2015, 44–46, 147–156. [Google Scholar] [CrossRef] [PubMed]
  11. Roeb, E. Matrix metalloproteinases and liver fibrosis (translational aspects). Matrix Biol. 2018, 68–69, 463–473. [Google Scholar] [CrossRef]
  12. Geervliet, E.; Bansal, R. Matrix Metalloproteinases as Potential Biomarkers and Therapeutic Targets in Liver Diseases. Cells 2020, 9, 1212. [Google Scholar] [CrossRef]
  13. Roderfeld, M. Matrix metalloproteinase functions in hepatic injury and fibrosis. Matrix Biol. 2018, 68–69, 452–462. [Google Scholar] [CrossRef]
  14. Arteel, G.E.; Naba, A. The liver matrisome—Looking beyond collagens. JHEP Rep. 2020, 2, 100115. [Google Scholar] [CrossRef] [PubMed]
  15. Bassiouni, W.; Ali, M.A.M.; Schulz, R. Multifunctional intracellular matrix metalloproteinases: Implications in disease. FEBS J. 2021, 288, 7162–7182. [Google Scholar] [CrossRef]
  16. Mitropoulou, G.; Kompoura, V.; Saffioti, F.; Mavroeidis, V.K. The Role of Matrix Metalloproteinases in Liver Function and Disease. Front. Biosci.-Landmark 2025, 30, 27127. [Google Scholar] [CrossRef]
  17. Charzewski, Ł.; Krzyśko, K.A.; Lesyng, B. Structural characterisation of inhibitory and non-inhibitory MMP-9-TIMP-1 complexes and implications for regulatory mechanisms of MMP-9. Sci. Rep. 2021, 11, 13376. [Google Scholar] [CrossRef] [PubMed]
  18. Murphy, F.R.; Issa, R.; Zhou, X.; Ratnarajah, S.; Nagase, H.; Arthur, M.J.; Benyon, C.; Iredale, J.P. Inhibition of apoptosis of activated hepatic stellate cells by tissue inhibitor of metalloproteinase-1 is mediated via effects on matrix metalloproteinase inhibition: Implications for reversibility of liver fibrosis. J. Biol. Chem. 2002, 277, 11069–11076. [Google Scholar] [CrossRef] [PubMed]
  19. Mónica, F.Z.; Bian, K.; Murad, F. The Endothelium-Dependent Nitric Oxide-cGMP Pathway. Adv. Pharmacol. 2016, 77, 1–27. [Google Scholar] [CrossRef]
  20. Schaffner, D.; Lazaro, A.; Deibert, P.; Hasselblatt, P.; Stoll, P.; Fauth, L.; Baumstark, M.W.; Merfort, I.; Schmitt-Graeff, A.; Kreisel, W. Analysis of the nitric oxide-cyclic guanosine monophosphate pathway in experimental liver cirrhosis suggests phosphodiesterase-5 as potential target to treat portal hypertension. World J. Gastroenterol. 2018, 24, 4356–4368. [Google Scholar] [CrossRef]
  21. Sturm, L.; Bettinger, D.; Roth, L.; Zoldan, K.; Stolz, L.; Gahm, C.; Huber, J.P.; Reincke, M.; Kaeser, R.; Boettler, T.; et al. Plasma Cyclic Guanosine Monophosphate is a Promising Biomarker of Clinically Significant Portal Hypertension in Patients with Liver Cirrhosis. Front. Med. 2022, 8, 803119. [Google Scholar] [CrossRef] [PubMed]
  22. Nesci, A.; Ruggieri, V.; Manilla, V.; Spinelli, I.; Santoro, L.; Di Giorgio, A.; Santoliquido, A.; Ponziani, F.R. Endothelial Dysfunction and Liver Cirrhosis: Unraveling of a Complex Relationship. Int. J. Mol. Sci. 2024, 25, 12859. [Google Scholar] [CrossRef] [PubMed]
  23. Sass, G.; Koerber, K.; Bang, R.; Guehring, H.; Tiegs, G. Inducible nitric oxide synthase is critical for immune-mediated liver injury in mice. J. Clin. Investig. 2001, 107, 439–447. [Google Scholar] [CrossRef] [PubMed]
  24. Lao, Y.; Li, Y.; Zhang, P.; Shao, Q.; Lin, W.; Qiu, B.; Lv, Y.; Tang, L.; Su, S.; Zhang, H.; et al. Targeting Endothelial Erk1/2-Akt Axis as a Regeneration Strategy to Bypass Fibrosis during Chronic Liver Injury in Mice. Mol. Ther. 2018, 26, 2779–2797. [Google Scholar] [CrossRef]
  25. Furuta, K.; Guo, Q.; Pavelko, K.D.; Lee, J.H.; Robertson, K.D.; Nakao, Y.; Melek, J.; Shah, V.H.; Hirsova, P.; Ibrahim, S.H. Lipid-induced endothelial vascular cell adhesion molecule 1 promotes nonalcoholic steatohepatitis pathogenesis. J. Clin. Investig. 2021, 131, e143690. [Google Scholar] [CrossRef]
  26. Mangoni, A.A.; Zinellu, A. A systematic review and meta-analysis of circulating adhesion molecules in rheumatoid arthritis. Inflamm. Res. 2024, 73, 305–327. [Google Scholar] [CrossRef]
  27. Hammoutene, A.; Rautou, P.E. Role of liver sinusoidal endothelial cells in non-alcoholic fatty liver disease. J. Hepatol. 2019, 70, 1278–1291. [Google Scholar] [CrossRef]
  28. Chen, T.; Zhang, H.; Shan, W.; Zhou, J.; You, Y. Liver sinusoidal endothelial cells in hepatic fibrosis: Opportunities for future strategies. Biochem. Biophys. Res. Commun. 2025, 766, 151881. [Google Scholar] [CrossRef]
  29. Qu, J.; Wang, L.; Li, Y.; Li, X. Liver sinusoidal endothelial cell: An important yet often overlooked player in the liver fibrosis. Clin. Mol. Hepatol. 2024, 30, 303–325. [Google Scholar] [CrossRef]
  30. Kusano, F.; Tanaka, Y.; Marumo, F.; Sato, C. Expression of C-C chemokines is associated with portal and periportal inflammation in the liver of patients with chronic hepatitis C. Lab. Investig. 2000, 80, 415–422. [Google Scholar] [CrossRef]
  31. Kirovski, G.; Gäbele, E.; Dorn, C.; Moleda, L.; Niessen, C.; Weiss, T.S.; Wobser, H.; Schacherer, D.; Buechler, C.; Wasmuth, H.E.; et al. Hepatic steatosis causes induction of the chemokine RANTES in the absence of significant hepatic inflammation. Int. J. Clin. Exp. Pathol. 2010, 3, 675–680. [Google Scholar] [PubMed]
  32. Seki, E.; De Minicis, S.; Gwak, G.Y.; Kluwe, J.; Inokuchi, S.; Bursill, C.A.; Llovet, J.M.; Brenner, D.A.; Schwabe, R.F. CCR1 and CCR5 promote hepatic fibrosis in mice. J. Clin. Investig. 2009, 119, 1858–1870. [Google Scholar] [CrossRef] [PubMed]
  33. Berres, M.L.; Koenen, R.R.; Rueland, A.; Zaldivar, M.M.; Heinrichs, D.; Sahin, H.; Schmitz, P.; Streetz, K.L.; Berg, T.; Gassler, N.; et al. Antagonism of the chemokine Ccl5 ameliorates experimental liver fibrosis in mice. J. Clin. Investig. 2010, 120, 4129–4140. [Google Scholar] [CrossRef]
  34. Patel, Y.C. Molecular pharmacology of somatostatin receptor subtypes. J. Endocrinol. Investig. 1997, 20, 348–367. [Google Scholar] [CrossRef]
  35. Kouroumalis, E.; Tsomidis, I.; Voumvouraki, A. Is There a Place for Somatostatin Analogues for the Systemic Treatment of Hepatocellular Carcinoma in the Immunotherapy Era? Livers 2022, 2, 315–335. [Google Scholar] [CrossRef]
  36. Zhang, C.; An, R.; Bao, Y.W.; Meng, X.M.; Wang, T.Q.; Sun, H.N.; Pan, F.M.; Zhang, C. Inhibitory effects of octreotide on the progression of hepatic fibrosis via the regulation of Bcl-2/Bax and PI3K/AKT signaling pathways. Int. Immunopharmacol. 2019, 73, 515–526. [Google Scholar] [CrossRef]
  37. Valatas, V.; Kolios, G.; Manousou, P.; Xidakis, C.; Notas, G.; Ljumovic, D.; Kouroumalis, E.A. Secretion of inflammatory mediators by isolated rat Kupffer cells: The effect of octreotide. Regul. Pept. 2004, 120, 215–225. [Google Scholar] [CrossRef]
  38. Xidakis, C.; Ljumovic, D.; Manousou, P.; Notas, G.; Valatas, V.; Kolios, G.; Kouroumalis, E. Production of pro- and anti-fibrotic agents by rat Kupffer cells; the effect of octreotide. Dig. Dis. Sci. 2005, 50, 935–941. [Google Scholar] [CrossRef] [PubMed]
  39. Pintér, E.; Helyes, Z.; Szolcsányi, J. Inhibitory effect of somatostatin on inflammation and nociception. Pharmacol. Ther. 2006, 112, 440–456. [Google Scholar] [CrossRef]
  40. Lang, A.; Sakhnini, E.; Fidder, H.H.; Maor, Y.; Bar-Meir, S.; Chowers, Y. Somatostatin inhibits pro-inflammatory cytokine secretion from rat hepatic stellate cells. Liver Int. 2005, 25, 808–816. [Google Scholar] [CrossRef]
  41. Kouroumalis, E.A.; Koutroubakis, I.E.; Manousos, O.N. Somatostatin for acute severe bleeding from portal hypertensive gastropathy. Eur. J. Gastroenterol. Hepatol. 1998, 10, 509–512. [Google Scholar] [CrossRef]
  42. D’Amico, G.; Bernardi, M.; Angeli, P. Towards a new definition of decompensated cirrhosis. J. Hepatol. 2022, 76, 202–207. [Google Scholar] [CrossRef]
  43. Matrella, E.; Valatas, V.; Notas, G.; Roumpaki, H.; Xidakis, C.; Hadzidakis, A.; Mouzas, I.; Kouroumalis, E. Bolus somatostatin but not octreotide reduces hepatic sinusoidal pressure by a NO-independent mechanism in chronic liver disease. Aliment. Pharmacol. Ther. 2001, 15, 857–864. [Google Scholar] [CrossRef][Green Version]
  44. Koulentaki, M.; Valatas, V.; Xidakis, K.; Kouroumalis, A.; Petinaki, E.; Castanas, E.; Kouroumalis, E. Matrix metalloproteinases and their inhibitors in acute viral hepatitis. J. Viral Hepat. 2002, 9, 189–193. [Google Scholar] [CrossRef] [PubMed]
  45. Reungoat, E.; Grigorov, B.; Zoulim, F.; Pécheur, E.I. Molecular Crosstalk between the Hepatitis C Virus and the Extracellular Matrix in Liver Fibrogenesis and Early Carcinogenesis. Cancers 2021, 13, 2270. [Google Scholar] [CrossRef]
  46. Parola, M.; Pinzani, M. Liver fibrosis: Pathophysiology, pathogenetic targets and clinical issues. Mol. Aspects Med. 2019, 65, 37–55. [Google Scholar] [CrossRef] [PubMed]
  47. Zhao, X.; Chen, J.; Sun, H.; Zhang, Y.; Zou, D. New insights into fibrosis from the ECM degradation perspective: The macrophage-MMP-ECM interaction. Cell Biosci. 2022, 12, 117. [Google Scholar] [CrossRef]
  48. Bruno, C.M.; Valenti, M.; Bertino, G.; Ardiri, A.; Consolo, M.; Mazzarino, C.M.; Amoroso, A.; Neri, S. Altered pattern of circulating matrix metalloproteinases -2, -9 and tissue inhibitor of metalloproteinase-2 in patients with HCV-related chronic hepatitis. Relationship to histological features. Panminerva Med. 2009, 51, 191–196. [Google Scholar] [PubMed]
  49. Lichtinghagen, R.; Bahr, M.J.; Wehmeier, M.; Michels, D.; Haberkorn, C.I.; Arndt, B.; Flemming, P.; Manns, M.P.; Boeker, K.H. Expression and coordinated regulation of matrix metalloproteinases in chronic hepatitis C and hepatitis C virus-induced liver cirrhosis. Clin. Sci. 2003, 105, 373–382. [Google Scholar] [CrossRef]
  50. Attallah, A.M.; El-Far, M.; Abdel Malak, C.A.; Omran, M.M.; Farid, K.; Hussien, M.A.; Albannan, M.S.; Attallah, A.A.; Elbendary, M.S.; Elbesh, D.A.; et al. Fibro-check: A combination of direct and indirect markers for liver fibrosis staging in chronic hepatitis C patients. Ann. Hepatol. 2015, 14, 225–233. [Google Scholar] [CrossRef]
  51. Liu, C.H.; Liu, C.J.; Hong, C.M.; Su, T.H.; Yang, H.C.; Chen, K.M.; Huang, Y.P.; Yeh, Y.M.; Tien, H.L.; Liu, Y.C.; et al. A noninvasive diagnosis of hepatic fibrosis by BioFibroScore® in chronic hepatitis C patients. J. Gastroenterol. Hepatol. 2018, 33, 291–297. [Google Scholar] [CrossRef]
  52. Leroy, V.; Monier, F.; Bottari, S.; Trocme, C.; Sturm, N.; Hilleret, M.N.; Morel, F.; Zarski, J.P. Circulating matrix metalloproteinases 1, 2, 9 and their inhibitors TIMP-1 and TIMP-2 as serum markers of liver fibrosis in patients with chronic hepatitis C: Comparison with PIIINP and hyaluronic acid. Am. J. Gastroenterol. 2004, 99, 271–279. [Google Scholar] [CrossRef] [PubMed]
  53. Kuo, W.H.; Chou, F.P.; Lu, S.C.; Chu, S.C.; Hsieh, Y.S. Significant differences in serum activities of matrix metalloproteinase-2 and -9 between HCV- and HBV-infected patients and carriers. Clin. Chim. Acta 2000, 294, 157–168. [Google Scholar] [CrossRef]
  54. Li, Y.; Liu, H.; Xu, L. Expression of MMP-9 in different degrees of chronic hepatitis B and its correlation with inflammation. Exp. Ther. Med. 2018, 16, 4136–4140. [Google Scholar] [CrossRef] [PubMed]
  55. Latronico, T.; Mascia, C.; Pati, I.; Zuccala, P.; Mengoni, F.; Marocco, R.; Tieghi, T.; Belvisi, V.; Lichtner, M.; Vullo, V.; et al. Liver Fibrosis in HCV Monoinfected and HIV/HCV Coinfected Patients: Dysregulation of Matrix Metalloproteinases (MMPs) and Their Tissue Inhibitors TIMPs and Effect of HCV Protease Inhibitors. Int. J. Mol. Sci. 2016, 17, 455. [Google Scholar] [CrossRef]
  56. Schulze-Krebs, A.; Preimel, D.; Popov, Y.; Bartenschlager, R.; Lohmann, V.; Pinzani, M.; Schuppan, D. Hepatitis C virus-replicating hepatocytes induce fibrogenic activation of hepatic stellate cells. Gastroenterology 2005, 129, 246–258. [Google Scholar] [CrossRef] [PubMed]
  57. Attallah, A.M.; El-Far, M.; Ghaly, M.F.; Omran, M.M.; Albannan, M.S.; Attallah, A.A.; Shoghey, T.M.; Atrees, M.M.; Elbendary, M.S.; Farid, K. Circulating levels of collagen III and MMP-1 in patients with chronic hepatitis C co-infected with hepatitis B virus. Br. J. Biomed. Sci. 2017, 74, 95–100. [Google Scholar] [CrossRef]
  58. Medeiros, T.; Saraiva, G.N.; Moraes, L.A.; Gomes, A.C.; Lacerda, G.S.; Leite, P.E.; Esberard, E.B.; Andrade, T.G.; Xavier, A.R.; Quírico-Santos, T.; et al. Liver fibrosis improvement in chronic hepatitis C after direct acting-antivirals is accompanied by reduced profibrogenic biomarkers-a role for MMP-9/TIMP-1. Dig. Liver Dis. 2020, 52, 1170–1177. [Google Scholar] [CrossRef]
  59. Prystupa, A.; Szpetnar, M.; Boguszewska-Czubara, A.; Grzybowski, A.; Sak, J.; Załuska, W. Activity of MMP1 and MMP13 and amino acid metabolism in patients with alcoholic liver cirrhosis. Med. Sci. Monit. 2015, 21, 1008–1014. [Google Scholar] [CrossRef][Green Version]
  60. Sabir, U.; Gu, H.M.; Zhang, D.W. Extracellular matrix turnover: Phytochemicals target and modulate the dual role of matrix metalloproteinases (MMPs) in liver fibrosis. Phytother. Res. 2023, 37, 4932–4962. [Google Scholar] [CrossRef]
  61. Wang, Q.; Liu, X.; Zhang, J.; Lu, L.; Feng, M.; Wang, J. Dynamic features of liver fibrogenesis and fibrosis resolution in the absence of matrix metalloproteinase-9. Mol. Med. Rep. 2019, 20, 5239–5248. [Google Scholar] [CrossRef]
  62. Badra, G.; Lotfy, M.; El-Refaie, A.; Obada, M.; Abdelmonem, E.; Kandeel, S.; Fathy, A. Significance of serum matrix metalloproteinase-9 and tissue inhibitor of metalloproteinase-1 in chronic hepatitis C patients. Acta Microbiol. Immunol. Hung. 2010, 57, 29–42. [Google Scholar] [CrossRef]
  63. Liang, B.; Li, Y.; Zhao, A.; Xie, F.; Guo, Z. Clinical utility of serum matrix metalloproteinase-2 and tissue inhibitor of metalloproteinase-2 concentrations in the assessment of liver fibrosis due to chronic hepatitis B. J. Int. Med. Res. 2012, 40, 631–639. [Google Scholar] [CrossRef]
  64. Martinez-Castillo, M.; Hernandez-Barragan, A.; Flores-Vasconcelos, I.; Galicia-Moreno, M.; Rosique-Oramas, D.; Perez-Hernandez, J.L.; Higuera-De la Tijera, F.; Montalvo-Jave, E.E.; Torre-Delgadillo, A.; Cordero-Perez, P.; et al. Production and activity of matrix metalloproteinases during liver fibrosis progression of chronic hepatitis C patients. World J. Hepatol. 2021, 13, 218–232. [Google Scholar] [CrossRef]
  65. Feng, M.; Ding, J.; Wang, M.; Zhang, J.; Zhu, X.; Guan, W. Kupffer-derived matrix metalloproteinase-9 contributes to liver fibrosis resolution. Int. J. Biol. Sci. 2018, 14, 1033–1040. [Google Scholar] [CrossRef]
  66. Kasahara, A.; Hayashi, N.; Mochizuki, K.; Oshita, M.; Katayama, K.; Kato, M.; Masuzawa, M.; Yoshihara, H.; Naito, M.; Miyamoto, T.; et al. Circulating matrix metalloproteinase-2 and tissue inhibitor of metalloproteinase-1 as serum markers of fibrosis in patients with chronic hepatitis C. Relationship to interferon response. J. Hepatol. 1997, 26, 574–583. [Google Scholar] [CrossRef] [PubMed]
  67. Zhang, X.; Feng, M.; Liu, X.; Bai, L.; Kong, M.; Chen, Y.; Zheng, S.; Liu, S.; Wan, Y.J.; Duan, Z.; et al. Persistence of cirrhosis is maintained by intrahepatic regulatory T cells that inhibit fibrosis resolution by regulating the balance of tissue inhibitors of metalloproteinases and matrix metalloproteinases. Transl. Res. 2016, 169, 67–79.e1–2. [Google Scholar] [CrossRef]
  68. Cabral-Pacheco, G.A.; Garza-Veloz, I.; Castruita-De la Rosa, C.; Ramirez-Acuña, J.M.; Perez-Romero, B.A.; Guerrero-Rodriguez, J.F.; Martinez-Avila, N.; Martinez-Fierro, M.L. The Roles of Matrix Metalloproteinases and Their Inhibitors in Human Diseases. Int. J. Mol. Sci. 2020, 21, 9739. [Google Scholar] [CrossRef] [PubMed]
  69. Klironomos, S.; Notas, G.; Sfakianaki, O.; Kiagiadaki, F.; Xidakis, C.; Kouroumalis, E. Octreotide modulates the effects on fibrosis of TNF-α, TGF-β and PDGF in activated rat hepatic stellate cells. Regul. Pept. 2014, 188, 5–12. [Google Scholar] [CrossRef] [PubMed]
  70. Reynaert, H.; Rombouts, K.; Jia, Y.; Urbain, D.; Chatterjee, N.; Uyama, N.; Geerts, A. Somatostatin at nanomolar concentration reduces collagen I and III synthesis by, but not proliferation of activated rat hepatic stellate cells. Br. J. Pharmacol. 2005, 146, 77–88. [Google Scholar] [CrossRef]
  71. Saffioti, F.; Pinzani, M. Development and Regression of Cirrhosis. Dig. Dis. 2016, 34, 374–381. [Google Scholar] [CrossRef] [PubMed]
  72. Ramachandran, P.; Iredale, J.P. Liver fibrosis: A bidirectional model of fibrogenesis and resolution. QJM 2012, 105, 813–817. [Google Scholar] [CrossRef] [PubMed]
  73. Hartland, S.N.; Murphy, F.; Aucott, R.L.; Abergel, A.; Zhou, X.; Waung, J.; Patel, N.; Bradshaw, C.; Collins, J.; Mann, D.; et al. Active matrix metalloproteinase-2 promotes apoptosis of hepatic stellate cells via the cleavage of cellular N-cadherin. Liver Int. 2009, 29, 966–978. [Google Scholar] [CrossRef]
  74. Yoshiji, H.; Kuriyama, S.; Yoshii, J.; Ikenaka, Y.; Noguchi, R.; Nakatani, T.; Tsujinoue, H.; Yanase, K.; Namisaki, T.; Imazu, H.; et al. Tissue inhibitor of metalloproteinases-1 attenuates spontaneous liver fibrosis resolution in the transgenic mouse. Hepatology 2002, 36, 850–860. [Google Scholar] [CrossRef]
  75. Hu, Y.B.; Li, D.G.; Lu, H.M. Modified synthetic siRNA targeting tissue inhibitor of metalloproteinase-2 inhibits hepatic fibrogenesis in rats. J. Gene Med. 2007, 9, 217–229. [Google Scholar] [CrossRef]
  76. Arkenau, H.T.; Stichtenoth, D.O.; Frölich, J.C.; Manns, M.P.; Böker, K.H. Elevated nitric oxide levels in patients with chronic liver disease and cirrhosis correlate with disease stage and parameters of hyperdynamic circulation. Z Gastroenterol. 2002, 40, 907–913. [Google Scholar] [CrossRef]
  77. Albornoz, L.; Motta, A.; Alvarez, D.; Estevez, A.; Bandi, J.C.; McCormack, L.; Matera, J.; Bonofiglio, C.; Ciardullo, M.; De Santibañes, E.; et al. Nitric oxide synthase activity in the splanchnic vasculature of patients with cirrhosis: Relationship with hemodynamic disturbances. J. Hepatol. 2001, 35, 452–456. [Google Scholar] [CrossRef] [PubMed]
  78. Genesca, J.; Gonzalez, A.; Segura, R.; Catalan, R.; Marti, R.; Varela, E.; Cadelina, G.; Martinez, M.; Lopez-Talavera, J.C.; Esteban, R.; et al. Interleukin-6, nitric oxide, and the clinical and hemodynamic alterations of patients with liver cirrhosis. Am. J. Gastroenterol. 1999, 94, 169–177. [Google Scholar] [CrossRef]
  79. Moriyama, A.; Masumoto, A.; Nanri, H.; Tabaru, A.; Unoki, H.; Imoto, I.; Ikeda, M.; Otsuki, M. High plasma concentrations of nitrite/nitrate in patients with hepatocellular carcinoma. Am. J. Gastroenterol. 1997, 92, 1520–1523. [Google Scholar] [PubMed]
  80. Amaro, M.J.; Bartolomé, J.; Pardo, M.; Cotonat, T.; López-Farré, A.; Carreño, V. Decreased nitric oxide production in chronic viral hepatitis B and C. J. Med. Virol. 1997, 51, 326–331. [Google Scholar] [CrossRef]
  81. Iwakiri, Y.; Kim, M.Y. Nitric oxide in liver diseases. Trends Pharmacol. Sci. 2015, 36, 524–536. [Google Scholar] [CrossRef]
  82. Mahmoud, M.F.; Zakaria, S.; Fahmy, A. Can Chronic Nitric Oxide Inhibition Improve Liver and Renal Dysfunction in Bile Duct Ligated Rats? Adv. Pharmacol. Sci. 2015, 2015, 298792. [Google Scholar] [CrossRef]
  83. Bitto, N.; Ghigliazza, G.; Lavorato, S.; Caputo, C.; La Mura, V. Improving Management of Portal Hypertension: The Potential Benefit of Non-Etiological Therapies in Cirrhosis. J. Clin. Med. 2023, 12, 934. [Google Scholar] [CrossRef]
  84. Luo, P.Y.; Ma, M.; Liu, M.C.; Wu, Y.H.; Long, J.; Huang, M.X.; Yang, S.Y.; Da, T.T.; Tsuneyama, K.; Li, Q.; et al. Autophagy of Kupffer cells modulates CD8+ T cell activation in primary biliary cholangitis. Gut 2025, gutjnl-2025-335611. [Google Scholar] [CrossRef]
  85. Huyghe, J.; Priem, D.; Bertrand, M.J.M. Cell death checkpoints in the TNF pathway. Trends Immunol. 2023, 44, 628–643. [Google Scholar] [CrossRef]
  86. Kohara, S.; Ogawa, K. Eph/Ephrin Promotes the Adhesion of Liver Tissue-Resident Macrophages to a Mimicked Surface of Liver Sinusoidal Endothelial Cells. Biomedicines 2022, 10, 3234. [Google Scholar] [CrossRef] [PubMed]
  87. Xia, Y.; Yang, J.; Sanyal, A.J.; Shah, V.H.; Chalasani, N.P.; Yu, Q.; Zheng, X.; Li, W. Persistent Hyperactivation of Endothelial Cells in Patients with Alcoholic Hepatitis. Alcohol. Clin. Exp. Res. 2020, 44, 1075–1087. [Google Scholar] [CrossRef] [PubMed]
  88. Blaya, D.; Rubio-Tomás, T.; Rodrigo-Torres, D.; Lozano, J.; Coll, M.; Argemi, J.; Altamirano, J.; Affò, S.; Morales-Ibanez, O.; Gratacós-Ginès, J.; et al. Endothelial dysfunction markers predict short-term mortality in patients with severe alcoholic hepatitis. Hepatol. Int. 2021, 15, 1006–1017. [Google Scholar] [CrossRef] [PubMed]
  89. Bruno, C.M.; Sciacca, C.; Cilio, D.; Bertino, G.; Marchese, A.E.; Politi, G.; Chinnici, L. Circulating adhesion molecules in patients with virus-related chronic diseases of the liver. World J. Gastroenterol. 2005, 11, 4566–4569. [Google Scholar] [CrossRef]
  90. El-Bassiouni, N.E.; Mahmoud, O.M.; El Ahwani, E.G.; Ibrahim, R.A.; El Bassiouny, A.E. Monocyte adhesion molecules expression in patients with chronic hepatitis C liver disease. Mediterr. J. Hematol. Infect. Dis. 2013, 5, e2013054. [Google Scholar] [CrossRef]
  91. Dri, E.; Lampas, E.; Lazaros, G.; Lazarou, E.; Theofilis, P.; Tsioufis, C.; Tousoulis, D. Inflammatory Mediators of Endothelial Dysfunction. Life 2023, 13, 1420. [Google Scholar] [CrossRef]
  92. Dejica, D.; Grigorescu, M.; Dejica, V.; Radu, C.; Neculoiu, D. Serum levels of soluble intercellular-1 and vascular cell-1 adhesion molecules in chronic hepatitis C and the influence of interferon-alpha + ribavirin therapy. Rom. J. Gastroenterol. 2002, 11, 277–283. [Google Scholar]
  93. Radu, C.; Dejica, D.; Grigorescu, M.; Zaharie, T.; Neculoiu, D. Correlation of sICAM-1 and sVCAM-1 level with biochemical, histological and viral findings in chronic hepatitis C after interferon-alpha + ribavirin therapy. Rom. J. Gastroenterol. 2003, 12, 91–95. [Google Scholar] [PubMed]
  94. Nagata, N.; Chen, G.; Xu, L.; Ando, H. An Update on the Chemokine System in the Development of NAFLD. Medicina 2022, 58, 761. [Google Scholar] [CrossRef]
  95. Valatas, V.; Kolios, G.; Manousou, P.; Notas, G.; Xidakis, C.; Diamantis, I.; Kouroumalis, E. Octreotide regulates CC but not CXC LPS-induced chemokine secretion in rat Kupffer cells. Br. J. Pharmacol. 2004, 141, 477–487. [Google Scholar] [CrossRef]
  96. Nischalke, H.D.; Nattermann, J.; Fischer, H.P.; Sauerbruch, T.; Spengler, U.; Dumoulin, F.L. Semiquantitative analysis of intrahepatic CC-chemokine mRNas in chronic hepatitis C. Mediat. Inflamm. 2004, 13, 357–359. [Google Scholar] [CrossRef]
  97. Zhang, L.; Ma, D.; Li, X.; Deng, C.; Shi, Q.; You, X.; Leng, X.; Li, M.; Tang, F.; Zhang, F.; et al. Gene expression profiles of peripheral blood mononuclear cells in primary biliary cirrhosis. Clin. Exp. Med. 2014, 14, 409–416. [Google Scholar] [CrossRef]
  98. Dong, X.; Yu, X.; Li, H.; Kang, H. Identification of Marker Genes and Pathways in Patients with Primary Biliary Cholangitis. J. Comput. Biol. 2020, 27, 923–933. [Google Scholar] [CrossRef]
  99. Apolinario, A.; Majano, P.L.; Alvarez-Pérez, E.; Saez, A.; Lozano, C.; Vargas, J.; García-Monzón, C. Increased expression of T cell chemokines and their receptors in chronic hepatitis C: Relationship with the histological activity of liver disease. Am. J. Gastroenterol. 2002, 97, 2861–2870. [Google Scholar] [CrossRef] [PubMed]
  100. Connolly, M.K.; Bedrosian, A.S.; Malhotra, A.; Henning, J.R.; Ibrahim, J.; Vera, V.; Cieza-Rubio, N.E.; Hassan, B.U.; Pachter, H.L.; Cohen, S.; et al. In hepatic fibrosis, liver sinusoidal endothelial cells acquire enhanced immunogenicity. J. Immunol. 2010, 185, 2200–2208. [Google Scholar] [CrossRef] [PubMed]
Figure 1. (Left) Zymography. Baseline serum levels of MMP2 in cirrhotic patients (58) and healthy controls (29) before treatment. Serum levels are presented as mean ± Standard Deviation. (Right) Effect of somatostatin (29 patients) and octreotide administration (29 patients) on the serum levels of MMP2. Sample sizes are similar in all subsequent figures. Bars represent the difference (Δ) between pre-treatment and post-treatment levels. ** p < 0.01.
Livers 06 00016 g001
Figure 2. (Left) ELISA. Baseline serum concentrations of MMP2 in cirrhotic patients (58) and healthy controls (29) before treatment. Serum levels are presented as mean ± Standard Deviation. (Right) Effect of somatostatin and octreotide administration on the serum levels of MMP2. Bars represent the difference (Δ) between pre-treatment and post-treatment levels. * p < 0.05.
Livers 06 00016 g002
Figure 3. (Left) Zymography. Baseline serum levels of MMP9 in cirrhotic patients (58) and healthy controls (29) before treatment. Serum levels are presented as mean ± Standard Deviation. (Right) Effect of somatostatin and octreotide administration on the serum levels of MMP9. Bars represent the difference (Δ) between pre-treatment and post-treatment levels. ** p < 0.01.
Livers 06 00016 g003
Figure 4. (Left) ELISA. Baseline serum concentrations of MMP2 in cirrhotic patients (58) and healthy controls (29) before treatment. Serum levels are presented as mean ± Standard Deviation. (Right) Effect of somatostatin and octreotide administration on the serum levels of MMP9. Bars represent the difference (Δ) between pre-treatment and post-treatment levels. ** p < 0.01.
Livers 06 00016 g004
Figure 5. (Left) Baseline serum concentrations of MMP1 in cirrhotic patients (58) and healthy controls (29) before treatment. Serum levels are presented as mean ± Standard Deviation. (Right) Effect of somatostatin and octreotide administration on the serum levels of MMP1. Bars represent the difference (Δ) between pre-treatment and post-treatment levels. ** p < 0.01.
Livers 06 00016 g005
Figure 6. (Left) Baseline serum concentrations of TIMP1 in cirrhotic patients (58) and healthy controls (29) before treatment. Serum levels are presented as mean ± Standard Deviation. (Right) Effect of somatostatin and octreotide administration on the serum levels of TIMP1. Bars represent the difference (Δ) between pre-treatment and post-treatment levels. * p < 0.05, ** p < 0.01.
Livers 06 00016 g006
Figure 7. (Left) Baseline serum concentrations of TIMP2 in cirrhotic patients (58) and healthy controls (29) before treatment. Serum levels are presented as mean ± Standard Deviation. (Right) Effect of somatostatin and octreotide administration on the serum levels of TIMP2. Bars represent the difference (Δ) between pre-treatment and post-treatment levels. ** p < 0.01.
Livers 06 00016 g007
Figure 8. (Left) Baseline serum concentrations of NO in cirrhotic patients (58) and healthy controls (29) before treatment. Serum levels are presented as mean ± Standard Deviation. (Right) Effect of somatostatin and octreotide administration on the serum levels of NO. Bars represent the difference (Δ) between pre-treatment and post-treatment levels. ** p < 0.01.
Livers 06 00016 g008
Figure 9. (Left) Baseline serum concentrations of RANTES (CCL5) in cirrhotic patients (58) and healthy controls (29) before treatment. Serum levels are presented as mean ± Standard Deviation. (Right) Effect of somatostatin and octreotide administration on the serum levels of RANTES. Bars represent the difference (Δ) between pre-treatment and post-treatment levels. ** p < 0.01.
Livers 06 00016 g009
Figure 10. (Left) Baseline serum concentrations of MIP1a (CCL3) in cirrhotic patients (58) and healthy controls (29) before treatment. Serum levels are presented as mean ± Standard Deviation. (Right) Effect of somatostatin and octreotide administration on the serum levels of MIP1a. Bars represent the difference (Δ) between pre-treatment and post-treatment levels. ** p < 0.01.
Livers 06 00016 g010
Figure 11. (Left) Baseline serum concentrations of sICAM-1 in cirrhotic patients (58) and healthy controls (29) before treatment. Serum levels are presented as mean ± Standard Deviation. (Right) Effect of somatostatin and octreotide administration on the serum levels of sICAM-1. Bars represent the difference (Δ) between pre-treatment and post-treatment levels. * p < 0.05, ** p < 0.01.
Livers 06 00016 g011
Figure 12. (Left) Baseline serum concentrations of TNFα in cirrhotic patients (58) and healthy controls (29) before treatment. Serum levels are presented as mean ± Standard Deviation. (Right) Effect of somatostatin and octreotide administration on the serum levels of TNFα. Bars represent the difference (Δ) between pre-treatment and post-treatment levels. * p < 0.05, ** p < 0.01.
Livers 06 00016 g012
Table 1. Demographics of patients.
SomatostatinOctreotideControls
Number292929
Age range42–6438–6740–61
Sex(male/female)18/2920/2920–29
Esophageal varices22/2923/29
Child–Pugh score (A/B/C)8/21/06/23
MELD15 ± 616 ± 2
INR2.1 ± 0.71.9 ± 1.1
Bil (mg/dL)1.8 ± 0.72.1 ± 0.4
PLT (K/μL)115 ± 43130 ± 52
SGPT (UI/L)92 ± 4579 ± 28
Disclaimer/Publisher’s Note: The statements, opinions and data contained in all publications are solely those of the individual author(s) and contributor(s) and not of MDPI and/or the editor(s). MDPI and/or the editor(s) disclaim responsibility for any injury to people or property resulting from any ideas, methods, instructions or products referred to in the content.