Article

Elevated Serum Adiponectin Levels in Primary Sclerosing Cholangitis (PSC) Compared to Inflammatory Bowel Disease (IBD): A Potential Biomarker for PSC-IBD Screening


Department of Internal Medicine I, Gastroenterology, Hepatology, Endocrinology, Rheumatology, and Infectious Diseases, University Hospital Regensburg, 93053 Regensburg, Germany
*
Author to whom correspondence should be addressed.
Livers 2026, 6(2), 15; https://doi.org/10.3390/livers6020015
Submission received: 8 January 2026 / Revised: 29 January 2026 / Accepted: 24 February 2026 / Published: 27 February 2026

Abstract

Background/Objectives: Systemic levels of the adipokine adiponectin are elevated in chronic liver disease including primary sclerosing cholangitis (PSC). Inflammatory bowel disease (IBD) and PSC are closely associated diseases, but in IBD serum adiponectin levels are near normal. Urinary and fecal biomarkers have been suggested to be superior to the corresponding serum protein for disease diagnosis, but urinary and fecal adiponectin have not been analyzed in PSC. The aim of this study was to evaluate the adiponectin in human serum, urine, and feces as a potential diagnostic tool for PSC. Methods: Serum and urine samples were collected from 74 IBD patients, 40 PSC patients (35 patients with PSC and IBD (16 patients for urine) and 5 patients with PSC without underlying IBD), and 17 controls. Feces samples from 53 IBD patients and 11 PSC patients (8 of them with PSC-IBD) were available for this study. Adiponectin levels were analyzed by enzyme-linked immunosorbent assay. Results: Urinary and serum adiponectin levels in IBD patients and controls were comparable. Urinary, fecal and serum adiponectin in patients with ulcerative colitis and Crohn’s disease were similar and did not change, even with higher fecal calprotectin, a marker of intestinal inflammation in IBD. The three IBD patients with a high Gastrointestinal Symptom Rating Scale score as a marker for clinical activity had highly elevated urinary adiponectin. Systemic adiponectin levels were significantly elevated in the PSC-IBD cohort relative to the IBD-only group, suggesting its potential utility in clinical screening. Urinary and fecal adiponectin levels were similar between the cohorts. In PSC/PSC-IBD, serum adiponectin did not increase with higher fibrosis scores. Serum, urine, and fecal adiponectin were not correlated in both patient cohorts, except for a negative association of fecal and urine adiponectin in PSC. Conclusions: This exploratory study revealed preliminary findings suggesting an association between urinary adiponectin and severe gastrointestinal symptoms in IBD. In PSC-IBD, serum adiponectin is higher compared to IBD patients and continuous measurement may be used for PSC-IBD screening.

1. Introduction

Inflammatory bowel disease (IBD), encompassing Crohn’s disease (CD) and ulcerative colitis (UC), refers to a persistent inflammatory condition of the large and small bowel that is increasingly prevalent [1,2,3,4]. Primary sclerosing cholangitis (PSC) is a severe liver disease involving the inflammation, progressive fibrosis, and destruction of the biliary tree, causing obstruction and secondary liver cirrhosis [5]. PSC often coexists with IBD, predominantly UC. The exact molecular and immunological causes of both IBD and PSC remain largely unidentified, and intensive research is underway to understand the underlying pathophysiological mechanisms [6,7].
Adiponectin is classified as an adipokine. This protein protects against insulin resistance, type 2 diabetes, and liver injury. Adiponectin also has properties related to the regulation of the immune system [8,9,10,11]. Adiponectin is reduced in the bloodstream of obese patients, and increased visceral fat mass is the main cause of hypoadiponectinemia [12]. Higher visceral fat mass has been associated with reduced levels of systemic adiponectin and increased levels of fecal calprotectin [13]. Calprotectin in stool is a biomarker of intestinal inflammation, indicating a potential anti-inflammatory effect of adiponectin in intestinal inflammation [13,14].
However, the role of adiponectin in IBD remains controversial. Fayad et al. provided evidence for the pro-inflammatory role of adiponectin in both dextran sulphate sodium (DSS)- and trinitrobenzene sulphonic acid (TNBS)-induced colitis [15]. In DSS-induced colitis, adiponectin deficiency protected against colonic fibrosis [16]. This is consistent with the positive correlation between colonic tissue adiponectin and the expression of fibrosis markers in UC patients [16]. Conversely, Nishihara et al. showed a protective role of adiponectin in the DSS model [17]. Sideri et al. observed more severe colitis when adiponectin receptor 1 was knocked out in the colon of TNBS-treated mice [18]. Consistent with this study, Obeid et al. reported that adiponectin protects against DSS colitis via the adiponectin receptor 1 [19].
Creeping fat, a hallmark of CD, consists of mesenteric adipose tissue that migrates towards the inflamed intestinal segments. The mucosa-associated gut bacterium Clostridium innocuum stimulates adipogenesis and the growth of this adipose tissue, which is supposed to limit the access of bacteria to the bloodstream [20]. Adiponectin secretion of creeping fat is upregulated when compared to the non-creeping fat of CD patients, mesenteric fat from colon cancer patients and patients with diverticulitis [21].
However, systemic adiponectin levels are not significantly different in IBD patients compared to healthy controls. Patients with UC were shown to have higher serum adiponectin levels compared to patients with CD, although levels in both disease entities were similar to those of healthy controls [22].
Fecal biomarkers have become valuable tools in the diagnosis and assessment of treatment response in IBD. Fecal calprotectin is commonly used to measure intestinal inflammation and predicts disease recurrence in clinical settings [23,24]. This biomarker is released by granulocytes and is therefore associated with intestinal inflammation. Its presence is not an exclusive indicator of IBD [25,26]. In addition to fecal calprotectin, serum calprotectin levels also increase in patients with active IBD. Serum calprotectin is more closely associated with systemic than intestinal inflammation markers [27], and is also induced in the serum of patients with infectious diseases [28]. Higher levels have also been reported in patients with liver cirrhosis [29].
In the search for additional stool biomarkers of IBD, fecal adiponectin has been identified to discriminate between IBD patients and controls. Fecal adiponectin had high specificity but low sensitivity for the diagnosis of UC and CD because it is related to mucosal inflammation but not to the disease entities themselves. Validation via the stool of pediatric patients with IBD and healthy controls did not reveal any significant differences between the cohorts [30].
Adiponectin can be detected in feces and urine indicating both renal and biliary excretion [31]. Patients with renal dysfunction have increased urinary and circulating adiponectin. The source of the higher urinary adiponectin is still unclear, but cannot be explained solely by the increase in blood adiponectin levels [31]. Patients with chronic liver disease have consistently been found to have significantly increased systemic adiponectin levels [32,33]. The reasons for this increase are still under discussion, with the possible involvement of impaired biliary excretion as one of the pathological factors under consideration [32].
PSC must be understood as a chronic progressive bile duct disease. This rare disease accounted for 15% of liver transplants in Nordic countries from 1982 to 2013 [34]. Between 15 and 20% of patients experience a recurrence of PSC in the transplanted liver [35]. A causal therapy is not yet available [36]. A recent study by Wittek et al. found that inflammation of the colon mucosa could be detected at the molecular level in almost all patients with PSC [37]. The recommended diagnostic test for PSC is magnetic resonance cholangiopancreatography [38]. It is notable that the serum adiponectin levels of patients with PSC are significantly higher than those of healthy controls [39].
Autoantibodies are commonly found in individuals with PSC. Anti-nuclear antibodies have been reported in up to 77% of patients, smooth muscle antibodies in up to 83%, and anti-neutrophil cytoplasmic antibodies in up to 96%. However, these antibodies are not recommended for the diagnosis of PSC [38]. Antibodies to Saccharomyces cerevisiae have been detected in patients with PSC, but they are also present in individuals with other autoimmune liver diseases, such as autoimmune hepatitis and primary biliary cholangitis [40]. These autoantibodies were also detected in patients with IBD and are highly prevalent in patients with coeliac disease [41]. The diagnostic and prognostic values of more recently described autoantibodies, including immunoglobulin A anti-gliadin antibodies, anti-F-actin antibodies, anti-glycoprotein 2, and anti-neutrophil cytoplasmic antibodies to serine proteinase 3 have to be evaluated in larger cohorts [42,43]. The same applies to anti-integrin αvβ6 autoantibodies, which have been found to be highly specific for PSC diagnosis [44]. Currently, no serological biomarkers are available for the early detection and prognosis of PSC. Although clinical studies have analyzed biomarkers of different cellular origins with the potential to diagnose PSC and predict its clinical course, none of them are ready for use in clinical practice [45].
PSC is closely associated with IBD, a disease in which adiponectin levels are likely to be normal [22]. Chronic liver injury in PSC is characterized by high adiponectin levels compared to healthy controls [22,39]. Patients with autoimmune or biliary liver disease had higher serum adiponectin levels compared to patients with viral or alcoholic liver diseases [39]. The fact that adiponectin levels are normal in IBD patients [22] and strongly increased in PSC patients [39] suggests that serum adiponectin levels may be useful in discriminating between the two conditions. The main aim of the current study was therefore to investigate whether serum, and possibly urine and/or fecal adiponectin, have the potential to become non-invasive diagnostic biomarkers for PSC-IBD.

2. Materials and Methods

2.1. Patients

Patients were recruited from the inpatient and outpatient clinic of a German university hospital from 6 December 2021 to 31 March 2023. Only patients able to give informed consent were included in the study. PSC was diagnosed in patients with elevated cholestatic liver enzymes and typical imaging via liver ultrasound, magnetic resonance cholangiopancreaticography (MRCP) and/or endoscopic retrograde cholangiopancreaticography (ERCP). Causes for secondary sclerosing cholangitis, such as those that are chronic obstructive, ischemic, infectious, immune-mediated, hereditary, and related to toxic conditions, were ruled out in advance using laboratory testing, autoimmune markers, and, in some patients, liver biopsies and genetic analyses [38]. The diagnosis of IBD was based on typical clinical findings such as abdominal pain, diarrhea, and elevated stool frequency, as well as on laboratory tests including C-reactive protein, white blood cell count, and fecal calprotectin. Patients underwent abdominal ultrasound, endoscopy of the upper and lower gastrointestinal tracts with staged biopsies, and, in some patients, additional magnetic resonance imaging of the small intestine. Patients with a confirmed diagnosis of UC or CD were subsumed under the term IBD. Other causes for intestinal inflammations such as infectious causes (including clostridium difficile and cytomegalus virus), toxic, ischemic or other immune-mediated conditions were ruled out [46,47].
Pregnancy and known coagulopathy were the exclusion criteria. Patients with cholangiocarcinoma were not included in this analysis.
Moreover, the serum and urine of 17 healthy controls were collected. The controls comprised hospital staff, students, and the spouses of the patients. The 17 healthy controls were matched for sex and age, and all had a normal body mass index.
All the patients with PSC were treated with ursodeoxycholic acid. Patients with IBD were treated with corticosteroids (19 patients), mesalazine (20 patients), anti-interleukin 12/23 antibody therapy (18 patients), antitumor necrosis factor antibodies (22 patients), and azathioprine (8 patients).

2.2. ELISA and Measurement of Urinary Protein Levels

ELISA, used to measure human adiponectin in serum and feces, was obtained from R&D Systems (Wiesbaden, Nordenstadt, Germany; Cat # DY1065). For serum, the intra-assay coefficient of variation (CV) was <6% and the inter-assay CV < 11%. R&D Systems lists 31 papers that have used this assay for human plasma and 26 that have used it for human serum.
Feces were homogenized in phosphate-buffered saline; this solvent is supposed to be suitable for analysis by the adiponectin ELISA. For the feces, the intra-assay CV was <10%. The inter-assay CV was determined from five fecal samples measured on two plates and was 8.5%. Serum was diluted 1:500 fold for analysis, and feces was used undiluted.
Urinary adiponectin was measured in undiluted urine by an ELISA from Enzo Life Sciences GmbH (ALX-850-377-KI01; Lörrach, Germany). This test is suitable for urinary adiponectin analysis according to the manufacturer’s information. The intra-assay CV is <5% and the inter-assay CV < 6.5%, and these data are provided by the company. The intra-assay CV was <10% for our analysis. There are only a few studies on urinary adiponectin, and levels of 1 to 10 ng/mg creatinine have been reported [48,49], which are comparable to our analysis.
Creatinine in urine was measured by the creatinine parameter assay kit (Cat. No.: KGE005; R&D Systems) in 1:20 fold diluted urine. Urinary adiponectin relative to urinary creatinine was used for the calculations. Serum calprotectin (dilution 1:100) was determined using the IDK® Calprotectin ELISA kit (Immundiagnostik AG, Bensheim, Germany; Cat # K 6935). The intra-assay CV is <4% and the inter-assay CV ≤ 9%, and these data are provided by the company.
Pierce™ BCA Protein Assay Kit (Cat # 23225, Thermo Fisher Scientific, Waltham, MA, USA) was used to determine the urinary protein concentration using 1:10 diluted spot urine samples from our patients and controls.
Each urine, feces or serum sample was measured twice, and the mean value was used for further calculations.
The technician performing the ELISA assays and Pierce™ BCA Protein Assay was blinded to the clinical data of the samples.

2.3. Isolation of Fecal Protein and Collection of Urine

Fecal samples were collected by the patients on the day of their hospital visit. Fecal protein homogenates were prepared as described [50]. Feces (0.5 to 2.0 g) were homogenized in phosphate-buffered saline supplemented with protease inhibitor (Protease Inhibitor Cocktail cOmplete™ EDTA-free, Roche Diagnostics, Penzberg, Germany), in gentleMACS M-tubes by the gentleMACS Dissociator (Miltenyi Biotec, Bergisch Gladbach, Germany). One mL aliquots were dried in a vacuum concentrator overnight. The homogenate was dissolved in phosphate-buffered saline with protease inhibitor to 2 mg dry weight/mL, and stored at −80 °C. Urine was collected in tubes, aliquoted into appropriate portions and stored at −80 °C.

2.4. Statistical Analysis

The data are presented as boxplots (minimum, maximum, first and third quartiles, and the median). The Mann–Whitney U-test, receiver operating characteristic curve, and Kruskal–Wallis test, as well as the Spearman correlation (IBM SPSS Statistics 26.0, released by IBM Corp., Armonk, NY, USA in 2019) were used for analysis, and a value of p < 0.05 was regarded significant.

3. Results

3.1. Study Cohorts

This study included 17 healthy controls, 74 patients with IBD (22 patients with ulcerative colitis (UC), and 52 patients with Crohn’s disease (CD)), 35 patients with PSC-IBD, and 5 patients with PSC. The details of the cohorts are given in Table 1. The controls, IBD patients, and PSC-IBD patients were comparable in terms of age and sex. The PSC patients were older than patients with PSC-IBD. IBD, PSC-IBD, and PSC patients had a similar body mass index (BMI), C-reactive protein level (CRP), creatinine level, and glomerular filtration rate (GFR). The fecal calprotectin present in patients with IBD and PSC-IBD was similar (Table 1). The aspartate aminotransferase (AST), alanine aminotransferase (ALT), gamma glutamyltransferase (gamma GT), alkaline phosphatase (AP), and bilirubin levels of PSC-IBD patients were higher compared to those of patients with IBD. The bilirubin, AP, and gamma GT levels of patients with PSC were higher compared to patients with IBD. The model for end-stage liver disease (MELD) score was only documented for the PSC and PSC-IBD patients, and did not differ between these groups (Table 1).
Serum calprotectin levels were higher in patients with PSC-IBD than in patients with IBD or controls, whose levels were similar (Table 1). The area under the receiver operating characteristic curve (AUROC) to discriminate IBD from PSC-IBD was 0.700 ± 0.060, p = 0.001. In patients with IBD, serum calprotectin levels positively correlated with fecal calprotectin levels (r = 0.460, p < 0.001) and C-reactive protein (CRP) (r = 0.646, p < 0.001).
IBD patients with fecal calprotectin levels > 500 µg/g had higher serum calprotectin levels than controls (p = 0.002) and IBD patients with normal fecal calprotectin levels (<50 µg/g; p = 0.002).

3.2. Adiponectin of IBD, PSC-IBD, and PSC Patients and Controls

Consistently with previous reports [22], serum adiponectin levels in CD (4.0 (1.2–15.3) µg/mL) and UC (3.5 (1.6–23.8) µg/mL) patients were comparable to healthy controls (3.3 (1.2–5.1) µg/mL; p = 0.194). Patients with CD and UC had a comparable BMI (p = 0.508), and CRP (p = 0.557), fecal calprotectin (p = 0.275), and serum calprotectin level (p = 0.443). However, there were more males in the UC cohort (p = 0.045).
The BMI of the control group was not documented in this study (Table 1). In a different control group comprising 12 females and 14 males with a median age of 55 years, serum adiponectin was 3.5 (1.5–18.5) µg/mL and BMI was 25.4 (18.0–38.1) [51]. The BMI and serum adiponectin levels of this cohort [51] were similar to those of the patients analyzed in the current study (p > 0.05). However, urine from the control subjects with known BMI had not been collected.
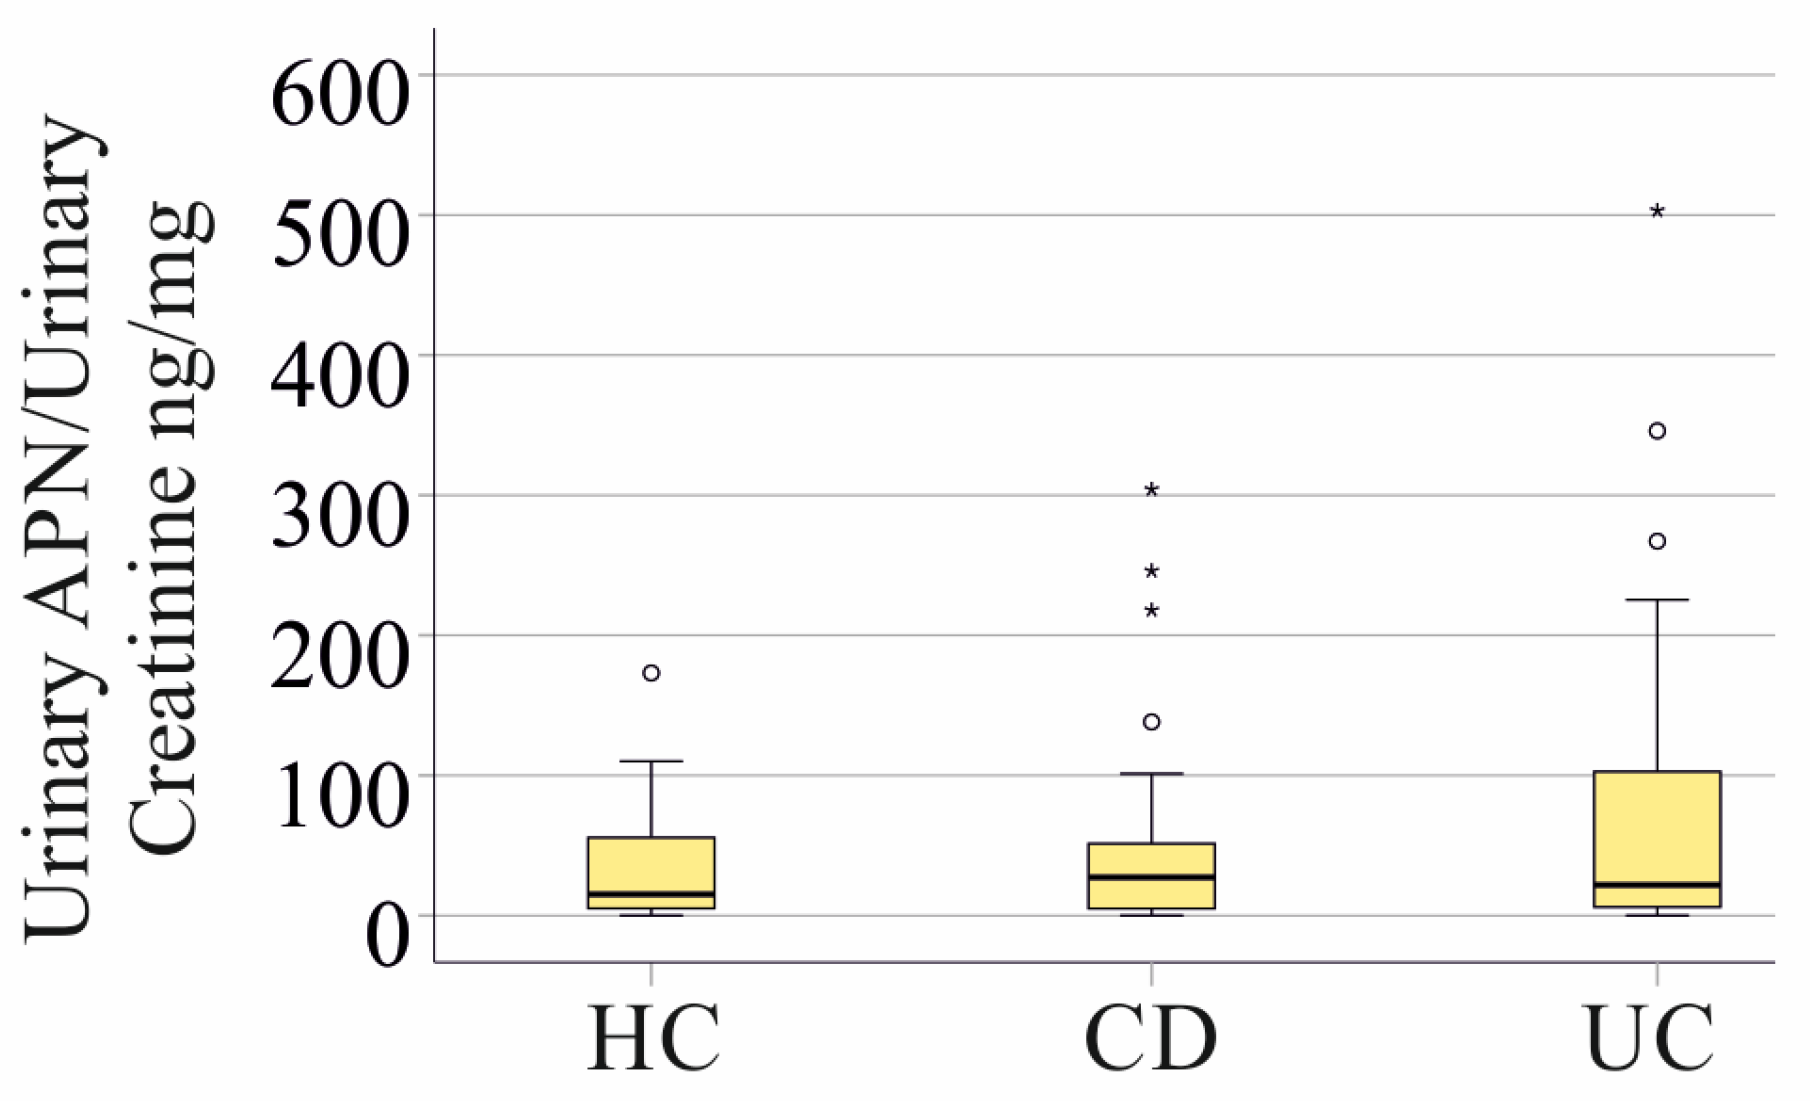
Urinary adiponectin was measured in 74 patients with IBD, 16 patients with PSC-IBD, 5 patients with PSC, and 17 controls. The details of these cohorts are summarized in Table S1. Urinary adiponectin normalized to urinary creatinine (p = 0.422) did not differ between healthy controls, patients with CD, or UC (Figure 1).
The adiponectin in the serum of controls was 3.3 (1.2–5.1) µg/mL, approximately 3000-fold higher than in urine, where the concentration was 0.9 (0.5–21.5) ng/mL.
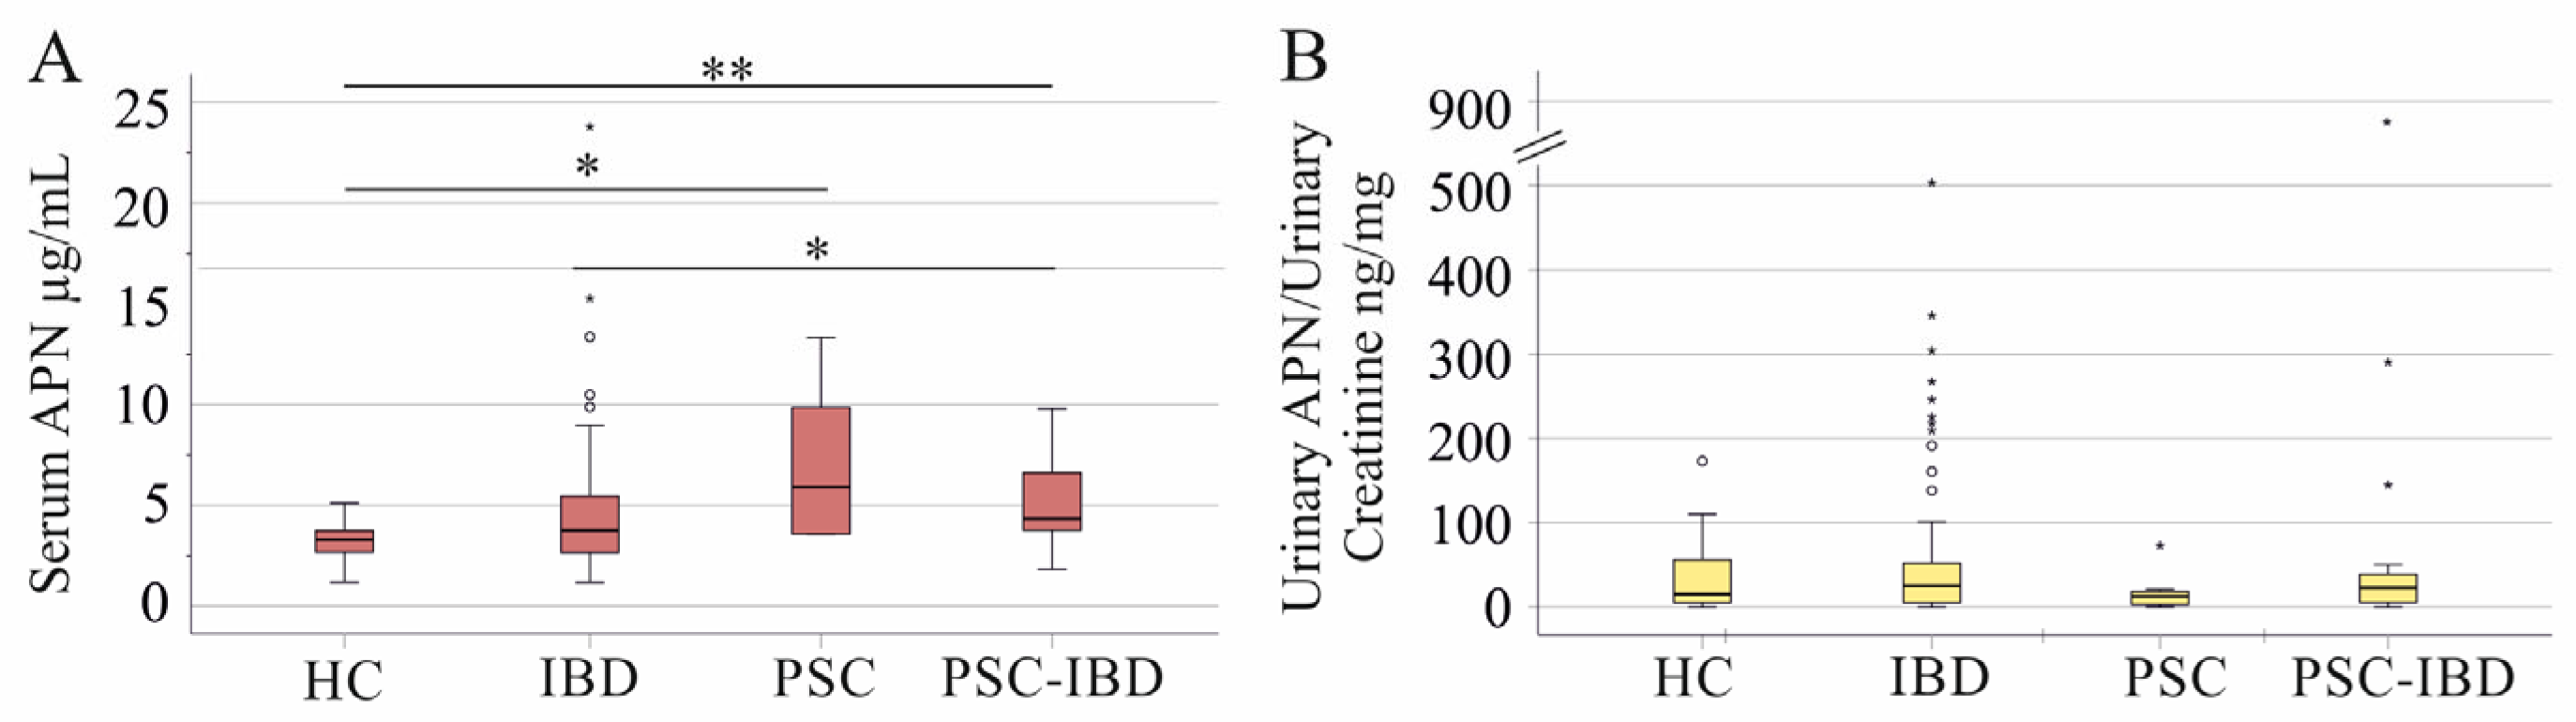
The patients with PSC and those with PSC-IBD had a higher serum adiponectin level compared to healthy controls (p = 0.014 and p = 0.002, respectively). The serum adiponectin of patients with PSC-IBD was higher compared to patients with IBD (p = 0.024) (Figure 2A). The area under the ROC curve for discrimination between IBD and PSC-IBD was 0.629 ± 0.053 (p = 0.015). Serum adiponectin levels of 2.9 µg/mL discriminate patients with IBD from patients with PSC-IBD with a sensitivity of 97% and a specificity of 35%.
Urinary adiponectin was similar in patients with IBD, PSC, and PSC-IBD, and the healthy controls (p = 0.581) (Figure 2B).
Urinary and serum adiponectin levels were not correlated. The Spearman correlation coefficient of IBD patients was r = 0.201, p = 0.087, and that of PSC-IBD patients was r = 0.190, p = 0.410; for the controls, it was r = 0.077, p = 0.768.

3.3. Adiponectin in Relation to Sex, Age, BMI, Laboratory Measures of Liver and Kidney Function, and Fecal Calprotectin

A sex-specific analysis showed that in IBD, females had higher serum adiponectin (p = 0.025) whereas urinary adiponectin (p = 0.287) was similar between males and females. Sex differences were not significant in PSC-IBD patients for serum (p = 0.052) and for urinary adiponectin (p = 0.610) and controls (p = 0.625 for serum and p = 0.283 for urine).
In IBD, serum and urine adiponectin did not correlate with age, BMI, CRP, AST, ALT, bilirubin, or serum calprotectin. In IBD, serum and urine adiponectin were negatively correlated with serum creatinine. Urinary adiponectin positively correlated with GFR and the urinary protein/creatinine ratio. Serum adiponectin negatively correlated with gamma GT, and urinary adiponectin with AP (Table 2). In PSC-IBD, only the negative correlation between serum adiponectin and GFR was significant (Table 2).
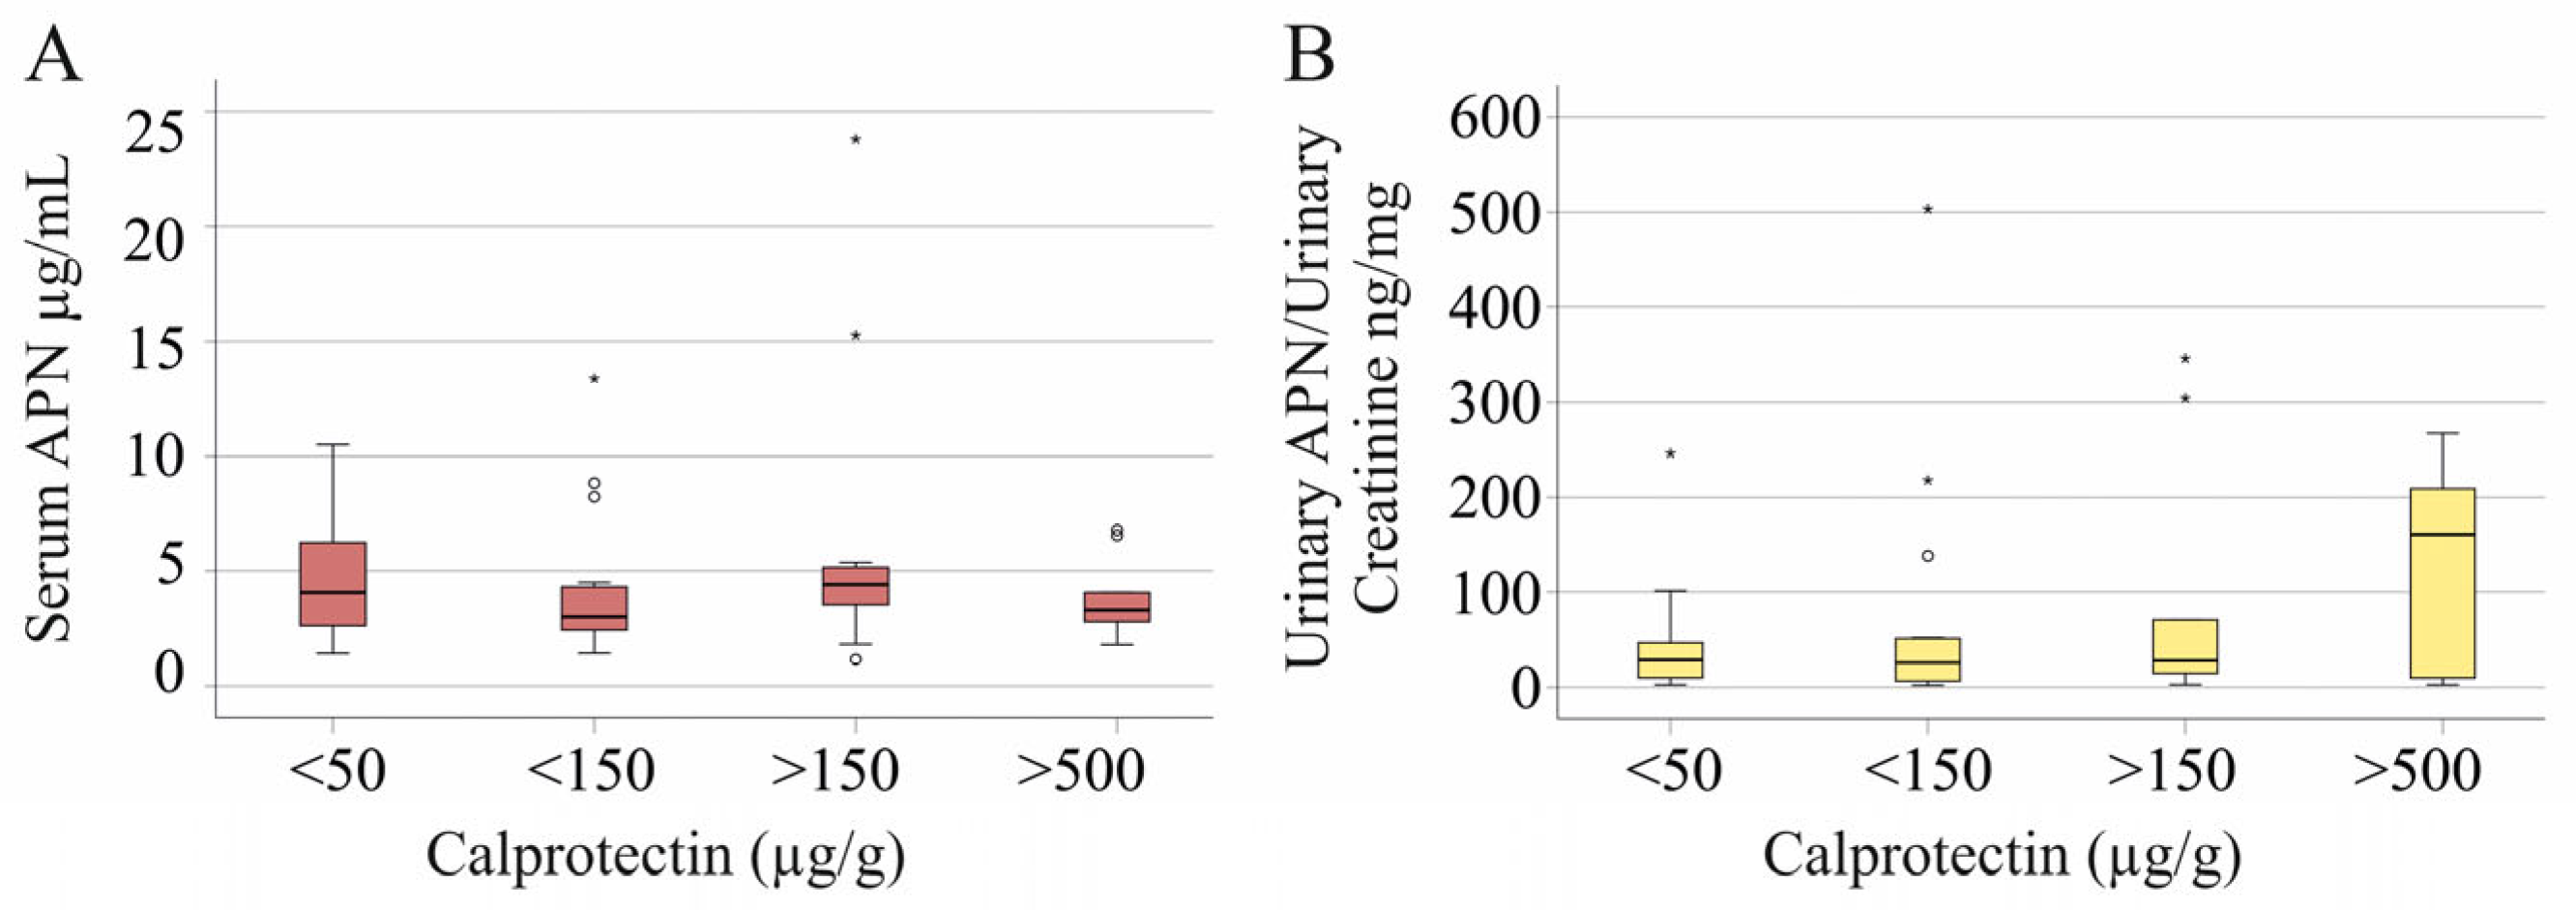
The stratification of IBD patients for their fecal calprotectin levels revealed that serum (p = 0.515) and urinary adiponectin (p = 0.589) did not significantly vary between these groups. Here, 36 patients had fecal calprotectin levels <50 µg/g, 16 patients had levels <150 µg/g, 11 patients had levels >150 µg/g, and 9 patients had levels >500 µg/g (data of two patients were not documented) (Figure 3A,B).
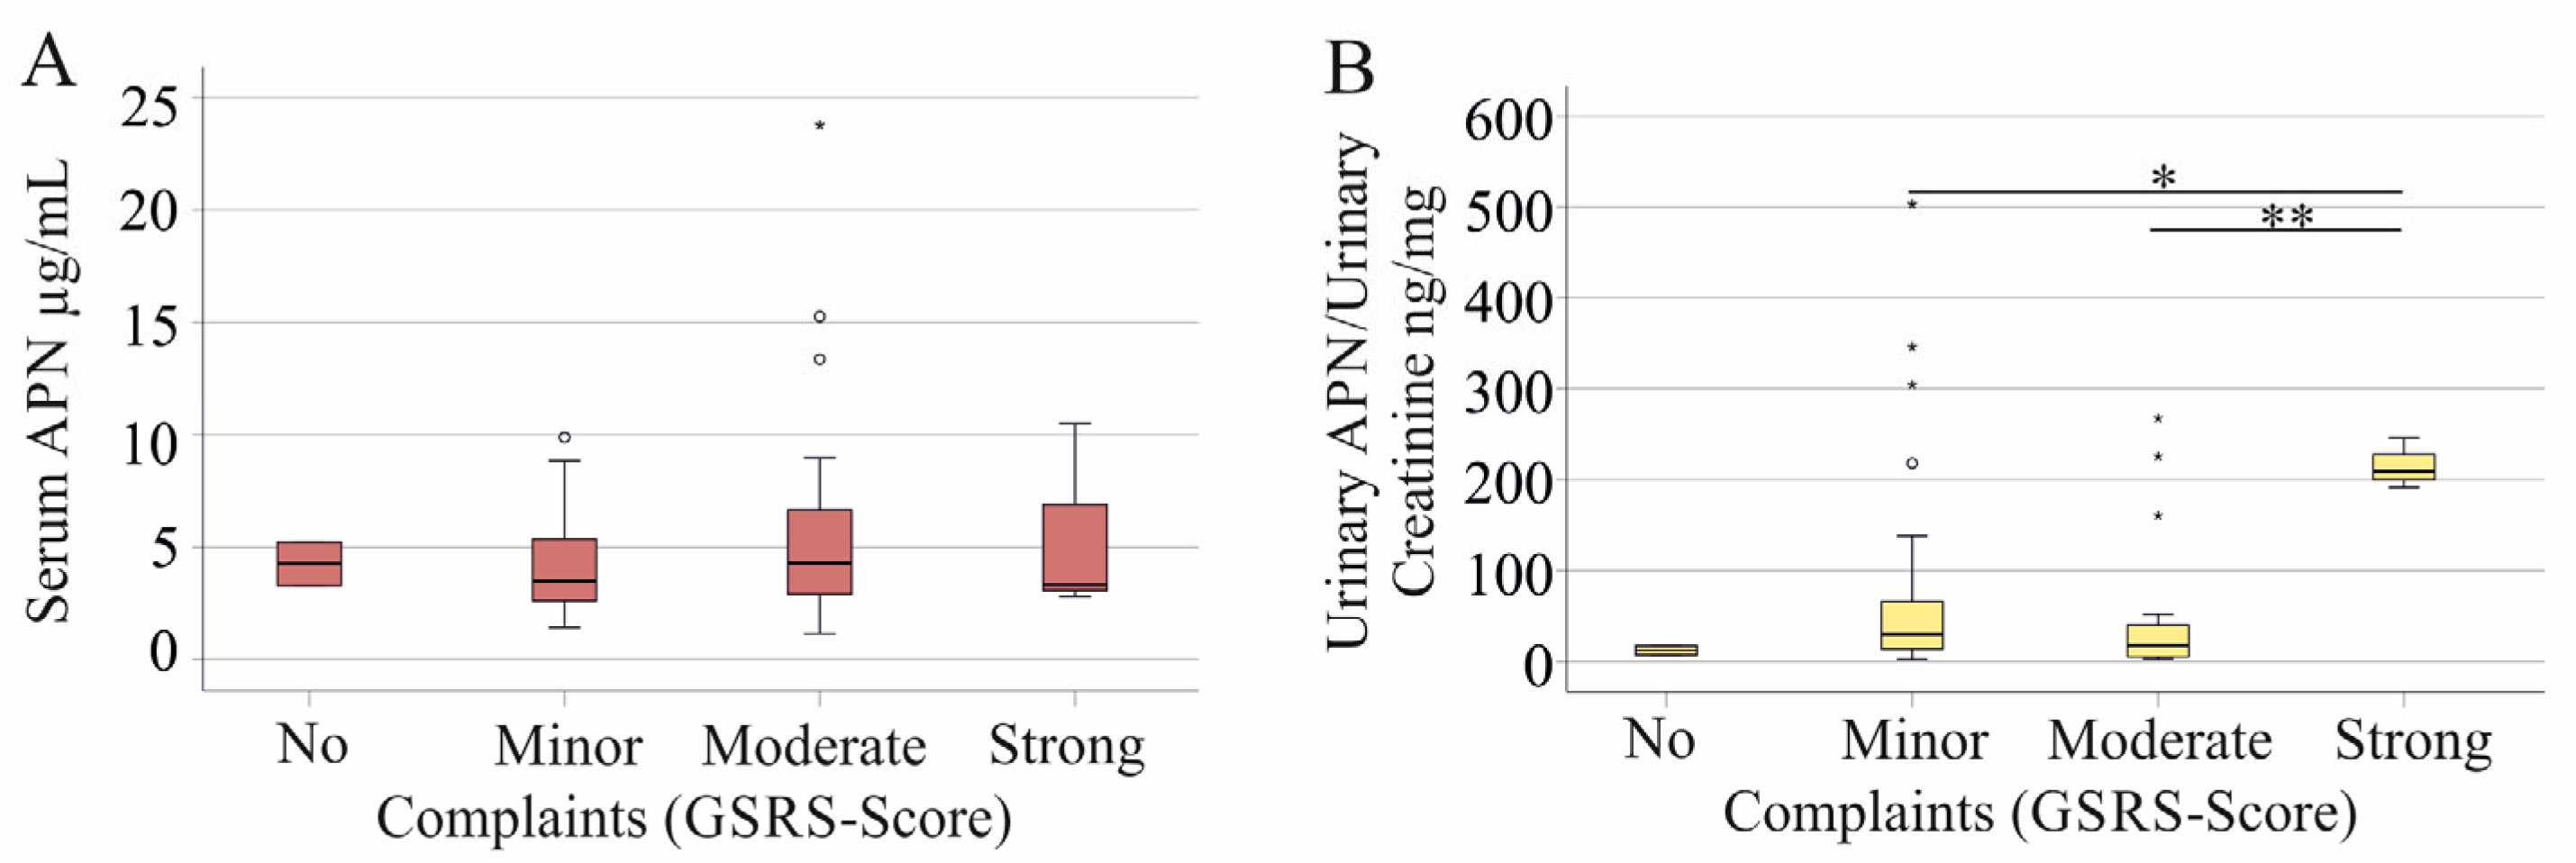
The Gastrointestinal Symptom Rating Scale (GSRS) for the assessment of general well-being, abdominal pain, and the number of stools per day was not associated with serum adiponectin levels (Figure 4A). Urinary adiponectin was highest in IBD patients with strong complaints (3 patients) in comparison to patients with minor complaints (45 patients), and moderate complaints (22 patients) (2 patients had no complaints; data of 2 patients were not recorded) (Figure 4B). Fecal calprotectin levels tended to increase with a higher GSRS score (p = 0.075) and CRP was significantly elevated (p = 0.038). The GFR and creatinine in serum did not significantly change (p = 0.145 and p = 0.091, respectively). The urinary protein/creatinine ratio in patients with a high GSRS score was higher compared to patients with lower GSRS scores (p = 0.048 compared to patients with minor and p = 0.005 compared to patients with moderate complaints).

3.4. Adiponectin in Relation to Disease Localization, Extraintestinal Manifestations, and Liver Fibrosis

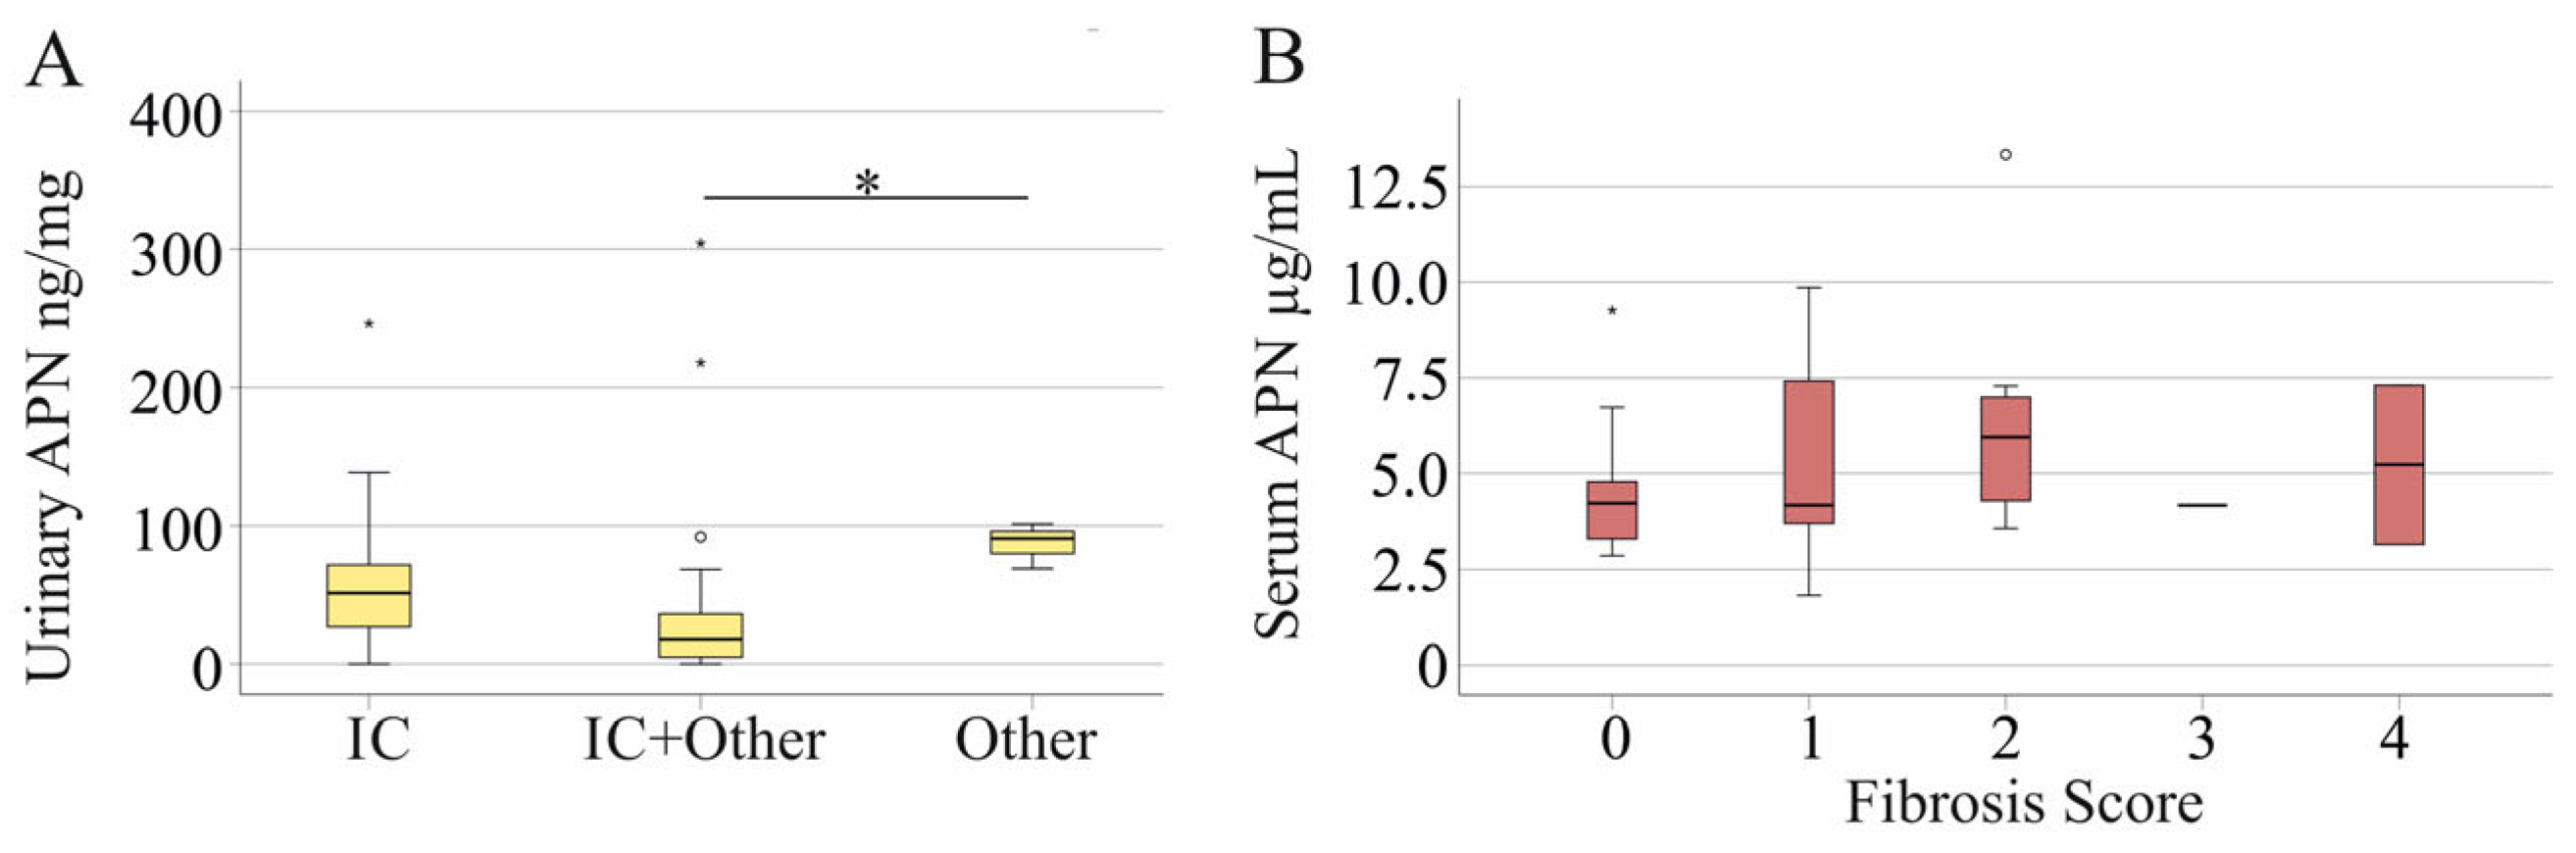
In total, 9 patients with CD had ileocecal disease, 40 patients had ileocecal disease with other parts of the gastrointestinal tract affected, and 3 patients had diseases not involving the ileocecal region. There were no significant differences in the serum adiponectin levels between these groups (p = 0.277). Urinary adiponectin was lower in patients with multilocular disease compared to patients with diseases not involving the ileocecal region (Figure 5A). It should be noted that the diseases’ localization was not associated with changes in the GSRS score (p = 0.312), GFR (p = 0.592), creatinine levels (p = 0.634), and urinary protein/creatinine ratio (p = 0.162).
In the UC group, one patient had proctitis, three had proctosigmoidosis, four had left-sided colitis and fourteen had pancolitis. No patient with UC had backwash colitis. No statistically significant differences were observed in the serum (p = 0.637) and urinary (p = 0.560) adiponectin levels of UC patients with different disease localizations.
In IBD, 36 patients had extraintestinal manifestations. The prevalence of arthralgia was 20.2%, skin involvement was 12.2% and ocular involvement prevalence was 10.8%. Serum (p = 0.290) and urinary (p = 0.200) adiponectin levels were similar in patients with and without extraintestinal manifestations.
The fibrosis grade of the patients with PSC or PSC-IBD (which were analyzed together) determined by FibroScan was as follows: eleven PSC/PSC-IBD patients had no fibrosis, thirteen patients had grade 1 fibrosis, eight patients had grade 2 fibrosis, one patient had grade 3 fibrosis and two patients had grade 4 fibrosis. Serum (Figure 5B) and urinary adiponectin were similar in these groups (p = 0.662 and p = 0.501 respectively). The data of four PSC-IBD and one PSC patient were not documented.

3.5. Adiponectin in Feces

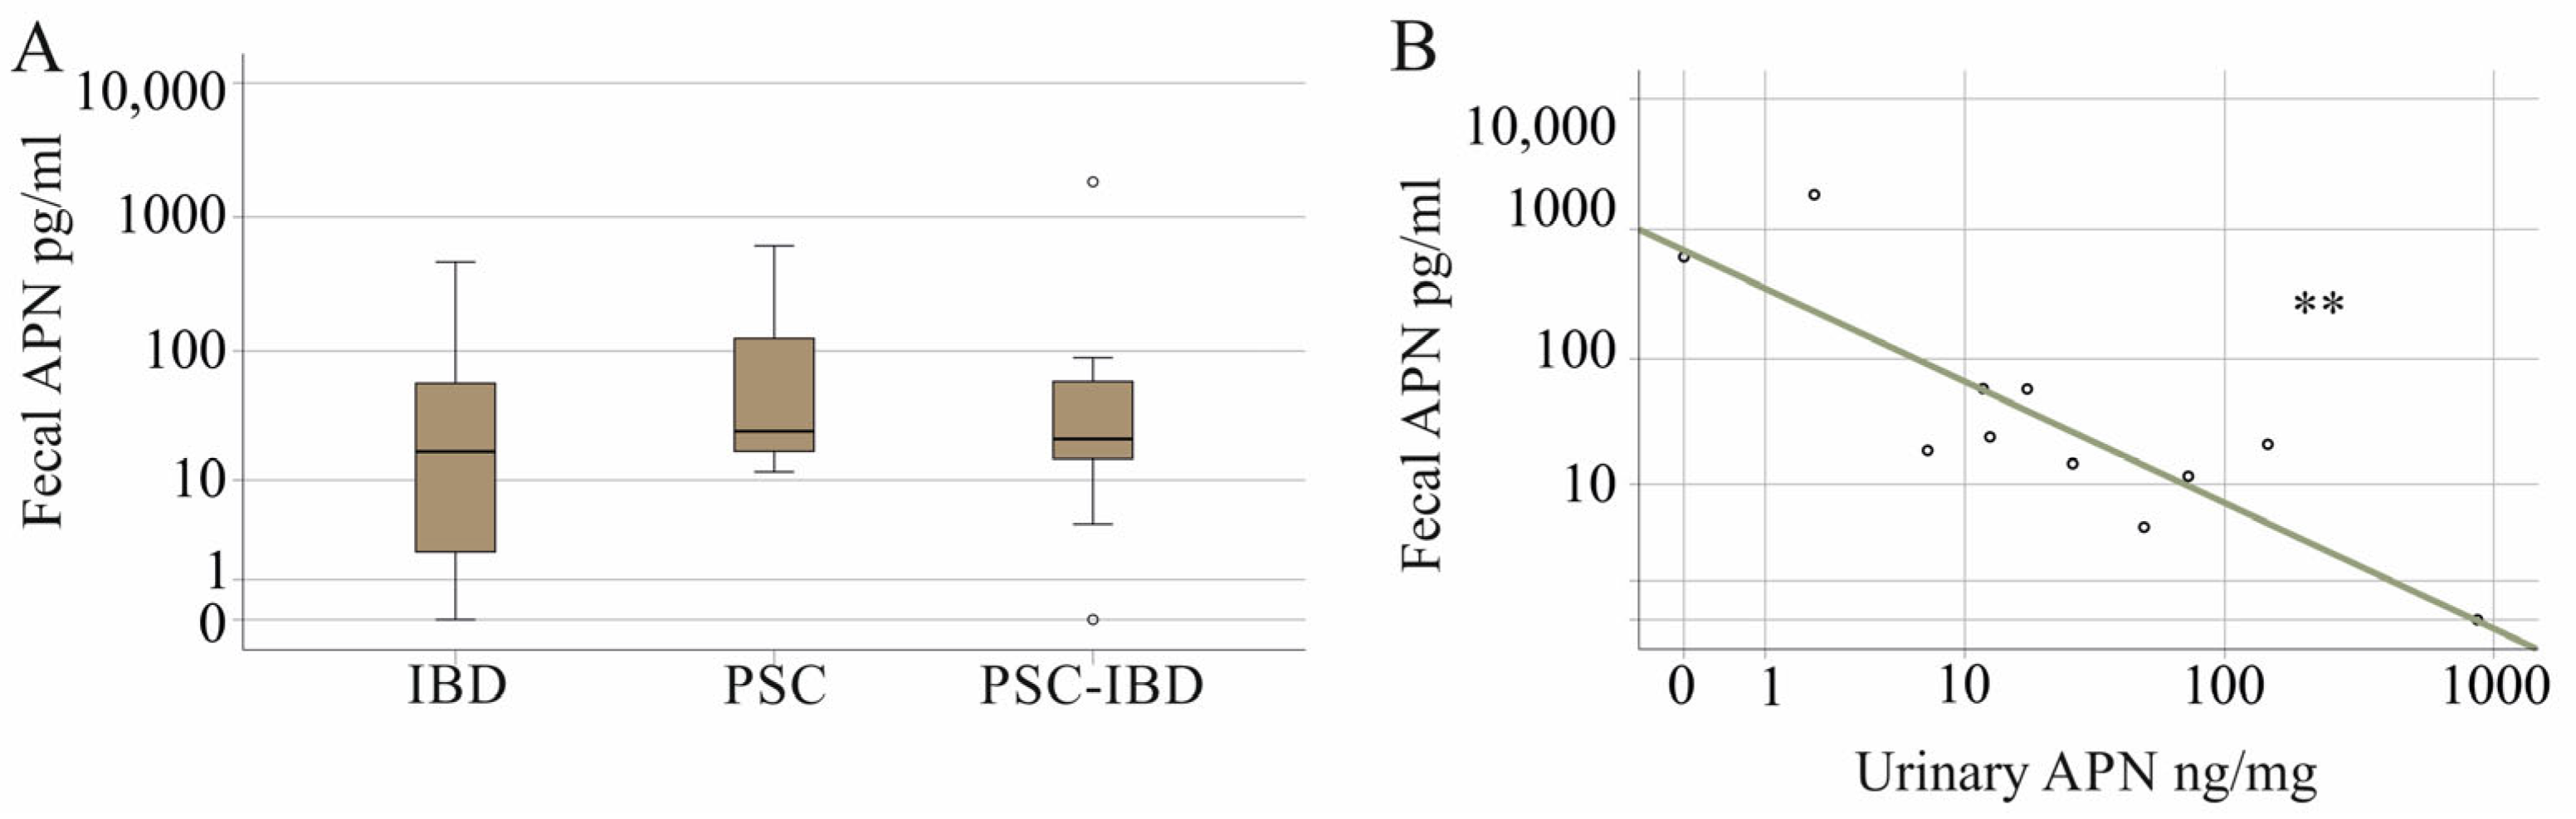
Because it was suggested that higher serum adiponectin in chronic liver disease is due to impaired biliary excretion [32], we also measured adiponectin in fecal samples of 64 patients (53 IBD, 8 PSC-IBD, and 3 PSC patients without underlying IBD). Fecal adiponectin was similar between UC and CD (p = 0.120), and between PSC, PSC-IBD and IBD patients (p = 0.260) (Figure 6A).
In IBD, fecal adiponectin did not correlate with BMI, CRP, calprotectin, creatinine, GFR, serum or urinary adiponectin, or laboratory measures of liver health such as aminotransferase levels (p > 0.05 for all). The disease localization of patients with CD (p = 0.763) and UC (p = 0.816) was not related to their fecal adiponectin level. The patients with and without extraintestinal manifestations had similar fecal adiponectin levels (p = 0.080). Fecal adiponectin did not change with the GSRS score (p = 0.565).
However, in PSC-IBD, fecal adiponectin was negatively correlated with urinary adiponectin (r = −0.738, p = 0.037). In patients with PSC or PSC-IBD the correlation coefficient was r = −0.800 (p = 0.003) (Figure 6B). The patients without fibrosis (five patients), with fibrosis stage 1 (four patients), and fibrosis stage 2 (one patient) had similar fecal adiponectin levels (p = 0.088).

3.6. Adiponectin and Current Medication

Patients with IBD were treated with antitumor necrosis factor antibodies, anti-interleukin 12/23 antibodies, mesalazine, corticosteroids, or azathioprine. These medications were not related to changes in serum, urinary, and fecal adiponectin levels with the exception of corticosteroids, which were associated with higher serum adiponectin levels compared to patients without this medication (Table 3).
Excluding patients with IBD who were on corticosteroid therapy did not change the result that patients with IBD and controls had similar serum (p = 0.400) and urinary (p = 0.859) adiponectin levels.

4. Discussion

To our knowledge, this is the first study to measure serum, urine and fecal adiponectin in patients with IBD, PSC-IBD, and PSC. Serum adiponectin is elevated in PSC and PSC-IBD compared with healthy controls, and is higher in PSC-IBD than IBD, consistent with higher levels of this adipokine in patients with chronic liver disease [39]. Urinary adiponectin is strongly induced in IBD patients with severe gastrointestinal symptoms.
Adiponectin was shown to exert a causal effect on the estimated GFR, and a higher adiponectin level was related to an increased estimated GFR [52]. Serum adiponectin was not associated with the GFR in our IBD cohort, and negatively correlated with serum creatinine, suggesting a relation with kidney function. However, a negative correlation between serum adiponectin and GFR was observed in PSC-IBD patients. Accordingly, serum adiponectin was negatively correlated with estimated GFR in diabetic patients [53]. The GFR and serum creatinine of our IBD and PSC patients were similar, suggesting that associations of serum adiponectin with measures of kidney function are related to underlying diseases rather than being an indicator of renal function. In the general population, adiponectin added little to the prediction of kidney damage [54]. However, the relatively large increase in serum adiponectin in patients with chronic kidney disease seems to be a feature of severe renal dysfunction [55].
In our cohorts, urinary and serum adiponectin did not correlate. In human systemic lupus erythematosus, urinary adiponectin correlated positively with plasma adiponectin levels [56]. However, the urinary and serum adiponectin levels of the renal disease cohort controls were not correlated [56]. In diabetic patients with normoalbuminuria, there was no significant correlation between urinary adiponectin levels and serum adiponectin levels [57]. This shows that in patients with almost normal renal function, serum and urinary adiponectin levels are not correlated.
Fecal adiponectin revealed a strong negative correlation with urinary adiponectin in PSC patients. Metabolomics in serum, urine, and feces identified mostly positive correlations between metabolite levels in blood and urine or feces samples. The metabolite levels in urine and feces were mostly negatively correlated, which may reflect the fact that metabolites are excreted in either feces or urine [58]. The daily fecal adiponectin excretion is approximately 300 ng (30 g stool dry weight per day [59]; 10 pg adiponectin/mg dry weight), and the daily renal excretion 1.5 µg (1 ng adiponectin/1 mL urine; 1.5 L urine per day [59]). Considering the large variation in stool weight and urine volume [59] as well as urinary and fecal adiponectin concentrations, urinary and fecal excretion of adiponectin may not be that different. Although a negative correlation between urinary and fecal adiponectin is plausible [58], it is unclear why this association was only observed in PSC-IBD.
Adiponectin is quite stable, so it is unlikely that degradation in the blood regulates its circulating levels. It has a half-life of around 75 min in circulation, and coordinated and continuous production is required to maintain stable levels of this adipokine in the blood [60]. The liver is the main site of adiponectin clearance, while the kidney appears to excrete degraded adiponectin released by the liver [60]. In obese individuals, low serum adiponectin levels are associated with reduced clearance, indicating that adiponectin production is the primary regulatory mechanism [60]. The lack of correlation between adiponectin levels in blood, urine and feces may be explained by this.
Serum adiponectin was similar in the controls and IBD patients, consistent with the literature [22], and urinary adiponectin did not differ between the IBD patients and controls. It has been shown that serum adiponectin levels increase in inflammatory diseases such as rheumatoid arthritis [9]. However, patients with severe SARS-CoV-2 infection had significantly lower serum adiponectin levels than those with moderate disease or healthy controls, whose levels were comparable [51]. Plasma adiponectin levels were similar in male patients with sepsis and in the control group. However, levels were lower in female patients with sepsis than in the female control group [61]. The injection of LPS to healthy volunteers did not change adiponectin levels [9]. This suggests that inflammation alone does not affect adiponectin levels in the blood [9]. Furthermore, a sex-specific analysis would also be important, but our cohorts were mostly too small for such calculations. The liver plays a key role in adiponectin metabolism. Higher systemic levels may be caused by inflammation, a reduced hepatic uptake of adiponectin by the liver and decreased biliary excretion [62]. In patients with PSC-IBD, serum adiponectin did not correlate with markers of inflammation, liver disease or biliary disease. Our observational study cannot provide evidence for any of these supposed underlying mechanisms. Studies analyzing the production of adiponectin in PSC-IBD are essential for finally evaluating the mechanisms that regulate its serum levels.
Serum adiponectin was not associated with measures of IBD severity. However, urinary adiponectin was the highest in patients with high calprotectin, although this was not significant. Interestingly, there was a strong increase in urinary adiponectin in patients with a high GSRS score who had elevated calprotectin and CRP levels. As there were only three patients, these results need to be confirmed in a larger cohort.
Neither fecal nor serum adiponectin levels changed in patients with a higher GSRS score, and the source of increased urinary adiponectin remains unclear. In patients with diabetic nephropathy, urinary adiponectin increased ten-fold, and serum adiponectin increased by approximately 1.5-fold. This shows that factors other than elevated systemic adiponectin account for the increased urinary adiponectin concentrations [50]. Adiponectin is expressed in kidney tubular cells, and its expression is increased in inflammation [63]. Notably, the increased fecal calprotectin levels and high GSRS scores represent an IBD group with marked disease activity. Our results suggest that this subgroup is characterized by high urinary adiponectin levels. The urine protein-to-creatinine ratio in spot urine is used to assess proteinuria [64], and this ratio was induced in patients with high GSRS scores, indicating impaired renal function. In patients with diabetes, elevated urinary adiponectin levels were observed despite normal urinary albumin levels, suggesting that urinary adiponectin could serve as an early marker for renal dysfunction [65]. Therefore, high urinary adiponectin may be related to increased renal synthesis and impaired kidney function in patients with high GSRS scores. As there were only three patients with a high GSRS score, further study is needed to confirm this finding and to evaluate whether high urinary adiponectin levels are an early indicator of renal impairment.
Although we do not recommend urinary adiponectin for the diagnosis of severe IBD, as this is already established in daily clinical practice [66,67], its pathophysiological role may provide further insights into the mechanisms contributing to severe disease. This may also apply to the CD patients with a disease that was not localized in the ileocecal region, who had elevated urinary adiponectin. The renal function of these patients was normal, but as this group included only three patients, further confirmation of this observation is needed.
Negative correlations between serum adiponectin and gamma GT, and urinary adiponectin with alkaline phosphatase were observed in IBD but not in PSC-IBD patients. The PSC-IBD cohort included 35 patients and should be large enough for the identification of significant correlations. The negative correlations of adiponectin with gamma GT have been described previously [68], which could not be identified in another cohort of patients [69]. Positive correlations of systemic adiponectin with measures of liver disease severity have been observed in patients with liver cirrhosis [32,70]. This suggests that the relationship between adiponectin and measures of liver injury is influenced by the severity of the underlying liver disease. However, in the PSC-IBD cohort, serum adiponectin levels did not increase with higher fibrosis stages. In patients with non-alcoholic fatty liver disease (NAFLD), the serum adiponectin levels in patients with fibrosis stages 0–2 and 3–4 were comparable [71]. Another study reported a decrease in serum adiponectin with higher fibrosis stages in patients with NAFLD [72]. Liver stiffness also negatively correlated with plasma adiponectin levels in patients with NAFLD and type 2 diabetes [73]. In hepatitis B virus infection, serum adiponectin levels increased in parallel with fibrosis stages [74]. High serum adiponectin levels in patients with liver cirrhosis were reported in viral, autoimmune, alcoholic, and primary biliary cirrhosis, with no differences between disease aetiologies [74], whereas others reported the highest levels in biliary diseases [39]. In our PSC/PSC-IBD cohort, only three patients had advanced fibrosis, showing that associations of serum adiponectin with fibrosis stages in PSC/PSC-IBD patients need to be evaluated in larger cohorts. Increased adiponectin levels were observed in patients with autoimmune diseases [75], raising the question of whether higher adiponectin levels in PSC-IBD or PSC are associated with autoimmunity rather than liver disease severity.
The current analysis has revealed that a serum adiponectin level of 2.9 µg/mL can identify PSC with high sensitivity, but very poor specificity. Moreover, serum adiponectin levels show a high interindividual variations. However, after adjusting for changes in BMI, individual blood adiponectin concentrations remained relatively stable over the course of one year [76]. The patients are scheduled for follow-up investigations at three-to-six-month intervals, at which point serum adiponectin levels are to be monitored. An increase of about 1.5-fold (i.e., the difference between the median serum adiponectin levels in patients with IBD and PSC) could indicate the onset of PSC and prompt specific diagnostic testing. It is necessary to consider confounding factors such as BMI and corticosteroid therapy, which may change over time.
Patients with PSC or PSC-IBD were all treated with ursodeoxycholic acid, a hydrophilic bile acid, that reduces the absorption of lipophilic bile acids, thereby exerting anti-inflammatory and cytoprotective effects [77]. In patients with intrahepatic cholestasis of pregnancy, therapy with ursodeoxycholic acid did not alter serum adiponectin levels [78]. Interestingly, the serum adiponectin levels of patients with and without cholestasis were comparable [78]. This study suggests that ursodeoxycholic acid treatment does not affect systemic adiponectin levels [78].
Similarly, commonly used drugs for the treatment of IBD did not affect serum, urinary or fecal adiponectin levels. However, patients given corticosteroids had higher serum adiponectin levels than those not receiving this treatment. Previous studies of control cohorts and patients with type 2 diabetes have shown that glucocorticoids increase blood adiponectin levels [79]. It should be noted, however, that other studies have reported a decrease in adiponectin levels in controls and patients given corticosteroids. In accordance with our observation in adult patients with IBD, an increase in serum adiponectin has previously been described in pediatric patients with IBD [80]. Treatment with corticosteroids has also been linked to elevated adiponectin levels in male patients with CD [81]. However, Theocharidou et al. found no difference in serum adiponectin levels in patients treated with corticosteroids [82]. The reasons for these conflicting findings may lie in the dosage or type of corticosteroids [79]. Consistent with our analysis, anti-TNF therapy and azathioprine did not alter the serum adiponectin levels of IBD patients [82].
Recent studies have indicated that serum calprotectin levels, which are an indicator of systemic inflammation, increase in patients with active IBD [27]. Serum calprotectin levels were higher in our patients with active IBD than in those with the inactive disease or in healthy controls, whose levels were similar. There was no difference in serum calprotectin levels between IBD patients with inactive disease and controls [83]. The comparatively small number of patients with an active disease in our cohort (20 of 74 patients) meant that significant differences between the entire patient cohort and the controls could not be identified. It should be noted that the difference in fecal calprotectin levels between the control subjects and patients with inactive IBD is comparatively small and may not be significant in smaller cohorts that include a high proportion of patients with the inactive disease [83].
Interestingly, patients with PSC-IBD had the highest serum calprotectin levels, although fecal calprotectin and CRP levels were similar in patients with IBD and PSC-IBD. A previous study has shown that the serum calprotectin levels of patients with PSC (73% had PSC-IBD) and patients with bile duct stones are comparable [84]. Serum calprotectin is also increased in patients with liver cirrhosis [29]. Therefore, the potential of serum calprotectin levels as a marker of PSC-IBD should be further evaluated.
This study has several limitations. In our cohort, the autoantibody profiles of patients with IBD and/or PSC were not recorded. This meant that the diagnostic performance of adiponectin in relation to autoantibody levels could not be compared. Urine, serum, and feces samples were not collected at a single time point, with up to 24 h between the preservation of serum/urine and feces samples. Despite the IBD population being large overall, the number of PSC patients was very limited, so meaningful comparisons of PSC patients only are not possible. PSC is a rare disease [6] and previous studies attempting to identify markers for PSC have included 7, 20, 30 or 66 patients [37,85,86,87]. The apparent low number of cases is due to limitations of the single center and the prevalence of the disease. It should be noted that previous studies have not always distinguished between patients with PSC and PSC-IBD [39,86]. Moreover, only three IBD patients had severe symptoms, and the high urinary adiponectin levels in these patients is a preliminary finding. Urine samples were collected from spontaneous urine, and blood samples were not collected under fasting conditions. Serum adiponectin is associated with adiposity, metabolic diseases such as type 2 diabetes, and renal function [8,10,55], and these may be confounders. Moreover, this was a single-center study, and patients were from the hospital catchment area, which is mostly the eastern part of Bavaria. Laboratory measures and the BMI of the controls were not documented, but none of our controls were obese. Adiponectin levels in the feces of controls were not analyzed.

5. Conclusions

In conclusion, our exploratory study shows elevated serum adiponectin in patients with PSC-IBD. Therefore, monitoring adiponectin levels continuously can be a valuable way of screening for PSC-IBD in patients with IBD. Furthermore, our analysis highlights a significant increase in urinary adiponectin levels among patients with severe IBD and CD patients with extra-ileocecal disease localization, suggesting potential pathophysiological relevance. A large, multi-center study with diverse patient populations is necessary to validate the role of adiponectin as a diagnostic biomarker for PSC.

Supplementary Materials

The following supporting information can be downloaded at https://www.mdpi.com/article/10.3390/livers6020015/s1. Table S1: Characteristics of IBD patients, PSC-IBD patients, PSC patients, and controls for the analysis of urinary adiponectin.

Author Contributions

Conceptualization, C.B., A.K. and H.C.T.; resources, H.C.T., M.H., T.E., P.M., A.A., M.M. and J.L.; statistical analysis, C.B.; writing—original draft preparation, C.B.; and writing—review and editing, T.E., M.H., J.L., P.M., A.A., A.K., M.M., H.C.T. and C.B. All authors have read and agreed to the published version of the manuscript.

Funding

This research received no external funding.

Institutional Review Board Statement

The study was approved by the Ethics Committee of the University Hospital of Regensburg (Protocol No. 19-1309-101, Approval date: 20 February 2019) and written informed consent from all participants in relation to the study was obtained. The study was performed in accordance with the updated guidelines of good clinical practice and updated Declaration of Helsinki.

Informed Consent Statement

Informed consent was obtained from all subjects involved in the study.

Data Availability Statement

The original contributions presented in this study are included in the article/Supplementary Material. Further inquiries can be directed to the corresponding author.

Acknowledgments

The support of Elena Underberg, Birgit Meier, Elisabeta Sepsy, Maria Eichinger, Tanja Fererberger, Stefanie Sommersberger and Stefan Gunawan is greatly acknowledged. This article is a revised and expanded version of a paper entitled Adiponectin als nicht invasiver Biomarker für primär sklerosierende Cholangitis, which was presented at DGVS/DGAV, Leipzig, 3 October 2024 [88].

Conflicts of Interest

The authors declare no conflicts of interest.

Abbreviations

The following abbreviations are used in this manuscript:
ALTAlanine aminotransferase
APAlkaline phosphatase
ASTAspartate aminotransferase
BMIBody mass index
CDCrohn’s disease
CRPC-reactive protein
DSSDextran sulphate sodium
Gamma GTGamma glutamyltransferase
GFRGlomerular filtration rate
GSRSGastrointestinal Symptom Rating Scale
IBDInflammatory bowel disease
MELDModel for end stage liver disease
NAFLDNon-alcoholic fatty liver disease
PSCPrimary sclerosing cholangitis
TNBSTrinitrobenzene sulphonic acid
UCUlcerative colitis

References

  1. Brown, S.J.; Mayer, L. The immune response in inflammatory bowel disease. Am. J. Gastroenterol. 2007, 102, 2058–2069. [Google Scholar] [CrossRef] [PubMed]
  2. Cho, J.H. The genetics and immunopathogenesis of inflammatory bowel disease. Nat. Rev. Immunol. 2008, 8, 458–466. [Google Scholar] [CrossRef]
  3. Ott, C.; Obermeier, F.; Thieler, S.; Kemptner, D.; Bauer, A.; Scholmerich, J.; Rogler, G.; Timmer, A. The incidence of inflammatory bowel disease in a rural region of Southern Germany: A prospective population-based study. Eur. J. Gastroenterol. Hepatol. 2008, 20, 917–923. [Google Scholar] [CrossRef]
  4. Dahlhamer, J.M.; Zammitti, E.P.; Ward, B.W.; Wheaton, A.G.; Croft, J.B. Prevalence of Inflammatory Bowel Disease Among Adults Aged ≥ 18 Years-United States, 2015. MMWR Morb. Mortal. Wkly. Rep. 2016, 65, 1166–1169. [Google Scholar] [CrossRef]
  5. Karlsen, T.H.; Folseraas, T.; Thorburn, D.; Vesterhus, M. Primary sclerosing cholangitis-a comprehensive review. J. Hepatol. 2017, 67, 1298–1323. [Google Scholar] [CrossRef]
  6. Rabiee, A.; Silveira, M.G. Primary sclerosing cholangitis. Transl. Gastroenterol. Hepatol. 2021, 6, 29. [Google Scholar] [CrossRef] [PubMed]
  7. van Munster, K.N.; Bergquist, A.; Ponsioen, C.Y. Inflammatory bowel disease and primary sclerosing cholangitis: One disease or two? J. Hepatol. 2023, 80, 155–168. [Google Scholar] [CrossRef] [PubMed]
  8. Buechler, C.; Wanninger, J.; Neumeier, M. Adiponectin, a key adipokine in obesity related liver diseases. World J. Gastroenterol. 2011, 17, 2801–2811. [Google Scholar] [CrossRef]
  9. Fantuzzi, G. Adiponectin and inflammation: Consensus and controversy. J. Allergy Clin. Immunol. 2008, 121, 326–330. [Google Scholar] [CrossRef] [PubMed]
  10. Rabe, K.; Lehrke, M.; Parhofer, K.G.; Broedl, U.C. Adipokines and insulin resistance. Mol. Med. 2008, 14, 741–751. [Google Scholar] [CrossRef]
  11. Wang, Z.V.; Scherer, P.E. Adiponectin, the past two decades. J. Mol. Cell Biol. 2016, 8, 93–100. [Google Scholar] [CrossRef] [PubMed]
  12. Gariballa, S.; Alkaabi, J.; Yasin, J.; Al Essa, A. Total adiponectin in overweight and obese subjects and its response to visceral fat loss. BMC Endocr. Disord. 2019, 19, 55. [Google Scholar] [CrossRef] [PubMed]
  13. Murray, K.A.; Hoad, C.L.; Garratt, J.; Kaviani, M.; Marciani, L.; Smith, J.K.; Siegmund, B.; Gowland, P.A.; Humes, D.J.; Spiller, R.C. A pilot study of visceral fat and its association with adipokines, stool calprotectin and symptoms in patients with diverticulosis. PLoS ONE 2019, 14, e0216528. [Google Scholar] [CrossRef]
  14. Jukic, A.; Bakiri, L.; Wagner, E.F.; Tilg, H.; Adolph, T.E. Calprotectin: From biomarker to biological function. Gut 2021, 70, 1978–1988. [Google Scholar] [CrossRef] [PubMed]
  15. Fayad, R.; Pini, M.; Sennello, J.A.; Cabay, R.J.; Chan, L.; Xu, A.; Fantuzzi, G. Adiponectin deficiency protects mice from chemically induced colonic inflammation. Gastroenterology 2007, 132, 601–614. [Google Scholar] [CrossRef]
  16. Xiao, H.; Xing, T.; Qiu, M.; Zhang, G.; Yang, G.; Chen, W.; Hu, D.; Xue, D.; Peng, J.; Du, B. Adiponectin deficiency prevents chronic colitis-associated colonic fibrosis via inhibiting CXCL13 production. J. Adv. Res. 2024, 76, 639–653. [Google Scholar] [CrossRef]
  17. Nishihara, T.; Matsuda, M.; Araki, H.; Oshima, K.; Kihara, S.; Funahashi, T.; Shimomura, I. Effect of adiponectin on murine colitis induced by dextran sulfate sodium. Gastroenterology 2006, 131, 853–861. [Google Scholar] [CrossRef]
  18. Sideri, A.; Stavrakis, D.; Bowe, C.; Shih, D.Q.; Fleshner, P.; Arsenescu, V.; Arsenescu, R.; Turner, J.R.; Pothoulakis, C.; Karagiannides, I. Effects of obesity on severity of colitis and cytokine expression in mouse mesenteric fat. Potential role of adiponectin receptor 1. Am. J. Physiol. Gastrointest. Liver Physiol. 2015, 308, G591–G604. [Google Scholar] [CrossRef]
  19. Obeid, S.; Wankell, M.; Charrez, B.; Sternberg, J.; Kreuter, R.; Esmaili, S.; Ramezani-Moghadam, M.; Devine, C.; Read, S.; Bhathal, P.; et al. Adiponectin confers protection from acute colitis and restricts a B cell immune response. J. Biol. Chem. 2017, 292, 6569–6582. [Google Scholar] [CrossRef]
  20. Ha, C.W.Y.; Martin, A.; Sepich-Poore, G.D.; Shi, B.; Wang, Y.; Gouin, K.; Humphrey, G.; Sanders, K.; Ratnayake, Y.; Chan, K.S.L.; et al. Translocation of Viable Gut Microbiota to Mesenteric Adipose Drives Formation of Creeping Fat in Humans. Cell 2020, 183, 666–683.e617. [Google Scholar] [CrossRef]
  21. Paul, G.; Schaffler, A.; Neumeier, M.; Furst, A.; Bataillle, F.; Buechler, C.; Muller-Ladner, U.; Scholmerich, J.; Rogler, G.; Herfarth, H. Profiling adipocytokine secretion from creeping fat in Crohn’s disease. Inflamm. Bowel. Dis. 2006, 12, 471–477. [Google Scholar] [CrossRef] [PubMed]
  22. Surdea-Blaga, T.; Ismaiel, A.; Jaaouani, A.; Leucuta, D.C.; Elsayed, A.; Ismaiel, M.; Ben Ameur, I.; Al Srouji, N.; Popa, S.L.; Grad, S.; et al. Adiponectin Levels in Inflammatory Bowel Disease—A Systematic Review and Meta-analysis. Dig. Dis. 2023, 41, 860–871. [Google Scholar] [CrossRef]
  23. Shi, J.T.; Zhang, Y.; She, Y.; Goyal, H.; Wu, Z.Q.; Xu, H.G. Diagnostic Utility of Non-invasive Tests for Inflammatory Bowel Disease: An Umbrella Review. Front. Med. 2022, 9, 920732. [Google Scholar] [CrossRef]
  24. Mao, R.; Xiao, Y.L.; Gao, X.; Chen, B.L.; He, Y.; Yang, L.; Hu, P.J.; Chen, M.H. Fecal calprotectin in predicting relapse of inflammatory bowel diseases: A meta-analysis of prospective studies. Inflamm. Bowel Dis. 2012, 18, 1894–1899. [Google Scholar] [CrossRef] [PubMed]
  25. Guo, X.; Huang, C.; Xu, J.; Xu, H.; Liu, L.; Zhao, H.; Wang, J.; Huang, W.; Peng, W.; Chen, Y.; et al. Gut Microbiota Is a Potential Biomarker in Inflammatory Bowel Disease. Front. Nutr. 2021, 8, 818902. [Google Scholar] [CrossRef] [PubMed]
  26. van Rheenen, P.F.; Van de Vijver, E.; Fidler, V. Faecal calprotectin for screening of patients with suspected inflammatory bowel disease: Diagnostic meta-analysis. BMJ 2010, 341, c3369. [Google Scholar] [CrossRef]
  27. Azramezani Kopi, T.; Shahrokh, S.; Mirzaei, S.; Asadzadeh Aghdaei, H.; Amini Kadijani, A. The role of serum calprotectin as a novel biomarker in inflammatory bowel diseases: A review study. Gastroenterol. Hepatol. Bed Bench 2019, 12, 183–189. [Google Scholar]
  28. Sejersen, K.; Eriksson, M.B.; Larsson, A.O. Calprotectin as a Biomarker for Infectious Diseases: A Comparative Review with Conventional Inflammatory Markers. Int. J. Mol. Sci. 2025, 26, 6476. [Google Scholar] [CrossRef]
  29. Fortuny, M.; Sarrias, M.R.; Torner, M.; Iborra, I.; Clos, A.; Ardevol, A.; Bartoli, R.; Morillas, R.M.; Domenech, E.; Masnou, H. Systematic review of the role of calprotectin in cirrhosis. Eur. J. Clin. Investig. 2024, 54, e14111. [Google Scholar] [CrossRef]
  30. Soomro, S.; Venkateswaran, S.; Vanarsa, K.; Kharboutli, M.; Nidhi, M.; Susarla, R.; Zhang, T.; Sasidharan, P.; Lee, K.H.; Rosh, J.; et al. Predicting disease course in ulcerative colitis using stool proteins identified through an aptamer-based screen. Nat. Commun. 2021, 12, 3989. [Google Scholar] [CrossRef]
  31. Tews, H.C.; Elger, T.; Grewal, T.; Weidlich, S.; Vitali, F.; Buechler, C. Fecal and Urinary Adipokines as Disease Biomarkers. Biomedicines 2023, 11, 1186. [Google Scholar] [CrossRef]
  32. Buechler, C.; Haberl, E.M.; Rein-Fischboeck, L.; Aslanidis, C. Adipokines in Liver Cirrhosis. Int. J. Mol. Sci. 2017, 18, 1392. [Google Scholar] [CrossRef]
  33. Corbetta, S.; Redaelli, A.; Pozzi, M.; Bovo, G.; Ratti, L.; Redaelli, E.; Pellegrini, C.; Beck-Peccoz, P.; Spada, A. Fibrosis is associated with adiponectin resistance in chronic hepatitis C virus infection. Eur. J. Clin. Investig. 2011, 41, 898–905. [Google Scholar] [CrossRef]
  34. Fosby, B.; Melum, E.; Bjoro, K.; Bennet, W.; Rasmussen, A.; Andersen, I.M.; Castedal, M.; Olausson, M.; Wibeck, C.; Gotlieb, M.; et al. Liver transplantation in the Nordic countries—An intention to treat and post-transplant analysis from The Nordic Liver Transplant Registry 1982–2013. Scand. J. Gastroenterol. 2015, 50, 797–808. [Google Scholar] [CrossRef]
  35. Fosby, B.; Karlsen, T.H.; Melum, E. Recurrence and rejection in liver transplantation for primary sclerosing cholangitis. World J. Gastroenterol. 2012, 18, 1. [Google Scholar] [CrossRef] [PubMed]
  36. Dyson, J.K.; Beuers, U.; Jones, D.E.J.; Lohse, A.W.; Hudson, M. Primary sclerosing cholangitis. Lancet 2018, 391, 2547–2559. [Google Scholar] [CrossRef]
  37. Wittek, A.; Steglich, B.; Casar, C.; Seiz, O.; Huber, P.; Ehlken, H.; Reher, D.; Wende, S.; Bedke, T.; Kempski, J.; et al. A Gradient of Intestinal Inflammation in Primary Sclerosing Cholangitis. Inflamm. Bowel Dis. 2023, 30, 900–910. [Google Scholar] [CrossRef] [PubMed]
  38. Chazouilleres, O.; Beuers, U.; Bergquist, A.; Karlsen, T.H.; Levy, C.; Samyn, M.; Trauner, M. EASL Clinical Practice Guidelines on sclerosing cholangitis. J. Hepatol. 2022, 77, 761–806. [Google Scholar] [CrossRef]
  39. Tacke, F.; Wustefeld, T.; Horn, R.; Luedde, T.; Srinivas Rao, A.; Manns, M.P.; Trautwein, C.; Brabant, G. High adiponectin in chronic liver disease and cholestasis suggests biliary route of adiponectin excretion in vivo. J. Hepatol. 2005, 42, 666–673. [Google Scholar] [CrossRef] [PubMed]
  40. Muratori, P.; Muratori, L.; Guidi, M.; Maccariello, S.; Pappas, G.; Ferrari, R.; Gionchetti, P.; Campieri, M.; Bianchi, F.B. Anti-Saccharomyces cerevisiae antibodies (ASCA) and autoimmune liver diseases. Clin. Exp. Immunol. 2003, 132, 473–476. [Google Scholar] [CrossRef]
  41. Granito, A.; Zauli, D.; Muratori, P.; Muratori, L.; Grassi, A.; Bortolotti, R.; Petrolini, N.; Veronesi, L.; Gionchetti, P.; Bianchi, F.B.; et al. Anti-Saccharomyces cerevisiae and perinuclear anti-neutrophil cytoplasmic antibodies in coeliac disease before and after gluten-free diet. Aliment. Pharmacol. Ther. 2005, 21, 881–887. [Google Scholar] [CrossRef] [PubMed]
  42. Wunsch, E.; Milkiewicz, M.; Norman, G.L.; Laba, A.; Kruk, B.; Milkiewicz, P. Prognostic significance of anti-gliadin and anti-F-actin immunoglobulin A antibodies in primary sclerosing cholangitis. Pol. Arch. Intern. Med. 2025, 135, 16910. [Google Scholar] [CrossRef]
  43. Wunsch, E.; Norman, G.L.; Milkiewicz, M.; Krawczyk, M.; Bentow, C.; Shums, Z.; Mahler, M.; Lopens, S.; Reinhold, D.; Franke, A.; et al. Anti-glycoprotein 2 (anti-GP2) IgA and anti-neutrophil cytoplasmic antibodies to serine proteinase 3 (PR3-ANCA): Antibodies to predict severe disease, poor survival and cholangiocarcinoma in primary sclerosing cholangitis. Aliment. Pharmacol. Ther. 2021, 53, 302–313. [Google Scholar] [CrossRef] [PubMed]
  44. Yasuda, M.; Shiokawa, M.; Kuwada, T.; Nishikawa, Y.; Nakanishi, R.; Takimoto, I.; Chikugo, K.; Yokode, M.; Muramoto, Y.; Matsumoto, S.; et al. Anti-integrin alphavbeta6 autoantibody in primary sclerosing cholangitis: A Japanese nationwide study. J. Gastroenterol. 2025, 60, 118–126. [Google Scholar] [CrossRef]
  45. Tornai, D.; Ven, P.L.; Lakatos, P.L.; Papp, M. Serological biomarkers for management of primary sclerosing cholangitis. World J. Gastroenterol. 2022, 28, 2291–2301. [Google Scholar] [CrossRef]
  46. Sturm, A.; Atreya, R.; Bettenworth, D.; Bokemeyer, B.; Dignass, A.; Ehehalt, R.; Germer, C.T.; Grunert, P.C.; Helwig, U.; Horisberger, K.; et al. Collaborators Aktualisierte S3-Leitlinie Diagnostik und Therapie des MorbusCrohn der Deutschen Gesellschaft für Gastroenterologie, Verdauungs-und Stoffwechselkrankheiten (DGVS) (Version 4.1)–living guideline. Z. Gastroenterol. 2024, 62, 1229–1318. [Google Scholar] [CrossRef] [PubMed]
  47. Kucharzik, T.; Dignass, A.; Atreya, R.; Bokemeyer, B.; Esters, P.; Herrlinger, K.; Kannengiesser, K.; Kienle, P.; Langhorst, J.; Lugering, A.; et al. Aktualisierte S3-Leitlinie Colitis ulcerosa (Version 6.2). Z. Gastroenterol. 2024, 62, 769–858. [Google Scholar] [CrossRef]
  48. Morikawa, M.; Naito, R.; Mita, K.; Watabe, S.; Nakaishi, K.; Yoshimura, T.; Miura, T.; Hashida, S.; Ito, E. Subattomole detection of adiponectin in urine by ultrasensitive ELISA coupled with thio-NAD cycling. Biophys. Physicobiol. 2015, 12, 79–86. [Google Scholar] [CrossRef][Green Version]
  49. von Eynatten, M.; Liu, D.; Hock, C.; Oikonomou, D.; Baumann, M.; Allolio, B.; Korosoglou, G.; Morcos, M.; Campean, V.; Amann, K.; et al. Urinary adiponectin excretion: A novel marker for vascular damage in type 2 diabetes. Diabetes 2009, 58, 2093–2099. [Google Scholar] [CrossRef]
  50. Schott, H.F.; Krautbauer, S.; Horing, M.; Liebisch, G.; Matysik, S. A Validated, Fast Method for Quantification of Sterols and Gut Microbiome Derived 5alpha/beta-Stanols in Human Feces by Isotope Dilution LC-High-Resolution MS. Anal. Chem. 2018, 90, 8487–8494. [Google Scholar] [CrossRef]
  51. Pavel, V.; Rath, U.; Schmid, S.; Krautbauer, S.; Keller, D.; Amend, P.; Muller, M.; Mester, P.; Buechler, C. Serum Adiponectin Predicts COVID-19 Severity. Biomedicines 2024, 12, 1043. [Google Scholar] [CrossRef]
  52. Bai, Y.; Chen, Z.; Wen, Z.; Long, X.; Mo, Z.; Xu, J. Adiponectin affects estimated glomerular filtration rate: A two-sample bidirectional Mendelian randomization study. Nephrology 2021, 26, 227–233. [Google Scholar] [CrossRef]
  53. Ono, S.; Mizushiri, S.; Nishiya, Y.; Tamura, A.; Hamaura, K.; Ito, R.; Terada, A.; Tanabe, J.; Yanagimachi, M.; Wai, K.M.; et al. The Relationship between Serum Adiponectin, Urinary Albumin/Creatinine Ratio and Type 2 Diabetes: A Population-Based Cross-Sectional Study. J. Clin. Med. 2022, 11, 7232. [Google Scholar] [CrossRef]
  54. Solbu, M.D.; Norvik, J.V.; Storhaug, H.M.; Eriksen, B.O.; Melsom, T.; Eggen, A.E.; Zykova, S.N.; Kronborg, J.B.; Jenssen, T.G. The Association Between Adiponectin, Serum Uric Acid and Urinary Markers of Renal Damage in the General Population: Cross-Sectional Data from the Tromso Study. Kidney Blood Press. Res. 2016, 41, 623–634. [Google Scholar] [CrossRef] [PubMed]
  55. Heidari, M.; Nasri, P.; Nasri, H. Adiponectin and chronic kidney disease; a review on recent findings. J. Nephropharmacol. 2015, 4, 63–68. [Google Scholar] [PubMed]
  56. Rovin, B.H.; Song, H.; Hebert, L.A.; Nadasdy, T.; Nadasdy, G.; Birmingham, D.J.; Yung Yu, C.; Nagaraja, H.N. Plasma, urine, and renal expression of adiponectin in human systemic lupus erythematosus. Kidney Int. 2005, 68, 1825–1833. [Google Scholar] [CrossRef] [PubMed]
  57. Koshimura, J.; Fujita, H.; Narita, T.; Shimotomai, T.; Hosoba, M.; Yoshioka, N.; Kakei, M.; Fujishima, H.; Ito, S. Urinary adiponectin excretion is increased in patients with overt diabetic nephropathy. Biochem. Biophys. Res. Commun. 2004, 316, 165–169. [Google Scholar] [CrossRef]
  58. Erben, V.; Poschet, G.; Schrotz-King, P.; Brenner, H. Comparing Metabolomics Profiles in Various Types of Liquid Biopsies among Screening Participants with and without Advanced Colorectal Neoplasms. Diagnostics 2021, 11, 561. [Google Scholar] [CrossRef]
  59. Rose, C.; Parker, A.; Jefferson, B.; Cartmell, E. The Characterization of Feces and Urine: A Review of the Literature to Inform Advanced Treatment Technology. Crit. Rev. Environ. Sci. Technol. 2015, 45, 1827–1879. [Google Scholar] [CrossRef]
  60. Halberg, N.; Schraw, T.D.; Wang, Z.V.; Kim, J.Y.; Yi, J.; Hamilton, M.P.; Luby-Phelps, K.; Scherer, P.E. Systemic fate of the adipocyte-derived factor adiponectin. Diabetes 2009, 58, 1961–1970. [Google Scholar] [CrossRef]
  61. Mester, P.; Räth, U.; Schmid, S.; Mueller, M.; Buechler, C.; Pavel, V. Exploring the Relationship between Plasma Adiponectin, Gender, and Underlying Diseases in Severe Illness. Biomedicines 2023, 11, 3287. [Google Scholar] [CrossRef]
  62. Ismaiel, A.; Ciornolutchii, V.; Herrera, T.E.; Ismaiel, M.; Leucuta, D.C.; Popa, S.L.; Dumitrascu, D.L. Adiponectin as a biomarker in liver cirrhosis-A systematic review and meta-analysis. Eur. J. Clin. Investig. 2025, 55, e14328. [Google Scholar] [CrossRef]
  63. Perri, A.; Vizza, D.; Lofaro, D.; Gigliotti, P.; Leone, F.; Brunelli, E.; Malivindi, R.; De Amicis, F.; Romeo, F.; De Stefano, R.; et al. Adiponectin is expressed and secreted by renal tubular epithelial cells. J. Nephrol. 2013, 26, 1049–1054. [Google Scholar] [CrossRef] [PubMed]
  64. Kaminska, J.; Dymicka-Piekarska, V.; Tomaszewska, J.; Matowicka-Karna, J.; Koper-Lenkiewicz, O.M. Diagnostic utility of protein to creatinine ratio (P/C ratio) in spot urine sample within routine clinical practice. Crit. Rev. Clin. Lab. Sci. 2020, 57, 345–364. [Google Scholar] [CrossRef] [PubMed]
  65. Yamamoto, M.; Fujimoto, Y.; Hayashi, S.; Hashida, S. A study of high-, middle- and low-molecular weight adiponectin in urine as a surrogate marker for early diabetic nephropathy using ultrasensitive immune complex transfer enzyme immunoassay. Ann. Clin. Biochem. 2018, 55, 525–534. [Google Scholar] [CrossRef]
  66. Seyedian, S.S.; Nokhostin, F.; Malamir, M.D. A review of the diagnosis, prevention, and treatment methods of inflammatory bowel disease. J. Med. Life 2019, 12, 113–122. [Google Scholar] [CrossRef]
  67. Sturm, A.; Maaser, C.; Calabrese, E.; Annese, V.; Fiorino, G.; Kucharzik, T.; Vavricka, S.R.; Verstockt, B.; van Rheenen, P.; Tolan, D.; et al. ECCO-ESGAR Guideline for Diagnostic Assessment in IBD Part 2: IBD scores and general principles and technical aspects. J. Crohns Colitis 2019, 13, 273–284. [Google Scholar] [CrossRef]
  68. Kim, J.A.; Kim, S.M.; Yoon, D. The relationship between gamma-glutamyltransferase and adiponectin in nonalcoholic women. Metabolism 2007, 56, 578–582. [Google Scholar] [CrossRef]
  69. Park, J.S.; Kang, S.A.; Yoo, J.S.; Ahn, C.W.; Cha, B.S.; Kim, K.R.; Lee, H.C. Association between gamma-glutamyltransferase, adiponectin and arterial stiffness. J. Atheroscler. Thromb. 2012, 19, 90–97. [Google Scholar] [CrossRef]
  70. Salman, T.A.; Allam, N.; Azab, G.I.; Shaarawy, A.A.; Hassouna, M.M.; El-Haddad, O.M. Study of adiponectin in chronic liver disease and cholestasis. Hepatol. Int. 2010, 4, 767–774. [Google Scholar] [CrossRef]
  71. Arvaniti, V.A.; Thomopoulos, K.C.; Tsamandas, A.; Makri, M.; Psyrogiannis, A.; Vafiadis, G.; Assimakopoulos, S.F.; Labropoulou-Karatza, C. Serum adiponectin levels in different types of non alcoholic liver disease. Correlation with steatosis, necroinflammation and fibrosis. Acta Gastro-Enterol. Belg. 2008, 71, 355–360. [Google Scholar]
  72. Savvidou, S. Serum Adiponectin Concentration Decreases in Higher Stages of Hepatic Fibrosis Within the Entire Clinicopathologic Spectrum of NAFLD. J. Clin. Gastroenterol. 2010, 44, 230–231. [Google Scholar] [CrossRef]
  73. Mantovani, A.; Zusi, C.; Csermely, A.; Salvagno, G.L.; Colecchia, A.; Lippi, G.; Maffeis, C.; Targher, G. Association between lower plasma adiponectin levels and higher liver stiffness in type 2 diabetic individuals with nonalcoholic fatty liver disease: An observational cross-sectional study. Hormones 2022, 21, 477–486. [Google Scholar] [CrossRef] [PubMed]
  74. Hui, C.K.; Zhang, H.Y.; Lee, N.P.; Chan, W.; Yueng, Y.H.; Leung, K.W.; Lu, L.; Leung, N.; Lo, C.M.; Fan, S.T.; et al. Serum adiponectin is increased in advancing liver fibrosis and declines with reduction in fibrosis in chronic hepatitis B. J. Hepatol. 2007, 47, 191–202. [Google Scholar] [CrossRef] [PubMed]
  75. Toussirot, E.; Binda, D.; Gueugnon, C.; Dumoulin, G. Adiponectin in autoimmune diseases. Curr. Med. Chem. 2012, 19, 5474–5480. [Google Scholar] [CrossRef] [PubMed]
  76. Pischon, T.; Hotamisligil, G.S.; Rimm, E.B. Adiponectin: Stability in plasma over 36 hours and within-person variation over 1 year. Clin. Chem. 2003, 49, 650–652. [Google Scholar] [CrossRef]
  77. Lutz, H.; Trautwein, C.; Tischendorf, J.W. Primary sclerosing cholangitis: Diagnosis and treatment. Dtsch. Ärztebl. Int. 2013, 110, 867–874. [Google Scholar] [CrossRef][Green Version]
  78. Kukla, M.; Kierach, R.; Skonieczna, M.; Hudy, D.; Dabrowski, K.; Menzyk, T.; Derra, A.; Boron, D.; Grabarek, B.O. Influence of ursodeoxycholic acid therapy on levels of fibroblast growth factor 21, adiponectin and biochemical parameters in intrahepatic cholestasis of pregnancy. Clin. Exp. Hepatol. 2021, 7, 13–24. [Google Scholar] [CrossRef]
  79. Sukumaran, S.; Dubois, D.C.; Jusko, W.J.; Almon, R.R. Glucocorticoid effects on adiponectin expression. Vitam. Horm. 2012, 90, 163–186. [Google Scholar] [CrossRef]
  80. Vihinen, M.K.; Kolho, K.L.; Janne, O.A.; Andersson, S.; Raivio, T. Circulating adiponectin as a marker for glucocorticoid-related side effects in children and adolescents with inflammatory bowel disease. J. Pediatr. Gastroenterol. Nutr. 2009, 48, 504–506. [Google Scholar] [CrossRef]
  81. Weigert, J.; Obermeier, F.; Neumeier, M.; Wanninger, J.; Filarsky, M.; Bauer, S.; Aslanidis, C.; Rogler, G.; Ott, C.; Schaffler, A.; et al. Circulating levels of chemerin and adiponectin are higher in ulcerative colitis and chemerin is elevated in Crohn’s disease. Inflamm. Bowel Dis. 2010, 16, 630–637. [Google Scholar] [CrossRef]
  82. Theocharidou, E.; Balaska, A.; Vogiatzis, K.; Tellis, C.C.; Gossios, T.D.; Athyros, V.G.; Tselepis, A.D.; Karagiannis, A. Hypertrophic Mesenteric Adipose Tissue May Play a Role in Atherogenesis in Inflammatory Bowel Diseases. Inflamm. Bowel Dis. 2016, 22, 2206–2212. [Google Scholar] [CrossRef]
  83. Mori, A.; Mitsuyama, K.; Sakemi, R.; Yoshioka, S.; Fukunaga, S.; Kuwaki, K.; Yamauchi, R.; Araki, T.; Yoshimura, T.; Yamasaki, H.; et al. Evaluation of Serum Calprotectin Levels in Patients with Inflammatory Bowel Disease. Kurume Med. J. 2021, 66, 209–215. [Google Scholar] [CrossRef]
  84. Voigtlander, T.; Wlecke, J.; Negm, A.A.; Lenzen, H.; Manns, M.P.; Lankisch, T.O. Calprotectin in bile: A disease severity marker in patients with primary sclerosing cholangitis. J. Clin. Gastroenterol. 2014, 48, 866–869. [Google Scholar] [CrossRef]
  85. Arbelaiz, A.; Azkargorta, M.; Krawczyk, M.; Santos-Laso, A.; Lapitz, A.; Perugorria, M.J.; Erice, O.; Gonzalez, E.; Jimenez-Aguero, R.; Lacasta, A.; et al. Serum extracellular vesicles contain protein biomarkers for primary sclerosing cholangitis and cholangiocarcinoma. Hepatology 2017, 66, 1125–1143. [Google Scholar] [CrossRef]
  86. Banales, J.M.; Inarrairaegui, M.; Arbelaiz, A.; Milkiewicz, P.; Muntane, J.; Munoz-Bellvis, L.; La Casta, A.; Gonzalez, L.M.; Arretxe, E.; Alonso, C.; et al. Serum Metabolites as Diagnostic Biomarkers for Cholangiocarcinoma, Hepatocellular Carcinoma, and Primary Sclerosing Cholangitis. Hepatology 2019, 70, 547–562. [Google Scholar] [CrossRef]
  87. Vaughn, B.P.; Kaiser, T.; Staley, C.; Hamilton, M.J.; Reich, J.; Graiziger, C.; Singroy, S.; Kabage, A.J.; Sadowsky, M.J.; Khoruts, A. A pilot study of fecal bile acid and microbiota profiles in inflammatory bowel disease and primary sclerosing cholangitis. Clin. Exp. Gastroenterol. 2019, 12, 9–19. [Google Scholar] [CrossRef]
  88. Elger, T.; Loibl, J.; Wolf, C.; Huss, M.; Kandulski, A.; Müller, M.; Tews, H.; Buechler, C. Adiponectin als nicht invasiver Biomarker für primär sklerosierende Cholangitis. Z. Gastroenterol. 2024, 62, e696–e697. [Google Scholar] [CrossRef]
Figure 1. Urinary adiponectin (APN) normalized to urinary creatinine of healthy controls (HC), patients with Crohn’s disease (CD), and patients with ulcerative colitis (UC). Outliers are indicated by small circles and asterisks in the figures.
Livers 06 00015 g001
Figure 2. Serum and urinary adiponectin (APN) of healthy controls (HC), patients with inflammatory bowel disease (IBD), patients with primary sclerosing cholangitis (PSC), and patients with PSC-IBD. (A) Serum APN; (B) urinary APN normalized to urinary creatinine. Outliers are indicated by small circles and asterisks in the figures. * p < 0.05, ** p < 0.01.
Livers 06 00015 g002
Figure 3. Serum and urinary adiponectin (APN) in relation to fecal calprotectin. (A) Serum APN; (B) urinary APN normalized to urinary creatinine. Outliers are indicated by small circles and asterisks in the figures.
Livers 06 00015 g003
Figure 4. Serum and urinary adiponectin (APN) of patients with IBD in relation to the Gastrointestinal Symptom Rating Scale (GSRS). (A) Serum APN; (B) urinary APN normalized to urinary creatinine. Outliers are indicated by small circles and asterisks in the figures. * p < 0.05 and ** p < 0.01.
Livers 06 00015 g004
Figure 5. Disease localization and fibrosis stages. (A) Urinary adiponectin (APN) normalized to urinary creatinine of patients with Crohn’s disease with ileocecal inflammation (IC), inflammation in the ileocecal region and further parts of the gastrointestinal tract (IC + other) and patients where inflammation was not located in the ileocecal region (other); (B) serum APN of patients with PSC or PSC-IBD in relation to fibrosis scores. Outliers are indicated by small circles and asterisks in the figures. * p < 0.05.
Livers 06 00015 g005
Figure 6. Fecal adiponectin (APN) of patients with IBD, PSC-IBD, and PSC. (A) Fecal APN of IBD, PSC and PSC-IBD patients. Outliers are indicated by small circles; (B) correlation of fecal and urinary APN in PSC/PSC-IBD patients. The black circles represent individual data points, and the green line is the correlation line. Outliers are indicated by small circles and asterisks in the figures ** p < 0.01.
Livers 06 00015 g006
Table 1. Characteristics of IBD patients, PSC-IBD, and PSC patients, and controls for analysis of serum adiponectin. The IBD cohort did not include PSC patients. Due to a shortage of serum, serum calprotectin could not be measured in all samples. The number of patients in whom serum calprotectin was determined is 68 patients with IBD, 33 patients with PSC-IBD, 5 patients with PSC and 15 controls. The fecal calprotectin levels of 13 PSC patients were known. Data are presented as median, minimum and maximum values. The statistical test used was the Kruskal–Wallis test (alanine aminotransferase (ALT), alkaline phosphatase (AP), aspartate aminotransferase (AST), body mass index (BMI), gamma glutamyltransferase (gamma GT), glomerular filtration rate (GFR), and model for end-stage liver disease (MELD)); * p < 0.05, ††, ** p < 0.01, and *** p < 0.001.
CharacteristicsIBDPSC-IBDPSCControls
Number (females/males)74 (37/37)35 (13/22)5 (2/3)17 (10/7)
Age (years)41 (19–67)43 (18–67) *54 (37–63) *42 (23–78)
BMI (kg/m2)24.6 (15.5–44.3)24.1 (16.3–41.8)21.8 (21.3–21.8)not determined
C-reactive protein (mg/L)2 (0–144)3 (0–26)0 (0–0)not determined
Creatinine (mg/dL)0.81 (0.51–1.18)0.83 (0.60–1.43)0.89 (0.60–1.43)not determined
GFR (mL/min)101 (67–136)99 (56–135)72 (70–72)not determined
Fecal calprotectin (µg/g)55 (0–3402)41 (0–999)not determinednot determined
Serum calprotectin (ng/mL)1016 (323–3207) **1704 (434–19,300) **,††1071 (893–1531)936 (265–1956) ††
AST (U/L)25 (10–41) ***44 (17–161) ***26 (15–70)not determined
ALT (U/L)20 (7–63) ***43 (8–205) ***25 (5–61)not determined
Gamma GT (U/L)24 (8–74) **,*50 (10–1700) **101 (11–234) *not determined
AP (U/L)65 (38–142) ***,*127 (35–587) ***151 (70–426) *not determined
Bilirubin (mg/dL)0.40 (0.15–1.90) ***,**0.70 (0.30–4.30) ***0.80 (0.60–1.50) **not determined
MELD Scorenot determined6 (6–15)6 (6–9)not determined
Urine protein/creatinine0.06 (0–14.89)0.11 (0–1.48)0.05 (0.02–0.43)not determined
Table 2. Spearman correlation coefficients for the correlation of serum and urinary adiponectin with the age, BMI, and laboratory values of IBD and PSC-IBD patients. The statistical test used was the Spearman correlation (alanine aminotransferase (ALT), alkaline phosphatase (AP), aspartate aminotransferase (AST), body mass index (BMI), gamma glutamyltransferase (gamma GT), glomerular filtration rate (GFR), and model for end-stage liver disease (MELD)); * p < 0.05 and ** p < 0.01.
CharacteristicsIBDPSC-IBD
Serum APNUrine APNSerum APNUrine APN
Age (years)0.094−0.0870.401 *0.152
BMI (kg/m2)−0.230−0.102−0.0370.364
C-reactive protein (mg/L)−0.0680.1530.3920.215
Creatinine (mg/dL)−0.266 *−0.318 **0.2310.143
GFR (mL/min)−0.0070.304 *−0.554 *−0.338
Urinary protein/creatinine0.0040.298 *0.3590.412
Fecal calprotectin (µg/g)−0.1330.108−0.0390.196
Serum calprotectin (ng/mL)−0.155−0.052−0.072−0.009
AST (U/L)−0.118−0.118−0.196−0.027
ALT (U/L)−0.076−0.076−0.2700.196
Gamma GT (U/L)−0.300 *−0.067−0.2800.221
AP (U/L)0.037−0.260 *−0.099−0.012
Bilirubin (mg/dL)−0.001−0.0300.0380.053
MELD Scorenot determinednot determined−0.1190.070
Table 3. Adiponectin levels in serum, urine, and feces of patients with and without antitumor necrosis factor, anti-interleukin 12/23, mesalazine, corticosteroid or azathioprine therapies.
Serum µg/mL Urine ng/mg Feces
pg/mL
Anti-TNFNoYesNoYesNoYes
Adiponectin3.5
(1.2–23.8)
4.5
(1.4–15.3)
17.4
(0–304.2)
29.5
(2.5–503.3)
27.7
(0–300.2)
13.9
(0–461.8)
p-value0.2350.1790.685
    
Anti-Interleukin 12/23NoYesNoYesNoYes
Adiponectin3.6
(1.2–23.8)
4.1
(1.6–15.3)
26.9
(0–503.3)
17.4
(0–304.2)
25.1
(0–461.8)
17.0
(0–102.0)
p-value0.2290.8450.541
    
MesalazineNoYesNoYesNoYes
Adiponectin4.0
(1.2–15.3)
3.4
(1.6–23.8)
30.4
(0–267.2)
15.0
(0–503.3)
16.6
(0–461.8)
51.6
(0–350.2)
p-value0.3240.2670.080
    
CorticosteroidNoYesNoYesNoYes
Adiponectin3.3
(1.2–9.9)
4.8
(2.4–23.8)
21.8
(0–503.3)
34.3
(0–345.9)
16.1
(0–256.9)
36.8
(0–461.8)
p-value0.0140.1760.184
    
AzathioprineNoYesNoYesNoYes
Adiponectin3.5
(1.4–23.8)
4.0
(1.2–8.2)
22.8
(0–503.3)
43.0
(0–218.0)
17.0
(0–461.8)
28.0
(2.2–77.9)
p-value0.3780.5870.697
Disclaimer/Publisher’s Note: The statements, opinions and data contained in all publications are solely those of the individual author(s) and contributor(s) and not of MDPI and/or the editor(s). MDPI and/or the editor(s) disclaim responsibility for any injury to people or property resulting from any ideas, methods, instructions or products referred to in the content.