Article

The Riparian Squeeze: Decadal Fragmentation Dynamics and the Paradox of Community-Based Ecotourism in the Ledok Amprong Corridor, East Java, Indonesia


1
Environmental Science Study Program, Graduate School, Universitas Brawijaya, Malang 65145, East Java, Indonesia
2
Soil Department, Faculty of Agriculture, Universitas Brawijaya, Malang 65145, East Java, Indonesia
3
Architectural Department, Faculty of Engineering, Universitas Brawijaya, Malang 65145, East Java, Indonesia
4
Urban and Regional Planning Department, Faculty of Engineering, Universitas Brawijaya, Malang 65145, East Java, Indonesia
*
Author to whom correspondence should be addressed.
Ecologies 2026, 7(3), 72; https://doi.org/10.3390/ecologies7030072
Submission received: 2 June 2026 / Revised: 10 July 2026 / Accepted: 16 July 2026 / Published: 27 July 2026

Abstract

Tropical riparian ecosystems are among the most threatened biomes on Earth, yet decade-scale, spatially explicit documentation of vegetation loss and landscape fragmentation in community-based ecotourism corridors remains scarce. This study investigates whether agricultural intensification associated with ecotourism development has driven measurable vegetation decline and landscape fragmentation in the Ledok Amprong riparian corridor (Poncokusumo District, Malang Regency, East Java; 8.21 ha, 800–900 m a.s.l.), a mixed-canopy riparian system dominated by Ficus benjamina, Albizia chinensis, and bamboo (Phyllostachys spp.) interspersed with smallholder coffee (Coffea canephora) agroforestry, over the period 2015–2024. We applied multi-temporal Sentinel-2 (10 m) imagery, NDVI analysis, supervised Maximum-Likelihood classification (Overall Accuracy: 89.75%, Kappa: 0.86), and FRAGSTATS-derived landscape metrics to quantify vegetation dynamics and land cover transition. Results show that agricultural land expanded by 157.51% (1.14 to 2.93 ha), while vegetation cover declined by 28.45% (6.27 to 4.49 ha). A strong negative correlation between agricultural expansion and vegetation loss (r = −0.96, p < 0.001) confirmed agriculture as the primary driver of ecosystem degradation. Landscape fragmentation intensified markedly: patch density increased by 49.6%, the connectivity index declined by 23.5%, and the fragmentation index increased by 54.3%. These findings establish the first quantitative, decade-scale spatiotemporal baseline for this ecotourism corridor and demonstrate that community-based ecotourism development, without adequate spatial governance, accelerates rather than mitigates riparian degradation—a paradox with broad implications for tropical riparian conservation governance worldwide. Evidence-based management recommendations include 10–30 m dynamic buffer zones, a 2.5 ha targeted restoration programme, and a Payment for Ecosystem Services (PES) mechanism, offering a transferable framework for sustainable riparian ecotourism management across rapidly urbanizing tropical watersheds.

1. Introduction

Riparian ecosystems represent critical transition zones at the interface between terrestrial and aquatic environments, performing indispensable ecological functions that sustain both biodiversity and human well-being. Davis et al. [1] affirm that these vital habitats support elevated levels of biodiversity while delivering a wide range of regulatory and provisioning ecosystem services, including maintenance of water quality, flood risk mitigation, and hydrological regulation, that are fundamentally important to human well-being. Dinca et al. [2], through a global bibliometric review covering three decades of riparian research, further establish that riparian forests additionally provide carbon sequestration, sediment retention, and habitat provisioning services, underscoring their multifunctional ecological role across diverse climatic regions. In tropical contexts, riparian zones also function as critical ecological corridors that maintain landscape connectivity in highly modified environments, linking areas of remaining tree cover and sustaining populations of species dependent on continuous vegetation [1,3]. Despite their ecological importance, riparian ecosystems are among the most altered, degraded, and vulnerable biomes on Earth, largely due to their proximity to hotspots of intensive human activity including agricultural encroachment, urban expansion, and tourism infrastructure development [4]. The accelerating pace of land use change in these sensitive zones necessitates robust, evidence-based monitoring frameworks capable of capturing both spatial and temporal dimensions of ecosystem transformation.
At the global scale, riparian ecosystems occupy a disproportionately important position in the Earth’s biosphere relative to their spatial extent. Although riparian corridors constitute only approximately 2–3% of the total terrestrial land surface, they support more than 40% of all terrestrial species at some stage of their life cycle, harbor exceptionally high plant species richness, and function as primary freshwater conduits linking upland catchments to coastal and marine systems [3,4]. The world’s river networks span an estimated 70 million kilometers, with associated riparian buffers and floodplain systems that collectively regulate approximately 60% of global freshwater discharge and provide critical services including sediment transport, groundwater recharge, and nutrient cycling. However, the condition of riparian ecosystems worldwide has deteriorated dramatically over the past century. More than 90% of large river floodplain systems in temperate regions of Europe and North America have been hydrologically disconnected, drained, or converted to agricultural and urban land uses, while tropical riparian zones—which harbor the highest biodiversity and the greatest ecosystem service potential—are now experiencing accelerating degradation driven by agricultural frontier expansion, extractive resource use, and rapid demographic growth [3]. The Millennium Ecosystem Assessment and subsequent global syntheses have consistently identified riparian and freshwater-associated biomes as among the most severely threatened on Earth, with riparian vegetation loss and floodplain disconnection identified as primary drivers of biodiversity decline in both aquatic and terrestrial realms. This global pattern of riparian degradation represents not merely an ecological crisis but a mounting threat to the water security, food production systems, and climate resilience of hundreds of millions of people worldwide who depend on the services delivered by functioning river corridors and their associated riparian zones.
The recognition of riparian ecosystems as strategic assets in the global transition toward green and blue economies has further elevated their policy relevance in the twenty-first century. International economic and environmental frameworks increasingly converge on the premise that intact riparian corridors underpin multiple sectors of rural and national economies. Dinca et al. [2] confirm through bibliometric synthesis that the economic valuation of riparian forest services—encompassing water purification, flood mitigation, carbon sequestration, and nature-based tourism—has emerged as one of the fastest-growing research domains in environmental economics, reflecting growing recognition that the degradation of riparian zones generates substantial economic externalities that conventional market systems systematically fail to price. Global estimates of the economic value of freshwater ecosystem services, including riparian contributions, consistently exceed several trillion US dollars annually, with nature-based ecotourism along river corridors constituting a rapidly expanding economic sector valued at over USD 600 billion globally as of the early 2020s. This economic trajectory is directly reflected in the consolidation of international policy frameworks, including the post-2020 Global Biodiversity Framework (Kunming-Montreal, 2022) and the United Nations Sustainable Development Goals (SDGs), which explicitly recognize the conservation and sustainable management of freshwater and riparian ecosystems as prerequisites for achieving SDG 6 (Clean Water and Sanitation), SDG 8 (Decent Work and Economic Growth through sustainable tourism), and SDG 15 (Life on Land). The growing global commitment to nature-positive development and Payment for Ecosystem Services (PES) mechanisms has created new economic incentive structures for riparian conservation [5,6], yet the practical realization of these mechanisms depends critically on the availability of accurate, spatially explicit, and temporally robust assessments of riparian ecosystem conditions and change trajectories. Without such evidence-based baselines, neither the economic valuation of ecosystem services nor the design of effective management interventions can be reliably undertaken, particularly in tropical developing countries where riparian degradation is most acute and where institutional monitoring capacity remains most constrained.
Despite the recognized global importance of riparian ecosystems, a fundamental methodological gap persists in the scientific literature that limits the effectiveness of evidence-based management: the systematic decoupling of spatial and temporal analyses. The preponderance of existing riparian monitoring studies adopts either a purely spatial approach—characterizing vegetation structure, land cover, and landscape metrics at a single point in time—or a purely temporal approach that tracks change in aggregate indicators without adequate spatial resolution to detect fragmentation dynamics or connectivity loss [7,8]. This disciplinary fragmentation is particularly consequential for tropical riparian systems undergoing rapid transformation, where the interaction between spatial heterogeneity and temporal change trajectory is precisely the information most needed to anticipate ecosystem degradation thresholds and design targeted interventions. A systematic review of riparian ecosystem service studies by Prado et al. [4] found that fewer than 10% of published studies employed integrated multiscale or multitemporal methodological approaches, and that economic valuation of riparian services was severely underrepresented. Similarly, Dinca et al. [2] identify the integration of remote sensing-derived spatial metrics with temporal dynamics analysis as a critical frontier in riparian science, noting that most studies remain confined to single-dimension analyses that cannot capture the compound effects of landscape fragmentation on ecosystem function over time. This gap is especially acute in the context of community-based ecotourism sites in developing tropical nations, where land use pressures from smallholder agriculture, tourism infrastructure, and conservation interests interact dynamically over decadal timescales. The absence of integrated spatiotemporal baselines in such settings directly constrains the ability of watershed management authorities, local governments, and conservation practitioners to set evidence-based targets aligned with international sustainability frameworks, including SDG 6 (ensuring availability and sustainable management of water and sanitation), SDG 8 (promoting sustained, inclusive, and sustainable economic growth through responsible ecotourism), and SDG 15 (protecting, restoring, and promoting sustainable use of terrestrial ecosystems and halting biodiversity loss). Addressing this methodological gap through long-term, integrated spatial and temporal analysis of riparian vegetation dynamics in ecologically sensitive and economically active tropical corridors therefore constitutes a research priority of both scientific and applied significance.
Indonesia, as the world’s largest archipelagic nation and a recognized global biodiversity hotspot, faces particularly acute challenges in riparian ecosystem conservation. Parker et al. [9] document that Indonesia has lost approximately 25% of its old-growth forest since 1990, with intact forest area declining by 45%, reflecting one of the world’s most severe trajectories of forest loss driven by agricultural expansion, deliberate land clearing, and fire disturbance. Purnomo et al. [10] demonstrate through a systematic review of land change dynamics in Indonesia that distinct combinations of economic, institutional, political, and social factors rather than any single driver determine land change outcomes, with central and district governments functioning as prominent decision-making actors shaping land conversion trajectories. In East Java specifically, the confluence of dense rural settlement, volcanic highland agriculture, and growing domestic ecotourism demand has created compounding stressors on riparian landscapes. Analyzing deforestation patterns across West Java’s montane forests using the Landsat archive, Higginbottom et al. [11] identify that forest loss was most prevalent at lower altitudes, which were almost completely cleared first, with remaining forests increasingly confined to higher elevations and rendered vulnerable to fragmentation and further encroachment. The Brantas River watershed, of which the Amprong River is a tributary, represents one of the most economically and ecologically significant river systems in Java, yet systematic documentation of vegetation dynamics along its riparian margins remains limited. Institutional fragmentation in land governance, coupled with weak enforcement of riparian buffer zone regulations, has further exacerbated land conversion in ecologically sensitive areas [12]. Understanding the spatial pattern and temporal trajectory of these changes is therefore essential for informing sustainable land management policies at both watershed and regional scales.
Advances in satellite remote sensing have fundamentally transformed the capacity to monitor vegetation dynamics and land use change across large spatial extents and extended temporal scales. The Normalized Difference Vegetation Index (NDVI), derived from the ratio of near-infrared to red spectral reflectance, remains one of the most widely validated proxies for vegetation density, photosynthetic activity, and canopy health in heterogeneous landscapes [13,14]. Huylenbroeck et al. [7] demonstrate that remote sensing constitutes a powerful and versatile tool for understanding riparian form, function, and change over time, with applications spanning physical channel characterization, canopy detection, vegetation and water index derivation, and multi-temporal landscape pattern assessment. Beyond simple cover mapping, Huylenbroeck et al. [7] further establish that landscape metrics including Shannon diversity, dominance, fragmentation, patch density, and edge density have been effectively integrated into remote sensing-based assessments of habitat turnover in riparian ecosystems, enabling holistic spatial characterization of riparian landscape dynamics. The Landsat satellite program, with its continuous archive spanning more than five decades at a spatial resolution of 30 m, provides an established foundation for multitemporal analysis of riparian ecosystem change [8,15]. The integration of cloud computing platforms, particularly Google Earth Engine (GEE), has further facilitated large-scale spatiotemporal analysis by enabling planetary-scale geospatial computation without requiring access to traditional supercomputers or specialized infrastructure [16]. These methodological advances, while individually well established in the remote sensing literature, have rarely been applied in an integrated manner to community-based ecotourism corridors, which is the specific context addressed by the present study.
The emergence of riparian ecotourism as a distinct land use category introduces ecological and management challenges that conventional monitoring frameworks have been slow to address. While ecotourism is frequently promoted as a conservation-compatible alternative to extractive land uses, its physical infrastructure can generate significant unintended ecological costs. Baloch et al. [17] demonstrate through stakeholder survey evidence that tourism development is widely perceived to generate negative environmental consequences, including degradation of the natural ecosystem, underscoring the need for government-mediated frameworks to balance economic and ecological interests in ecotourism destinations. Similarly, Tang et al. [18] demonstrate that riparian landscapes subjected to expanding infrastructure and impervious surface growth become progressively fragmented over decadal timescales, underscoring the importance of longitudinal monitoring using landscape metrics to detect and quantify structural change before irreversible thresholds are crossed. In the Indonesian context, many riparian ecotourism sites have developed rapidly and informally, outpacing the establishment of environmental carrying capacity assessments or spatially explicit management plans. Ledok Amprong in Malang Regency represents one such site, where the transition from agricultural and natural riparian land to managed ecotourism over the past decade has proceeded without a site-specific baseline assessment of vegetation cover change or fragmentation dynamics. This knowledge gap fundamentally limits the ability of local government, watershed management authorities, and conservation practitioners to make evidence-based decisions regarding zoning, vegetation restoration, and sustainable visitor management.
This study addresses this local evidence gap through a comprehensive spatiotemporal assessment of vegetation dynamics and land use change in the Ledok Amprong riparian ecotourism area, Malang Regency, East Java, over the period 2015–2024. By integrating multi-temporal Landsat-derived NDVI analysis with supervised land use classification and landscape fragmentation metrics, an analytical framework that builds directly on established methodological practice in riparian remote sensing [7,8,15], this research provides a decade-scale, site-specific characterization of ecosystem transformation in this ecotourism corridor. The novelty of this study lies not in the individual methods employed, each of which is well established in the broader remote sensing literature, but in their integrated application to a previously unassessed, actively transforming tropical riparian ecotourism site, and in the resulting evidence base for local land management. This work leverages the computational accessibility afforded by cloud-based geospatial platforms [16], while responding to the scarcity of long-term, spatially explicit vegetation assessments in tropical riparian ecotourism settings specifically [1]. This study is guided by two central research questions: (RQ1) To what extent has agricultural intensification within an active community-based ecotourism corridor driven measurable vegetation loss and landscape fragmentation over a decade (2015–2024)? (RQ2) Does the Ledok Amprong riparian corridor exhibit a “riparian squeeze” paradox, whereby ecotourism development—intended as a conservation strategy—indirectly accelerates habitat degradation through associated agricultural encroachment? Based on documented land conversion trajectories across tropical riparian systems in Southeast Asia, we hypothesize that: (H1) vegetation cover will have declined by at least 20% over the study period, driven primarily by agricultural expansion; and (H2) landscape fragmentation indices (patch density, fragmentation index) will have increased significantly, while the connectivity index will have declined by a comparable magnitude, indicating ecologically meaningful habitat isolation. The general objective of this study is to establish the first decade-scale, spatially explicit assessment of vegetation dynamics and land cover change in the Ledok Amprong riparian ecotourism corridor, and to evaluate the consequences of observed landscape transformation for riparian ecosystem integrity and sustainable ecotourism governance. Specific objectives are: (1) to determine the magnitude and spatial pattern of vegetation density change within the Ledok Amprong riparian corridor over the 2015–2024 period; (2) to determine the extent and trajectory of land use and land cover change, particularly the conversion between agricultural and natural vegetation classes; (3) to establish the reliability of the resulting land cover classification through field-validated accuracy assessment; (4) to characterize the dominant pathways of land cover transition underlying observed vegetation loss; (5) to determine the extent of landscape fragmentation and connectivity loss associated with land cover change; (6) to identify the factors most strongly associated with the observed patterns of vegetation degradation; and (7) to translate the observed patterns of vegetation and landscape change into evidence-based management recommendations aligned with SDGs 6, 8, and 15. The findings are expected to contribute both to the scientific literature on tropical riparian landscape dynamics and to the practical needs of regional land managers navigating the conservation–ecotourism interface across rapidly urbanizing watersheds in Southeast Asia.

2. Materials and Methods

2.1. Study Area

The research was conducted in the Ledok Amprong riparian ecotourism area, Gubugklakah Village, Poncokusumo District, Malang Regency, East Java, Indonesia (coordinates: 8°01′55.5″ S 112°49′39.6″ E). The Amprong River is a tributary of the Brantas River, the second-longest river in Java and the primary freshwater source for Malang Regency’s 2.6 million residents. The study area covers 8.21 hectares at an altitude of 800–900 m above sea level. The climate is tropical monsoon (Köppen classification: Am), with a distinct dry season from June to September and a wet season from October to May; mean annual rainfall is 2200 mm/year, mean annual temperature is 22–24 °C, and mean relative humidity is 75–85%. Dominant soils are Andisols (volcanic andosols) derived from Bromo Tengger volcanic deposits, with high organic matter content (4–6%), good drainage, and a loamy texture, making them highly suitable for both smallholder agriculture and riparian vegetation establishment. The riparian vegetation is a mixed-canopy formation dominated by Ficus benjamina (weeping fig), Albizia chinensis (silk tree), Dendrocalamus asper and Phyllostachys spp. (bamboo), with understorey species including Piper aduncum, Heliconia spp., and a variety of pteridophytes along the waterline. Agricultural land use within and adjacent to the study area includes smallholder coffee (Coffea canephora) agroforestry, food crop cultivation (cassava, sweet potato, maize), and vegetable gardens (chilli, tomato, leafy vegetables). Community-managed ecotourism facilities include a bamboo pedestrian bridge, riverside viewing platforms, an amphitheatre seating area, food stalls, and a car park, which together generate an estimated 15,000–25,000 visitor-days per year.

2.2. Methodological Framework

The analytical workflow followed seven sequential stages, each with a defined input, processing step, and output that fed into the subsequent stage. (1) Data acquisition: Multi-temporal Sentinel-2 Level-2A surface reflectance imagery for August 2015 and July 2024 was retrieved for the 8.21 ha study extent, together with Landsat 8 OLI imagery for regional context and GNSS/GPS-based field reference points. (2) Pre-processing: Geometric correction against ground control points (RMSE < 0.5 pixels), radiometric and atmospheric quality checks, and cloud/cloud-shadow screening (<5% cover) were applied in ENVI 5.3 (L3Harris Geospatial Solutions, Boulder, CO, USA) and ArcGIS Pro 3.2 (Esri, Redlands, CA, USA) prior to analysis. (3) NDVI calculation: NDVI was computed from the Red (B4) and NIR (B8) bands for both dates and classified into four vegetation-density categories (very low, low, medium, high). (4) Land use/land cover classification: A supervised Maximum-Likelihood classifier was applied to delineate four classes (Agriculture, Vegetation, Open Land, River) for each date. (5) Accuracy assessment: The 2024 classification was validated against 400 stratified random field points and the 2015 classification against 320 historical reference points, generating the confusion matrix, Producer/User Accuracy, F1-score, Overall Accuracy, and the Kappa coefficient reported in Section 3.1. (6) Change detection and statistical analysis: Post-classification comparison quantified class-wise area change between 2015 and 2024, complemented by Pearson correlation and linear regression to test the relationship between agricultural expansion and vegetation loss. (7) Landscape metric evaluation and interpretation: FRAGSTATS (version 4.2, University of Massachusetts Amherst, Amherst, MA, USA) was used to derive patch density, edge density, the Shannon diversity index, the connectivity index, and the fragmentation index for both dates, and the combined spatial, statistical, and landscape-metric outputs were synthesised to formulate the evidence-based management recommendations presented in Section 4.4.

2.3. Data Acquisition and Pre-Processing

Multi-temporal Sentinel-2 Level-2A surface reflectance imagery (10 m spatial resolution) was acquired for August 2015 and July 2024 (dry season, cloud-free; cloud cover < 5%). Sentinel-2 MSI bands B4 (Red), B8 (NIR), B11, and B12 were selected for NDVI computation and land cover classification. The 10 m resolution yields approximately 820 image pixels for the 8.21 ha study area, exceeding the minimum 400-pixel threshold recommended for maximum-likelihood classification reliability [19]. Geometric correction ensured RMSE < 0.5 pixels against ground control points collected with a GNSS receiver (Garmin, Olathe, KS, USA; accuracy ±0.3 m). Field survey dates were deliberately scheduled to coincide with the Sentinel-2 image acquisition window (July 2024), minimizing the temporal gap between ground reference data collection and satellite overpass and thereby ensuring consistency between field-validated land cover conditions and the remotely sensed imagery used for classification. Image processing was performed using ENVI 5.3 (L3Harris Geospatial Solutions, Boulder, CO, USA) and ArcGIS Pro 3.2 (Esri, Redlands, CA, USA). For regional watershed context only, Landsat 8 OLI 30 m imagery was used to generate a regional spatial overview and is not used for primary classification or quantitative analysis. To control for inter-annual phenological variability, both acquisition dates were restricted to the dry season peak (July–August), when canopy phenology in tropical monsoon systems at 800–900 m a.s.l. is most stable and NDVI values are least affected by seasonal leaf flush or leaf senescence. The consistent phenological window minimises the risk of confounding decade-scale land cover change with intra-annual vegetation dynamics, consistent with best practice for multi-temporal NDVI comparisons in tropical highlands [13].

2.4. NDVI Analysis and Land Use Classification

NDVI was calculated using the standard formula, NDVI = (NIR − Red)/(NIR + Red), applying Sentinel-2 bands B8 (NIR, 842 nm) and B4 (Red, 665 nm). Vegetation density was classified into four categories: very low (<0.2), low (0.2–0.4), medium (0.4–0.6), and high (≥0.6). Supervised land cover classification employed the Maximum-Likelihood algorithm for four classes: Agriculture, Vegetation, Open Land, and River. Accuracy assessment for the 2024 classification used 400 independent validation points (100 per class) from stratified random field surveys in July–August 2024 using a Garmin GPSMap 66i GPS (Garmin International, Olathe, KS, USA; accuracy ±3 m). Stratified random sampling was selected to ensure proportional representation of each land cover class; within each stratum, points were distributed using a minimum nearest-neighbour distance constraint of 5 m (equivalent to 0.5 Sentinel-2 pixels) to prevent spatial autocorrelation among validation samples, following Olofsson et al. [20]. This yields a point density of approximately 48 points/ha across the 8.21 ha study area; although high, this density is necessary given the fine-grained spatial heterogeneity of a small riparian site with abrupt land cover boundaries. For 2015, 320 historical reference points were derived from very high-resolution Google Earth (Google LLC, Mountain View, CA, USA) imagery (≤1 m) cross-referenced with field records and farmer interviews [19]. Reported metrics include the full confusion matrix, Producer Accuracy (PA), User Accuracy (UA), F1-score, Overall Accuracy (OA), and Kappa coefficient with 95% confidence intervals. Area estimates for each land cover class are reported with 95% confidence intervals derived from the error-adjusted area estimation framework of Olofsson et al. [20], providing explicit uncertainty quantification for all hectarage change values.

3. Results

Results are presented in five stages that together answer RQ1 and RQ2 and test H1 and H2. Section 3.1 first establishes the reliability of the underlying land cover classification, since all subsequent change estimates depend on it. Section 3.2 characterises the 2024 spatial distribution of vegetation density as a baseline reference. Section 3.3 then quantifies the decade-scale (2015–2024) transition between land cover classes, directly addressing RQ1. Section 3.4 tests the statistical association between agricultural expansion and vegetation loss, and Section 3.5 quantifies the accompanying landscape fragmentation, jointly addressing H1 and H2 and providing the empirical basis for the paradox examined in Section 4.

3.1. Land Cover Classification Accuracy

The maximum-likelihood classification achieved high accuracy. Overall accuracy was 89.75% with a Kappa coefficient of 0.86. Individual class accuracy was Agriculture (PA: 87%, UA: 87%), Vegetation (92%/92%), Open Land (88%/88%), and Rivers (92%/92%), exceeding the minimum threshold of 85% (Table 1). Figure 1 shows the confusion matrix for accuracy assessment.

3.2. Spatial Distribution of Vegetation Density (NDVI Analysis)

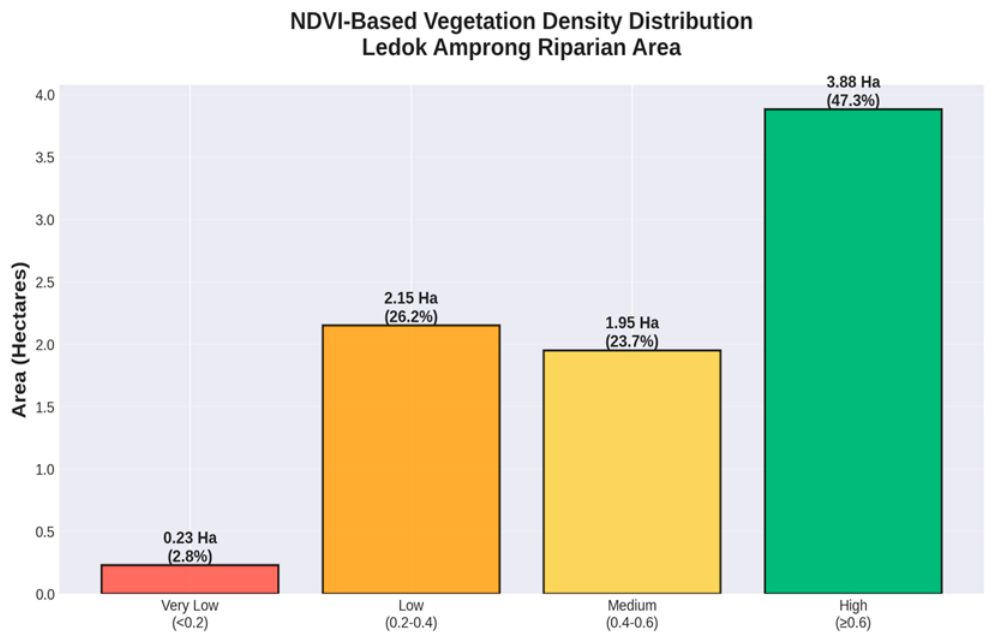
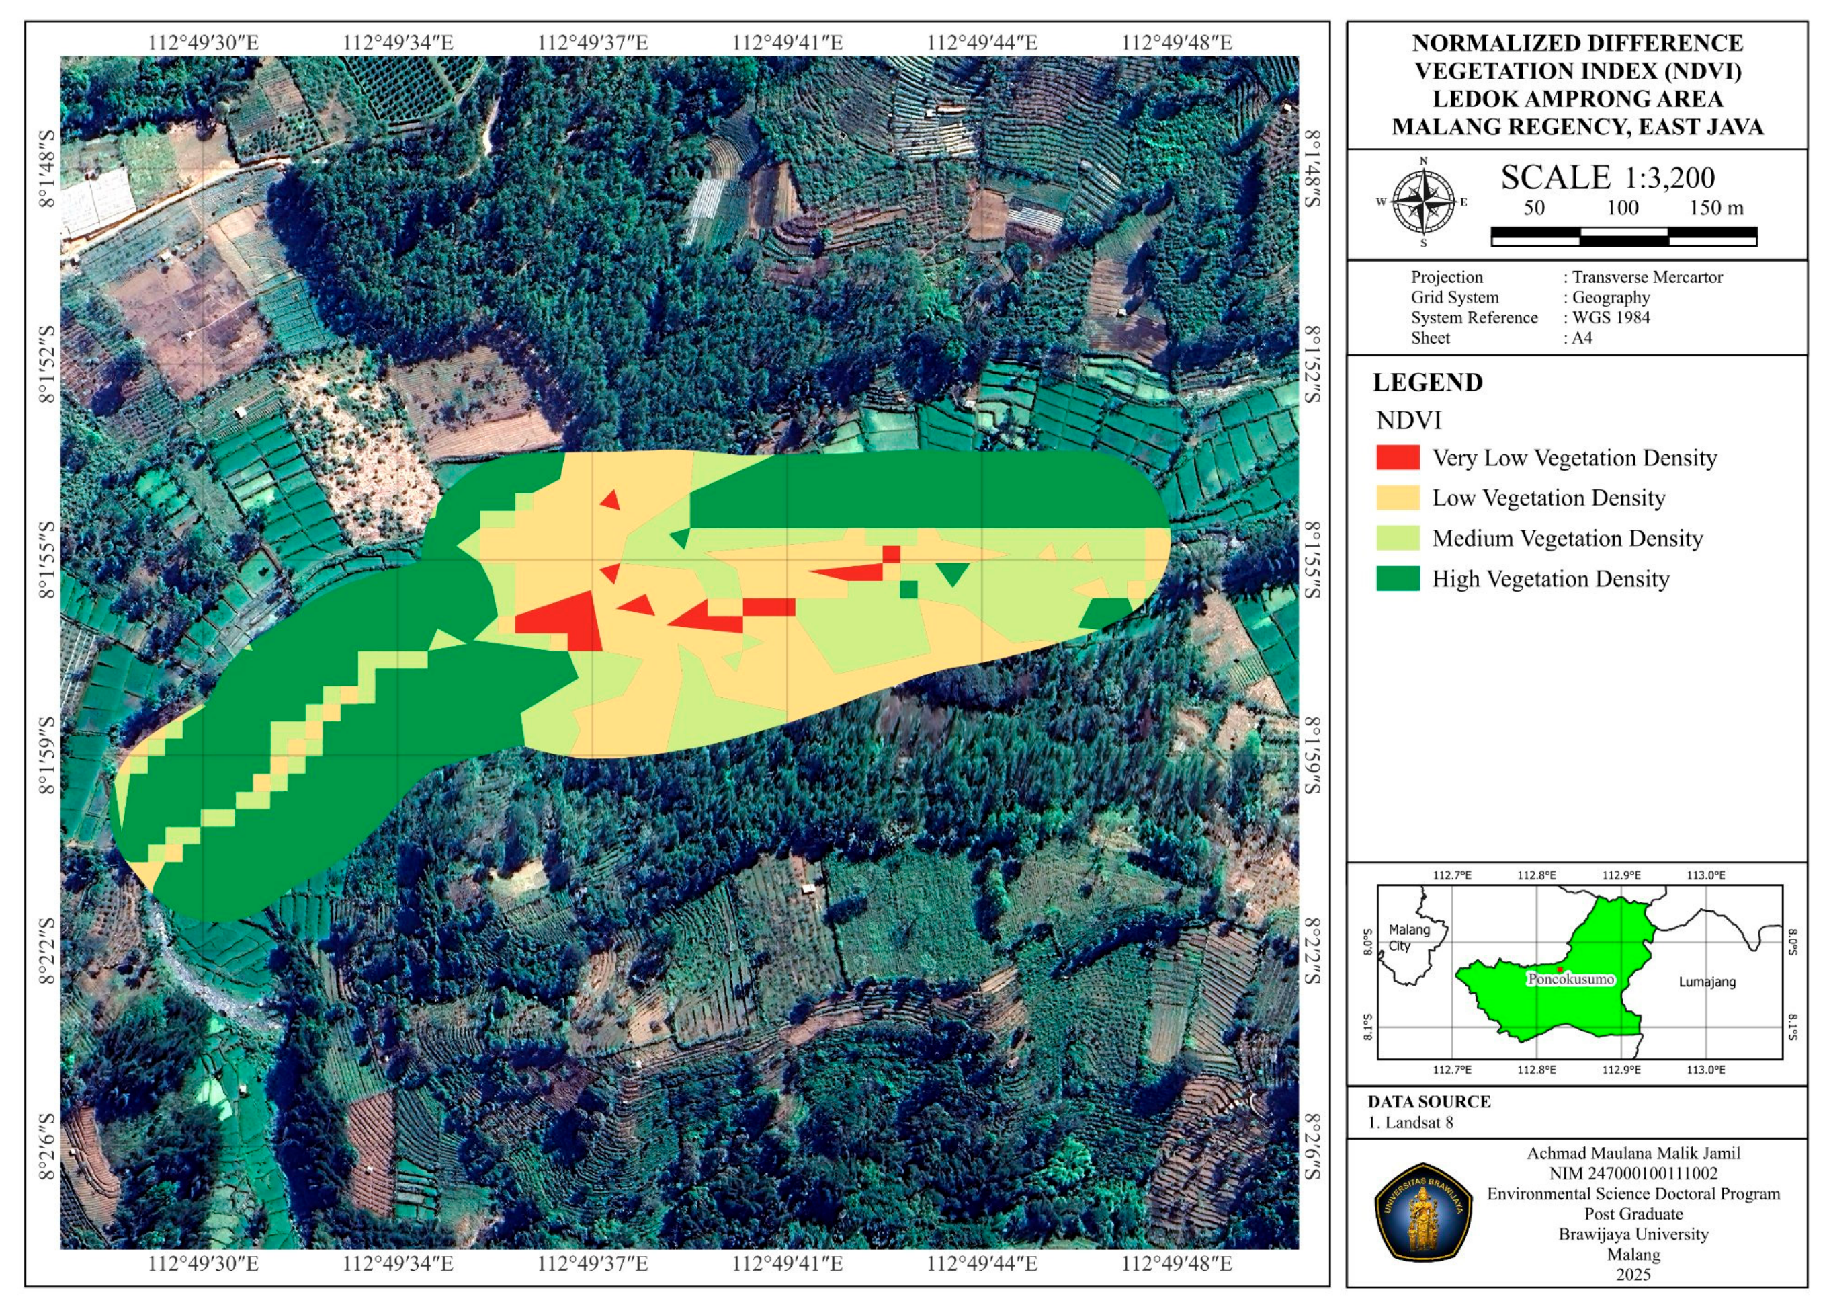
NDVI analysis reveals distinct spatial patterns of vegetation density. High density dominates the landscape (3.88 ha, 47.26%), particularly in the western and peripheral zones. Medium density covers 1.95 ha (23.73%), low density covers 2.15 ha (26.22%), and very low density covers 0.23 ha (2.80%), concentrated in agricultural land and built-up areas. Figure 2 and Figure 3 show the distribution and spatial map of vegetation density.
Figure 2 shows distribution of NDVI-based vegetation density with four categories: Very Low (<0.2), Low (0.2–0.4), Medium (0.4–0.6), and High (≥0.6). High-density vegetation dominates with 47.26% of the total area (Table 2).
The map shows a clear fragmentation pattern with high-density zones (green) concentrated at the periphery while the central area shows degradation.

3.3. Land Use and Land Cover Change (2015–2024)

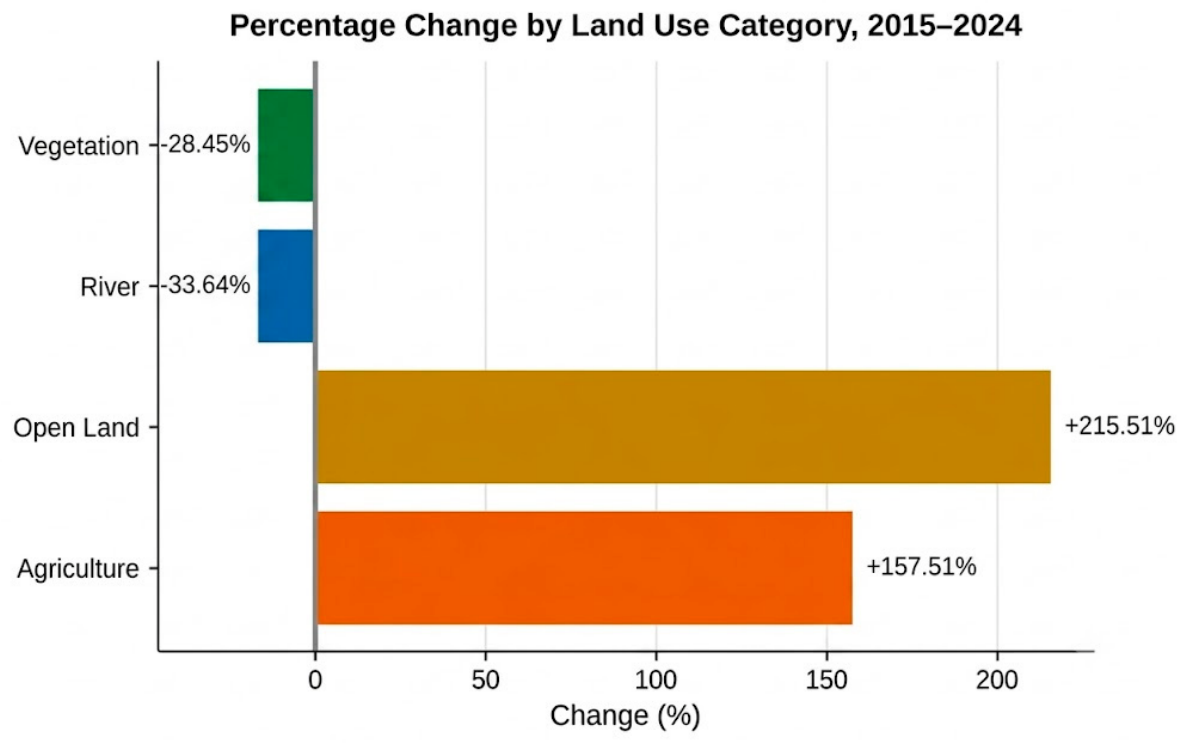
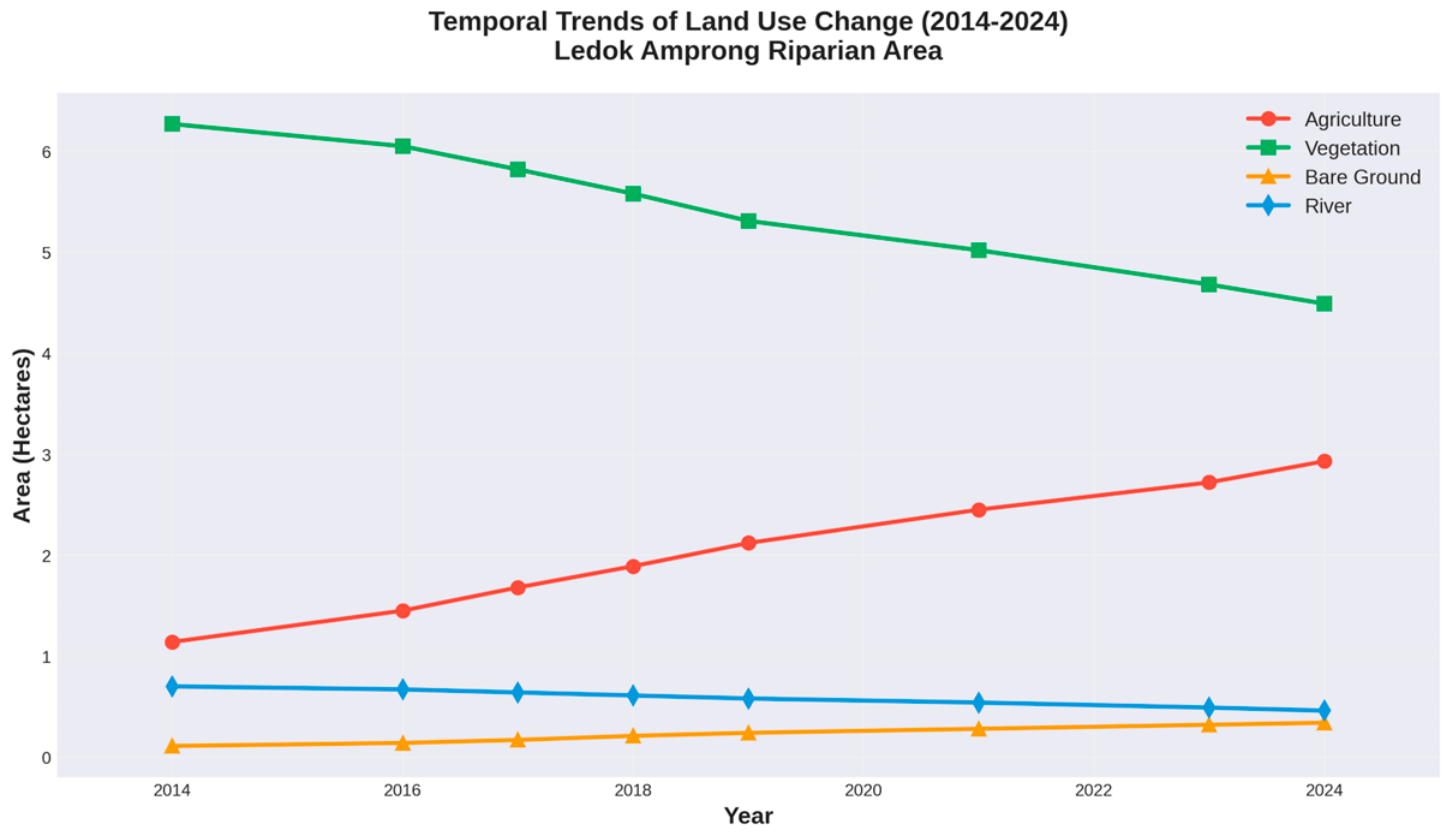
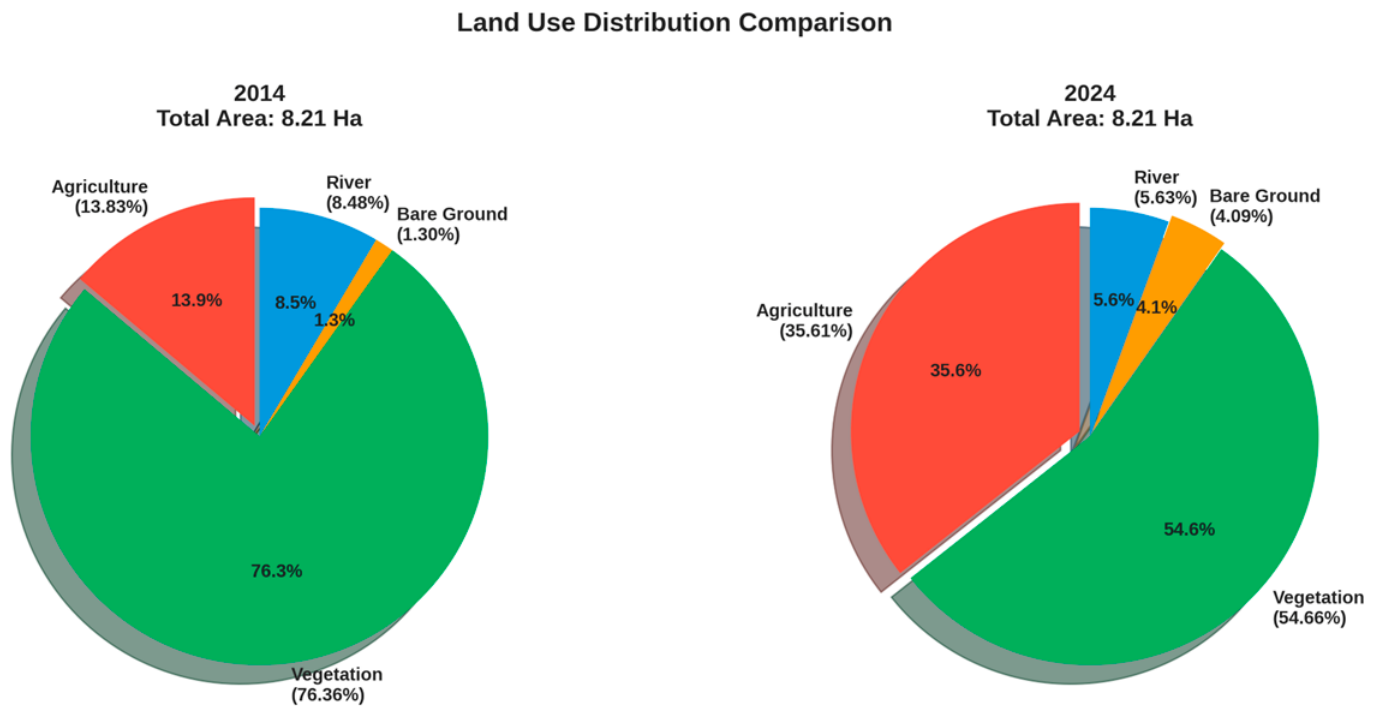
A comparative analysis between 2015 and 2024 reveals substantial landscape transformation. Agricultural land experienced a dramatic expansion of 157.51% (1.14 to 2.93 ha), vegetation cover decreased by 28.45% (6.27 to 4.49 ha), open land increased by 215.51% (0.11 to 0.34 ha), and river area decreased by 33.64% (0.70 to 0.46 ha) (Table 3). The 33.64% reduction in mapped river area reflects a combination of two processes: (i) physical channel narrowing due to sedimentation and riparian encroachment by agricultural plots, as documented in field observations showing active cultivation within 2–5 m of the Amprong channel bank, and (ii) partial spectral confusion at Sentinel-2 10 m resolution where narrow river sections (<10 m width) are mixed-pixel composites of water and adjacent vegetation or bare soil, causing some river pixels to be reclassified as Open Land or Agriculture following vegetation encroachment. These two mechanisms are therefore complementary and both indicative of riparian degradation rather than analytical artefact. Figure 4, Figure 5, Figure 6 and Figure 7 show temporal trends and comparisons of land use changes.
Figure 4 show dramatic agricultural expansion and a corresponding decline in vegetation. The lines represent the area (hectares) for the four land use categories tracked over the decade.
Figure 5 is shown as a pie chart. Left (2014): Vegetation 76.36%, Agriculture 13.89%, River 8.53%, Open Land 1.34% (sums to 100%, Table 3). Right (2024): Vegetation 54.66%, Agriculture 35.61%, River 5.60%, Open Land 4.14% (sums to 100%, Table 3).
Agriculture and Open Land show positive (increase) changes while Vegetation and Rivers show negative (decrease) changes. Agricultural expansion (+157.51%) is the dominant driver of transformation.
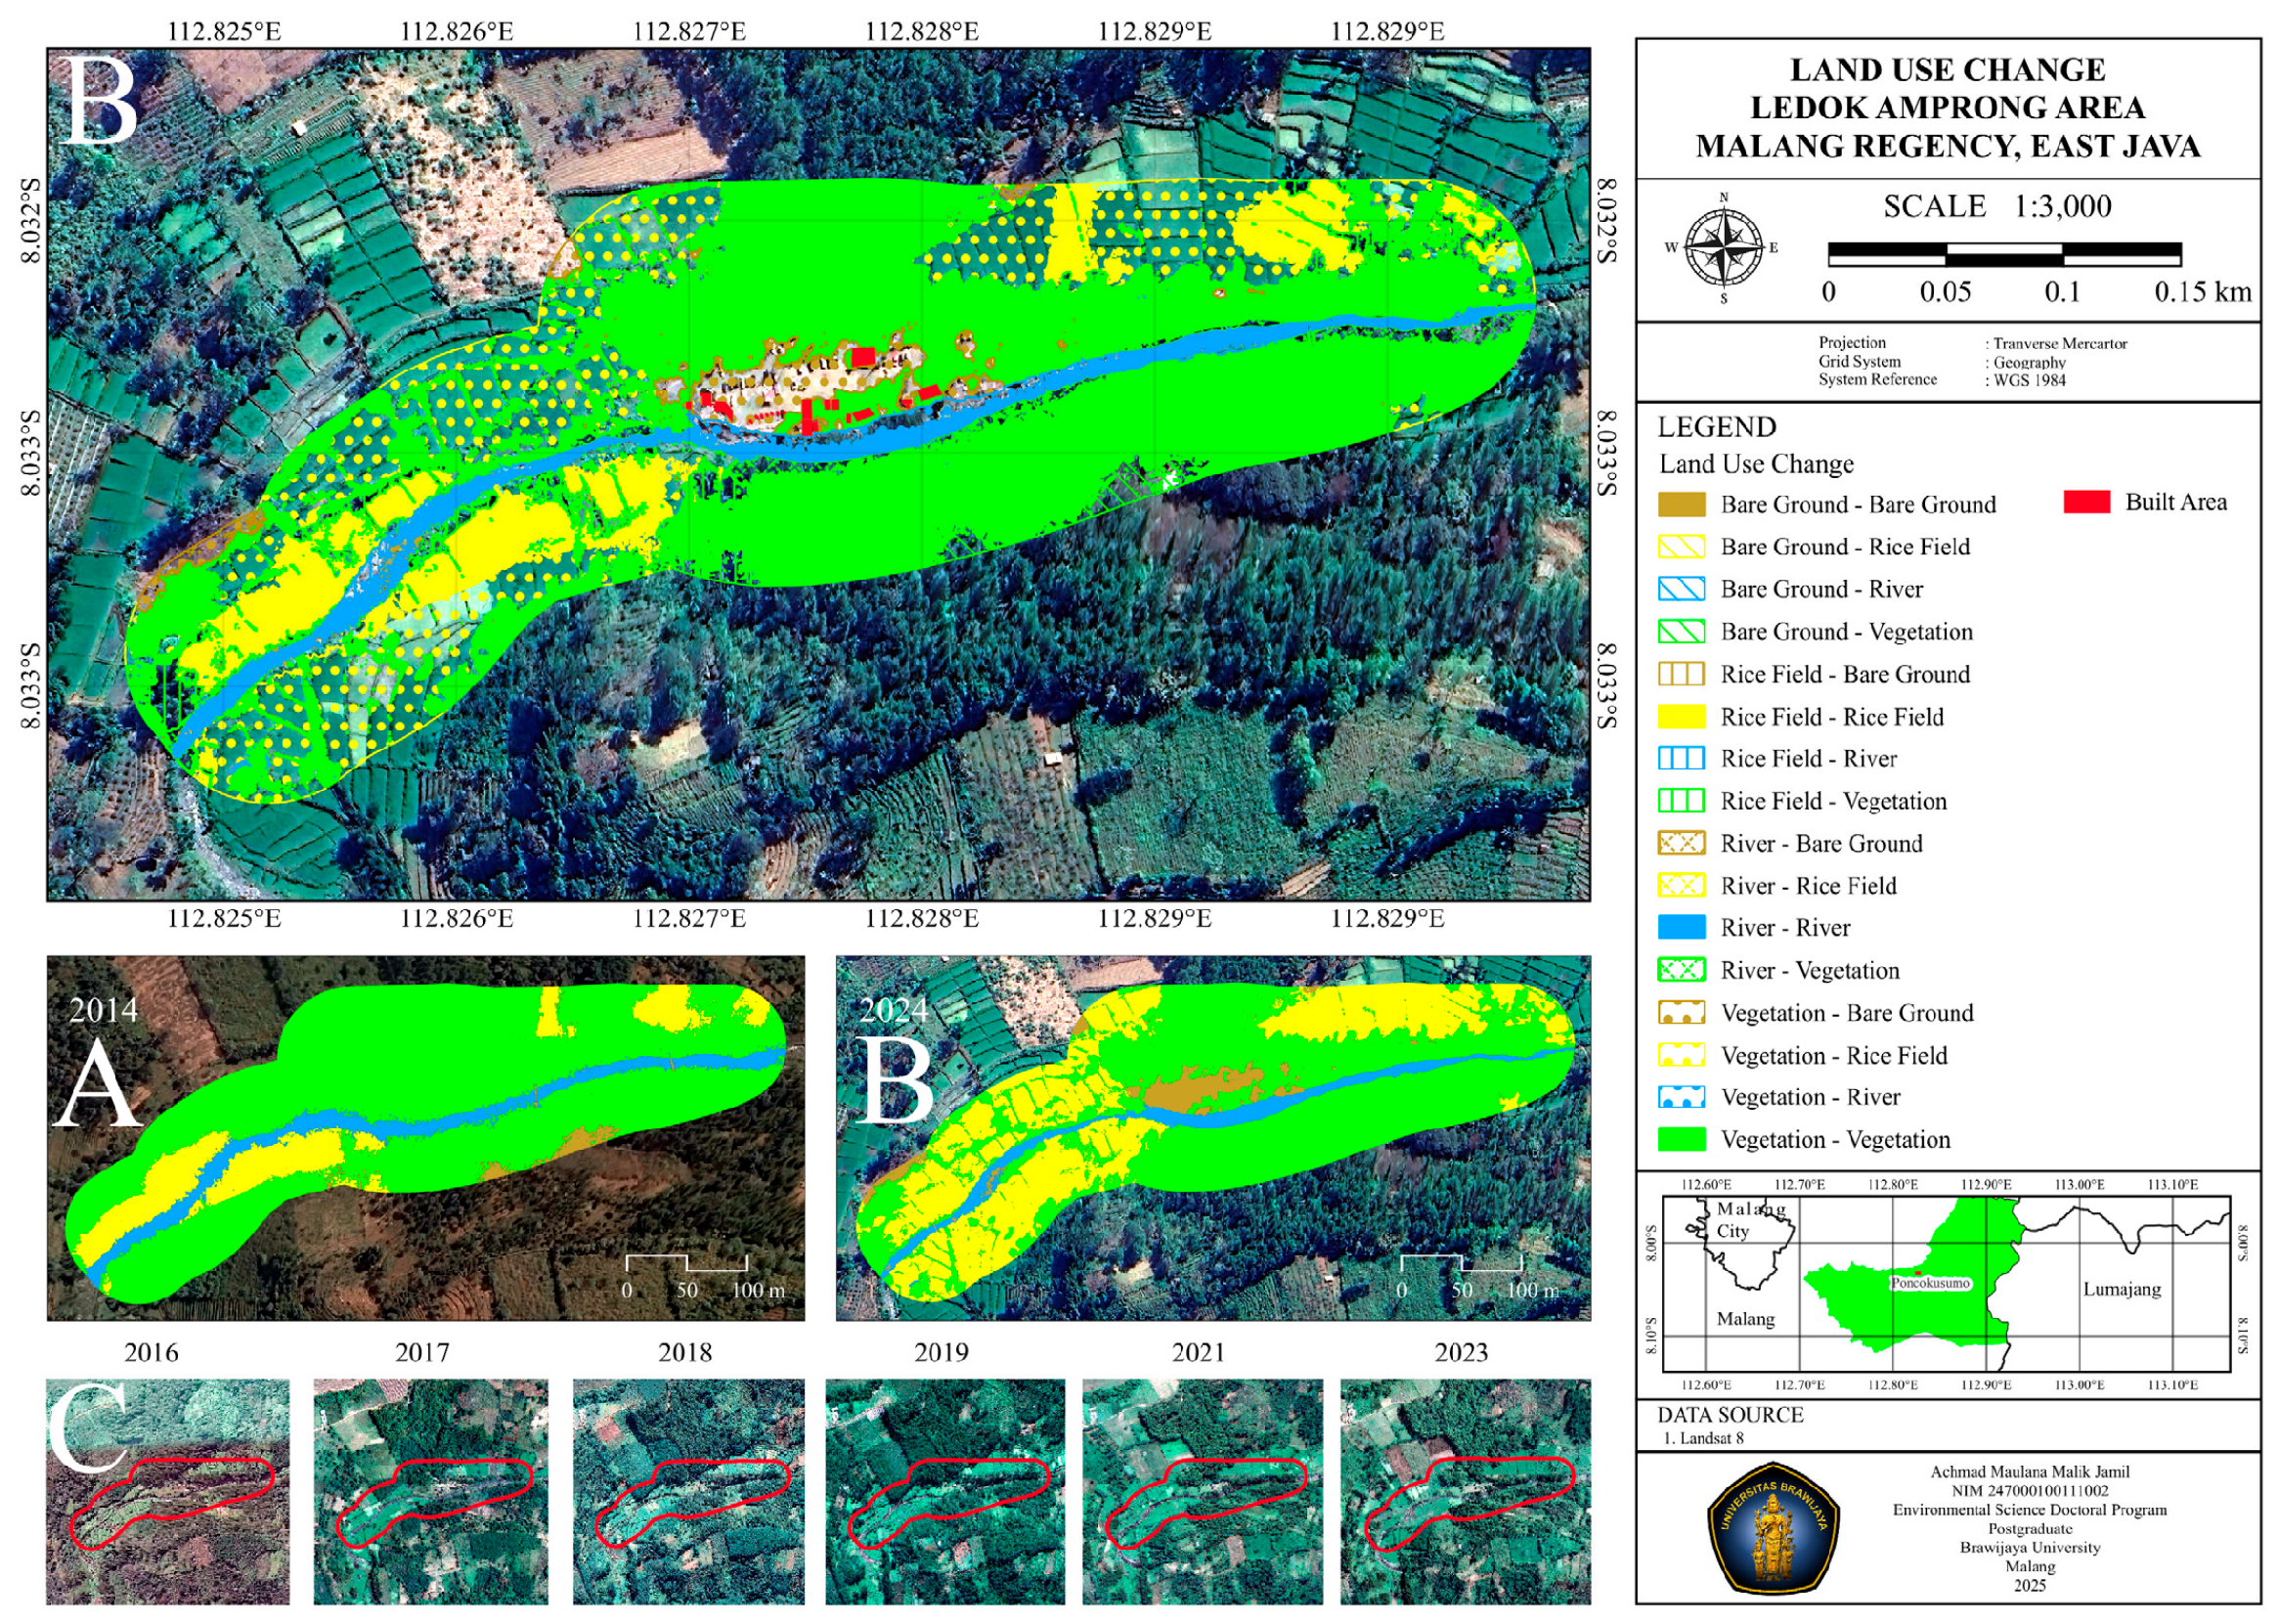
Figure 7 shows a detailed transition matrix. The main transitions include vegetation-to-agriculture conversion, open land-to-vegetation succession, and river channel dynamics.

3.4. Statistical Analysis of Land Use Drivers

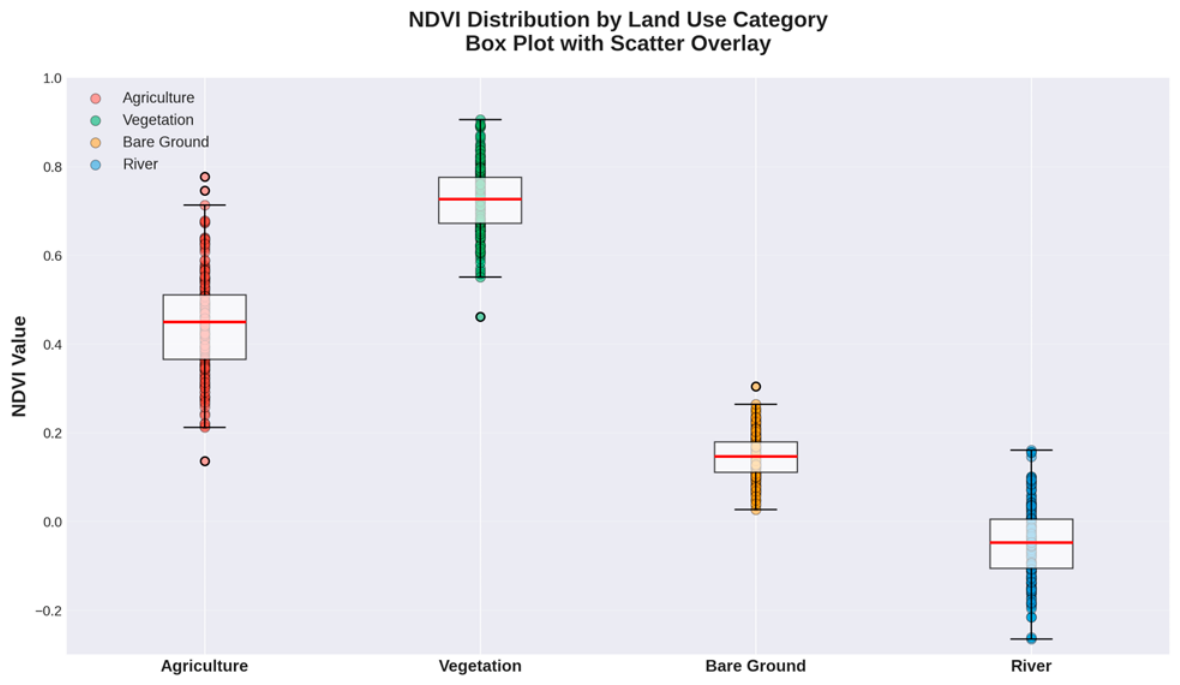
Statistical analysis revealed a strong negative correlation between agricultural expansion and vegetation decline (r = −0.96, p < 0.001). Linear regression analysis projected a sustained vegetation decline of 0.18 ha/year (R2 = 0.94, p < 0.001) in a business-as-usual scenario. Figure 8 shows the distribution of NDVI according to land use categories.
Figure 8 shows box plots with scatter points. Vegetation shows the highest NDVI value (mean: 0.72), followed by Agriculture (0.45), Open Land (0.15), and Rivers (−0.05). Box plots show the median, quartiles, and outliers for each category.

3.5. Landscape Fragmentation Metrics

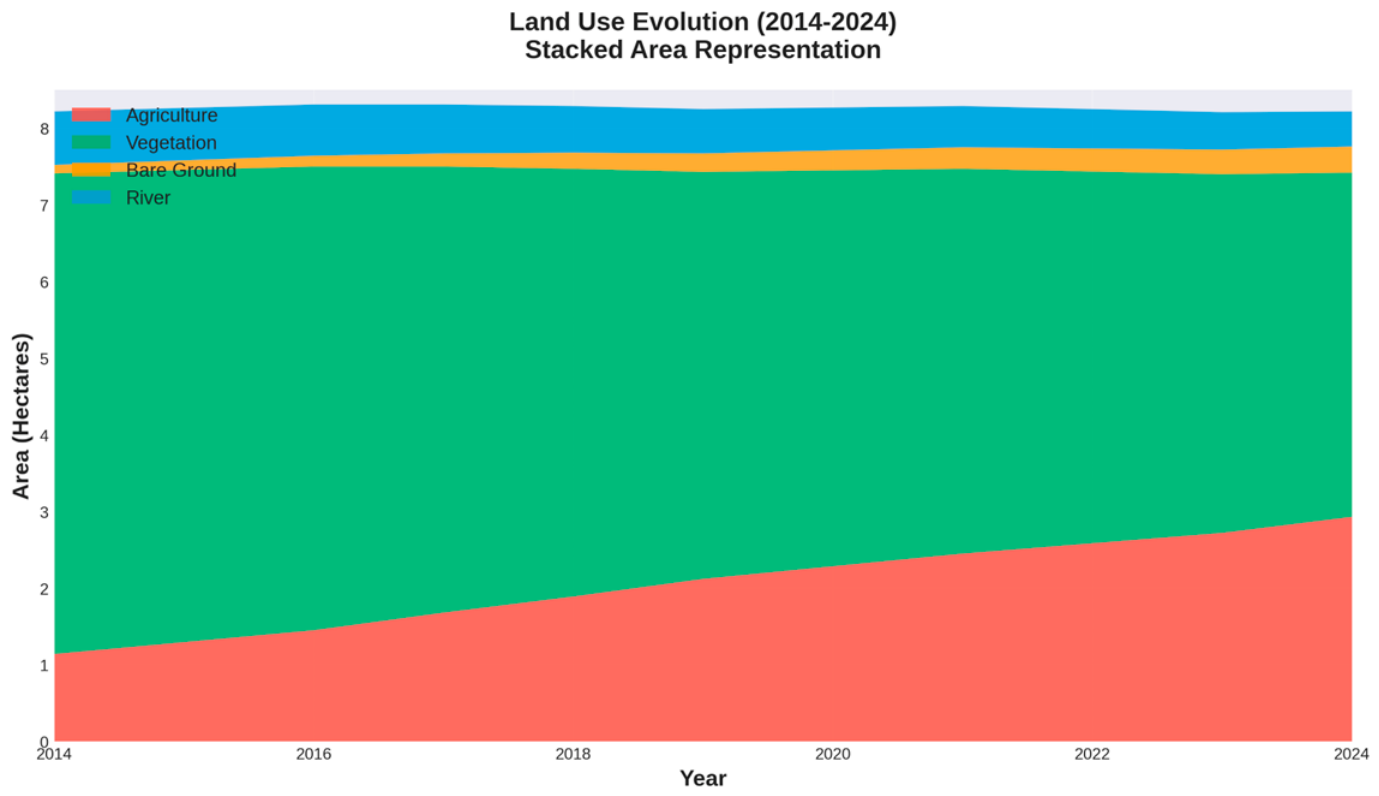
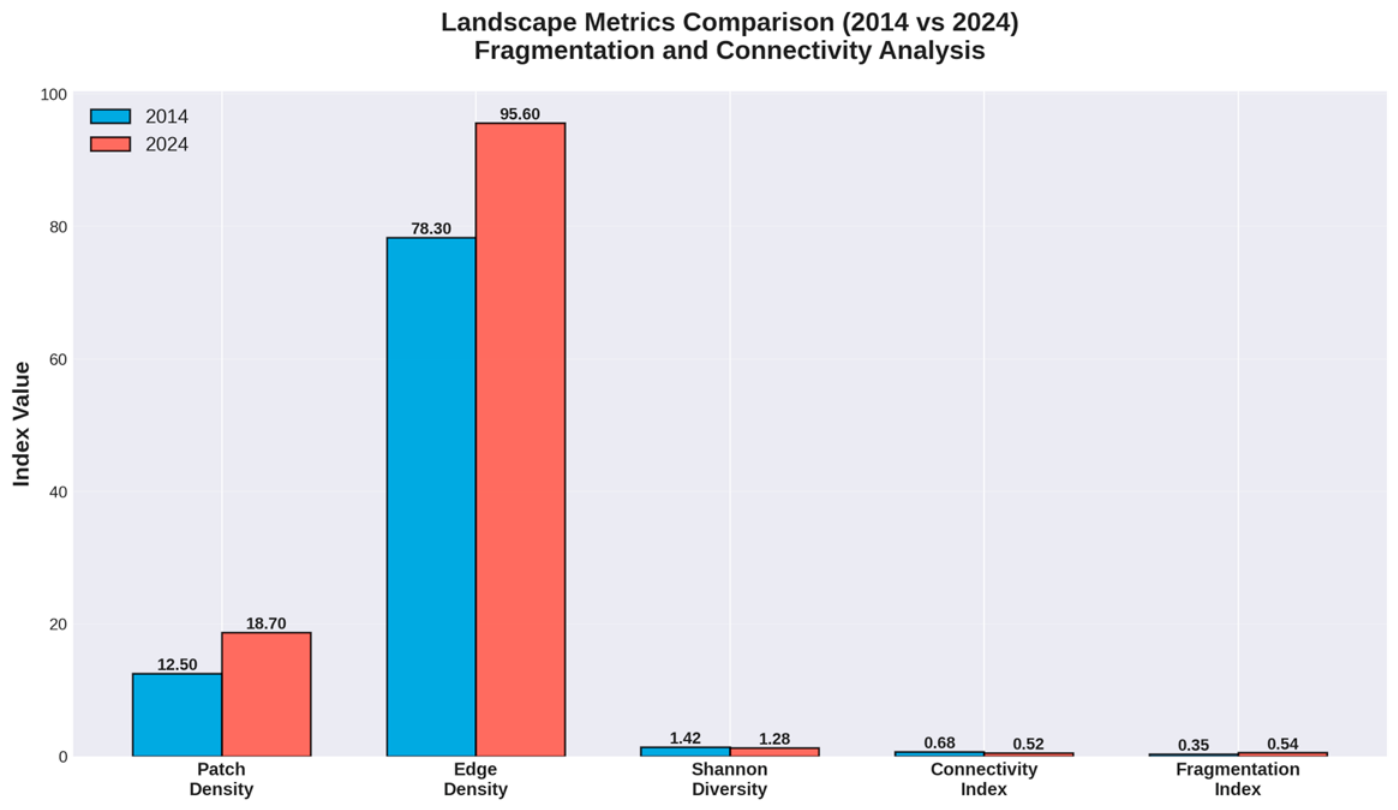
Landscape metric analysis documented alarming fragmentation trends. Patch density increased by 49.6% (12.5→18.7 patches/100 ha), edge density increased by 22.1% (78.3→95.6 m/ha), Shannon diversity index decreased by 9.9% (1.42→1.28), the connectivity index decreased by 23.5% (0.68→0.52), and the fragmentation index jumped by 54.3% (0.35→0.54). These metrics represent landscape-level composite values computed for the entire study area at each time point rather than repeated sample-based measurements, so conventional inferential tests were not applicable. Nonetheless, given the relatively high classification accuracy (Overall Accuracy = 89.75%, Kappa = 0.86; Section 3.1), the magnitude of change observed across all five metrics (22.1–54.3%) is unlikely to be fully attributable to classification error alone, providing indicative support that these changes reflect genuine landscape-level fragmentation rather than classification artefacts. Figure 9 and Figure 10 show a comparison of landscape metrics and land use evolution.
Figure 9 shows increased fragmentation and decreased connectivity. All metrics indicate ecosystem degradation: higher patch density (more fragments), increased edge density (more boundaries), reduced connectivity (disrupted movement), and increased fragmentation index.
Figure 10, represented as a stacked area graph, shows the cumulative composition over time. The visualization emphasizes the progressive replacement of vegetation (green) by agriculture (red), with the total area remaining constant at 8.21 hectares.

4. Discussion

4.1. Spatial Patterns of Vegetation Density and Ecological Implications

The pattern of spatially heterogeneous vegetation density reflects complex interactions between natural biophysical conditions, land management practices, and anthropogenic disturbances. The dominance of high-density vegetation (47.26%), especially along riparian corridors, indicates the persistence of relatively intact forested areas that provide critical ecosystem services. Pace et al. [21], through remote sensing-based assessment of riparian vegetation across multiple river reaches, demonstrate that remote sensing indicators of riparian vegetation including connectivity and lateral continuity are reliable proxies capable of reflecting the capacity of riparian zones to provide ecological functions, goods, and services, confirming that areas with structurally intact riparian buffers deliver measurable regulatory services to the river system. However, clear fragmentation indicates ongoing disturbance from agricultural expansion and tourism development. Huylenbroeck et al. [7] confirm that vegetation patterns in riparian zones are shaped by complex interactions between hydrology, geomorphology, soil characteristics, and disturbance regimes, and that this environmental heterogeneity makes riparian ecosystems simultaneously among the most biodiverse and most vulnerable to anthropogenic disturbance. Rusnák et al. [8] further emphasize that the spatial heterogeneity of riparian vegetation is an intrinsic characteristic of riparian zones formed by interactions between hydrology, geomorphology, and anthropogenic disturbances, making remote sensing-based monitoring the most efficient approach for periodically assessing the condition of these ecosystems.

4.2. Agricultural Expansion and the Ecotourism Paradox

Agricultural expansion of 157.51% is the dominant transformative force driven by population pressure, food security needs, and economic incentives. Mulyani et al. [22], through a national-scale geospatial assessment of agricultural land availability in Indonesia, demonstrate that of the 27.7 million hectares of suitable abandoned land for agricultural extensification, most are encumbered by concession permits or located within forest areas, leaving only 12.4 million hectares genuinely available—a structural constraint generating intense competition for marginal and riparian areas. A strong negative correlation (r = −0.96) confirms the direct conversion relationship between agriculture and vegetation. The growing ecotourism sector (20% of households) presents both opportunities and challenges. Critically, the “paradox” evoked in the study title—whereby community-based ecotourism development accelerates rather than mitigates habitat degradation—operates primarily through an indirect economic pathway: tourism income raises household purchasing power and labour opportunity costs, incentivising agricultural intensification on adjacent riparian slopes as complementary income diversification [23]. The statistical dominance of agriculture as the primary driver (r = −0.96) is therefore not in tension with the ecotourism paradox framing; it is its quantitative expression. Ecotourism infrastructure (trails, platforms, visitor facilities) contributes secondary fragmentation, while agricultural encroachment catalysed by ecotourism-driven income growth constitutes the primary fragmentation vector. This dual mechanism underscores the need for governance interventions that simultaneously target both pathways. Regarding local policy context, agricultural encroachment within legally protected riparian zones at Ledok Amprong constitutes a compliance failure under Government Regulation No. 38/2011 on Rivers (Peraturan Pemerintah No. 38 Tahun 2011 tentang Sungai), which mandates 10–15 m riparian buffer zones on small rivers, and East Java Provincial Regulation No. 5/2012 on Regional Spatial Planning, which designates riparian corridors as protected zones (kawasan sempadan sungai). The proposed MIM buffer zone framework provides Malang Regency authorities with a spatially explicit, NDVI-gradient-based enforcement mechanism under Law No. 26/2007 on Spatial Planning, thereby transforming existing regulatory obligations into actionable, remotely monitored management tools. Suyatna et al. [24], through a longitudinal case study of community-based tourism governance in rural Nglanggeran, Indonesia, demonstrate that community-led initiatives built around participatory governance of common resources can successfully alleviate chronic poverty and social problems by integrating local institutions and developing resource-based businesses, although recent government intervention has shown potential to limit community autonomy, underscoring the importance of maintaining genuine community agency in ecotourism governance frameworks. Juniyanti et al. [12] confirm that agricultural expansion in Indonesia is driven by a combination of interacting economic, institutional, and social factors, with local governments and smallholder farmers playing a dominant role in land conversion processes. Gaveau et al. [25] further demonstrate that the slowdown in deforestation rates in Indonesia correlates significantly with a decline in oil palm plantation expansion driven by crude palm oil price fluctuations, underscoring the central importance of commodity market instruments in controlling vegetation conversion.

4.3. Landscape Fragmentation and Connectivity Loss

Landscape fragmentation metrics provide quantitative evidence of severe ecosystem structural degradation. A 49.6% increase in patch density indicates progressive habitat subdivision, creating smaller and more isolated vegetation fragments. A 23.5% decrease in connectivity indicates disrupted functional connectivity for wildlife movement and gene flow, threatening long-term population viability and reducing ecosystem resilience. Fletcher et al. [26], through large-scale landscape experiments, confirmed that habitat fragmentation produces layered effects through reduced patch size and increased isolation, which synergistically exacerbate biodiversity loss. Riva & Fahrig [27] reinforce these findings by demonstrating that fragmentation at the landscape level consistently reduces gamma diversity, and increased beta-diversity among patches cannot compensate for this decline.

4.4. Management Recommendations

The spatiotemporal evidence generated by this study supports four concise, evidence-based management recommendations for the Ledok Amprong corridor, collectively termed the Multiscale Integrated Method (MIM). Each recommendation links directly to a specific finding of this study and is deliberately scoped for practical adoption by Malang Regency authorities and the local ecotourism cooperative.
MIM Component 1—Spatial Buffering and Dynamic Zonation. NDVI-derived vegetation-density mapping (Section 3.2) shows the sharpest decline concentrated within 10–15 m of the riverbank, adjacent to agricultural plots. A tiered buffer is therefore recommended: a 0–10 m Conservation Core (no agriculture or tourism infrastructure), a 10–20 m Ecological Transition zone (enrichment planting with Ficus benjamina, Albizia chinensis, and bamboo), and a 20–30 m Sustainable Use zone (regulated agroforestry and visitor access). Buffer width within each tier should scale with the local NDVI gradient, wider where the vegetation–agriculture transition is abrupt and narrower where it is gradual, consistent with evidence that buffer width and vegetation density jointly determine pollutant-filtering effectiveness [8,28]. Compliance can be verified annually via Sentinel-2/Landsat NDVI monitoring in Google Earth Engine, satisfying the riparian buffer requirements of Government Regulation No. 38/2011 and East Java Provincial Regulation No. 5/2012.
MIM Component 2—Evidence-Based Restoration. Given the 49.6% rise in patch density and 23.5% decline in connectivity documented in Section 3.5, restoration should prioritise reconnecting patches rather than restoring area alone. The 2.5 ha restoration target identified in this study should be allocated to the patches that contribute most to landscape connectivity (e.g., via a connectivity-index-based prioritisation in FRAGSTATS or Conefor), using assisted natural regeneration and enrichment planting. This connectivity-first approach is supported by evidence that reconnecting isolated fragments is among the most effective interventions for reversing fragmentation-driven biodiversity loss [29], and that natural regeneration is both cost-effective and biodiverse compared with conventional planting in tropical settings [30,31].
MIM Component 3—Participatory, Carrying-Capacity-Linked Ecotourism Governance. Because the ecotourism–agriculture pathway (Section 4.2) is the primary driver of degradation, visitor and infrastructure growth should be tied to the measured ecological condition rather than managed independently of it. We recommend an annually reviewed ecological carrying-capacity rule: visitor capacity is reduced when the 3-year rolling NDVI mean for the ecotourism zone falls below 0.45, and infrastructure expansion is paused when patch density exceeds 20 patches/100 ha. This should sit within a participatory governance structure, community cooperatives, revenue-sharing, and visitor education, since community-led, locally embedded governance has proven most effective at sustaining both livelihoods and habitat quality elsewhere in Indonesia [18,24].
MIM Component 4—Adaptive, Low-Cost Monitoring. A lightweight, cloud-based monitoring routine should track the core variables already used in this study, annual NDVI mean, patch density, connectivity index, and fragmentation index, on a semi-annual basis via Google Earth Engine, supplemented by periodic field checks of water quality and canopy cover. A simple composite score can flag when intervention is needed: values trending toward the 2024 baseline (Table 4) should trigger buffer-zone enforcement and restoration acceleration before thresholds comparable to those observed here are re-reached. This keeps management responsive to evidence rather than fixed to a static plan, addressing the monitoring gap identified across the wider riparian literature [2,4].
Together, these four components translate the study’s spatial and statistical findings directly into action: buffer zones respond to the observed NDVI gradient, restoration targets respond to the observed connectivity loss, governance responds to the observed ecotourism–agriculture pathway, and monitoring keeps all three accountable to future data. This offers a practical, low-cost template for other tropical riparian ecotourism corridors facing similar pressures.

5. Conclusions

This decade-long comprehensive assessment documents substantial spatiotemporal changes in vegetation dynamics and land use patterns in Ledok Amprong. NDVI analysis reveals high vegetation density of 47.26% with alarming fragmentation. Temporal analysis shows agricultural expansion of 157.51%, primarily through vegetation conversion of 28.45%. Classification accuracy of 89.75% (Kappa: 0.86) ensures the reliability of the results. Landscape metrics indicate severe fragmentation: patch density +49.6%, connectivity −23.5%, and fragmentation index +54.3%.
Linear regression projects a sustained vegetation loss of 0.18 ha/year under a business-as-usual scenario (R2 = 0.94, p < 0.001), suggesting that the current trajectory would eliminate all remaining high-density riparian vegetation within approximately 25 years. This study contributes to the global scientific understanding of the “ecotourism paradox” by providing the first decade-scale quantitative evidence that community-based ecotourism development, operating through an indirect economic pathway of agricultural intensification, can accelerate rather than mitigate riparian habitat degradation. This finding challenges the prevailing assumption that community ecotourism inherently delivers conservation co-benefits, and has transferable implications for tropical riparian ecotourism governance beyond the Indonesian context. The Multiscale Integrated Method (MIM) framework proposed in this study—integrating NDVI-gradient dynamic buffer zonation, graph-theoretic restoration prioritisation, and the Riparian Health Dashboard—offers a replicable, data-driven management architecture for tropical riparian ecotourism corridors facing similar governance challenges in Southeast Asia, South Asia, and Latin America [27].

Author Contributions

Conceptualization, A.M.M.J., S. (Soemarno), A. and S. (Surjono); methodology, A.M.M.J.; software, A.M.M.J.; validation, A.M.M.J., S. (Soemarno), A. and S. (Surjono); formal analysis, A.M.M.J.; investigation, A.M.M.J.; resources, A.M.M.J.; data curation, A.M.M.J.; writing—original draft preparation, A.M.M.J.; writing—review and editing, S. (Soemarno), A. and S. (Surjono); visualization, A.M.M.J.; supervision, S. (Soemarno), A. and S. (Surjono); project administration, A.M.M.J.; funding acquisition, A.M.M.J. All authors have read and agreed to the published version of the manuscript.

Funding

This research was funded by BPI, PPAPT Kemdiktisaintek, and LPDP. The authors would like to express their gratitude to BPI, PPAPT Kemdiktisaintek, and LPDP for the financial support provided, which made this research possible.

Data Availability Statement

The data used to support the findings of this study are available from the corresponding author upon reasonable request.

Acknowledgments

The authors would like to thank Brawijaya University for its institutional support, the local community of Poncokusumo District for field access, the Indonesian Meteorology, Climatology, and Geophysics Agency (BMKG) for climate data, and the USGS for providing Landsat data.

Conflicts of Interest

The authors declare no conflict of interest.

Abbreviations

ArcGISGeographic Information System software (Esri ArcGIS)
CIConnectivity Index
EDEdge Density
ENVIEnvironment for Visualizing Images
FIFragmentation Index
FRAGSTATSLandscape Spatial Pattern Analysis Software
GEEGoogle Earth Engine
haHectare
LULCLand Use/Land Cover
NDVINormalized Difference Vegetation Index
OLIOperational Land Imager
PAProducer Accuracy
PDPatch Density
PESPayment for Ecosystem Services
RBZRiparian Buffer Zone
RERiparian Ecosystem
R2Coefficient of Determination
rPearson Correlation Coefficient
RMSERoot Mean Square Error
SDGsSustainable Development Goals
SIShannon Index
UAUser Accuracy

References

  1. Davis, S.; Grainger, M.; Pfeifer, M.; Pattison, Z.; Stephens, P.; Sanderson, R. Restoring riparian habitats for benefits to biodiversity and human livelihoods: A systematic map protocol for riparian restoration approaches in the tropics. Environ. Evid. 2025, 14, 2. [Google Scholar] [CrossRef] [Scilit] [PubMed]
  2. Dinca, L.; Murariu, G.; Lupoae, M. Understanding the ecosystem services of riparian forests: Patterns, gaps, and global trends. Forests 2025, 16, 947. [Google Scholar] [CrossRef] [Scilit]
  3. Tockner, K.; Stanford, J.A. Riverine flood plains: Present state and future trends. Environ. Conserv. 2002, 29, 308–330. [Google Scholar] [CrossRef] [Scilit]
  4. Prado, R.B.; Damasceno, G.M.S.; Aquino, F.d.G. Overview of studies on ecosystem services in riparian zones: A systematic review. Acta Limnol. Bras. 2022, 34, e19. [Google Scholar] [CrossRef] [Scilit]
  5. Le, T.-A.T.; Vodden, K.; Wu, J.; Bullock, R.; Sabau, G. Payments for ecosystem services programs: A global review of contributions towards sustainability. Heliyon 2024, 10, e22361. [Google Scholar] [CrossRef] [Scilit] [PubMed]
  6. Izquierdo-Tort, S.; Jayachandran, S.; Saavedra, S. Redesigning payments for ecosystem services to increase cost-effectiveness. Nat. Commun. 2024, 15, 9252. [Google Scholar] [CrossRef] [Scilit] [PubMed]
  7. Huylenbroeck, L.; Laslier, M.; Dufour, S.; Georges, B.; Lejeune, P.; Michez, A. Using remote sensing to characterize riparian vegetation: A review of available tools and perspectives for managers. J. Environ. Manag. 2020, 267, 110652. [Google Scholar] [CrossRef] [Scilit]
  8. Rusnák, M.; Goga, T.; Michaleje, L.; Šulc Michalková, M.; Máčka, Z.; Bertalan, L.; Kidová, A. Remote Sensing of Riparian Ecosystems. Remote Sens. 2022, 14, 2645. [Google Scholar] [CrossRef] [Scilit]
  9. Parker, D.; Tosiani, A.; Yazid, M.; Sari, I.L.; Kartika, T.; Kustiyo; Firmansyah, R.; Said, Z.; Wijaya, A.; Potapov, P. Land in limbo: Nearly one third of Indonesia’s cleared old-growth forests left idle. Proc. Natl. Acad. Sci. USA 2024, 121, e2318029121. [Google Scholar] [CrossRef] [Scilit] [PubMed]
  10. Purnomo, S.; Nurmalitasari, N.; Nurchim, N. Digital transformation of MSMEs in Indonesia: A systematic literature review. J. Manag. Digit. Bus. 2024, 4, 301–312. [Google Scholar] [CrossRef] [Scilit]
  11. Higginbottom, T.P.; Collar, N.J.; Symeonakis, E.; Marsden, S.J. Deforestation dynamics in an endemic-rich mountain system: Conservation successes and challenges in West Java 1990–2015. Biol. Conserv. 2019, 229, 152–159. [Google Scholar] [CrossRef] [Scilit]
  12. Juniyanti, L.; Purnomo, H.; Kartodihardjo, H.; Prasetyo, L.B. Understanding the Driving Forces and Actors of Land Change Due to Forestry and Agricultural Practices in Sumatra and Kalimantan: A Systematic Review. Land 2021, 10, 463. [Google Scholar] [CrossRef] [Scilit]
  13. Pettorelli, N.; Vik, J.O.; Mysterud, A.; Gaillard, J.-M.; Tucker, C.J.; Stenseth, N.C. Using the satellite-derived NDVI to assess ecological responses to environmental change. Trends Ecol. Evol. 2005, 20, 503–510. [Google Scholar] [CrossRef] [Scilit] [PubMed]
  14. Tucker, C.J. Red and photographic infrared linear combinations for monitoring vegetation. Remote Sens. Environ. 1979, 8, 127–150. [Google Scholar] [CrossRef] [Scilit]
  15. Potapov, P.; Hansen, M.C.; Pickens, A.; Hernandez-Serna, A.; Tyukavina, A.; Turubanova, S.; Zalles, V.; Li, X.; Khan, A.; Stolle, F.; et al. The Global 2000-2020 Land Cover and Land Use Change Dataset Derived From the Landsat Archive: First Results. Front. Remote Sens. 2022, 3, 856903. [Google Scholar] [CrossRef] [Scilit]
  16. Gorelick, N.; Hancher, M.; Dixon, M.; Ilyushchenko, S.; Thau, D.; Moore, R. Google Earth Engine: Planetary-scale geospatial analysis for everyone. Remote Sens. Environ. 2017, 202, 18–27. [Google Scholar] [CrossRef] [Scilit]
  17. Baloch, Q.B.; Shah, S.N.; Iqbal, N.; Sheeraz, M.; Asadullah, M.; Mahar, S.; Khan, A.U. Impact of tourism development upon environmental sustainability: A suggested framework for sustainable ecotourism. Environ. Sci. Pollut. Res. 2023, 30, 5917–5930. [Google Scholar]
  18. Tang, X.; Wu, Y.; Ye, J.; Lv, H.; Sun, F.; Huang, Q. Ecotourism risk assessment in Yaoluoping Nature Reserve, Anhui, China based on GIS. Environ. Earth Sci. 2022, 81, 204. [Google Scholar] [CrossRef] [Scilit]
  19. Congalton, R.G.; Green, K. Assessing the Accuracy of Remotely Sensed Data: Principles and Practices, 3rd ed.; CRC Press: Boca Raton, FL, USA, 2019. [Google Scholar]
  20. Olofsson, P.; Foody, G.M.; Herold, M.; Stehman, S.V.; Woodcock, C.E.; Wulder, M.A. Good practices for estimating area and assessing accuracy of land change. Remote Sens. Environ. 2014, 148, 42–57. [Google Scholar] [CrossRef] [Scilit]
  21. Pace, G.; Gutiérrez-Cánovas, C.; Henriques, R.; Carvalho-Santos, C.; Cássio, F.; Pascoal, C. Remote sensing indicators to assess riparian vegetation and river ecosystem health. Ecol. Indic. 2022, 144, 109519. [Google Scholar] [CrossRef] [Scilit]
  22. Mulyani, A.; Mulyanto, B.; Barus, B.; Panuju, D.R.; Husnain. Potential Land Reserves for Agriculture in Indonesia: Suitability and Legal Aspect Supporting Food Sufficiency. Land 2023, 12, 970. [Google Scholar] [CrossRef] [Scilit]
  23. Achmad, B.; Sanudin; Siarudin, M.; Widiyanto, A.; Diniyati, D.; Sudomo, A.; Hani, A.; Fauziyah, E.; Suhaendah, E.; Widyaningsih, T.S. Traditional subsistence farming of smallholder agroforestry systems in Indonesia: A review. Sustainability 2022, 14, 8631. [Google Scholar] [CrossRef] [Scilit]
  24. Suyatna, H.; Indroyono, P.; Yuda, T.K.; Firdaus, R.S.M. How Community-based Tourism Improves Community Welfare? A Practical Case Study of ‘Governing the Commons’ in Rural Nglanggeran, Indonesia. Int. J. Community Soc. Dev. 2024, 6, 77–96. [Google Scholar] [CrossRef] [Scilit]
  25. Gaveau, D.L.A.; Locatelli, B.; Salim, M.A.; Husnayaen; Manurung, T.; Descals, A.; Angelsen, A.; Meijaard, E.; Sheil, D. Slowing deforestation in Indonesia follows declining oil palm expansion and lower oil prices. PLoS ONE 2022, 17, e0266178. [Google Scholar] [CrossRef] [Scilit] [PubMed]
  26. Fletcher, R.J.; Smith, T.A.H.; Kortessis, N.; Bruna, E.M.; Holt, R.D. Landscape experiments unlock relationships among habitat loss, fragmentation, and patch-size effects. Ecology 2023, 104, e4037. [Google Scholar] [CrossRef] [Scilit] [PubMed]
  27. Riva, F.; Fahrig, L. Landscape-scale habitat fragmentation is positively related to biodiversity, despite patch-scale ecosystem decay. Ecol. Lett. 2023, 26, 268–277. [Google Scholar] [CrossRef] [Scilit] [PubMed]
  28. Wu, S.; Bashir, M.A.; Raza, Q.-U.-A.; Rehim, A.; Geng, Y.; Cao, L. Application of riparian buffer zone in agricultural non-point source pollution control—A review. Front. Sustain. Food Syst. 2023, 7, 985870. [Google Scholar]
  29. Haddad, N.M.; Brudvig, L.A.; Clobert, J.; Davies, K.F.; Gonzalez, A.; Holt, R.D.; Lovejoy, T.E.; Sexton, J.O.; Austin, M.P.; Collins, C.D. Habitat fragmentation and its lasting impact on Earth’s ecosystems. Sci. Adv. 2015, 1, e1500052. [Google Scholar] [CrossRef] [Scilit] [PubMed]
  30. Williams, B.A.; Beyer, H.L.; Fagan, M.E.; Chazdon, R.L.; Schmoeller, M.; Sprenkle-Hyppolite, S.; Griscom, B.W.; Watson, J.E.M.; Tedesco, A.M.; Gonzalez-Roglich, M.; et al. Author Correction: Global potential for natural regeneration in deforested tropical regions. Nature 2025, 637, E9. [Google Scholar] [CrossRef] [Scilit] [PubMed]
  31. Werden, L.K.; Zarges, S.; Holl, K.D.; Oliver, C.L.; Oviedo-Brenes, F.; Rosales, J.A.; Zahawi, R.A. Assisted restoration interventions drive functional recovery of tropical wet forest tree communities. Front. For. Glob. Change 2022, 5, 935011. [Google Scholar] [CrossRef] [Scilit]
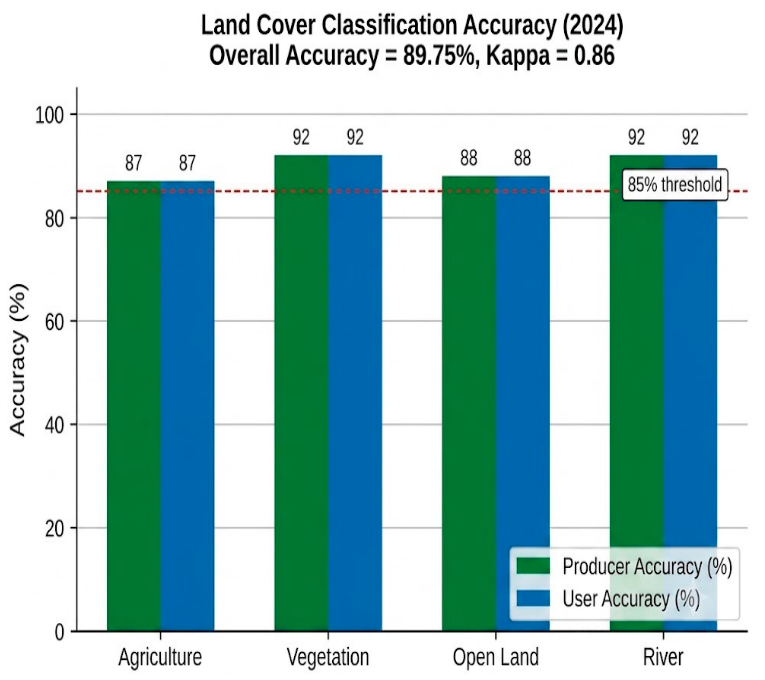
Figure 1. Confusion matrix for land use classification accuracy assessment showing Producer and User Accuracy for four categories. Overall Accuracy: 89.75%, Kappa coefficient: 0.86, indicating excellent classification performance.
Ecologies 07 00072 g001
Figure 2. NDVI-Based Vegetation Density Distribution, Ledok Amprong, field survey data, 2024. Source: Sentinel-2 (10 m resolution) NDVI Analysis, 2024.
Ecologies 07 00072 g002
Figure 3. Spatial distribution of NDVI-classified vegetation density in the Ledok Amprong riparian area (2024). High-density zones (green) are concentrated at the corridor periphery; the central degradation zone (low to very low NDVI, 0.15–0.35) corresponds spatially to ecotourism infrastructure elements (visitor access pathway, parking area, bamboo seating platforms) and the adjacent agricultural expansion front. Priority restoration zones are indicated with hatching overlays. Data source: Landsat 8 OLI, 2024.
Ecologies 07 00072 g003
Figure 4. Temporal trends in land use change (2014–2024).
Ecologies 07 00072 g004
Figure 5. Comparison of land use distribution between 2014 and 2024.
Ecologies 07 00072 g005
Figure 6. Percentage change by land use category (2014–2024).
Ecologies 07 00072 g006
Figure 7. Spatiotemporal pattern of land use and land cover change in the Ledok Amprong riparian corridor. (A) Land cover classification map for 2015; (B) land cover classification map for 2024; (C) change detection map showing land cover transitions 2015–2024. The largest panel (B) corresponds to 2024. Data source: Landsat 8 time series.
Ecologies 07 00072 g007
Figure 8. Distribution of NDVI by land use category.
Ecologies 07 00072 g008
Figure 9. Comparison of landscape metrics (2014 vs. 2024).
Ecologies 07 00072 g009
Figure 10. Land use area composition (2014–2024). [REVISED: Original AI-generated figure replaced with original stacked area chart produced in R v4.3.1 using ggplot2 v3.4.2; legend repositioned to the right-hand side of the figure for improved readability].
Ecologies 07 00072 g010
Table 1. Results of Land Use Classification Accuracy Assessment 2024.
Land Use ClassProducer Accuracy (%)User Accuracy (%)Description
Agriculture8787Very Good
Vegetation9292Very Good
Open Land8888Very Good
River9292Very Good
Overall Accuracy89.75Kappa: 0.86
Source: Research Data Analysis, 2024.
Table 2. Distribution of Vegetation Density Based on NDVI Analysis.
Density CategoryNDVI RangeArea (ha)Percentage (%)
Very Low<0.20.232.80
Low0.2–0.42.1526.22
Moderate0.4–0.61.9523.73
High≥0.63.8847.26
TOTAL8.21100.00
Source: Landsat 8 OLI NDVI Analysis, 2024.
Table 3. Land Use Changes for the Period 2014–2024.
Land Use2014 (ha)2024 (ha)Change (ha)Change (%)
Agriculture1.142.93+1.79+157.51
Vegetation6.274.49−1.78−28.45
Open Land0.110.34+0.23+215.51
River0.700.46−0.24−33.64
TOTAL8.218.210.00-
Source: Analysis of Land Use Change Landsat 8, 2014–2024.
Table 4. Changes in Landscape Metrics for the 2014–2024 Period.
Landscape Metrics20142024ChangeInterpretation
Patch Density (patches/100 ha)12.518.7+49.6%Fragmentation
Edge Density (m/ha)78.395.6+22.1%Edge Effect
Shannon Index1.421.28−9.9%Diversity Decrease
Connectivity Index0.680.52−23.5Isolation
Fragmentation Index0.350.54+54.3%Degradation
Source: FRAGSTATS Landsat 8 analysis, 2014–2024.
Disclaimer/Publisher’s Note: The statements, opinions and data contained in all publications are solely those of the individual author(s) and contributor(s) and not of MDPI and/or the editor(s). MDPI and/or the editor(s) disclaim responsibility for any injury to people or property resulting from any ideas, methods, instructions or products referred to in the content.