Article

Prestress Loss and Bi-Directional Prestress Effect of a Large-Span U-Shaped Aqueduct: Field Test and Numerical Analysis

1
Power China Chengdu Engineering Corporation Limited, Chengdu 611130, China
2
Department of Bridge Engineering, School of Civil Engineering, Southwest Jiaotong University, Chengdu 610031, China
3
State Key Laboratory of Bridge Intelligent and Green Construction, Southwest Jiaotong University, Chengdu 611756, China
*
Author to whom correspondence should be addressed.
Eng 2026, 7(5), 239; https://doi.org/10.3390/eng7050239
Submission received: 20 April 2026 / Revised: 9 May 2026 / Accepted: 12 May 2026 / Published: 14 May 2026
(This article belongs to the Topic Hydraulic Engineering and Modelling)

Abstract

Prestress loss and bi-directional prestress effects are critical design parameters that determine the bearing capacity of large-span U-shaped aqueducts. Based on a 42 m span simply supported U-shaped aqueduct, the pipeline friction coefficients were tested through least-squares fitting and validated against a finite element analysis model. The results revealed pipeline friction induced 4.82–5.08% longitudinal and 35.84–39.23% circumferential prestress loss, with 12-month post-tensioning monitoring showing 9.84% (longitudinal) and 3.15% (circumferential) long-term loss. Maximum concrete compressive stresses reached 5.83 MPa (inner wall) and 7.14 MPa (outer wall) under empty groove conditions. Six prestress tensioning sequences were numerically compared to identify the optimal “both ends to center” circumferential tensioning scheme. The prestressed tendon layout was optimized by increasing circumferential tendon spacing from 40 cm to 60 cm while maintaining global compression. This research provides a systematic framework for prestress optimization in curved concrete structures.

1. Introduction

U-shaped aqueducts are common irrigation structures, and prestress is usually introduced to enhance their bending capacity when the span is large (Zhang, 2020) [1]. The safety and long-term serviceability of aqueduct structures are closely related to the stress level of concrete. In particular, prestress loss has a direct influence on the effective prestress and consequently affects the overall stress state and crack resistance of the aqueduct. Therefore, accurate evaluation of prestress loss and concrete stress in U-shaped aqueducts is of both theoretical significance and practical engineering value.
Prestress loss in post-tensioned concrete members is affected by several factors, including tendon–duct friction, duct deviation, anchorage slip, elastic shortening of concrete, shrinkage and creep of concrete, relaxation of prestressing steel, and temperature variation. Among these factors, friction loss and duct deviation are especially important for members with curved or spatially arranged tendons. Previous studies have proposed analytical, experimental, and numerical methods to evaluate prestress loss. For example, based on the age-adjusted effective modulus method, Pablo M. Páez (2026) [2] proposed a set of closed-form equations to estimate the prestress loss in prestressed composite concrete girders made up of a concrete girder and a cast in situ concrete deck slab with internal unbonded tendons. Thushara Pushkaran and Siddhartha Ghosh (2026) [3] propose a novel Bayesian framework in using the strain/displacement data from pressure tests to estimate the prestress loss. Xiao et al. (2024) [4] developed a calculation method for prestress in segmented beams based on static equilibrium theory. Zhang et al. (2016) [5] proposed an optimized fitting algorithm for duct friction coefficients based on the gauge formula. Kim and Park (2019) [6] established a dual-method framework for friction coefficient evaluation by combining least-squares estimation and Bayesian quantile regression. Yao and Ma (2023) and Zhu et al. (2021) [7,8] investigated prestress loss distribution in full-length members using embedded strain gauges in prestressing strands. These studies provide useful references for evaluating prestress loss in post-tensioned concrete structures.
For aqueduct engineering, the structural stress state is influenced not only by prestress loss but also by the geometric characteristics of the U-shaped section, the tendon layout, and the tensioning sequence. Xie et al. (2024), Bonopera et al. (2020), and Zhang et al. (2019) [9,10,11] analyzed the mechanical behavior of U-shaped aqueducts and investigated prestress variation in large-span aqueduct structures. In recent years, several prestress detection methods have also been applied in engineering practice. According to the Chinese specification JTG/T 3650-2020 [12], grouting is generally required to be completed within a specified period after tendon tensioning, and the short-term prestress loss before grouting may be significantly affected by friction, temperature variation, concrete deformation, and construction quality. Therefore, field tests are necessary to obtain reliable stress data and to evaluate the actual prestress state of aqueduct structures.
Numerical simulation is also an effective tool for analyzing the stress distribution of aqueduct structures. Tao et al. (2021) and Biswal and Ramaswamy (2016) [13,14] developed refined finite element models to analyze longitudinal and transverse stress distributions in aqueducts. Wang et al. (2022) [15] investigated the structural response of large U-shaped aqueducts under different operating conditions through scaled model tests. However, numerical simulations are often based on idealized assumptions regarding boundary conditions, material properties, and tendon tensioning procedures. In actual construction, factors such as tendon tensioning sequence, grouting time, and construction quality may significantly affect the stress distribution of the structure. Therefore, combining field measurements with finite element simulation is necessary to better understand the prestress loss mechanism and structural response of U-shaped aqueducts.
This study systematically investigates the prestress loss mechanism and stress response optimization of a U-shaped aqueduct using an integrated experimental–numerical approach. First, short-term and long-term prestress losses of bi-directional post-tensioned tendons are quantified based on field test data, and the duct friction coefficient is calibrated through least-squares regression. Then, stress–time history curves of the inner and outer walls at representative sections are obtained from measured data to evaluate the concrete stress evolution. A finite element model is developed using FEA/NX and validated against the field measurements. Based on the validated model, parametric analyses are conducted to evaluate the influence of tendon tensioning sequences on stress distribution. Finally, an optimized prestressing tendon arrangement is proposed to improve the compressive stress state of the aqueduct while reducing transverse tensile stresses at the end sections.

2. Field Test of Prestress Loss

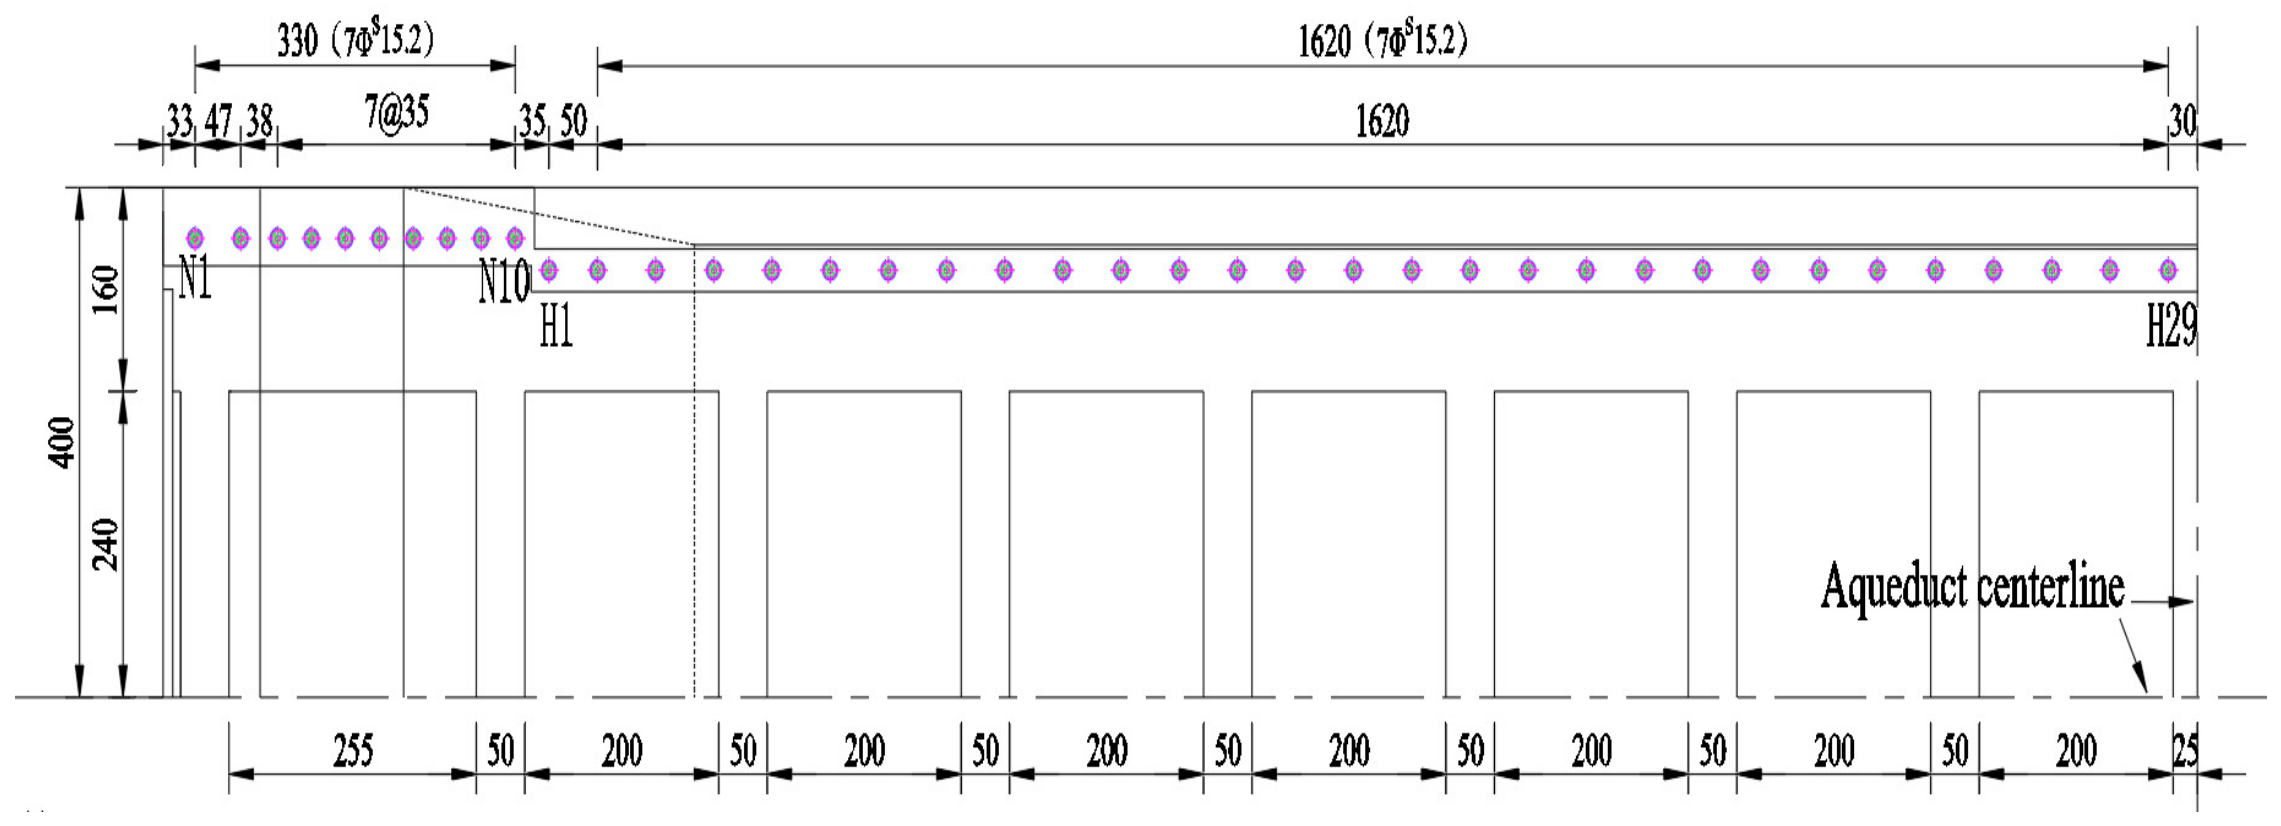
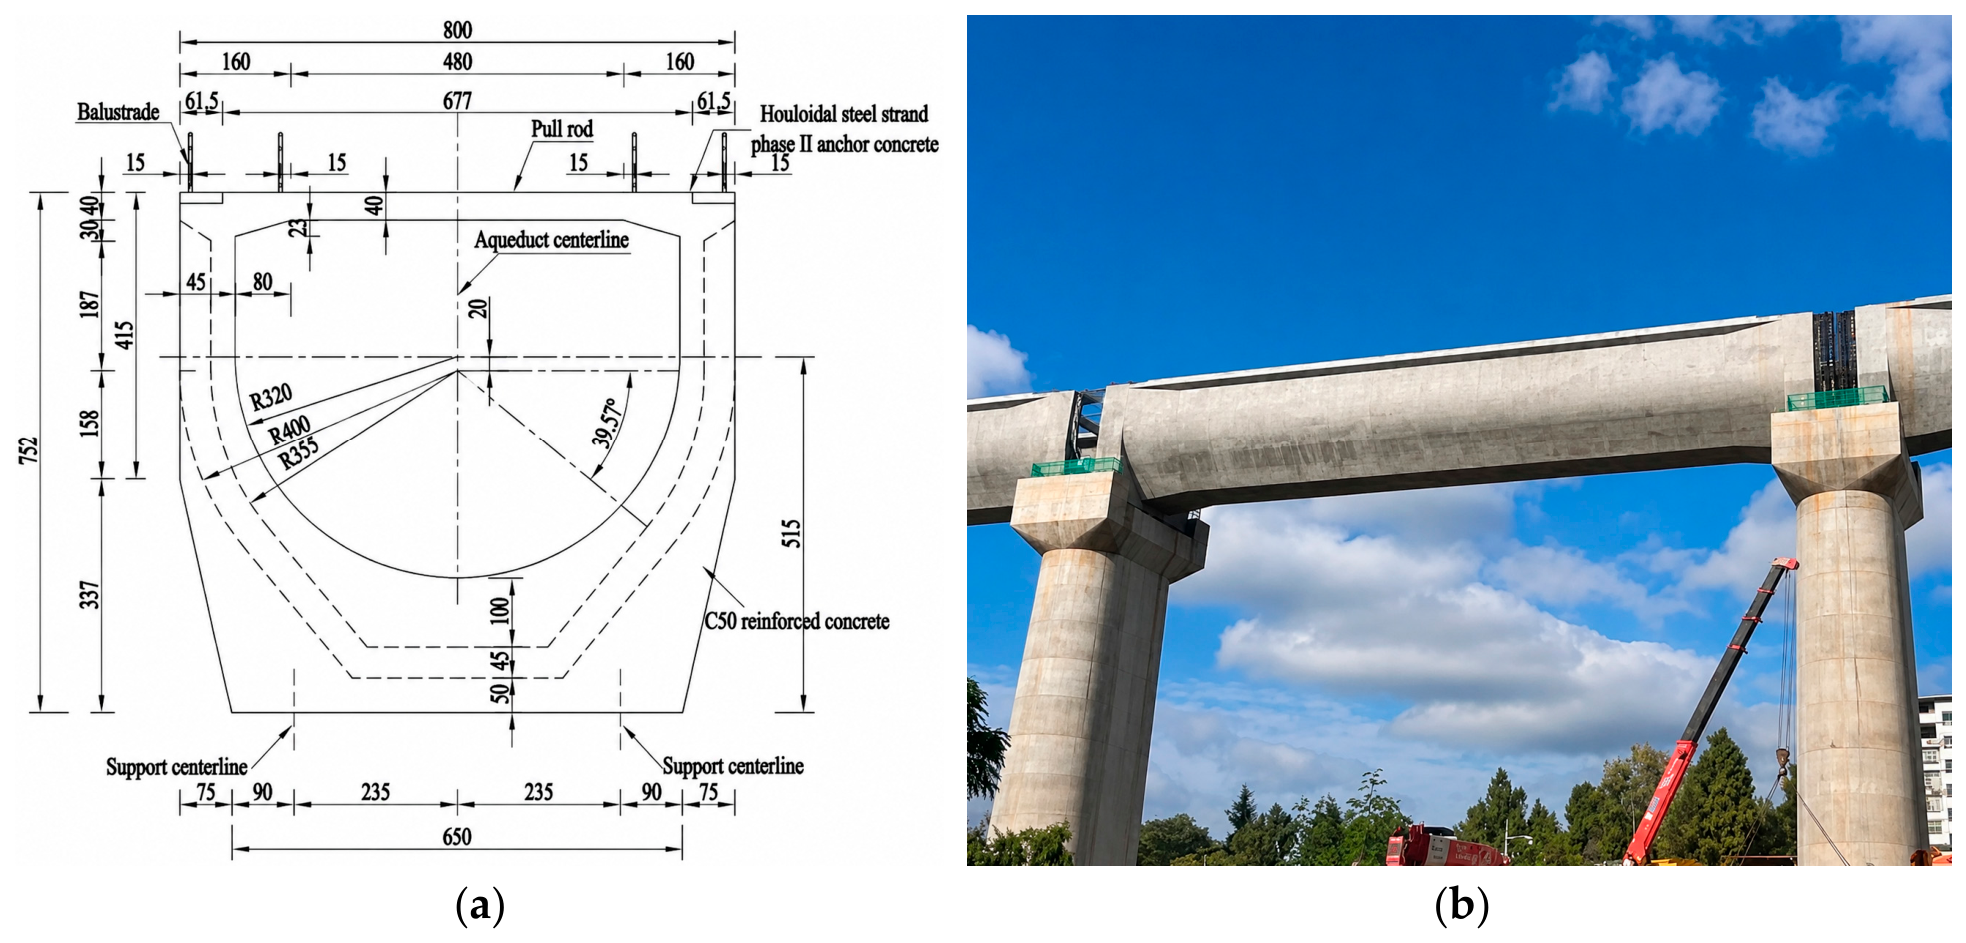
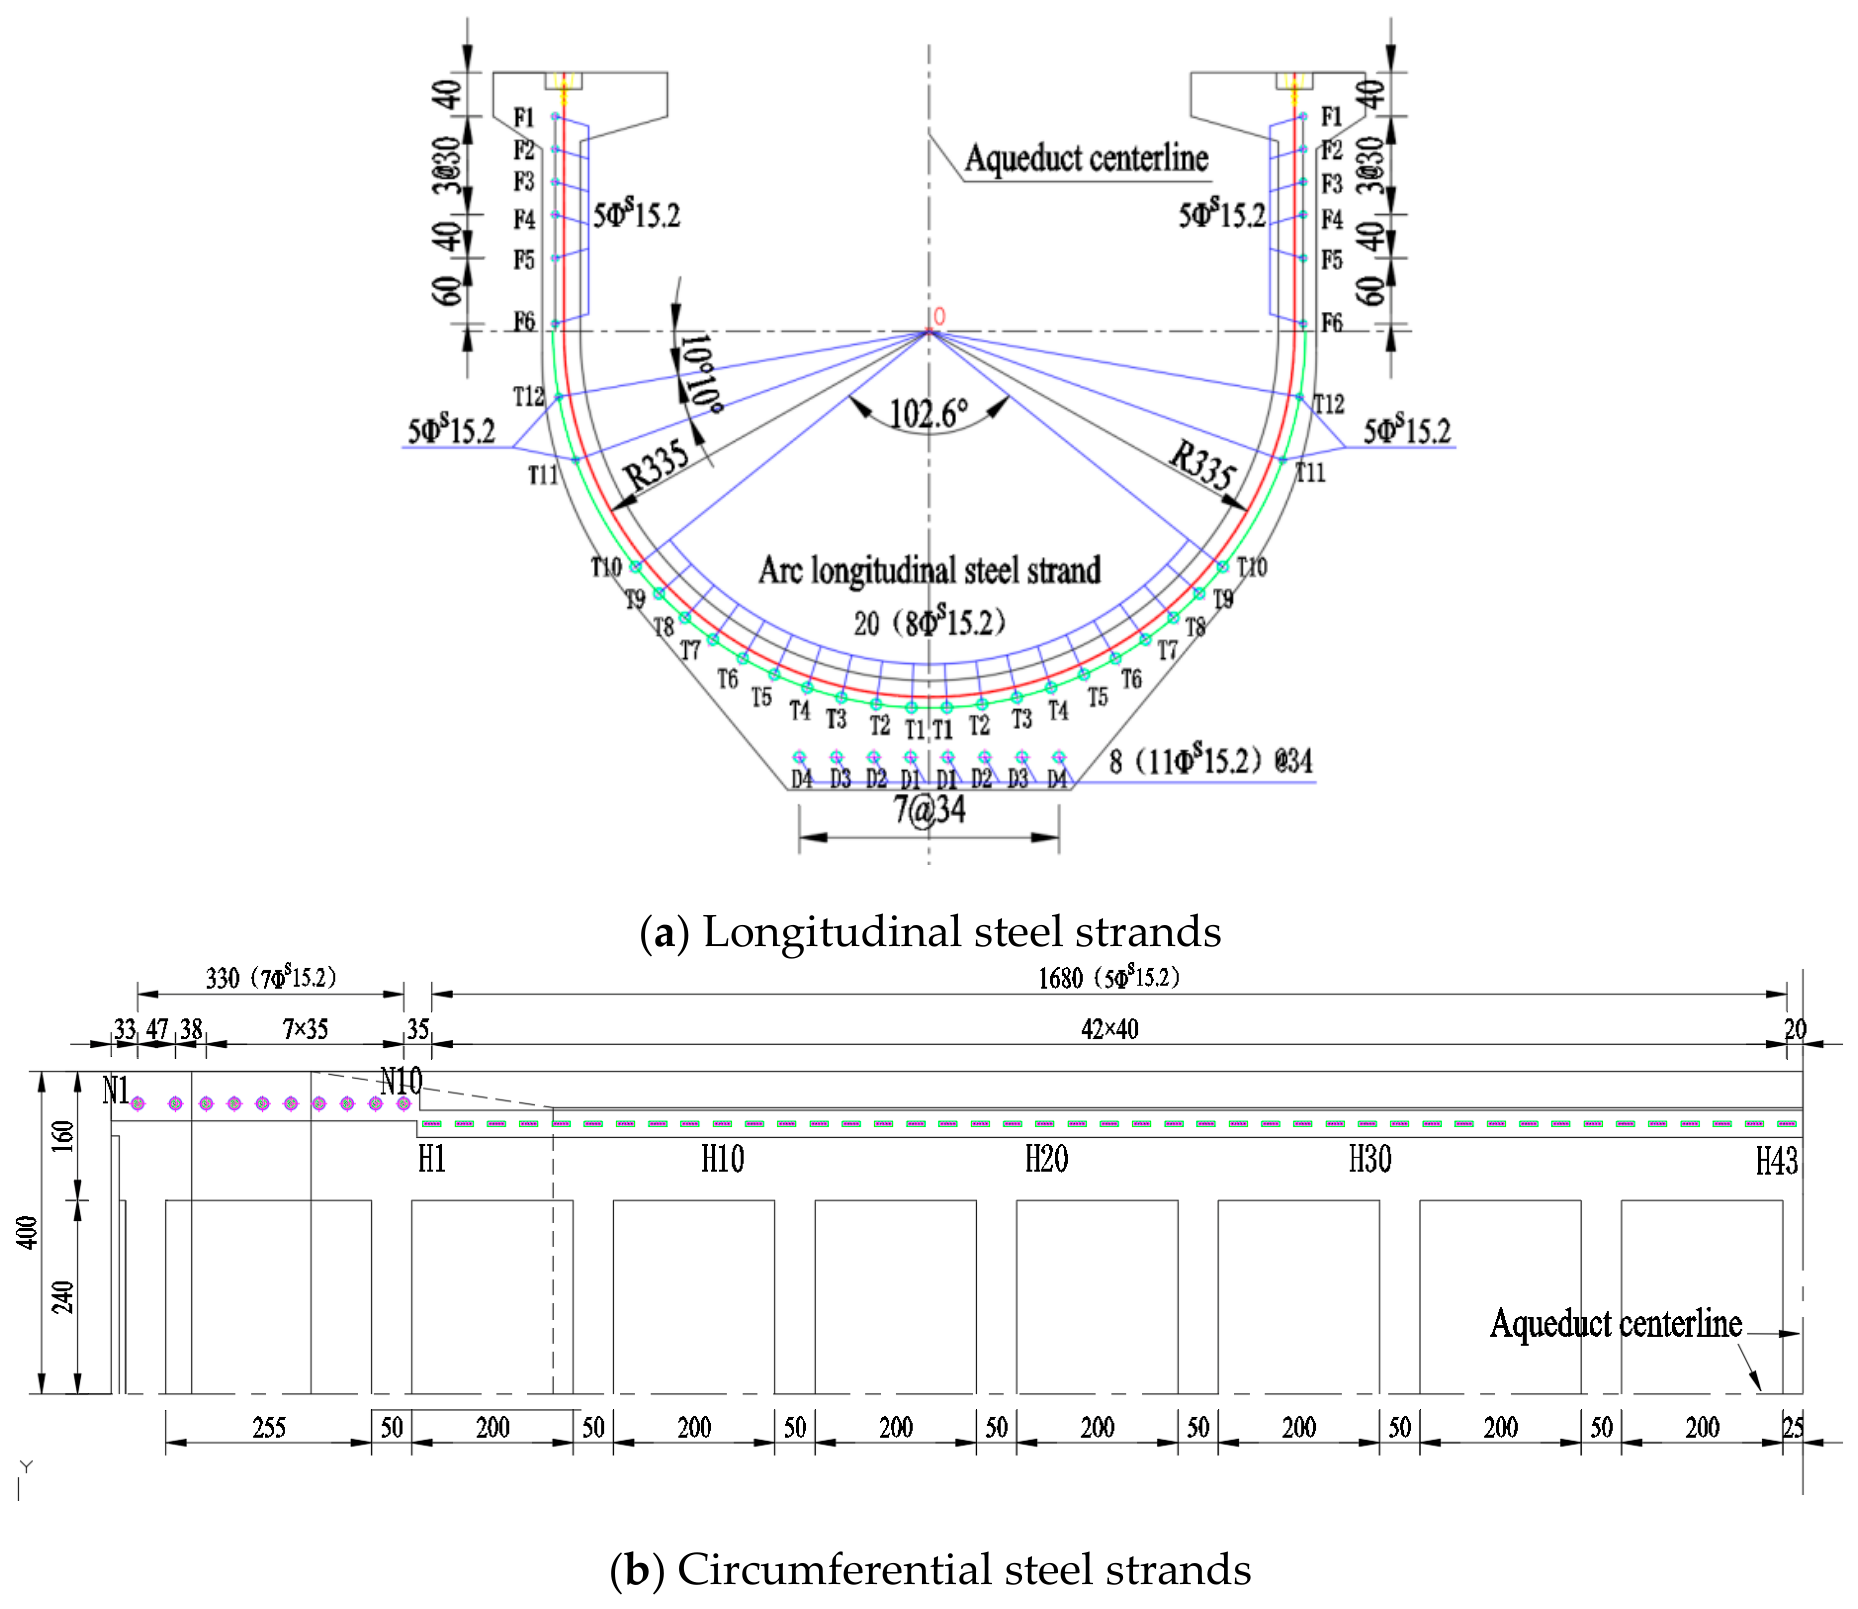
The studied 42 m span simply supported U-shaped aqueduct is a post-tensioned prestressed concrete structure. Figure 1a,b present cross-sections of the aqueduct and a field photograph. Figure 2 illustrates the arrangement of longitudinal and circumferential steel bundles. The aqueduct includes 44 longitudinal prestressed steel bundles, with web bundles F1–F6 arranged vertically. Arc section bundles T1–T12 are circumferentially positioned along the inner wall of the groove. Bottom beam bundles D1–D4 are placed horizontally on the bottom plate. A total of 106 hoop prestressed steel bundles are configured: The N1–N10 circumferential tendons at the beam end are arranged at a spacing of 35 cm, with 7 strands per duct. Each strand employs a 15.2 mm diameter steel wire. For the midspan section, circumferential tendons H1–H43 are arranged at a spacing of 40 cm, with 5 prestressed steel strands configured in each corrugated duct. The standard value of the ultimate tensile strength fpk of the adopted prestressed steel strand is 1860 MPa.
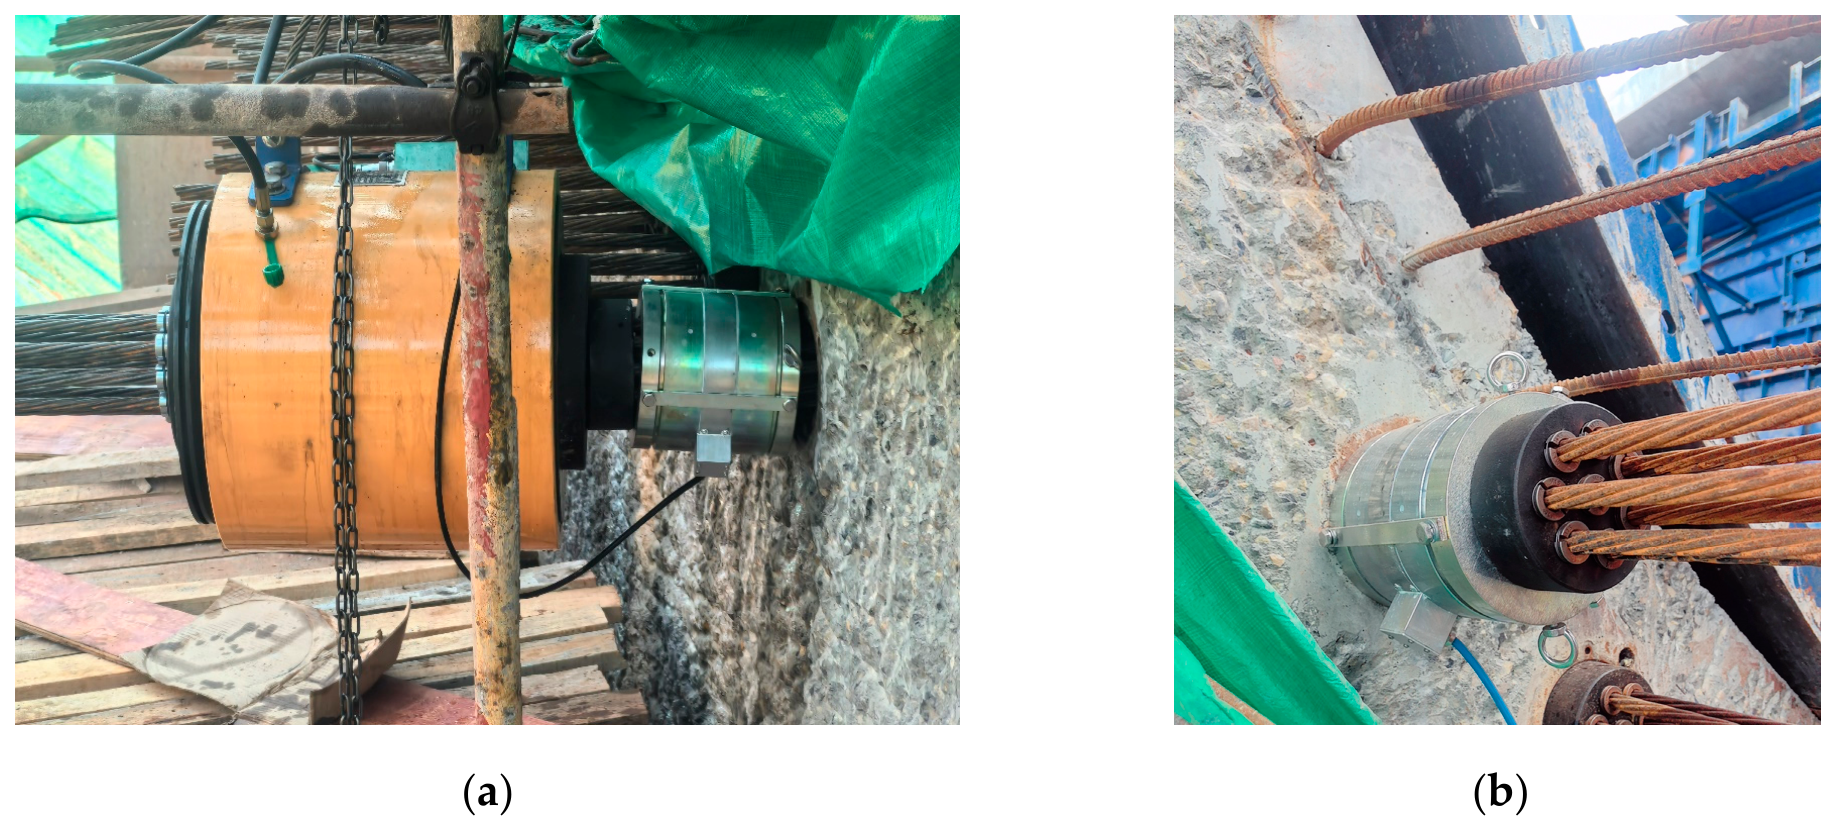
In this test, the single-end tensioning with the other end fixed method was adopted. The layout of the field setup and instrument arrangement is illustrated in Figure 3. Two anchor cable load cells were required and installed at the live (active) end and dead (passive) end of the prestressed tendon, respectively. During the test, one anchor cable load cell was mounted outside the anchor plate at each end of the prestressed tendon to measure the total pressure, followed by the installation of the hydraulic jack and working anchor. At the beginning of the test, both ends were tensioned to 0.15Pₖ simultaneously, and the initial readings were recorded. Then, one end was locked to serve as the passive end, while the other end was actively tensioned to the target load Pₖ in stages. After repeating the test three times, the roles of the active and passive ends were exchanged, and the test was repeated another three times. During loading, the pressure values at both ends were recorded. The ratio of the pressure difference between the two ends to the pressure at the active end was defined as the friction loss rate of the prestressed tendon.

2.1. Short-Term Prestress Loss

2.1.1. Prestress Loss Due to Pipe Friction (PLPF)

In this test, one end of each prestressed steel bundle is tensioned while the opposite end is anchored. Two anchor cable gauges are mounted, one at the active end and another at the passive end of the bundle. The test concentrates on four specific bundles: the longitudinal web bundle (F4), the bottom plate bundle (D4), the beam-end circumferential bundle (N4), and the span circumferential bundle (H41). These bundles are tested multiple times using a staged tensioning method.
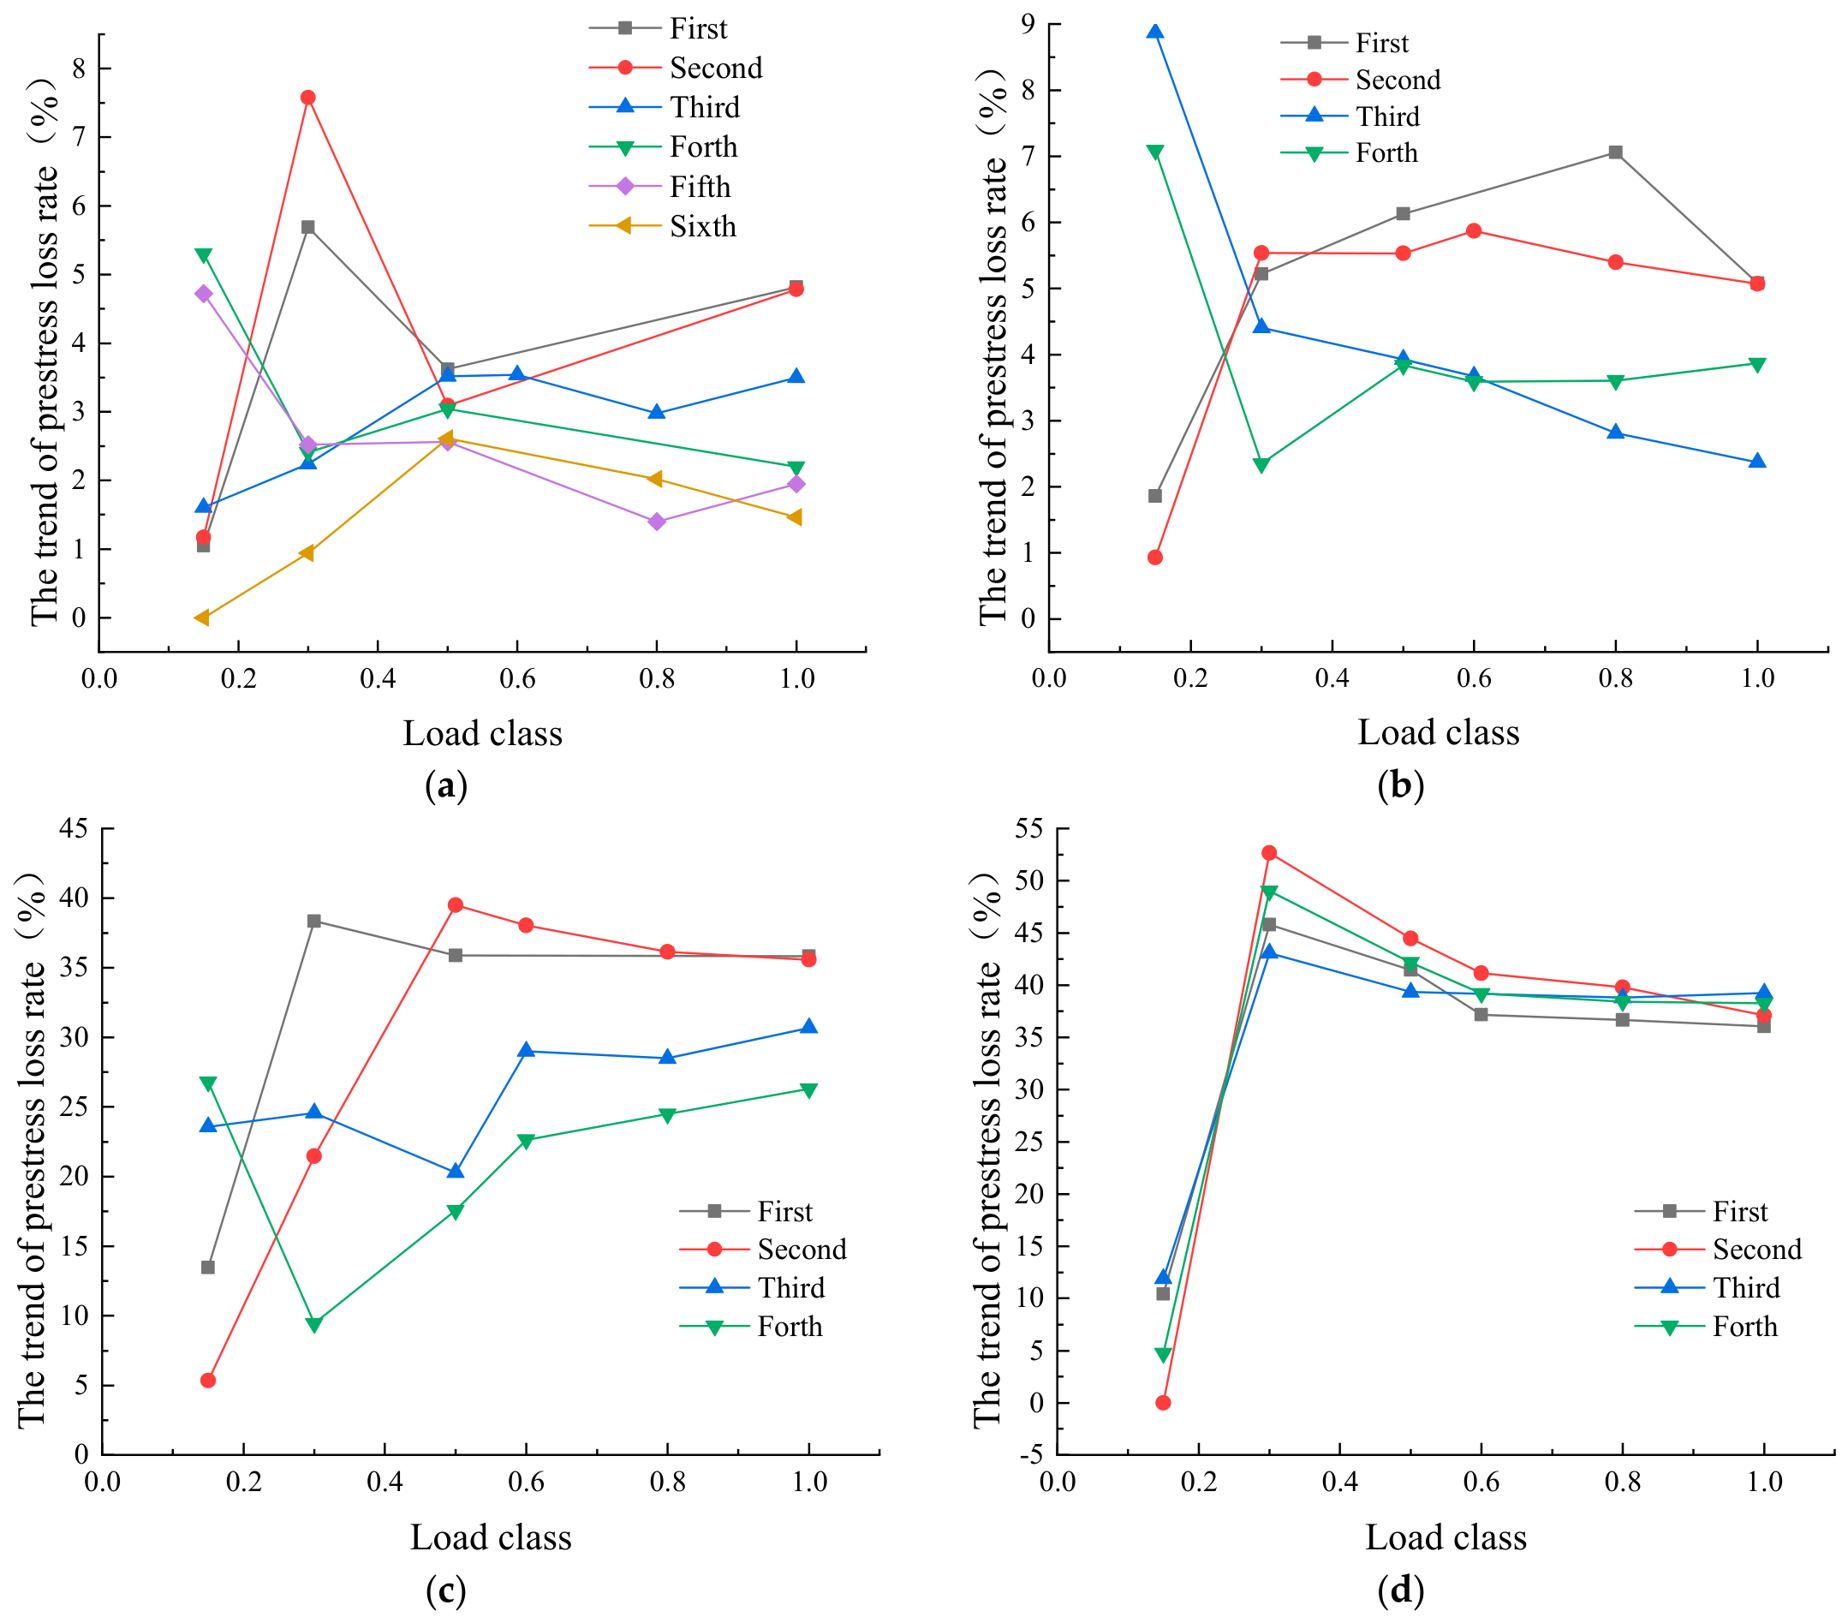
Figure 4 presents a comparison of prestress loss rates from multiple tensioning calculations. The abscissa “Load class” represents the ratio of the actual tensioning load to the design control stress of the prestressed steel strand, and the curves marked as “first”, “second”, and “third” represent the results of three repeated tensioning tests on the same steel strand to verify the stability of the test data. At 1.0 times the tensioning control stress, the test of prestress loss due to pipe friction rates converge. For longitudinal strands, the maximum PLPF due to friction ranges from 4.82% to 5.08%; for beam-end circumferential strands, it is 35.84%; and for midspan circumferential strands, it reaches 39.23%.
When analyzing longitudinal prestress loss, the cumulative tangent angle θ from the tensioning end to the calculation section equals zero; therefore, the longitudinal PLPF is solely influenced by the local deviation coefficient κ. When κ equals 0.0013, the theoretically calculated longitudinal PLPF rate is closest to the measured value, corresponding to a PLPF rate of 5.06%. For the test of circumferential prestress strand friction loss, single-end tensioning is applied, with θ taken as π. Based on the test results, it can be inferred that when κ equals 0.0015 and the friction coefficient μ between prestressed reinforcement and duct wall equals 0.15, the theoretically calculated midspan circumferential PLPF rate is 38.29%, which aligns well with the test results. Therefore, κ should be taken as 0.0015 and μ as 0.15 in the design of simply supported aqueducts.

2.1.2. Prestress Loss Due to Concrete Elastic Compression (PLCEC)

The elastic compression of concrete caused by tensioning later batches of steel strands will result in stress loss in the previously tensioned and anchored strands. In this test, longitudinal strands F4 and D4, as well as circumferential strand N4, are selected to conduct tests on PLCEC.
In the aqueduct tested in this study, the tendons are arranged symmetrically on the left and right sides. Considering the longitudinal tendon F4 as an example, two anchorage gauges are symmetrically installed on both sides at a short distance from each other. A set of data is recorded separately based on the readings from the left and right anchorage gauges. The PLCEC rate is calculated using the formula (P1−Pi)/P1. When tendon T1 is tensioned to 100%, the PLCEC rates calculated from both sides are averaged to determine the final PLCEC rate.
Table 1 shows that the longitudinal tendon T1 is tensioned to 100%, indicating that all longitudinal tendons are fully tensioned. Due to the concrete’s elastic compression, the PLCEC rate for the web prestressing tendon F4 is 7.36%. Similarly, the PLCEC rate for the base plate prestressing tendon D4 is 6.50%.
For the circumferential beam N4, when N4, N6, N8 and N10 are stretched to 100%, the readings of the N4 anchor cable meter are 1035.8, 1033.8, 1033.8 and 1033.8 kN, respectively. This indicates that the PLCEC of the circumferential beam N4 is only 0.19%, which is negligible.

2.2. Long-Term Prestress Loss

2.2.1. Prestress Under the Anchor

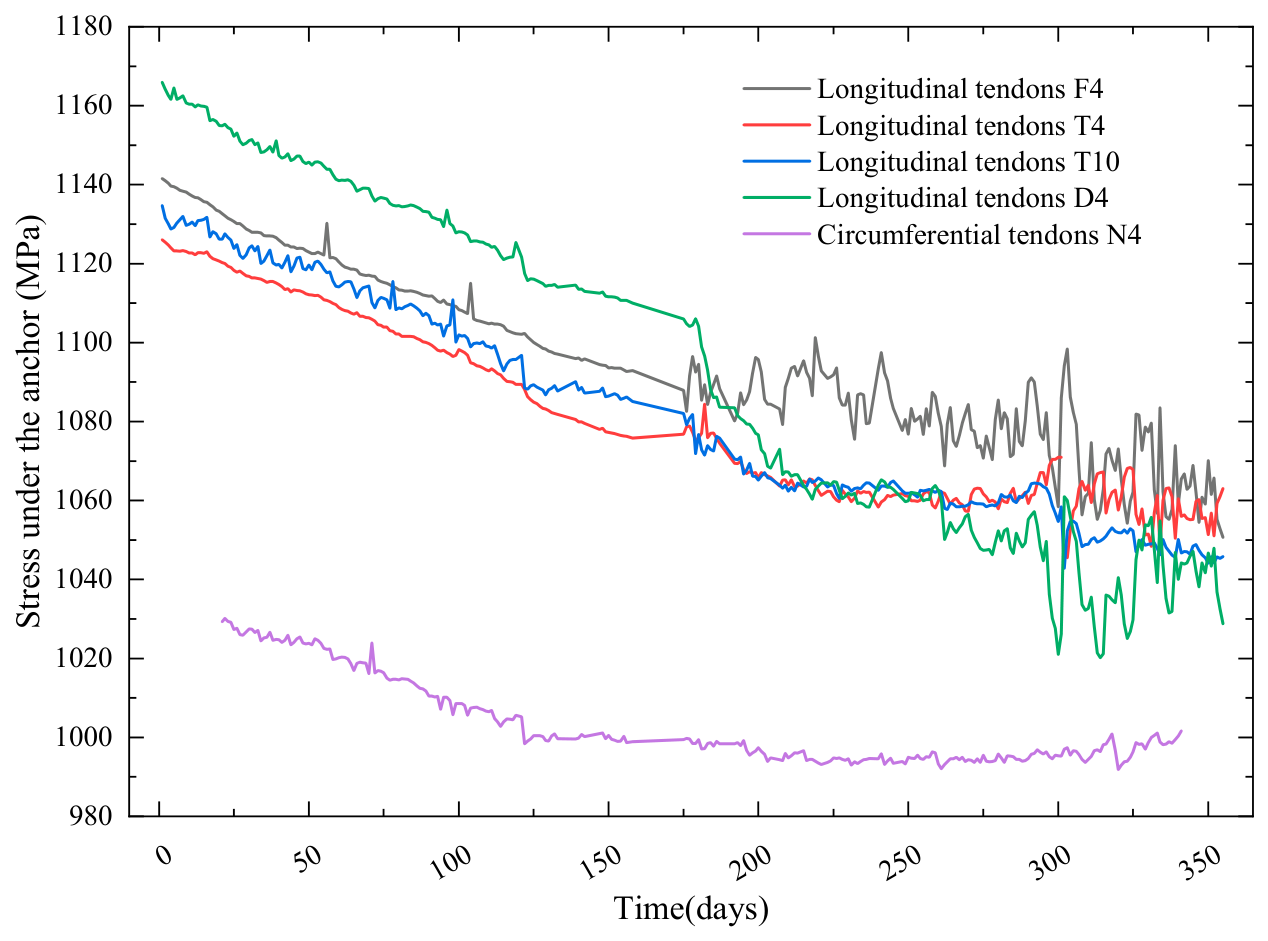
Stress under the anchors of longitudinal tendons F4, T4, T10 and D4, as well as circumferential tendons N4 and H41, was measured. The longitudinal tendons were tensioned on 9 May 2024, and the circumferential tendons were tensioned on 12 May 2024. Following the completion of prestressed tendon tensioning, anchor cable load cell sensors are permanently installed to enable continuous monitoring of long-term anchorage stress variations. Sensor leads are routed to an automatic data acquisition unit, allowing remote online retrieval of real-time measurement data. The average of the readings from both sides was calculated and is plotted in Figure 5.
As can be seen from Figure 4, the anchoring stress of longitudinal and circumferential steel bundles began to stabilize 180 days and 120 days after tensioning, respectively. After 12 months of tensioning and anchoring, the anchor stresses of longitudinal tendons F4, T4, T10 and D4, as well as circumferential tendon N4, were measured at 1050.6, 1063.0, 1045.8, 1028.8 MPa and 999.4 MPa, respectively. Over a 12-month monitoring period, the long-term prestress losses (LTPLs) recorded for the aforementioned tendons were 90.9 MPa, 63.1 MPa, 88.8 MPa, 137.2 MPa, and 27.6 MPa, corresponding to loss percentages of 6.52%, 4.52%, 6.37%, 9.84%, and 1.98% respectively. The results of the H41 tendon test reflect the stress changes under the anchor of midspan circumferential tendons. The long-term prestress loss in midspan circumferential tendons is 43.9 MPa, representing 3.15% of control stress for prestressing.

2.2.2. Long-Term Effective Prestress

As prestress loss primarily occurs due to relaxation, concrete shrinkage, and creep, the measured anchorage stress, minus pipe friction loss, represents the permanent effective stress. As can be seen from Section 2.1.1, the κ value for longitudinal tendons was 0.0013, resulting in a friction loss of 35.77 MPa (2.56% of control stress for prestressing) at midspan. For circumferential tendons, κ = 0.0015 and μ = 0.15; friction tests applied single-end tension (θ = π), while actual tension used double-end (θ = π/2), leading to beam-end and midspan hoop losses of 305.38 and 306.03 MPa (21.9% of control stress for prestressing), respectively.
Accordingly, for the longitudinal bundle, the effective prestresses of the web bundle (F4, T4, T10) and the bottom plate bundle (D4) at the midspan section are 1014.87, 1027.23, 1010.05 and 992.98 MPa, respectively. The corresponding prestress loss rates (including PLCEC) are 27.25%, 26.36%, 27.6% and 28.8%, respectively. Regarding the hoop tendons, the anchorage stress of the N4 tendons at the beam end is 953.45 MPa, with a pipe friction loss of 305.38 MPa to be subtracted at the beam bottom. For the midspan H41 tendons, the anchorage stress is 870.4 MPa, and the pipe friction loss to be deducted at the beam bottom is 306.03 MPa.

3. Monitoring of Bi-Directional Prestressing Effects

3.1. Monitoring Scheme

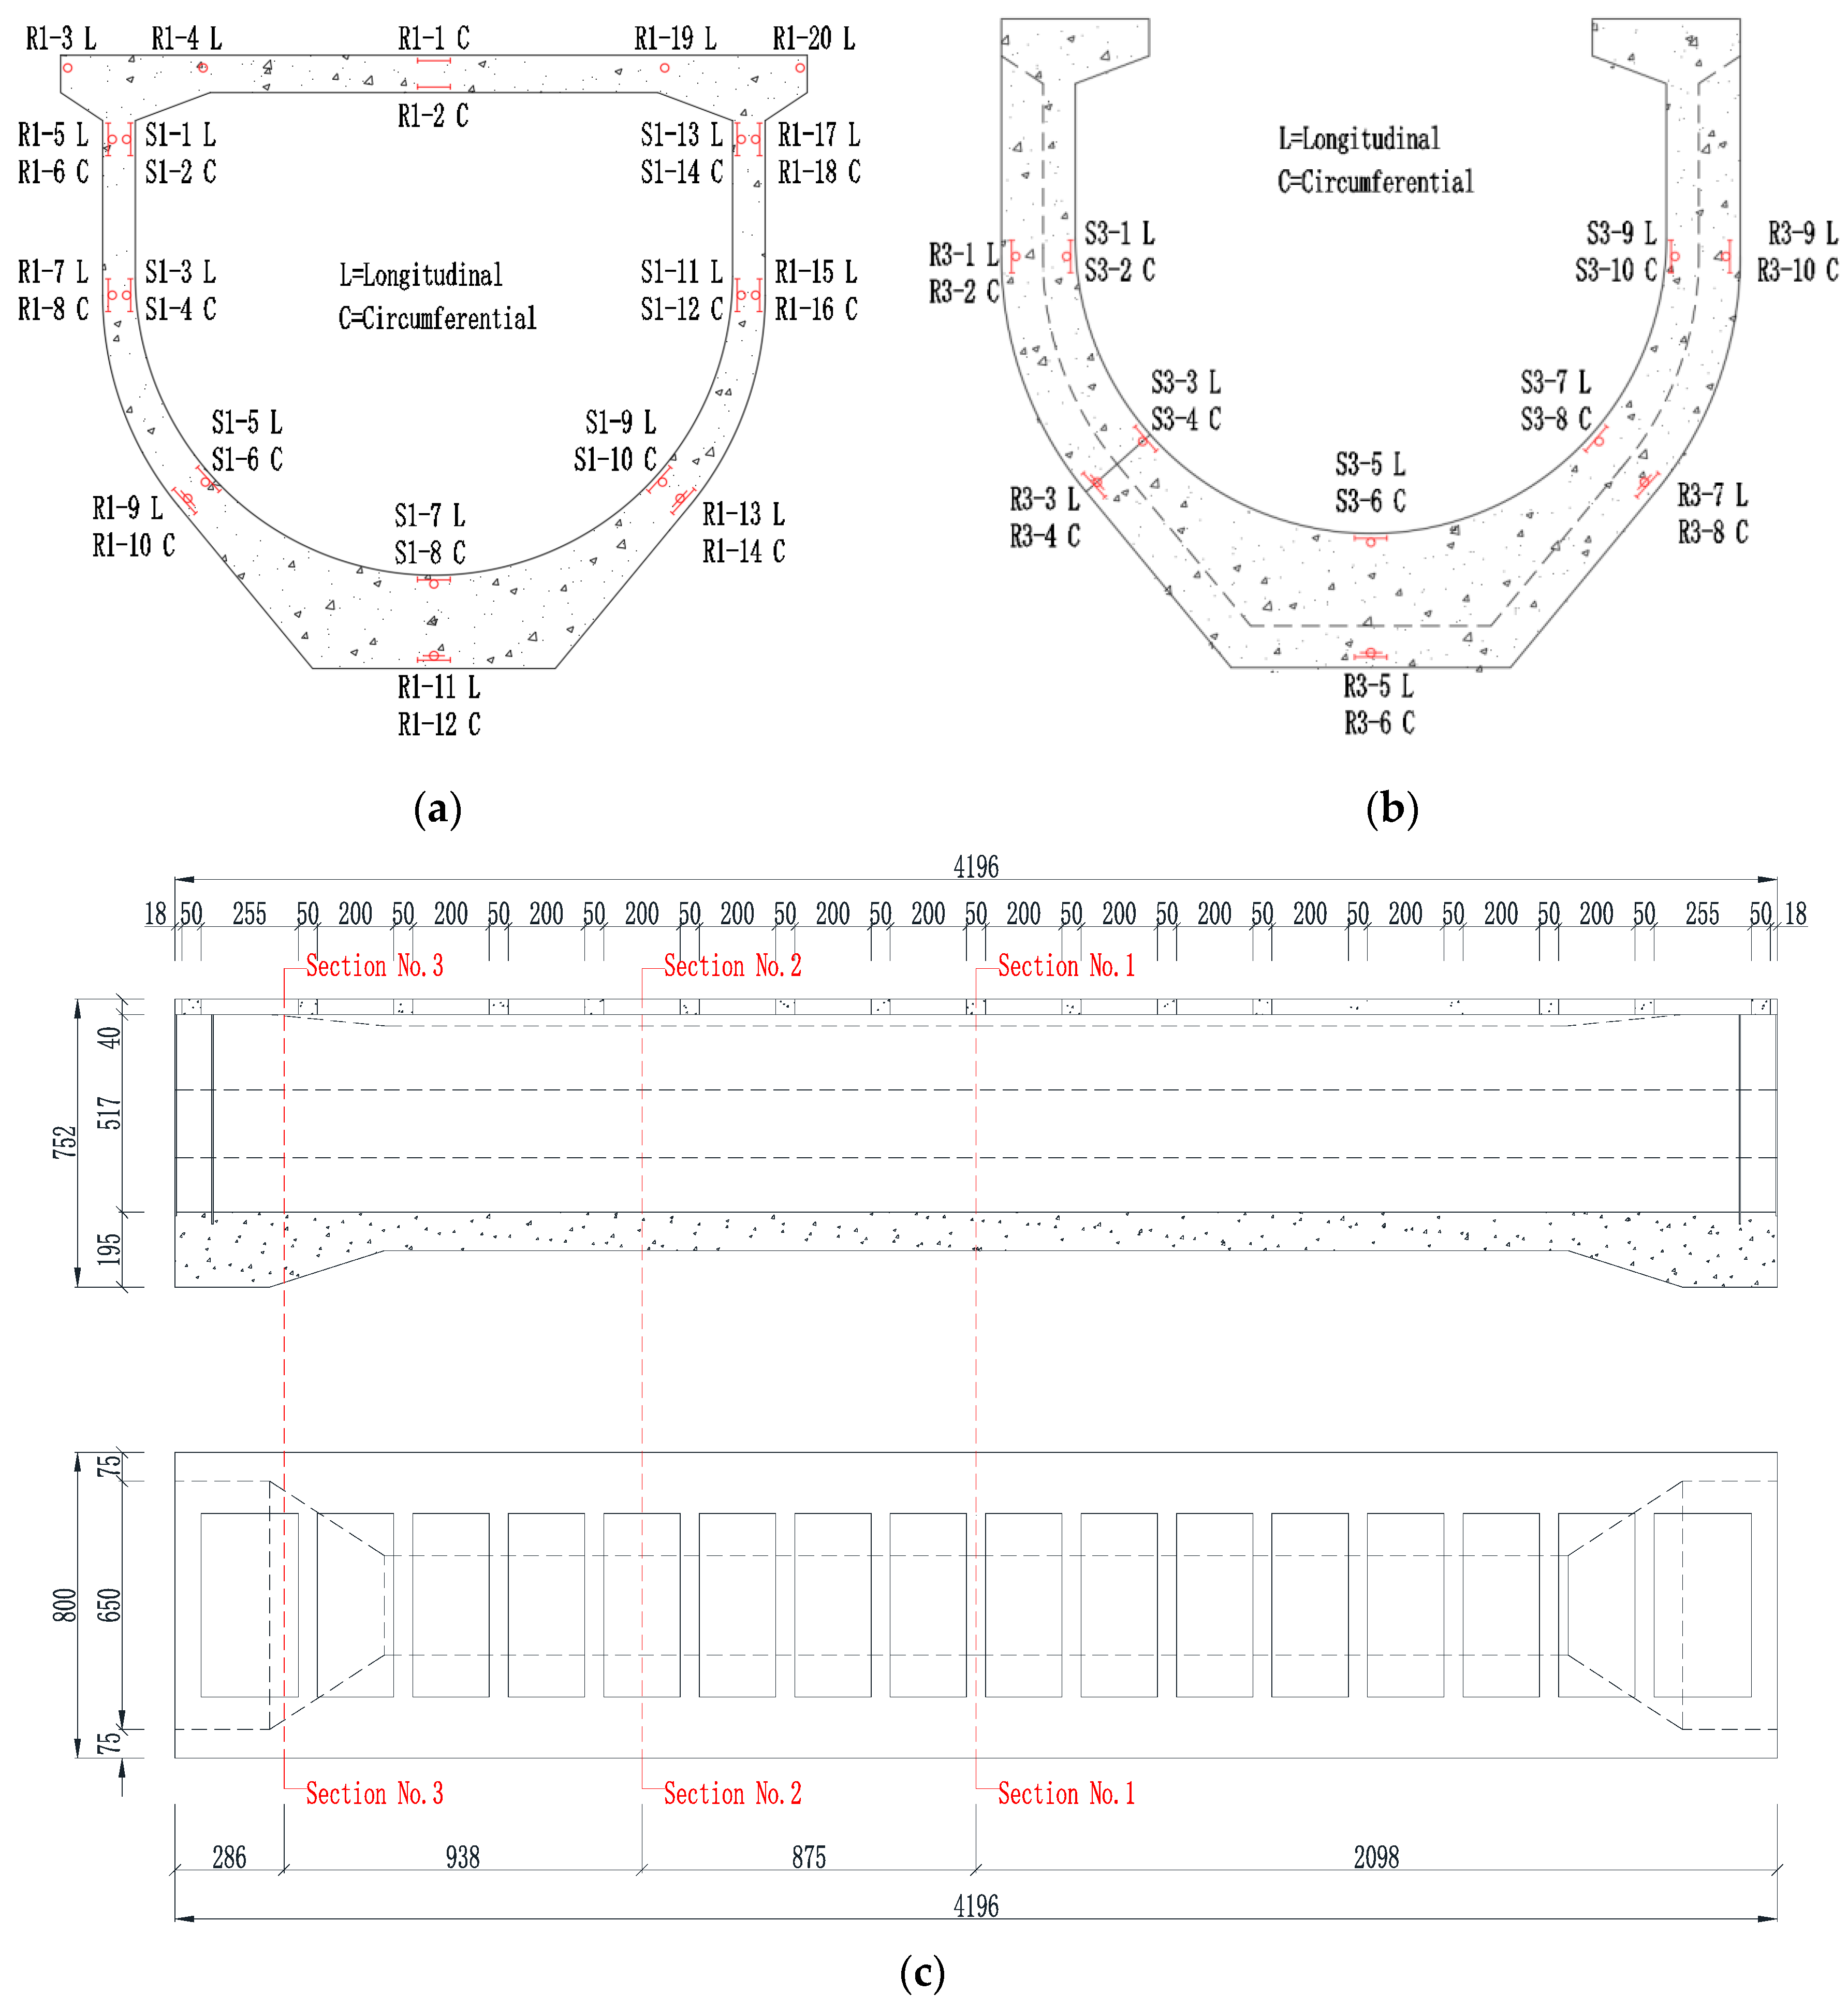
The structural stress of the aqueduct body is measured using concrete strain gauges (or steel strain gauges) arranged inside it. The sensor layout for the midspan section is shown in Figure 6a. A total of three steel strain gauges and 32 longitudinal concrete strain gauges are arranged at the midspan section. The sensor layout for the section near the support center is shown in Figure 6b. A total of three steel strain gauges and 18 concrete strain gauges are arranged in this section.
Based on temperature variations at the location of the aqueduct project, the daily maximum temperature generally occurs around 15:00 PM, resulting in significant temperature differences between the interior and exterior of the concrete aqueduct. The daily minimum temperature typically appears around 4:00 AM, with negligible temperature differences between the interior and exterior of the aqueduct. Therefore, the measured stresses at the midspan section and near the support center section at these two time points are selected for analysis.

3.2. Concrete Stress Results at Midspan Section

Due to space limitations, herein only the results at the midspan section are demonstrated. The stress results from key positions on both the left and right sides of each cross-section are extracted and plotted on the same diagram to simplify the presentation of the results and to more intuitively display the real-time concrete stress levels at different heights of each cross-section.
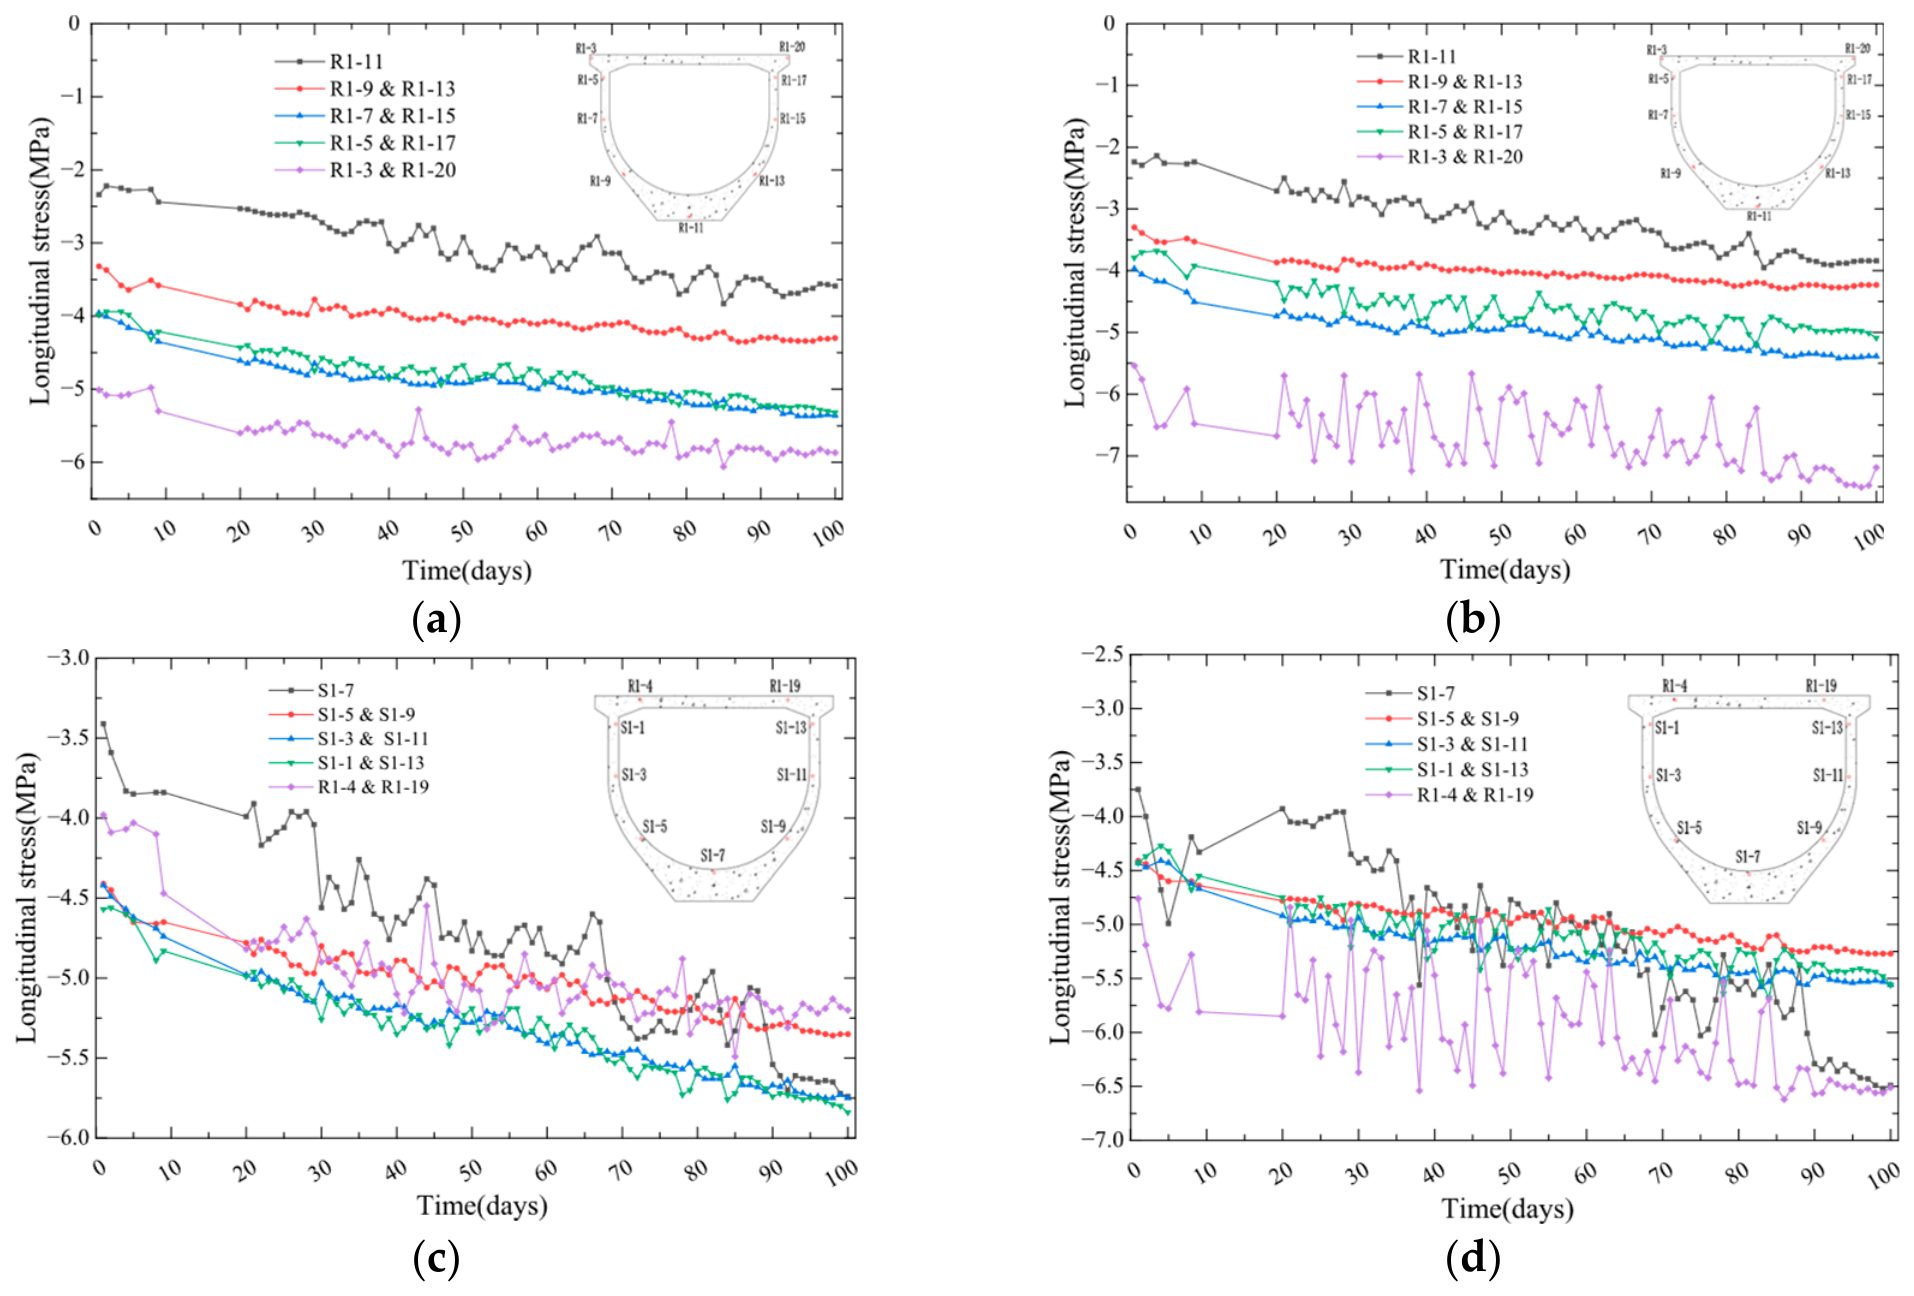
Figure 7a and Figure 7b, respectively, depict the longitudinal stress levels at various locations on the outer wall of the aqueduct. In the diagram, ‘longitudinal’ is the axial direction of the aqueduct body. The longitudinal compressive stresses on the outer wall at the bottom of the aqueduct, the arc segment, and the web (bottom and top) are 3.83, 4.35, 5.42 and 5.32 MPa, respectively. Figure 7c and Figure 7d, respectively, show the longitudinal stress levels at different locations on the inner wall of the aqueduct. The longitudinal compressive stresses on the inner wall at the bottom of the aqueduct, the arc segment, and the web (bottom and top) are 5.74, 5.36, 5.76 and 5.83 MPa, respectively. During the daily low-temperature period, the longitudinal compressive stress at the outer side of the aqueduct top is 6.06 MPa, while on the inner side is 5.49 MPa. During the daily high-temperature period, the longitudinal compressive stress at the outer side of the aqueduct top is 7.14 MPa, while on the inner side is 6.96 MPa.
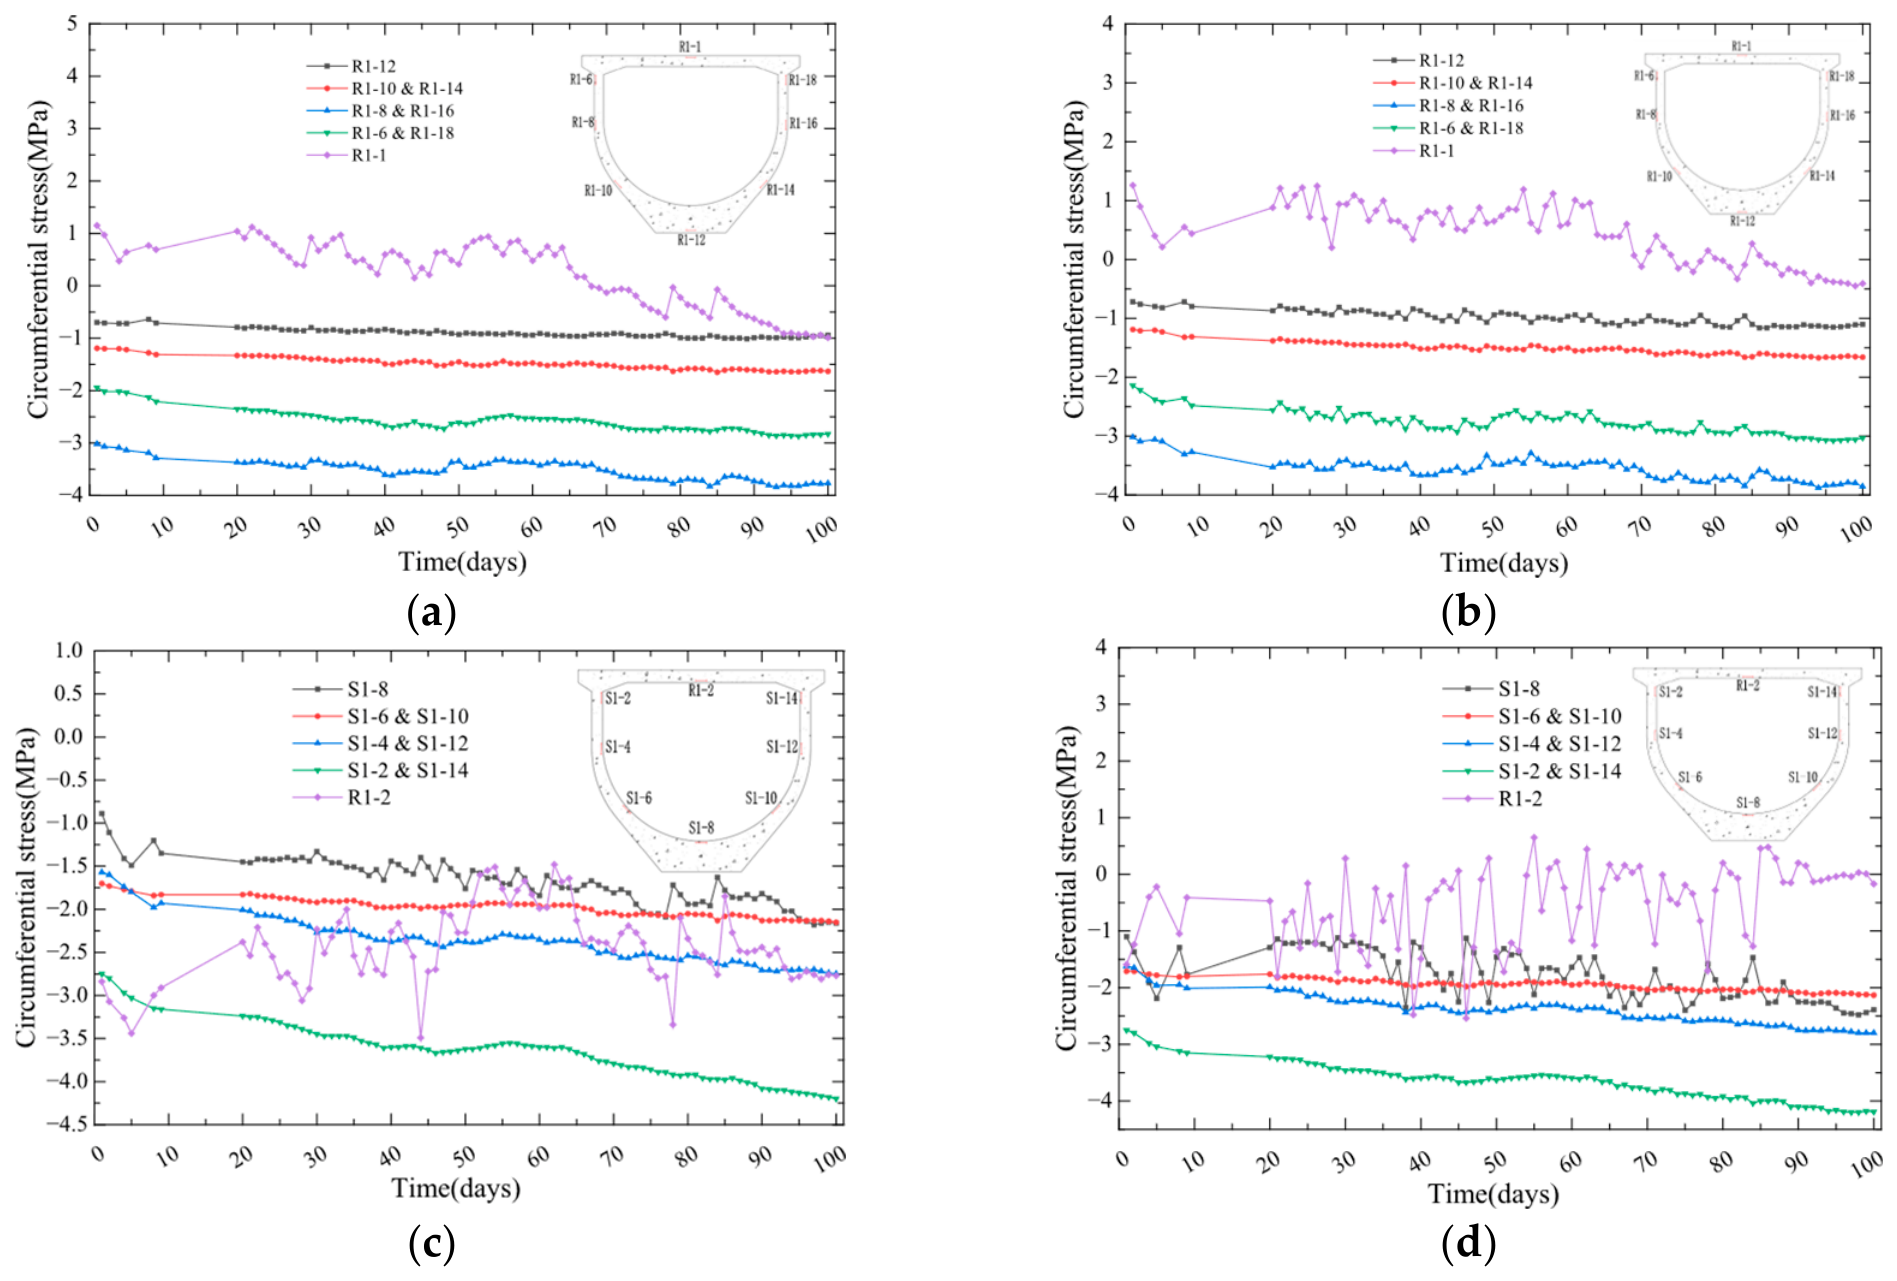
Figure 8a,b show the circumferential stress levels on the outer wall of the aqueduct: 1.01 MPa (bottom), 1.66 MPa (arc segment), 3.86 MPa (web bottom), and 2.87 MPa (web top). Figure 8c,d illustrate the circumferential stress levels on the inner wall: 2.18 MPa (bottom), 2.15 MPa (arc segment), 2.75 MPa (web bottom), and 4.20 MPa (web top). A tensile stress of 1.15 MPa is observed on the upper side of the pull rod, while the lower side shows a tensile stress of 3.54 MPa.
Figure 7 and Figure 8 indicate that stress levels at the bottom of the aqueduct, the arc segment, and the web (bottom and top) in the midspan section display minimal differences under low and high temperatures, except at the aqueduct top. Compared to low-temperature periods, the aqueduct top demonstrates significant stress fluctuations during high-temperature periods due to direct solar radiation, making it highly temperature-sensitive. Simultaneously, stress in the midspan section gradually increases from the bottom to the top of the aqueduct.

4. Numerical Simulation and Discussion

4.1. Finite Element Modeling

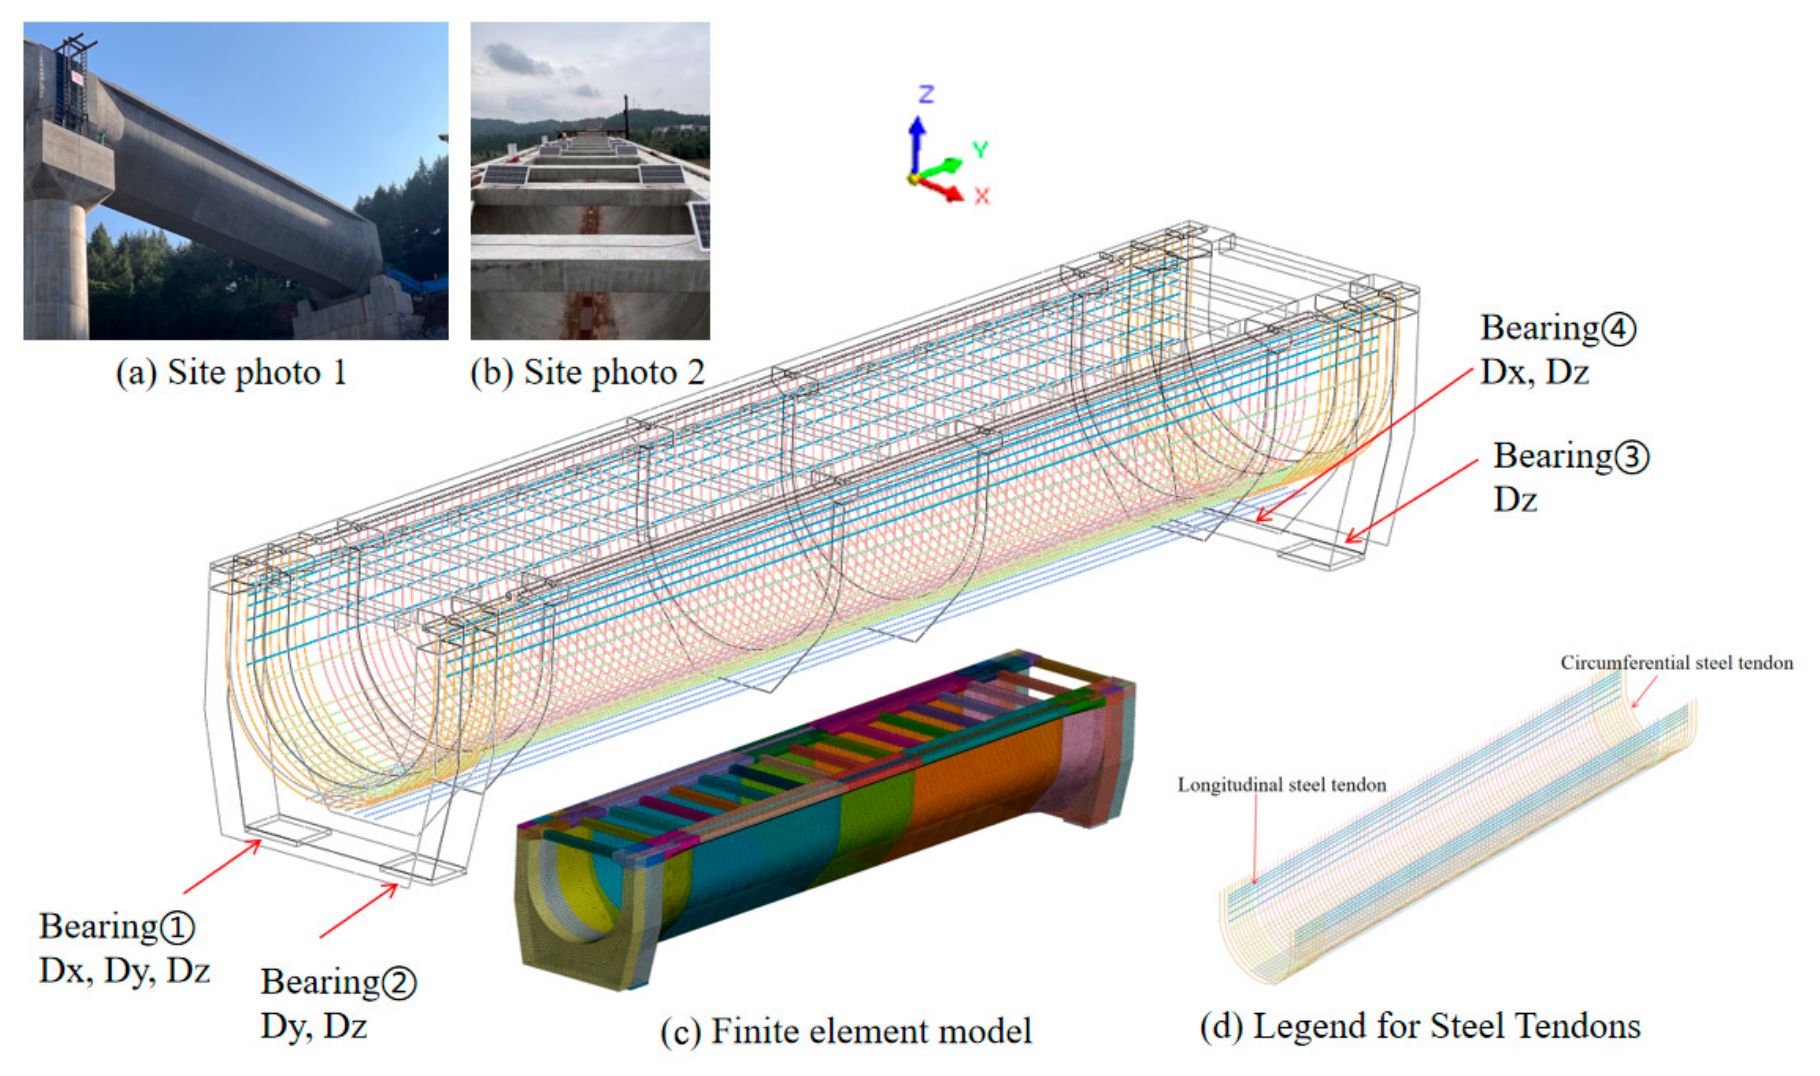
The FE software FEA/NX 2024 [16] is employed to establish a solid finite element model of the aqueduct for the analysis of its stress state and deformation characteristics. The finite element model, shown in Figure 9, consists of 643,366 elements and 656,716 nodes. In the model, the trough structure, pull rods, and supports are modeled using 3D elements. A hybrid mesh of tetrahedral and hexahedral elements is utilized for meshing. For regions with regular geometric features, hexahedral elements are preferentially adopted, as they generally deliver better numerical accuracy and higher computational efficiency in structural stress analysis. For regions with complex geometric features where high-quality hexahedral elements are difficult to generate, tetrahedral elements are employed instead. This hybrid meshing scheme is adopted in this paper to achieve a balanced trade-off among modeling accuracy, mesh quality and computational cost. With regard to the mesh specification, a uniform element size of 100 mm is set, which can reduce the computational cost while guaranteeing the required calculation accuracy. The application of prestress loads incorporates the previously measured friction coefficient, which are validated by field tests and specification-compliant theoretical calculations: the values of κ = 0.0013 for longitudinal pipes, and κ = 0.0015 and μ = 0.15 for circumferential pipes achieve the optimal agreement between theoretical calculations and measured data. In the element properties, the friction coefficient μ for the circumferential corrugated pipe is set to 0.15, the deviation coefficient κ for the circumferential pipe is 0.0015, and the deviation coefficient κ for the longitudinal pipe is 0.0013.
During the daily low-temperature period, there is minimal temperature difference between the inner and outer walls of the trough. Considering the current progress of the project (without water filling), only self-weight and prestress loads are applied to the finite element model to simulate the stress state of the trough in the absence of solar-induced temperature gradients.
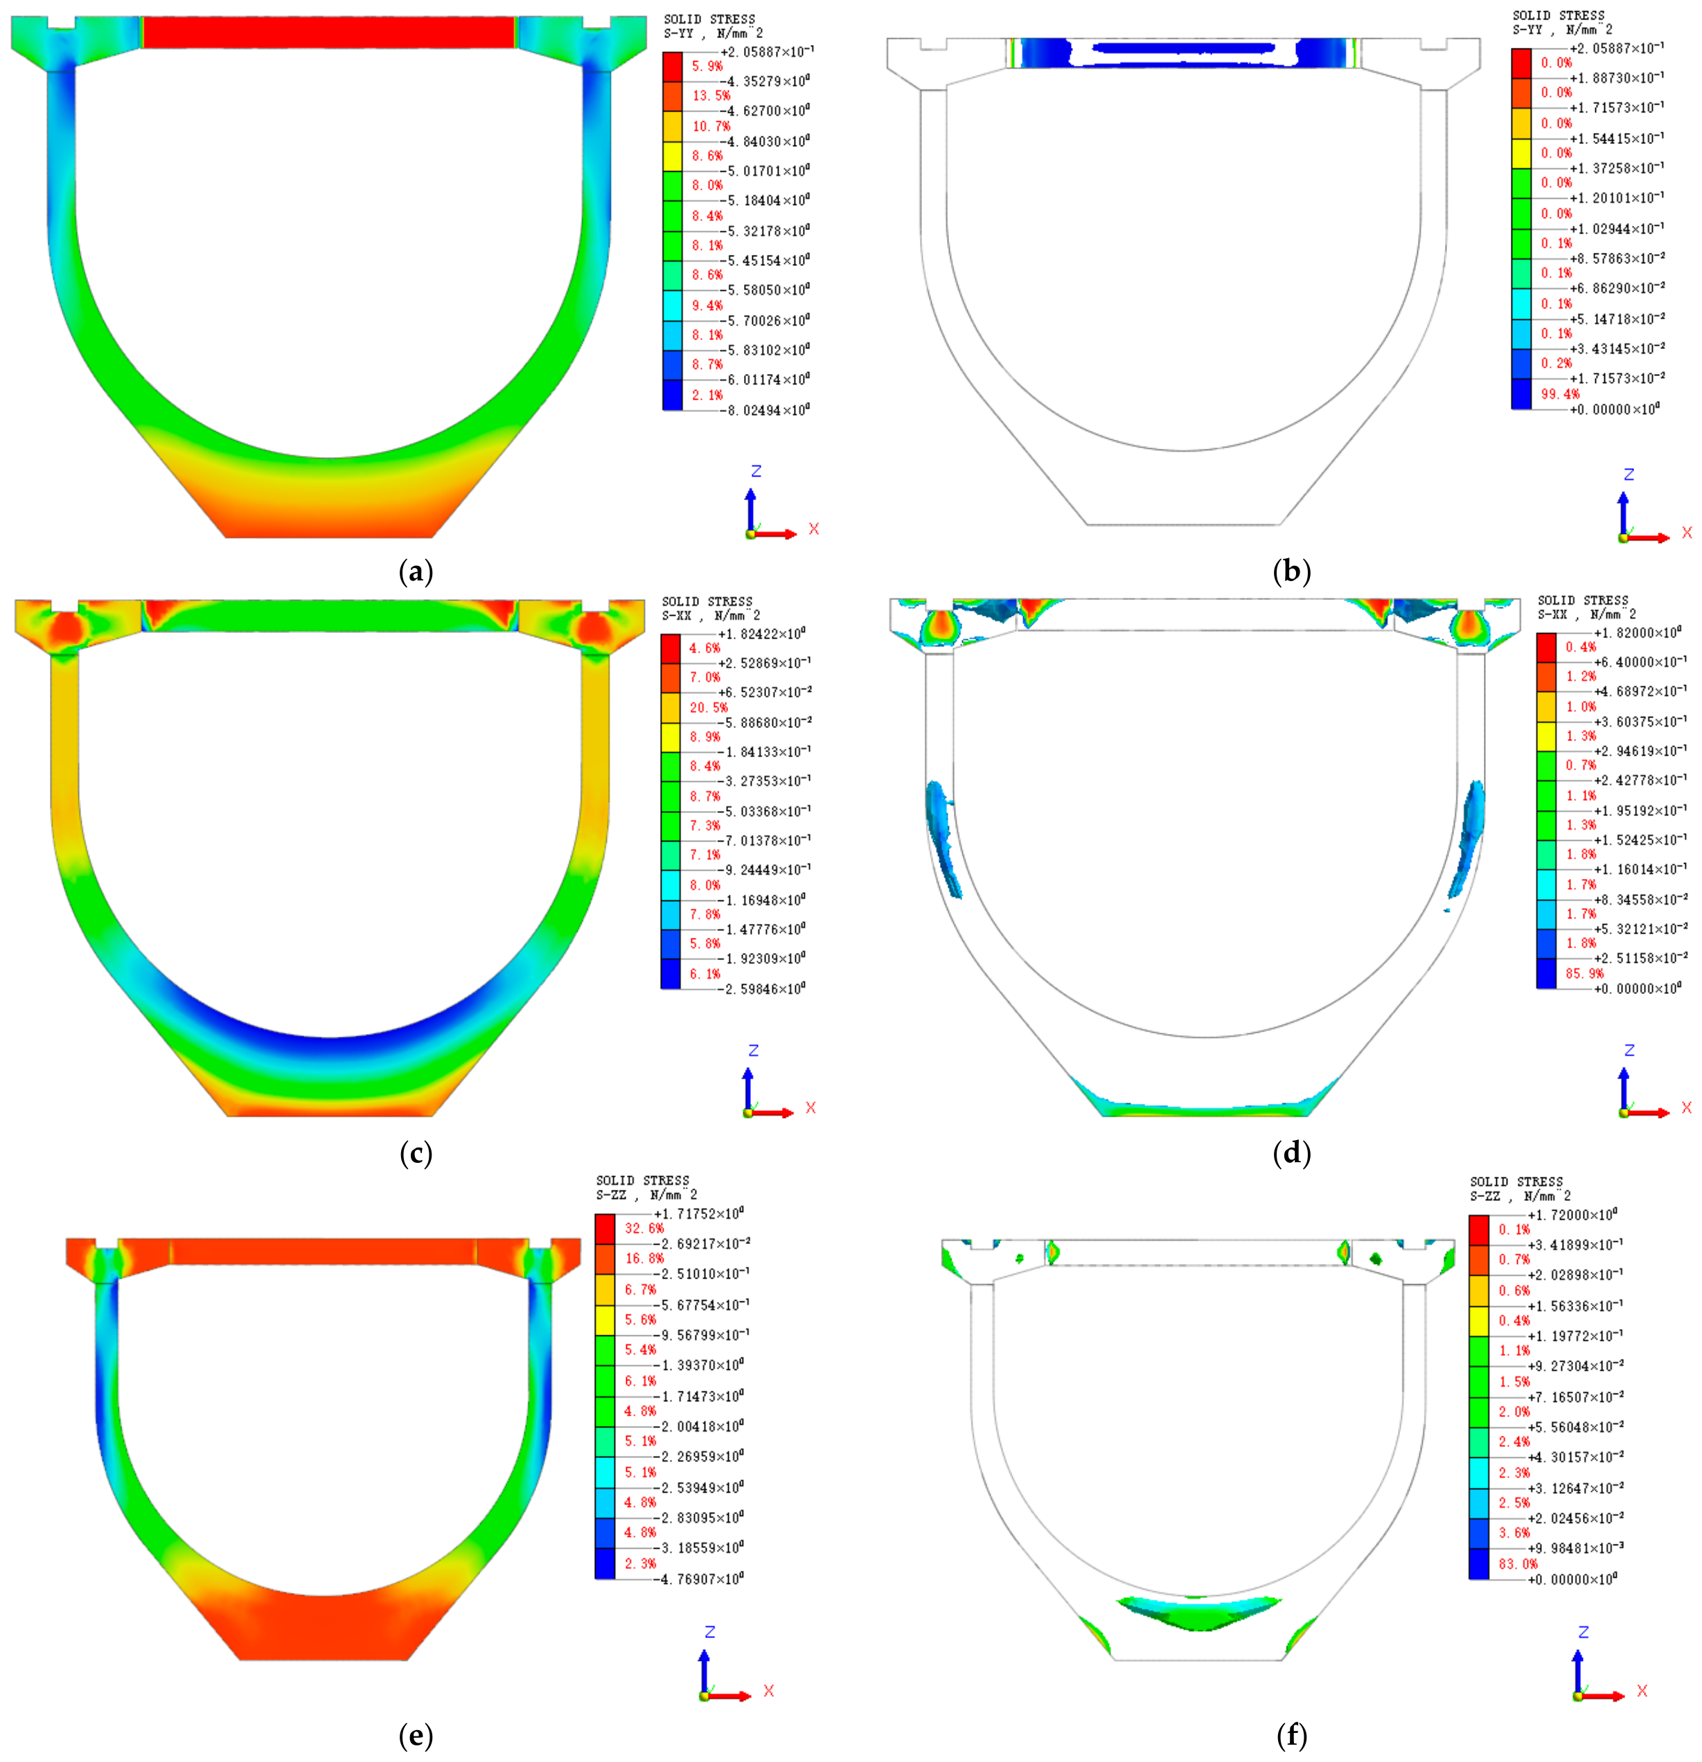
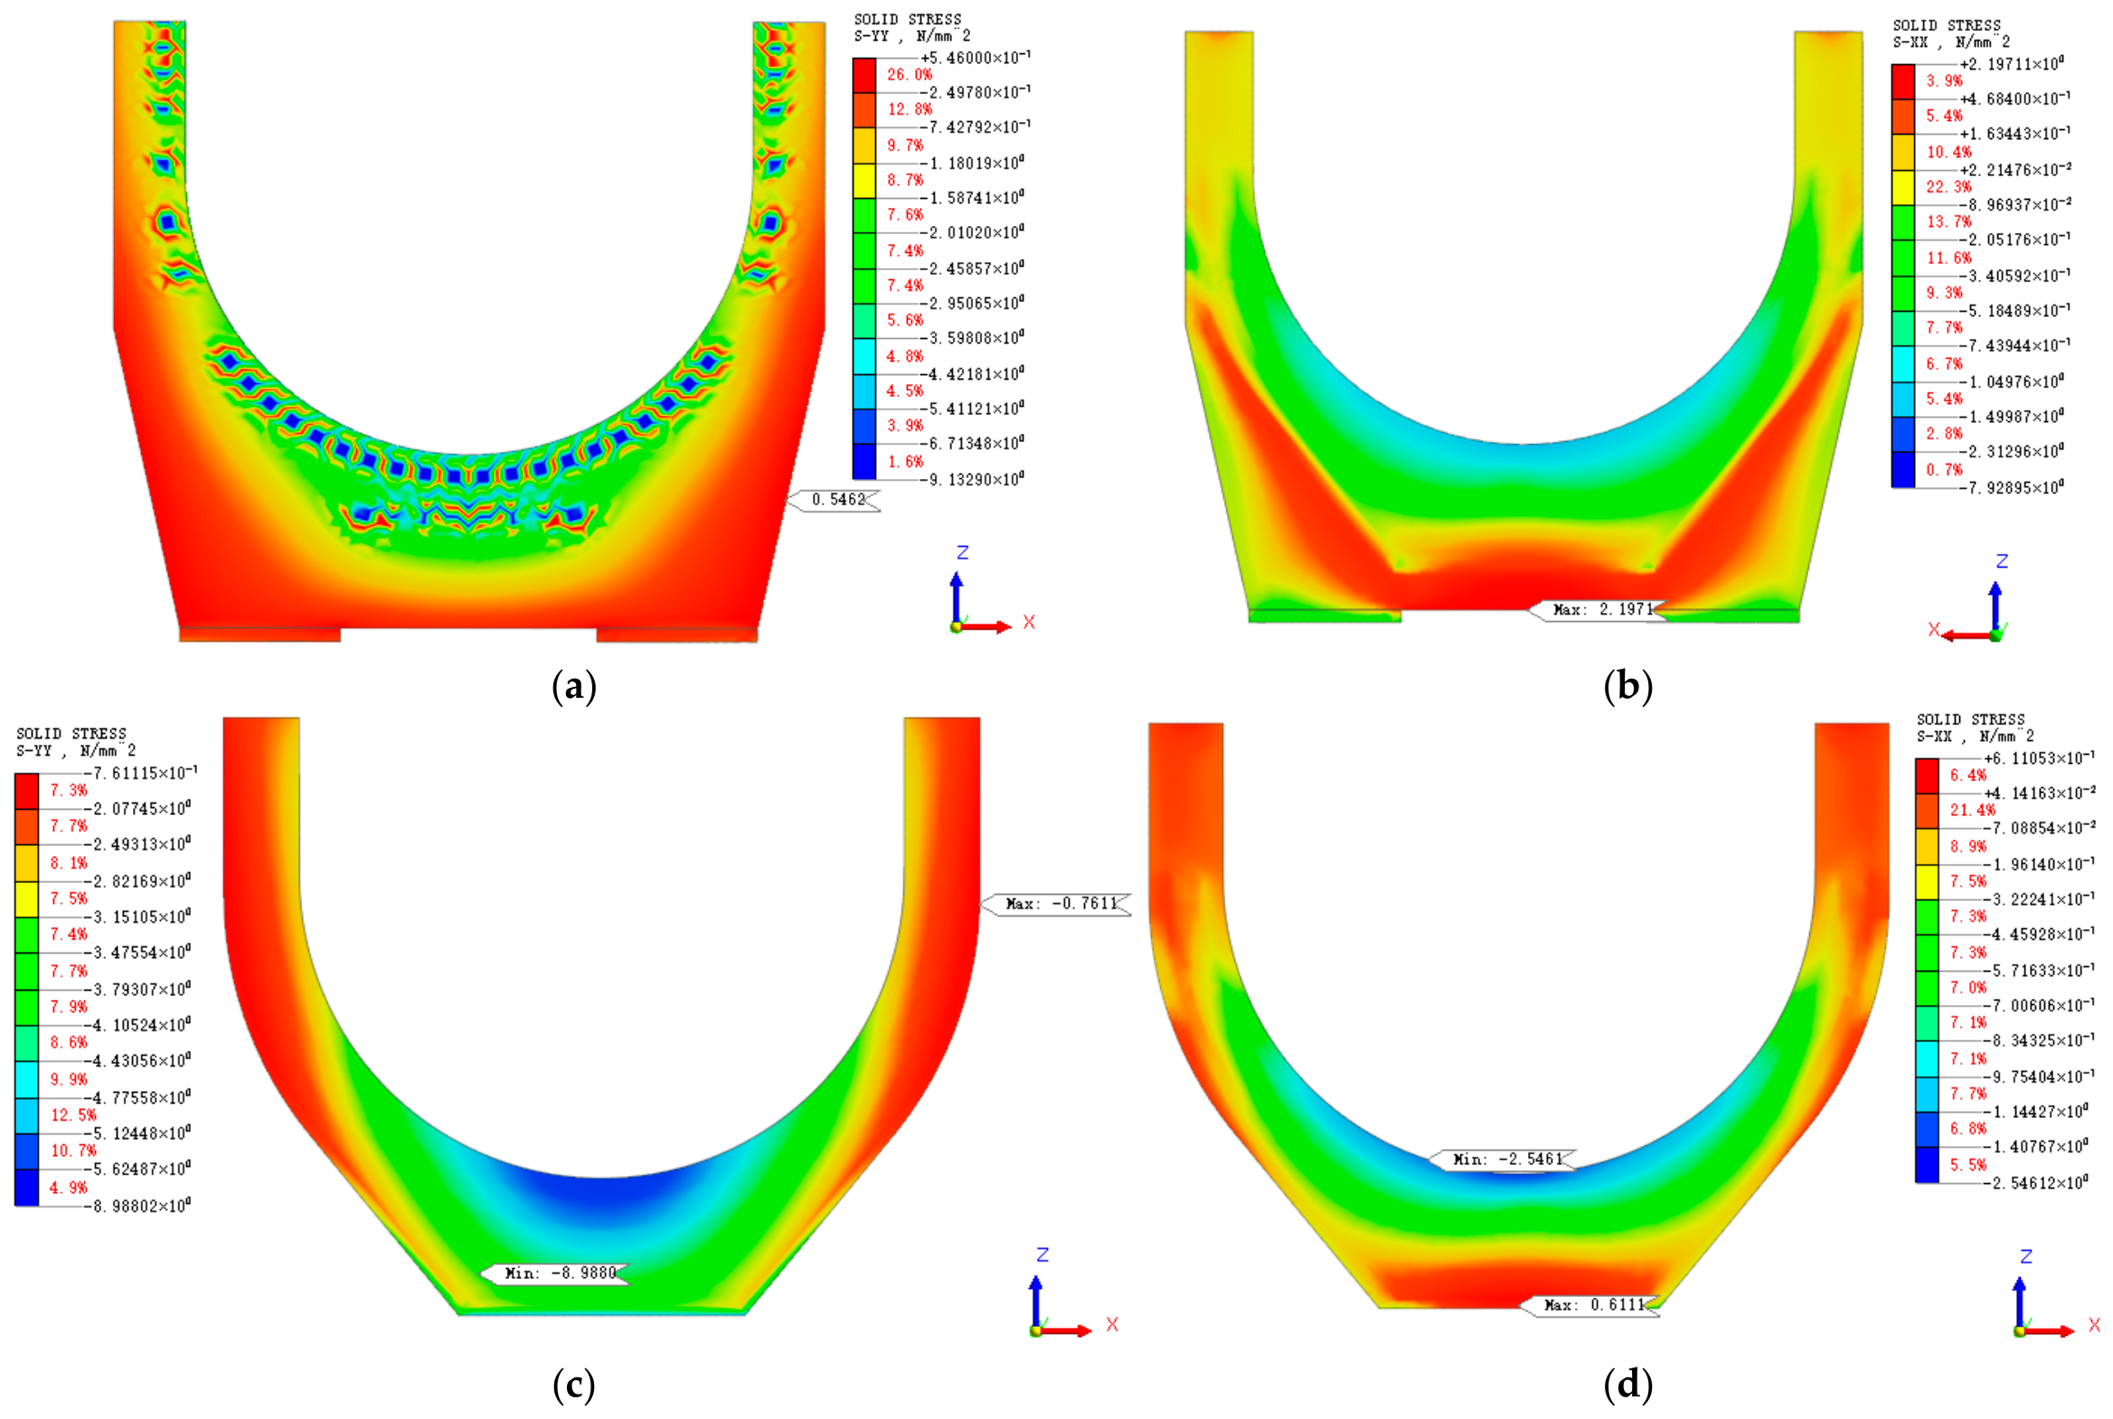
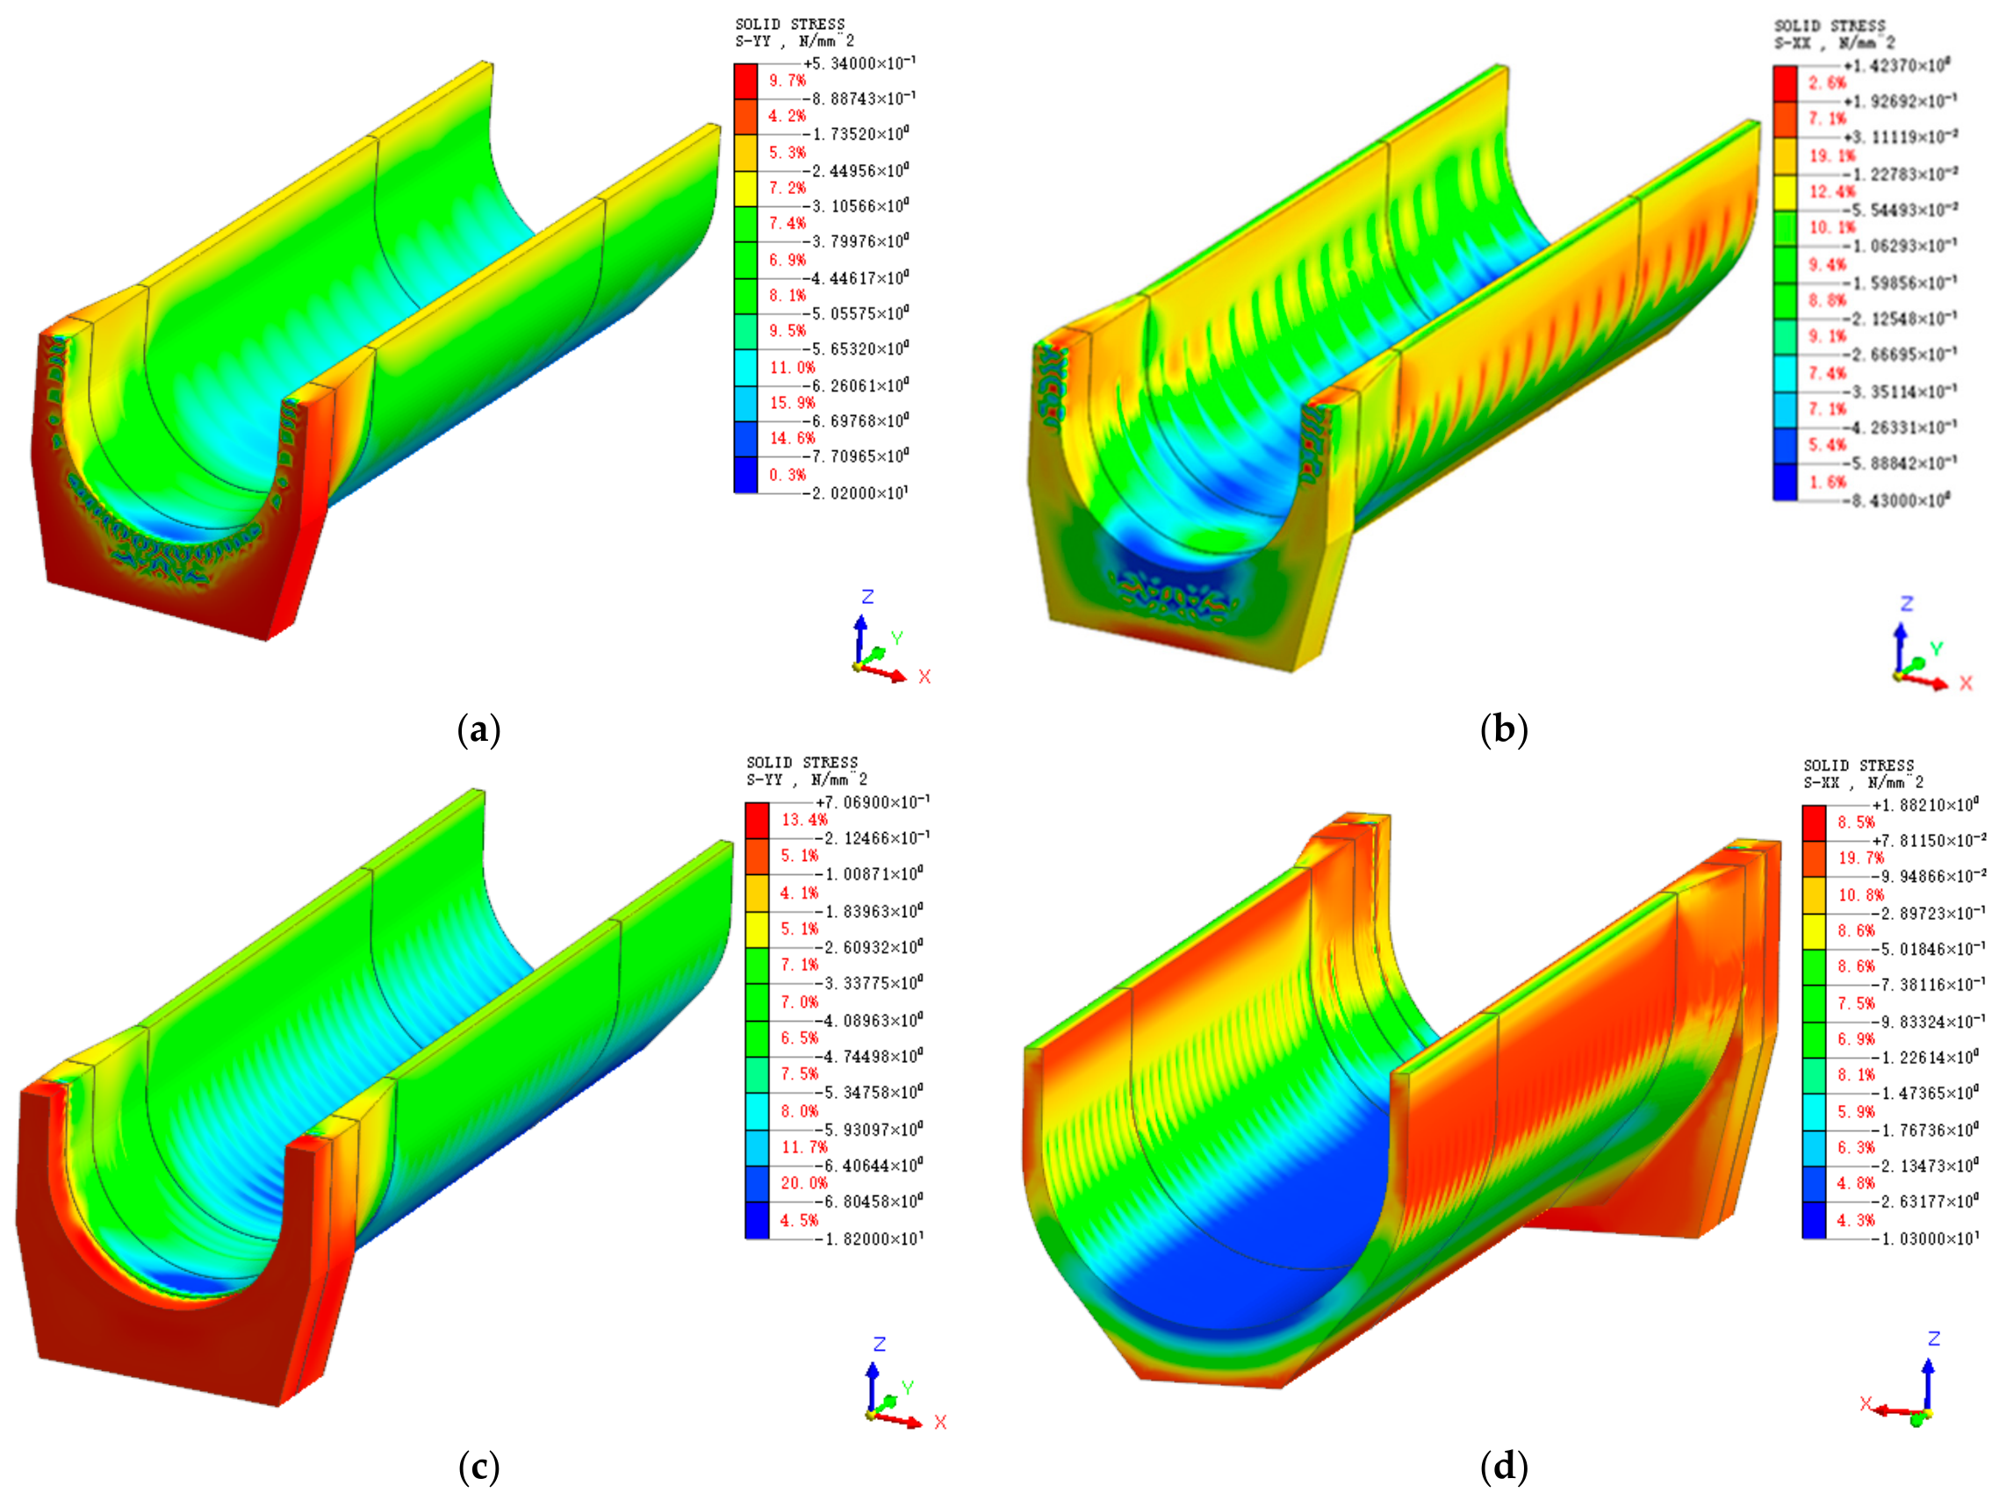
The longitudinal stress, transverse stress, and vertical stress at the midspan section are illustrated in Figure 10a–f, while the stress distributions at the end section and the transition section are shown in Figure 11a–d. The finite element simulation results are compared to the measured stress values (average of left and right), and the comparison is presented in Table 2.
Based on the finite element simulation results and the comparison between measured and simulated stresses, it is found that in the midspan section, no tensile stress was observed on the inner wall in either the longitudinal or circumferential directions, while a minor longitudinal tensile stress of 0.55 MPa was recorded on the outer wall at the end of the side wall, as shown in Figure 10a. For the groove body, no tensile stress was present on the inner wall, and the maximum tensile stress on the outer wall was 2.20 MPa, concentrated at the middle of the bottom rib at the end, as illustrated in Figure 10b. This area is located far from the water surface and is reinforced with ordinary steel bars, reducing the impact on structural durability. Figure 10c confirms that no longitudinal tensile stress is present in any part of the transition section. In the transition section, no tensile stress was found on either the inner or outer walls, except for a negligible tensile stress of 0.61 MPa at the bottom of the outer wall, as depicted in Figure 10d.
The analysis indicates that the prestress design effectively reduces tensile stresses throughout the aqueduct structure. The localized tensile stresses observed in non-critical regions, combined with the use of ordinary steel reinforcement, ensure that the structural integrity and durability of the aqueduct are adequately maintained. The aqueduct body is predominantly under compression across the full section, and the simulated stress closely aligns with the measured stress results, verifying the accuracy of the simulation model.

4.2. Discussion on Different Tensioning Sequence

4.2.1. Practicable Tensioning Schemes

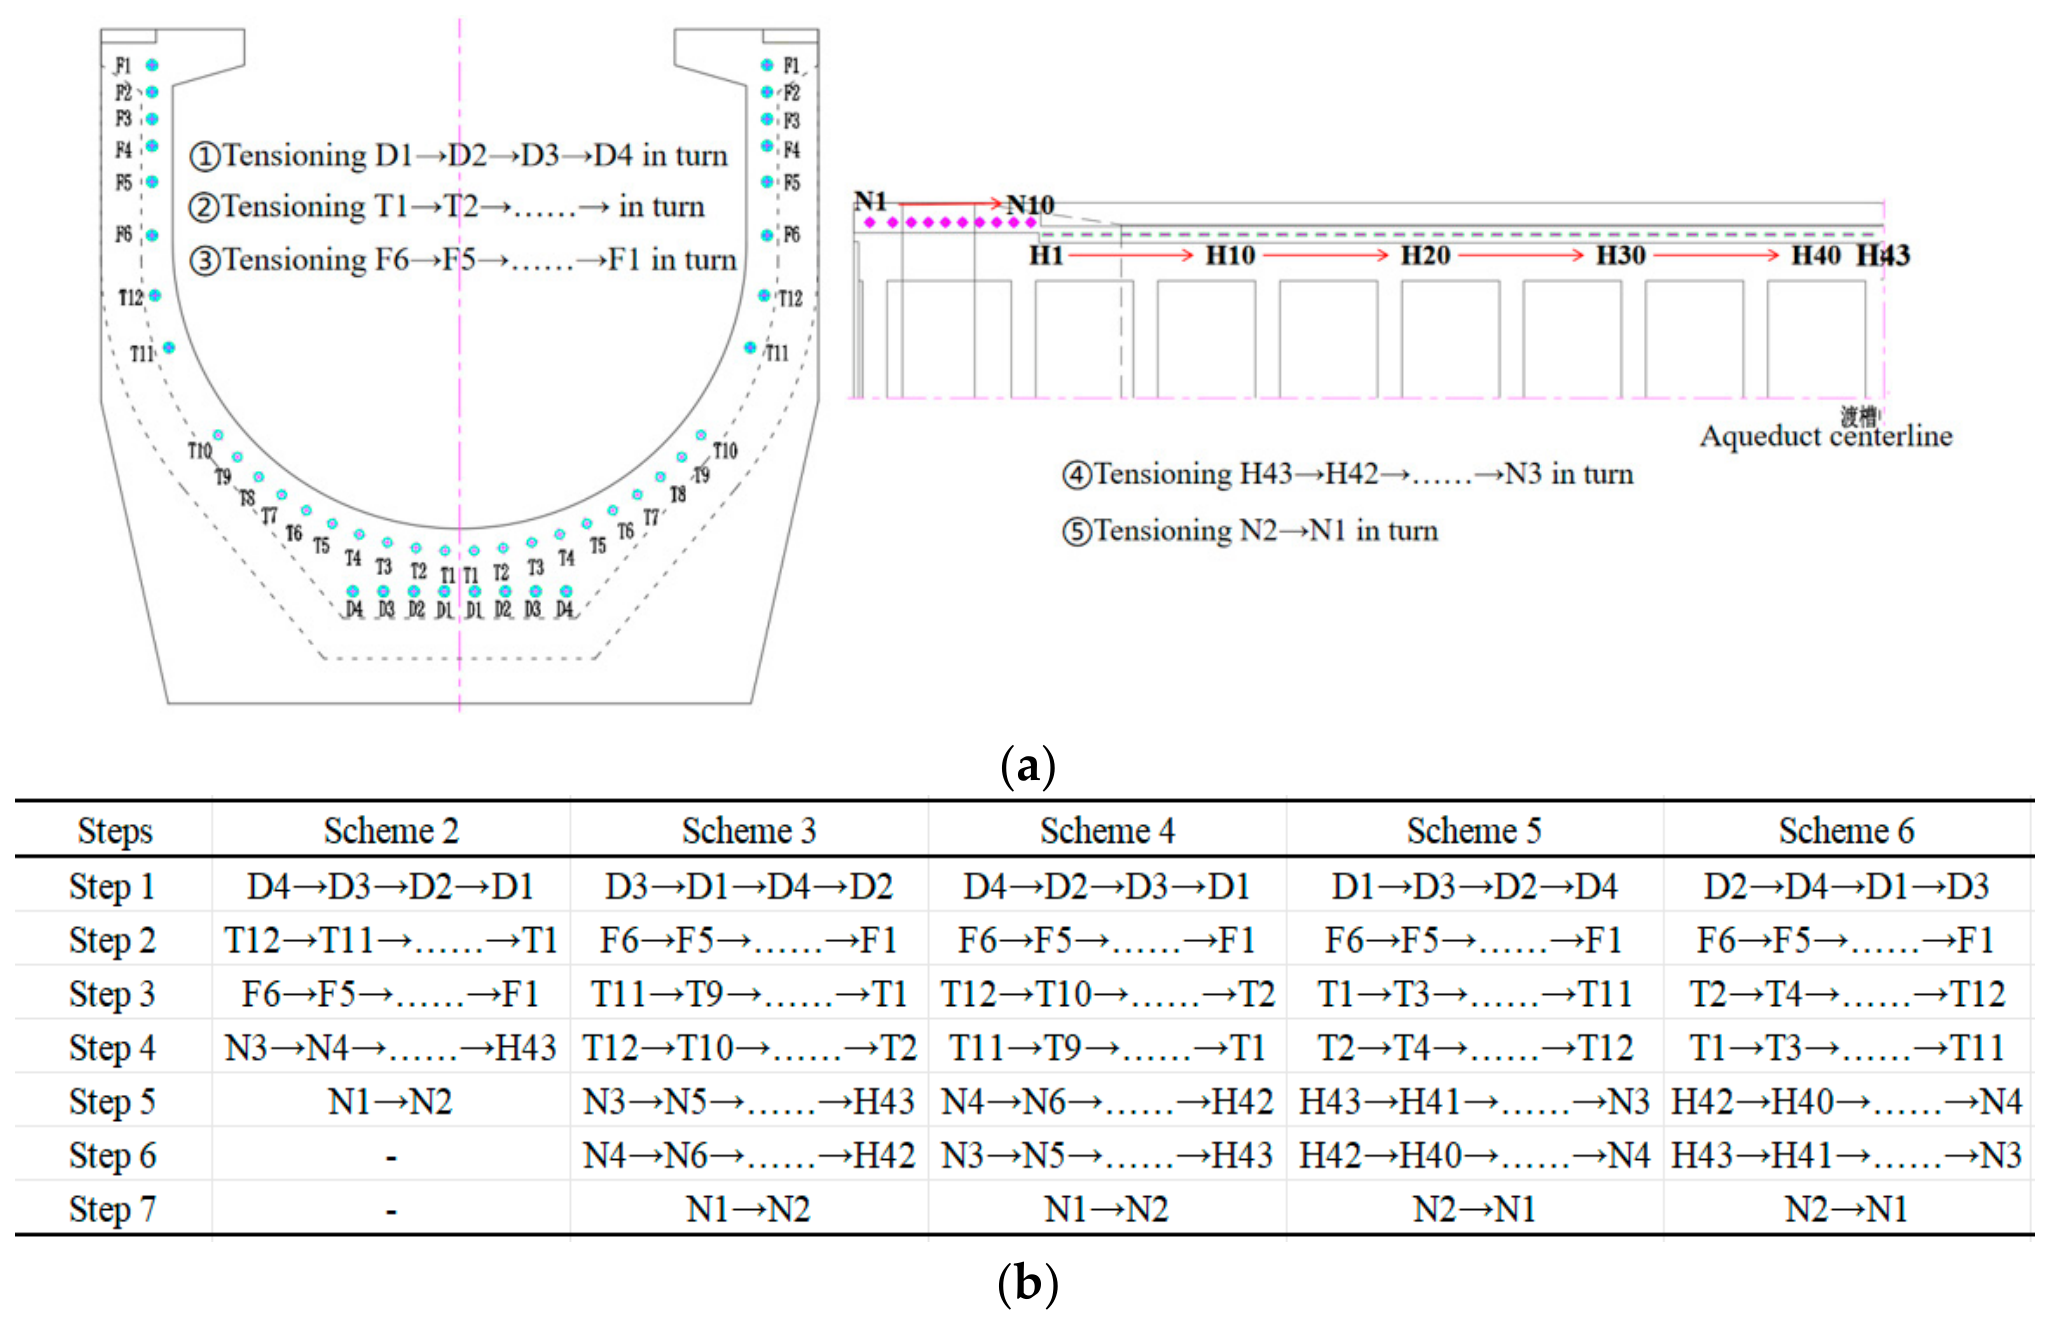
Six comparative tensioning schemes were proposed, with Figure 12a presenting Scheme 1 and Figure 12b displaying the other five schemes.
The circumferential steel bundle in a continuous tension state can be tensioned either from both sides to the middle or from the middle to both sides by comparing Scheme 1 and Scheme 2. The sensitivity of the aqueduct’s stress state to the odd–even sequence of tensioning can be identified by comparing Scheme 3 and Scheme 4.
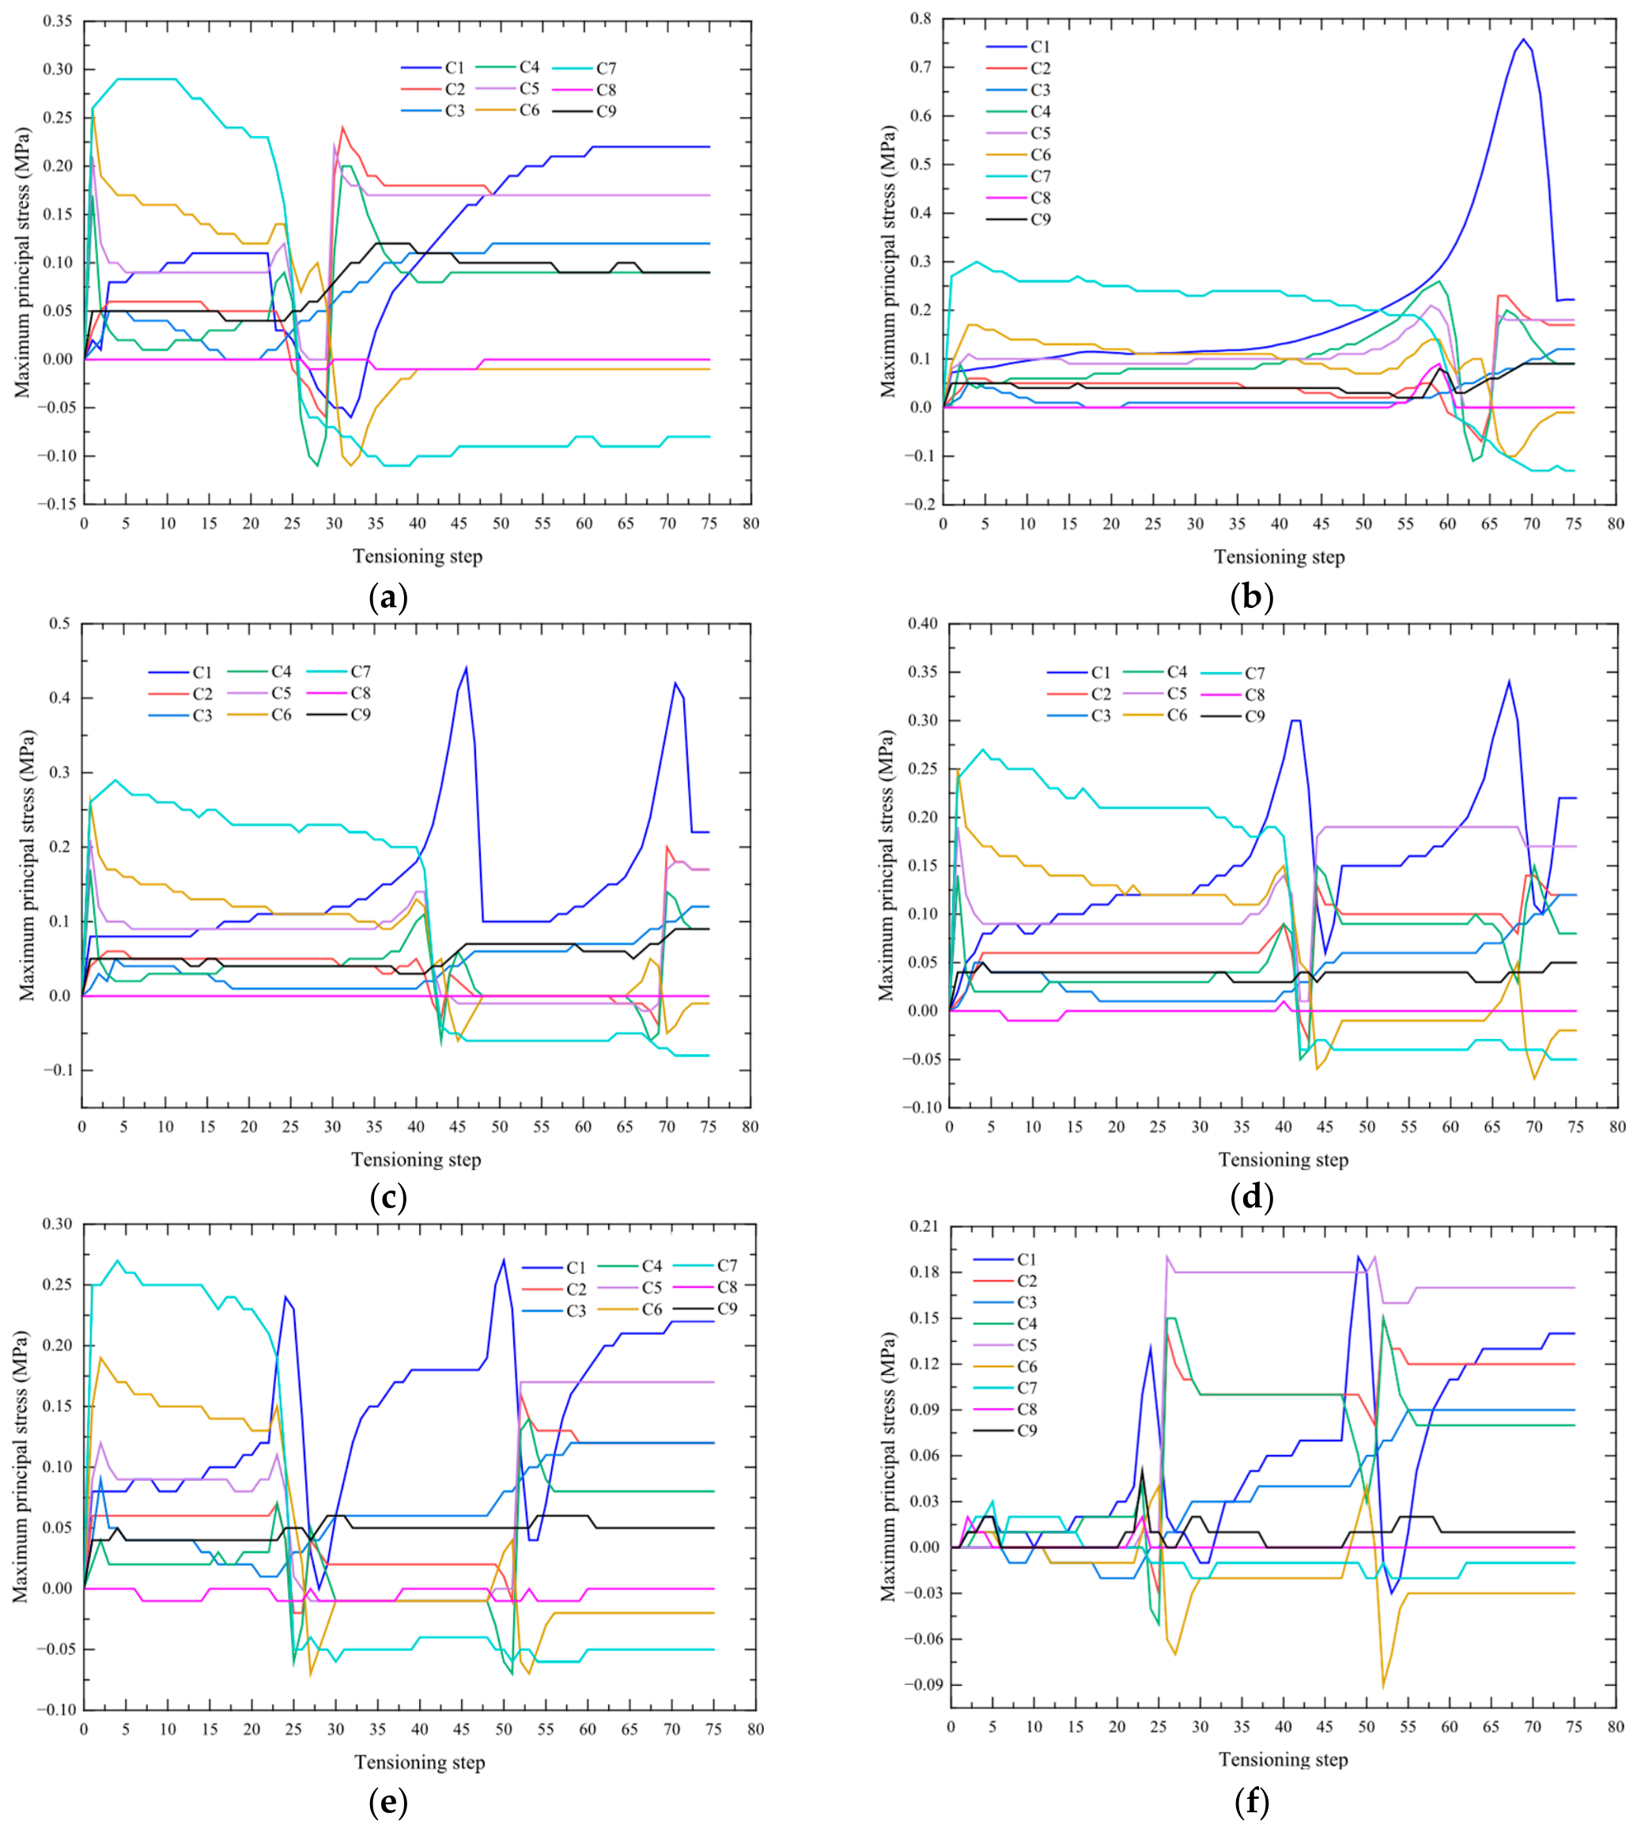
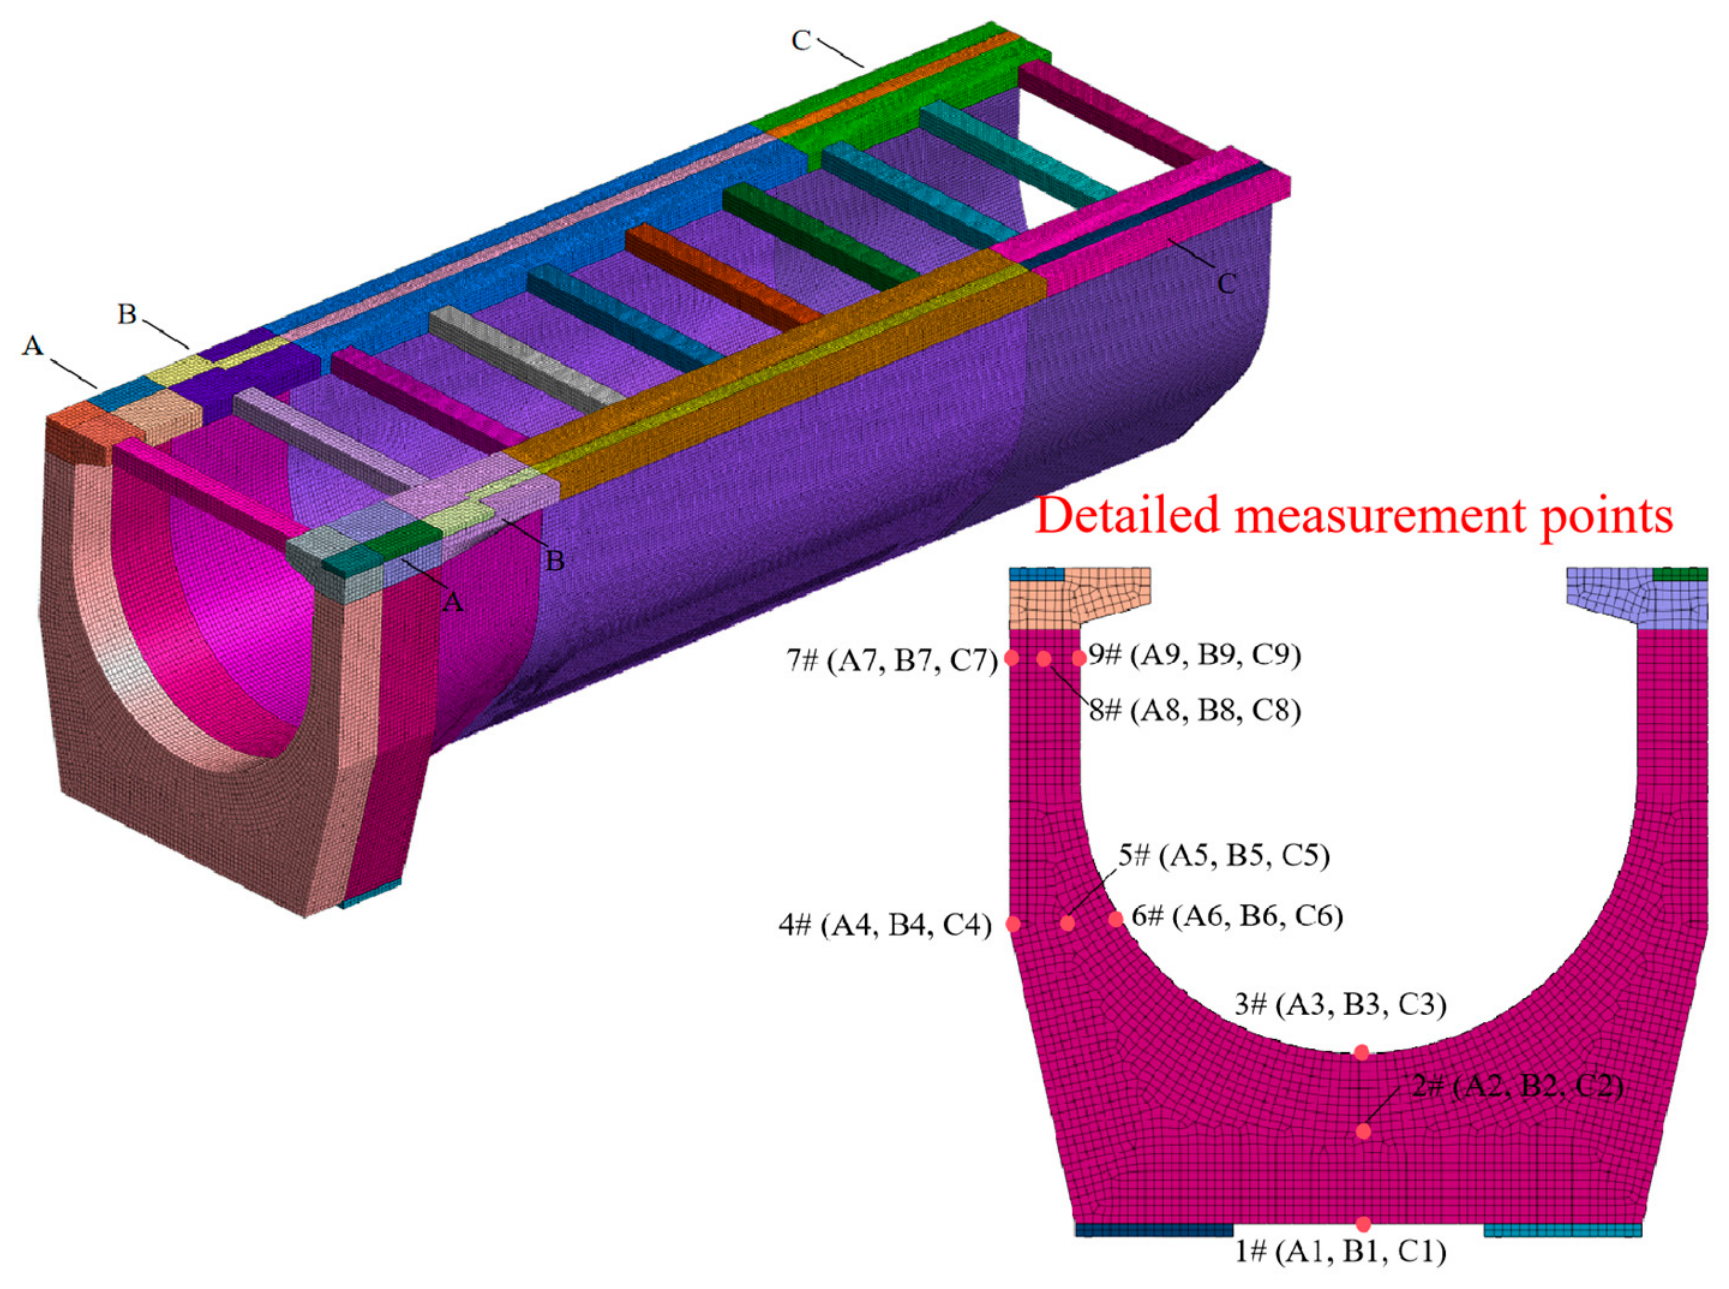
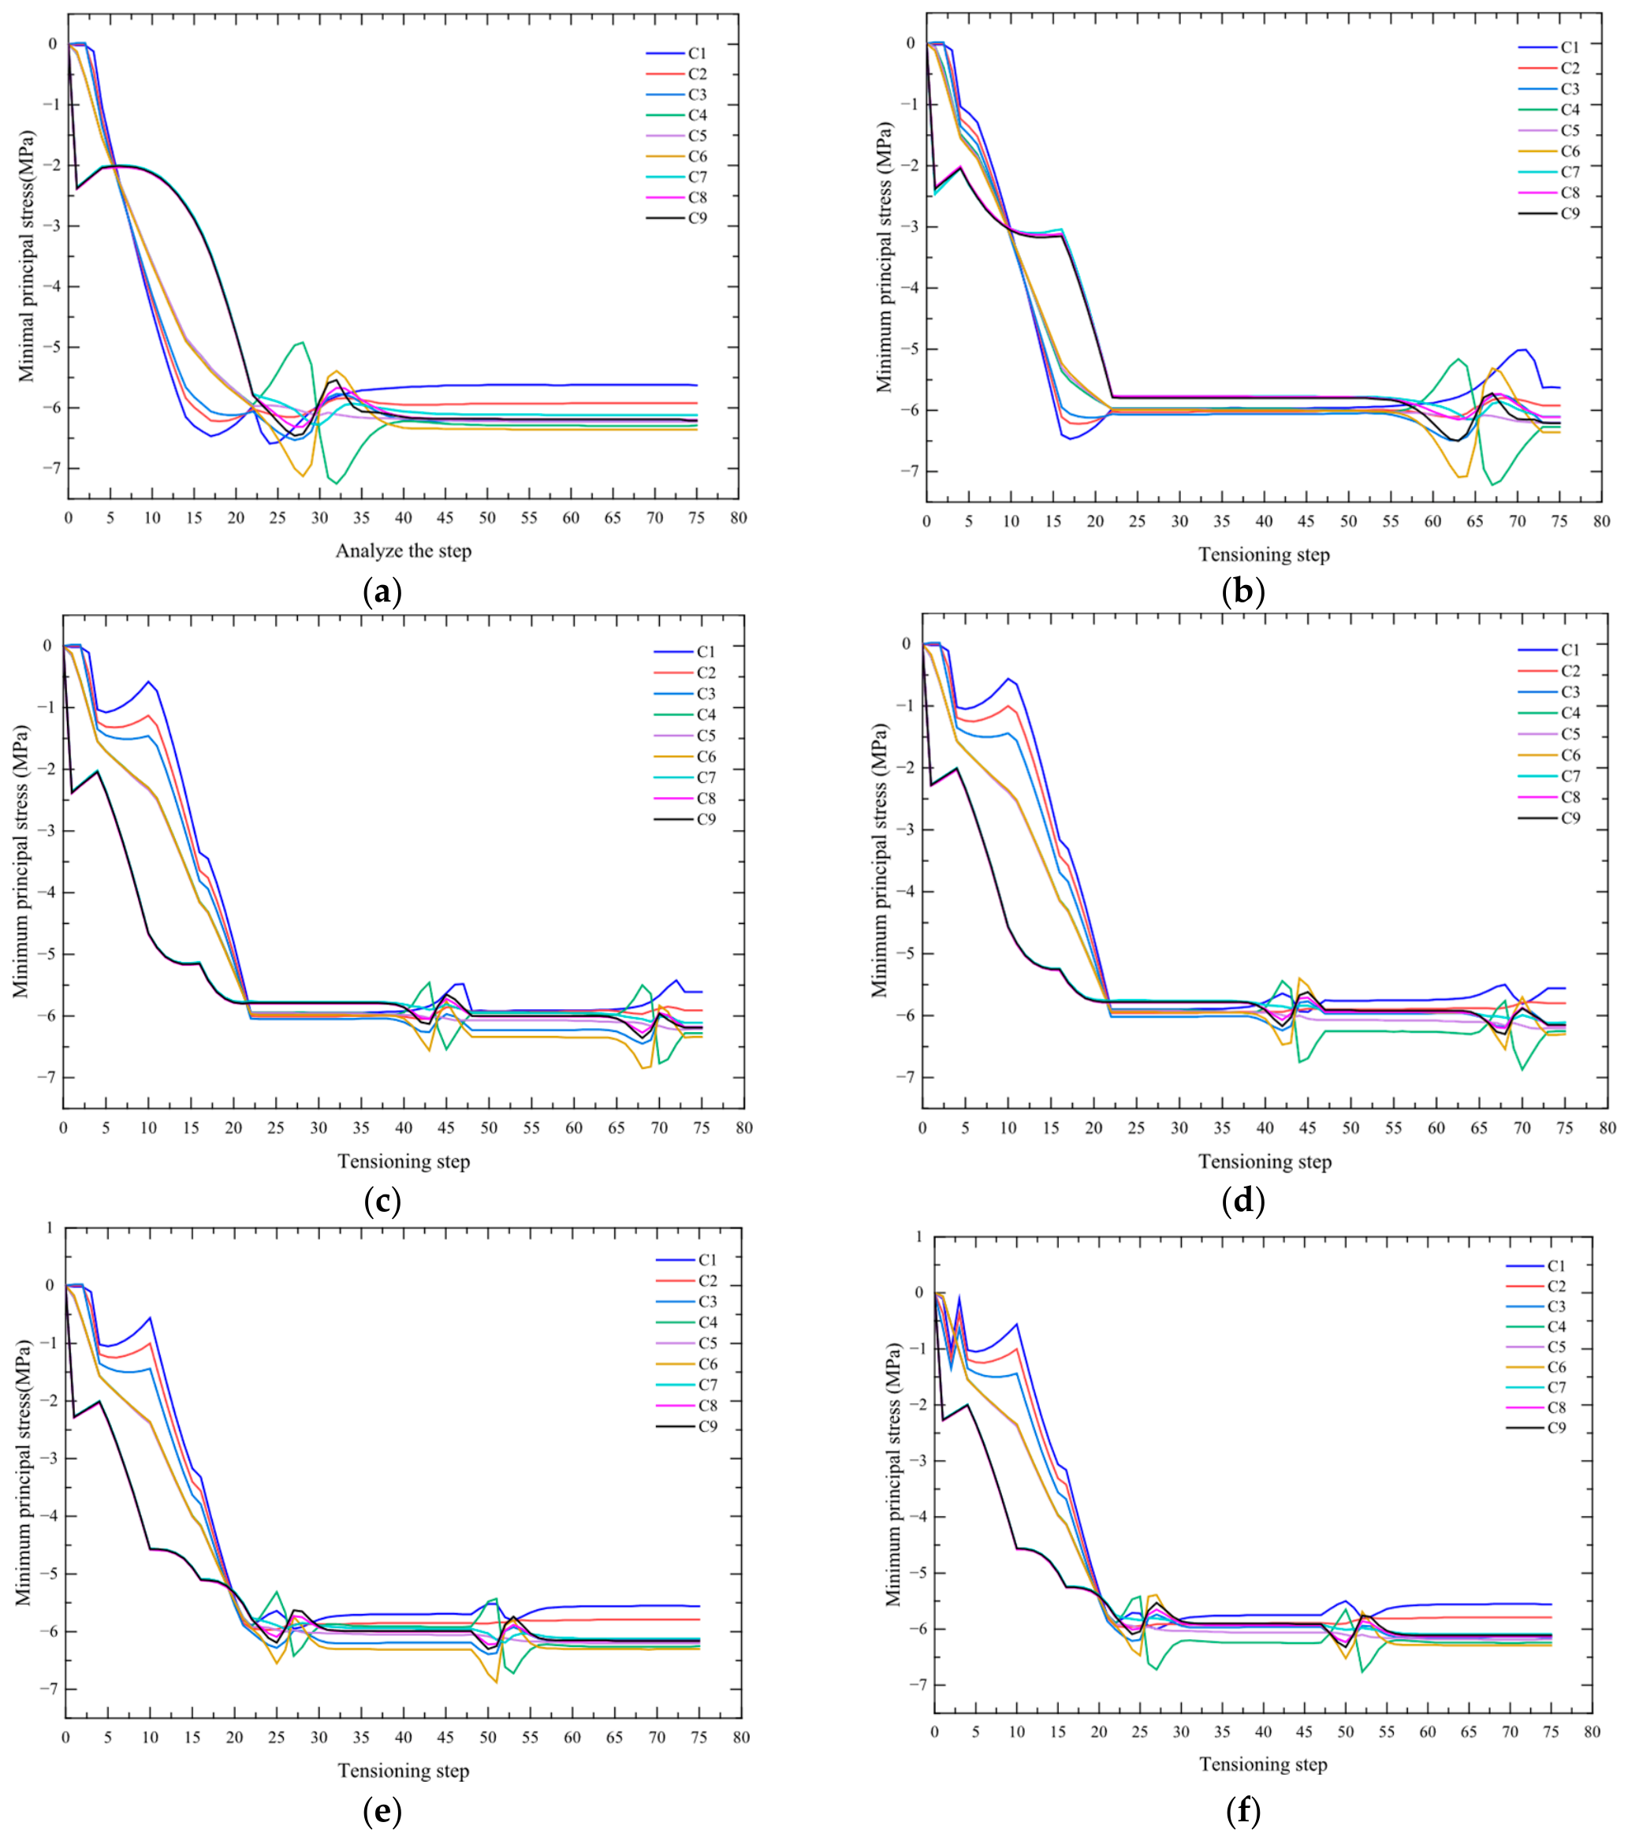
Figure 13 indicates that three typical sections were selected, end Section A, transition Section B, and midspan Section C, to facilitate the comparison of stress state differences under various tensioning sequences. This study compares six tensioning schemes for the longitudinal and circumferential tendons of the aqueduct structure, analyzing stress–time history curves for each section (Figure 14 and Figure 15).

4.2.2. Schemes 1 and 2

Continuous tensioning of longitudinal tendons to the control stress resulted in the development of tensile stresses in Section B (B1–B3: <1 MPa) and Section C (C7: <0.3 MPa), with Section B identified as the critical tensile region (maximum tensile stress < 2.24 MPa). Simultaneously, significant compressive stresses were recorded at the outer bottom slabs of Section B (B3: 7.3 MPa) and Section C (C1: 6.5 MPa). During circumferential tendon tensioning, tensile stresses generally decreased, except in Section C (C1, C2, C4, C5), which exhibited an increasing trend, while compressive stresses progressively increased, enhancing the utilization of concrete’s compressive strength.
When comparing the two schemes, Scheme 1 exhibited a significant tensile stress trend in Section C during H35 tendon tensioning, whereas Scheme 2 avoided this issue. In addition, Scheme 1 sustained high tensile stress levels in Section B for a longer period than Scheme 2. In contrast, Scheme 2 generated higher compressive stresses at the same tensioning stage, leading to improved stress distribution and enhanced structural performance.
In conclusion, Scheme 2, which applies continuous symmetric tensioning from both sides toward the center, outperforms Scheme 1. It effectively reduces tensile stress concentrations, shortens the duration of high tensile stress, and improves the distribution of compressive stress. These characteristics make it the preferred method for achieving efficient stress management and enhancing structural durability in aqueduct design.

4.2.3. Schemes 3 and 4

The stress distribution and time–history curves of the aqueduct under Schemes 3 (‘odd-numbered first, even-numbered later’) and 4 (‘even-numbered first, odd-numbered later’) were analyzed. The results indicate that the stress–time history curves for both schemes are nearly identical, indicating that the odd–even sequence of tendon tensioning does not significantly influence the aqueduct’s stress state, and both schemes have equal priority. During interval tensioning, the stress levels increase in a staged manner, reflecting a consistent and gradual change in the stress state throughout the tensioning process. When longitudinal tendons are tensioned to 60% of the control stress, Section A’s inner bottom slab (A1) experiences tensile stress of nearly 0.8 MPa, while the outer sides exhibit smaller tensile stresses below 0.2 MPa. Section B’s entire cross-section (B2, B3) demonstrates tensile stresses ranging from 0.9 to 1.2 MPa, whereas Section C maintains minimal tensile stress levels (<0.3 MPa). Compressive stresses at 60% control stress reach nearly 5 MPa at Section A’s inner bottom slab (A3) and approximately 7.5 MPa at the inner bottom slabs of Sections B and C (B3).
As circumferential tendons are tensioned, tensile stresses in Section A’s bottom slab (A1, A2, A3) and outer side wall (A9) increase but remain below 1.2 MPa. In Section B, tensile stresses remain relatively unaffected, staying below 1.0 MPa, while Section C’s outer bottom slab (C1) reaches a maximum tensile stress of approximately 0.4 MPa. Compressive stresses increase progressively, with maximum values of 5 MPa at Section A’s inner bottom slab (A3), 7.3 MPa at Section B’s outer top (B7), and 7.0 MPa at Section C’s outer bottom slab (C1). A comparison between Schemes 3 and 4 indicates that, at the same tensioning stage, Scheme 3 results in lower tensile stress levels with shorter durations, making it more effective than Scheme 4.
In conclusion, the analysis confirms that the odd–even sequence of tendon tensioning has minimal influence on the aqueduct’s stress behavior. However, Scheme 3 is preferred due to its capacity to reduce tensile stress levels and durations, ensuring a more uniform and controlled stress distribution throughout the tensioning process.

4.2.4. Schemes 5 and 6

The stress distribution under Schemes 5 and 6 was analyzed, exhibiting trends similar to Scheme 3. However, Scheme 5 produces higher tensile stresses at Section A’s outer side wall (A9) and Section B’s inner bottom slab (B3), with maximum values exceeding 1.18 MPa, compared to Scheme 6, where tensile stresses remain below 1.0 MPa. Scheme 5 also maintains elevated tensile stresses for a longer duration. In Section C, Scheme 5’s tensile stresses stay below 0.2 MPa, while Scheme 6’s values mostly remain under 0.15 MPa.
Regarding compressive stress, Scheme 5 produces higher levels with extended durations, improving the utilization of concrete’s compressive strength. Scheme 5 is considered superior due to its better control of tensile stresses and its optimized distribution of compressive stress, making it the preferred approach for aqueduct tensioning.

4.2.5. Comprehensive Analysis Results

Through a comprehensive analysis, three preferred schemes, Scheme 2, Scheme 3, and Scheme 5, were identified and compared (Table 3). Scheme 3 generates lower tensile stresses and demonstrates more stable stress variations than Scheme 2. When compared to Scheme 5, Scheme 3 achieves comparable compressive stresses while maintaining lower tensile stresses during tensioning. In addition, Scheme 3 results in shorter durations of high tensile stress and longer durations of compressive stress than the original design, contributing to smoother stress transitions. Therefore, Scheme 3 is identified as the optimal choice, providing improved stress control and enhanced structural performance for the aqueduct. These findings provide valuable guidance for optimizing tensioning sequences in aqueduct design and similar engineering applications.

4.3. Optimizing Circumferential Steel Strands

It is known that longitudinal tensile stress in a small area typically appears on the outer surface at the end, and the ‘tightening’ effect of the circumferential steel bundle near this region increases the longitudinal tensile stress in that area. The longitudinal tensile stress can be reduced by appropriately increasing the spacing of the circumferential steel bundle in this section. Therefore, the arrangement of the circumferential strand of the aqueduct body was optimized. Specifically, the circumferential 5Φs15.2 strand was modified to 7Φs15.2, the number of holes was reduced from 106 to 78, and the center spacing of adjacent holes was increased from 40 to 60 cm. Figure 16 illustrates the optimized configuration of the hoop strands.
Figure 17 presents the stress contour diagram at each tensioning step:
(1)
When the tension reaches the second step, the maximum tensile stress in the circumferential direction of the aqueduct body appears at the bottom of the aqueduct end and reaches 0.22 MPa. The maximum longitudinal tensile stress of the aqueduct is 0.28 MPa and occurs on the side wall of the aqueduct end.
(2)
When tensioning reaches the fifth step, the maximum tensile stress in the circumferential direction of the groove body appears at the bottom of the groove body end and reaches 2.04 MPa. The maximum longitudinal tensile stress of the aqueduct appears at the bottom of the aqueduct end and is 0.53 MPa.
(3)
When tensioning progresses to the sixth step, the maximum tensile stress in the circumferential direction of the groove body is observed at the bottom of the end of the groove body and is 1.91 MPa; the maximum longitudinal tensile stress of the aqueduct body appears at the bottom of the body end and is 0.50 MPa.
(4)
When tensioning reaches the eighth step, the maximum tensile stress of the groove body is observed at the bottom of the end of the groove body and is 1.88 MPa. The maximum longitudinal tensile stress of the aqueduct body appears at the bottom of the body end and reaches 0.71 MPa.
The maximum longitudinal tensile stress of the aqueduct body appears at the bottom of the body end and reaches 0.71 MPa. The above results indicate that the optimized aqueduct remains in a state of compression during the tensioning process. Only a limited tensile stress occurs at the bottom and upper sections of the aqueduct end, and the magnitude of this tensile stress is relatively low.

5. Conclusions

In this paper, the short-term and long-term (1-year post-tensioning) prestress losses in bi-directional prestressed tendons and concrete stress are quantified using field test data. Based on finite element analysis, the impact of tendon tensioning sequences and optimized tendon arrangement are discussed. The main conclusions are as follows:
(1)
When the web (F4) and bottom plate (D4) steel bundles are stretched at one end, the prestress loss rates caused by pipeline friction are 4.82% and 5.08%, respectively. The measured κ value of the longitudinal steel bundle is 0.0013.
(2)
The effective prestress of the longitudinal steel bundles in the web (F4), bottom plate (D4), and arc section (T4 and T10) in the span are 1080.12, 1100.65, 1068.75 and 1066.24 MPa, respectively. When the beam end and the span circumferential steel bundle are tensioned at one end, the prestress loss rates caused by pipeline friction reach a maximum of 35.84% and 39.23%, respectively.
(3)
The friction loss of the circumferential steel bundle at the bottom of the beam (the location with the greatest loss) at the beam end and midspan section is approximately 21.9%, and the final anchor stresses are 953.45 and 870.4 MPa, respectively. The prestress loss caused by the elastic compression of concrete in the circumferential steel bundle is negligible.
(4)
The measured stress results of the midspan cross-section and the near-support center section indicate that the inner and outer walls of the aqueduct are in a state of compression under the empty groove condition, and the compressive stress level is significant. The simulated stress is close to the measured stress, which confirms the accuracy of the aqueduct stress test results.
(5)
The transverse tensile stress generated at the end and the transition section is greater than that at the midspan section by analyzing the stress distribution of the aqueduct under each tensioning scheme. Therefore, it is generally advisable to tension the ring-shaped steel bundle in the order of ‘from both ends to the middle-span’.
(6)
After increasing the spacing of the circumferential steel bundle, the groove body still maintains a high compressive stress level, and only the bottom and upper parts at the end of the groove body exhibit slight tensile stress. Hence, the spacing of the circumferential steel bundle can be appropriately increased to reduce costs and improve work efficiency.

6. Recommendations

(1)
Expansion of research objects and working conditions. This study focuses on a 42 m span simply supported U-shaped aqueduct, and future research can be extended to continuous U-shaped aqueducts with larger spans, variable cross-section U-shaped aqueducts, and other special-shaped aqueduct structures, to explore the general law of prestress loss and the optimization method of prestress systems for different types of aqueducts. In addition, this study only considers the self-weight and prestress load under the empty groove condition, and the influence of long-term water level fluctuation, hydrodynamic pressure, seismic load, freeze–thaw cycle and other complex working conditions on the prestress loss and structural stress evolution of the aqueduct can be further studied in the future.
(2)
Probabilistic assessment of prestress loss considering multi-source uncertainties. The deterministic analysis method is adopted in this study, and the randomness of material parameters, construction errors, environmental factors and on-site test data is not fully considered. Future research can introduce the Bayesian inference framework, Monte Carlo simulation and other uncertainty analysis methods, combined with the field test database of multiple aqueduct projects, to establish a probabilistic prediction model of prestress loss for U-shaped aqueducts, and carry out the time-varying reliability analysis and life prediction of the aqueduct structure during the whole service period.
(3)
Multi-objective optimization of prestress system considering long-term performance. The optimization of the tensioning sequence and tendon layout in this study is mainly based on the static stress distribution of the structure. Future research can carry out multi-objective optimization design of the prestress system, with the structural anti-cracking performance, dynamic characteristics, fatigue life and full life cycle cost as the optimization objectives, to obtain a more comprehensive and economical prestress scheme that takes into account both the short-term construction safety and long-term service performance of the aqueduct.
(4)
Research on long-term deterioration mechanism of prestressed aqueducts. This study quantifies the 12-month short-term and long-term prestress loss after tensioning, but the coupling effect of concrete carbonation, steel strand corrosion, concrete shrinkage and creep under long-term service environment on the prestress loss of the aqueduct is not considered. Future research can combine accelerated corrosion tests, long-term field monitoring and numerical simulation to reveal the coupling deterioration mechanism of the prestressed system and concrete material of U-shaped aqueducts, and establish a refined time-varying model of prestress loss in the whole service life.

Author Contributions

Conceptualization, P.L.; validation, T.W.; formal analysis, Y.O.; funding acquisition, X.Z.; writing—original draft, Y.O. and P.L.; writing—review and editing, X.Z. All authors have read and agreed to the published version of the manuscript.

Funding

This study was supported by the Sichuan Science and Technology Program (grant No. 2025ZNSFSC0411).

Institutional Review Board Statement

Not applicable.

Informed Consent Statement

Not applicable.

Data Availability Statement

The raw data supporting the conclusions of this article will be made available by the authors on request.

Conflicts of Interest

Authors Pingan Liu, Tiehu Wang and Yupeng Ou were employed by the company Power China Chengdu Engineering Corporation Limited. The remaining authors declare that the research was conducted in the absence of any commercial or financial relationships that could be construed as a potential conflict of interest.

References

  1. Zhang, F. Construction technology of key points of prestressed aqueduct body in aqueduct engineering. Eng. Technol. Res. 2020, 5, 91–92. (In Chinese) [Google Scholar]
  2. Páez, P.M. An Approach to Determine the Prestress Loss in Unbonded Prestressed Composite Concrete Members. Int. J. Concr. Struct. Mater. 2026, 20, 10. [Google Scholar] [CrossRef]
  3. Pushkaran, T.; Ghosh, S. Ageing Indian nuclear containment structures: Application of Bayesian methods in the estimation of prestress loss. Nucl. Eng. Des. 2026, 454, 114940. [Google Scholar] [CrossRef]
  4. Xiao, Y.; Zhang, X.; He, C. Finite element calculation and analysis of stress deformation of a large prestressed aqueduct structure. Water Resour. Plan. Des. 2024, 2024, 155–159. (In Chinese) [Google Scholar]
  5. Zhang, J.; Cao, K.; Zhao, Y. Modal analysis and verification of u-shaped aqueduct based on fluid-structure interaction model. Trans. Chin. Soc. Agric. Eng. 2016, 32, 98–104. (In Chinese) [Google Scholar]
  6. Kim, S.H.; Park, S.Y. Friction characteristics of post-tensioning tendons in full-scale structures. Eng. Struct. 2019, 183, 389–397. [Google Scholar] [CrossRef]
  7. Yao, W.; Ma, W. Finite element simulation analysis of reinforced concrete prefabricated trench. Sci. Technol. Innov. 2023, 2023, 103–108. (In Chinese) [Google Scholar]
  8. Zhu, W.; Shen, Q.; Qin, H. Monitoring of prestress and bond stress of self-sensing FBG steel strand. Measurement 2021, 177, 109246. [Google Scholar] [CrossRef]
  9. Xie, F.; Chang, T.; Zhang, C. Medium and short-term effective prestress losses considering multiple factors: Laboratory and on-site beam experiments. Structures 2024, 68, 107166. [Google Scholar] [CrossRef]
  10. Bonopera, M.; Chang, K.; Lee, Z. State-of-the-art review on determining prestress losses in prestressed concrete girders. Appl. Sci. 2020, 10, 7257. [Google Scholar] [CrossRef]
  11. Zhang, F.; Ye, J.; Liu, J. Correction of time and temperature effects for lift-off test technology. China J. Highw. Transp. 2019, 32, 80–89. (In Chinese) [Google Scholar]
  12. JTG/T 3650-2020; Technical Specifications for Construction of Highway Bridges and Culverts. China Communication Press: Beijing, China, 2020. (In Chinese)
  13. Tao, G.; Zhuge, P.; Lin, D.Y. Study on short-term prestress loss of bridge reinforced with large diameter carbon fiber bars. In IOP Conference Series: Earth and Environmental Science; IOP Publishing: Bristol, UK, 2021; Volume 820, p. 012001. [Google Scholar] [CrossRef]
  14. Biswal, S.; Ramaswamy, A. Measurement of existing prestressing force in concrete structures through an embedded vibrating beam strain gauge. Measurement 2016, 83, 10–19. [Google Scholar] [CrossRef]
  15. Wang, H.; Li, C.; Zhao, L. Experimental study on dynamic interaction between large u-shape aqueduct and water. KSCE J. Civ. Eng. 2022, 26, 1203–1213. [Google Scholar] [CrossRef]
  16. MIDAS Information Technology Co., Ltd. MIDAS FEA NX User Manual; MIDAS Information Technology Co., Ltd.: Seongnam, Republic of Korea, 2024. [Google Scholar]
Figure 1. General layout of the studied 42 m long U-shaped aqueduct (unit: cm): (a) cross-section; (b) site photo.
Eng 07 00239 g001
Figure 2. Arrangement of steel strands: (a) longitudinal steel; (b) circumferential steel.
Eng 07 00239 g002
Figure 3. Field test photos of the studied 42 m long U-shaped aqueduct: (a) tension test diagram for pipeline friction loss; (b) schematic of anchor cable load cell.
Eng 07 00239 g003
Figure 4. Change trend of loss rate due to prestress tube friction: (a) longitudinal tendon F4; (b) longitudinal tendon D4; (c) circumferential tendon N4; (d) circumferential tendon H43.
Eng 07 00239 g004
Figure 5. Long-term effective prestress under anchors for longitudinal and circumferential tendons.
Eng 07 00239 g005
Figure 6. Strain sensors: (a) at midspan section; (b) near end-span section; (c) at midspan section.
Eng 07 00239 g006
Figure 7. Longitudinal concrete stress at midspan section: (a) outer wall, daily low temperature; (b) outer wall, daily high temperature; (c) inner wall, daily low temperature; (d) inner wall, daily high temperature.
Eng 07 00239 g007
Figure 8. Circumferential concrete stress at midspan section: (a) outer wall, daily low temperature; (b) outer wall, daily high temperature; (c) inner wall, daily low temperature; (d) inner wall, daily high temperature.
Eng 07 00239 g008
Figure 9. Finite element model.
Eng 07 00239 g009
Figure 10. Concrete stresses at the midspan section for prestress tensioning (unit: MPa): (a) longitudinal stress; (b) longitudinal zone of tensile stress; (c) transverse stress; (d) transverse zone of tensile stress; (e) vertical stress; (f) vertical zone of tensile stress.
Eng 07 00239 g010
Figure 11. Concrete stresses for prestress tensioning (unit: MPa): (a) longitudinal stress at end-span section; (b) circumferential stress at end-span section; (c) longitudinal stress at transition section; (d) circumferential stress at transition section.
Eng 07 00239 g011
Figure 12. Tensioning schemes: (a) Scheme 1; (b) other practicable schemes.
Eng 07 00239 g012
Figure 13. Comparison of various sections and locations for different tensioning sequences.
Eng 07 00239 g013
Figure 14. Time-varying maximal principal stress at Section C: (a) Scheme 1; (b) Scheme 2; (c) Scheme 3; (d) Scheme 4; (e) Scheme 5; (f) Scheme 6.
Eng 07 00239 g014
Figure 15. Time-varying minimum principal stress at Section C: (a) Scheme 1; (b) Scheme 2; (c) Scheme 3; (d) Scheme 4; (e) Scheme 5; (f) Scheme 6.
Eng 07 00239 g015
Figure 16. Adjustment of circumferential steel strands (unit: cm).
Eng 07 00239 g016
Figure 17. Concrete stresses at different tensioning steps: (a) longitudinal stress, step 5; (b) circumferential stress, step 5; (c) longitudinal stress, step 8; (d) circumferential stress, step 8.
Eng 07 00239 g017
Table 1. Loss rate due to concrete elastic compression.
Test LocationData of Anchor Cable Gauge When Each Bundle Is Stretched to 100% Control Stress (kN)Prestress Loss Rate (%)Average Loss Rate (%)
F4D4T10T7T4T1
F4Left871.8815.8814.1815.8815.8816.86.317.36
Right904.3828.3828.3828.3828.3828.38.4
D4Left-1904.81836.6-1826.51818.94.516.5
Right-2043.31893.2-1875.91870.18.48
Table 2. Comparison of measured and simulated concrete stress (unit: MPa, ‘+’ representing tension, ‘−’ representing compression).
Test LocationMeasured ValuesSimulated Values
LongitudinalCircumferentialLongitudinalCircumferential
Pull rodUpper side−0.99–1.150.211.17
Underside−3.54–0.650−0.28
The outside of the top of the aqueduct−7.14–−4.98−5.72
The junction between the aqueduct body and the tie rod−5.49–−3.97−5.85
The top of the straight segment of the webInner wall−5.83–−4.55−4.20–−2.75−6.36−4.2
Outer wall−5.32–−3.92−2.87–−1.94−5.78−2.31
The bottom of the straight segment of the webInner wall−5.76–−4.42−2.75–−1.57−5.34−1.44
Outer wall−5.42–−3.96−3.86–−3.02−5.98−4.13
Web arc segmentInner wall−5.36–−4.41−2.15–−1.70−5.23−1.91
Outer wall−4.35–−3.32−1.66–−1.19−5.23−1.85
The bottom of the aqueductInner wall−5.74–−3.41−2.18–−0.89−5.08−2.54
Outer wall−3.83–−2.22−1.01–−0.64−4.320.36
Table 3. Typical concrete stresses for the preferred scheme.
SectionSchemeTensioning StepMaximal Value of Maximum
Principal Stress
Maximal Value of Minimum Principal Stress
LocationMomentStress (MPa)LocationMomentStress (MPa)
AScheme 220A9Longitudinal, 100%1.08C3Circumferential, 100%−5.2
Scheme 37A9Longitudinal, 30%1.22C3Circumferential, 100%−5.2
Scheme 533A2Longitudinal, 30%0.74C3Circumferential,100%−4.51
BScheme 222B3Longitudinal, 100%0.98B3Longitudinal, 100%−7
Scheme 322B3Longitudinal, 100%0.98B3Longitudinal, 100%−7.3
Scheme 548B1Longitudinal, 100%1.4A2Longitudinal, 100%−5.26
CScheme 268C1Circumferential, 85%0.76C4Circumferential, 80%−7.2
Scheme 346C1Circumferential, 45%0.43C6Circumferential, 90%−7.5
Scheme 531A1Longitudinal, 30%0.48A1Longitudinal, 100%−7.2
Disclaimer/Publisher’s Note: The statements, opinions and data contained in all publications are solely those of the individual author(s) and contributor(s) and not of MDPI and/or the editor(s). MDPI and/or the editor(s) disclaim responsibility for any injury to people or property resulting from any ideas, methods, instructions or products referred to in the content.