1. Introduction
Amyotrophic lateral sclerosis (ALS) is a progressive neurodegenerative disorder characterized by the degeneration of upper and lower motor neurons, leading to progressive muscle weakness, paralysis, and ultimately respiratory failure. The disease affects several motor functions, including limb mobility, speech production, swallowing, and respiratory control, significantly impairing the quality of life of affected individuals. Despite extensive research, ALS remains incurable, and current treatments are primarily palliative, aiming to slow disease progression and manage symptoms through multidisciplinary clinical care [
1,
2].
Early detection of ALS is clinically important because timely diagnosis allows earlier implementation of supportive interventions that may improve patient outcomes and quality of life. However, diagnosis remains challenging due to the absence of specific biomarkers and the heterogeneity of early symptoms. ALS is typically diagnosed through a combination of clinical examination, neurophysiological testing, neuroimaging, and the exclusion of other neurological conditions. Diagnostic delays and misdiagnoses are common in the early stages of ALS due to the absence of specific biomarkers and the heterogeneity of symptoms [
2,
3].
In recent years, computational approaches based on biomedical signals have been explored to support ALS diagnosis. Machine learning techniques have been applied to different modalities, including electromyography signals, speech analysis, and other behavioral signals, aiming to detect subtle motor impairments that may not be easily observable during standard clinical evaluations [
4]. Among these modalities, facial motion analysis has recently gained increasing attention because ALS frequently affects the orofacial muscles involved in speech production, making facial movement patterns a potential source of digital biomarkers for disease detection.
Several studies have investigated the use of facial motion analysis for neurological disease detection. For example, Bandini et al. [
5] proposed an automatic method for ALS detection based on video-based analysis of facial movements during speech and non-speech tasks. Their approach analyzed motion characteristics such as velocity, symmetry, and movement range, demonstrating that facial movement analysis can provide valuable information for identifying ALS-related motor impairment. Furthermore, the Toronto NeuroFace dataset introduced by Bandini et al. provides annotated video recordings of individuals with ALS, stroke patients, and healthy controls performing orofacial tasks, enabling the development of computational models for automated facial motion analysis in neurological disorders [
6].
Facial analysis techniques have also been successfully applied in the study of other neurological conditions. Jin et al. demonstrated that facial expression dynamics extracted from video recordings can be used to detect Parkinson’s disease with high accuracy using machine learning techniques [
7]. More recently, graph-based approaches have been proposed to model spatial relationships between facial landmarks for ALS detection, highlighting the potential of structured representations of facial motion patterns in neurological assessment [
8]. These studies suggest that facial landmark trajectories may capture meaningful patterns associated with neuromotor impairment.
Building upon these advances, previous RGB-based work investigated the use of facial biometric data to detect ALS-related motor impairment during a diadochokinetic speech task [
9,
10]. In that setting, facial landmarks were transformed into spherical coordinates and a reduced landmark subset was obtained through correlation-based redundancy filtering before classification. Although this demonstrated the feasibility of detecting ALS-related patterns from facial motion, the selection strategy was primarily designed to reduce redundancy among landmark trajectories rather than to identify landmark-pair relationships that are maximally informative for ALS/HC discrimination.
Despite recent advances in video-based facial motion analysis for neurological assessment, several methodological gaps remain. First, some high-performing approaches rely on specialized acquisition systems, such as depth cameras or marker-based motion capture, which may limit applicability in resource-constrained clinical environments. Second, graph-based or highly engineered representations can increase algorithmic complexity and may require larger datasets to generalize reliably. Third, although spherical-coordinate landmark trajectories and correlation-based redundancy filtering have been explored previously, the use of correlation-structure descriptors combined with leakage-aware, relevance-based feature selection remains insufficiently studied for /pataka/-based ALS screening. These gaps motivate a framework that is accessible, reproducible, and explicitly designed to quantify uncertainty under small-cohort conditions.
Hence, based on previous RGB-based facial-motion analyses and to address these limitations, the present manuscript focuses on methodological extensions and a more rigorous evaluation of correlation-based descriptors for /pataka/-based ALS screening. Specifically, this work makes three main contributions. First, it compares a domain-informed Manual-24 reference configuration against automatic feature-selection strategies applied to landmark-pair correlation descriptors, emphasizing the role of relevance-aware selection through mRMR. Second, it implements feature selection strictly within the training portion of each outer cross-validation fold, reducing the risk of information leakage and improving the reproducibility of the evaluation protocol. Third, it reports fold-level mean ± SD, feature-selection behavior, and sensitivity–specificity trade-offs under task-aligned /pataka/ benchmarking, providing a more transparent assessment of variability in a small clinical cohort and enabling cautious comparison with prior studies.
2. Materials and Methods
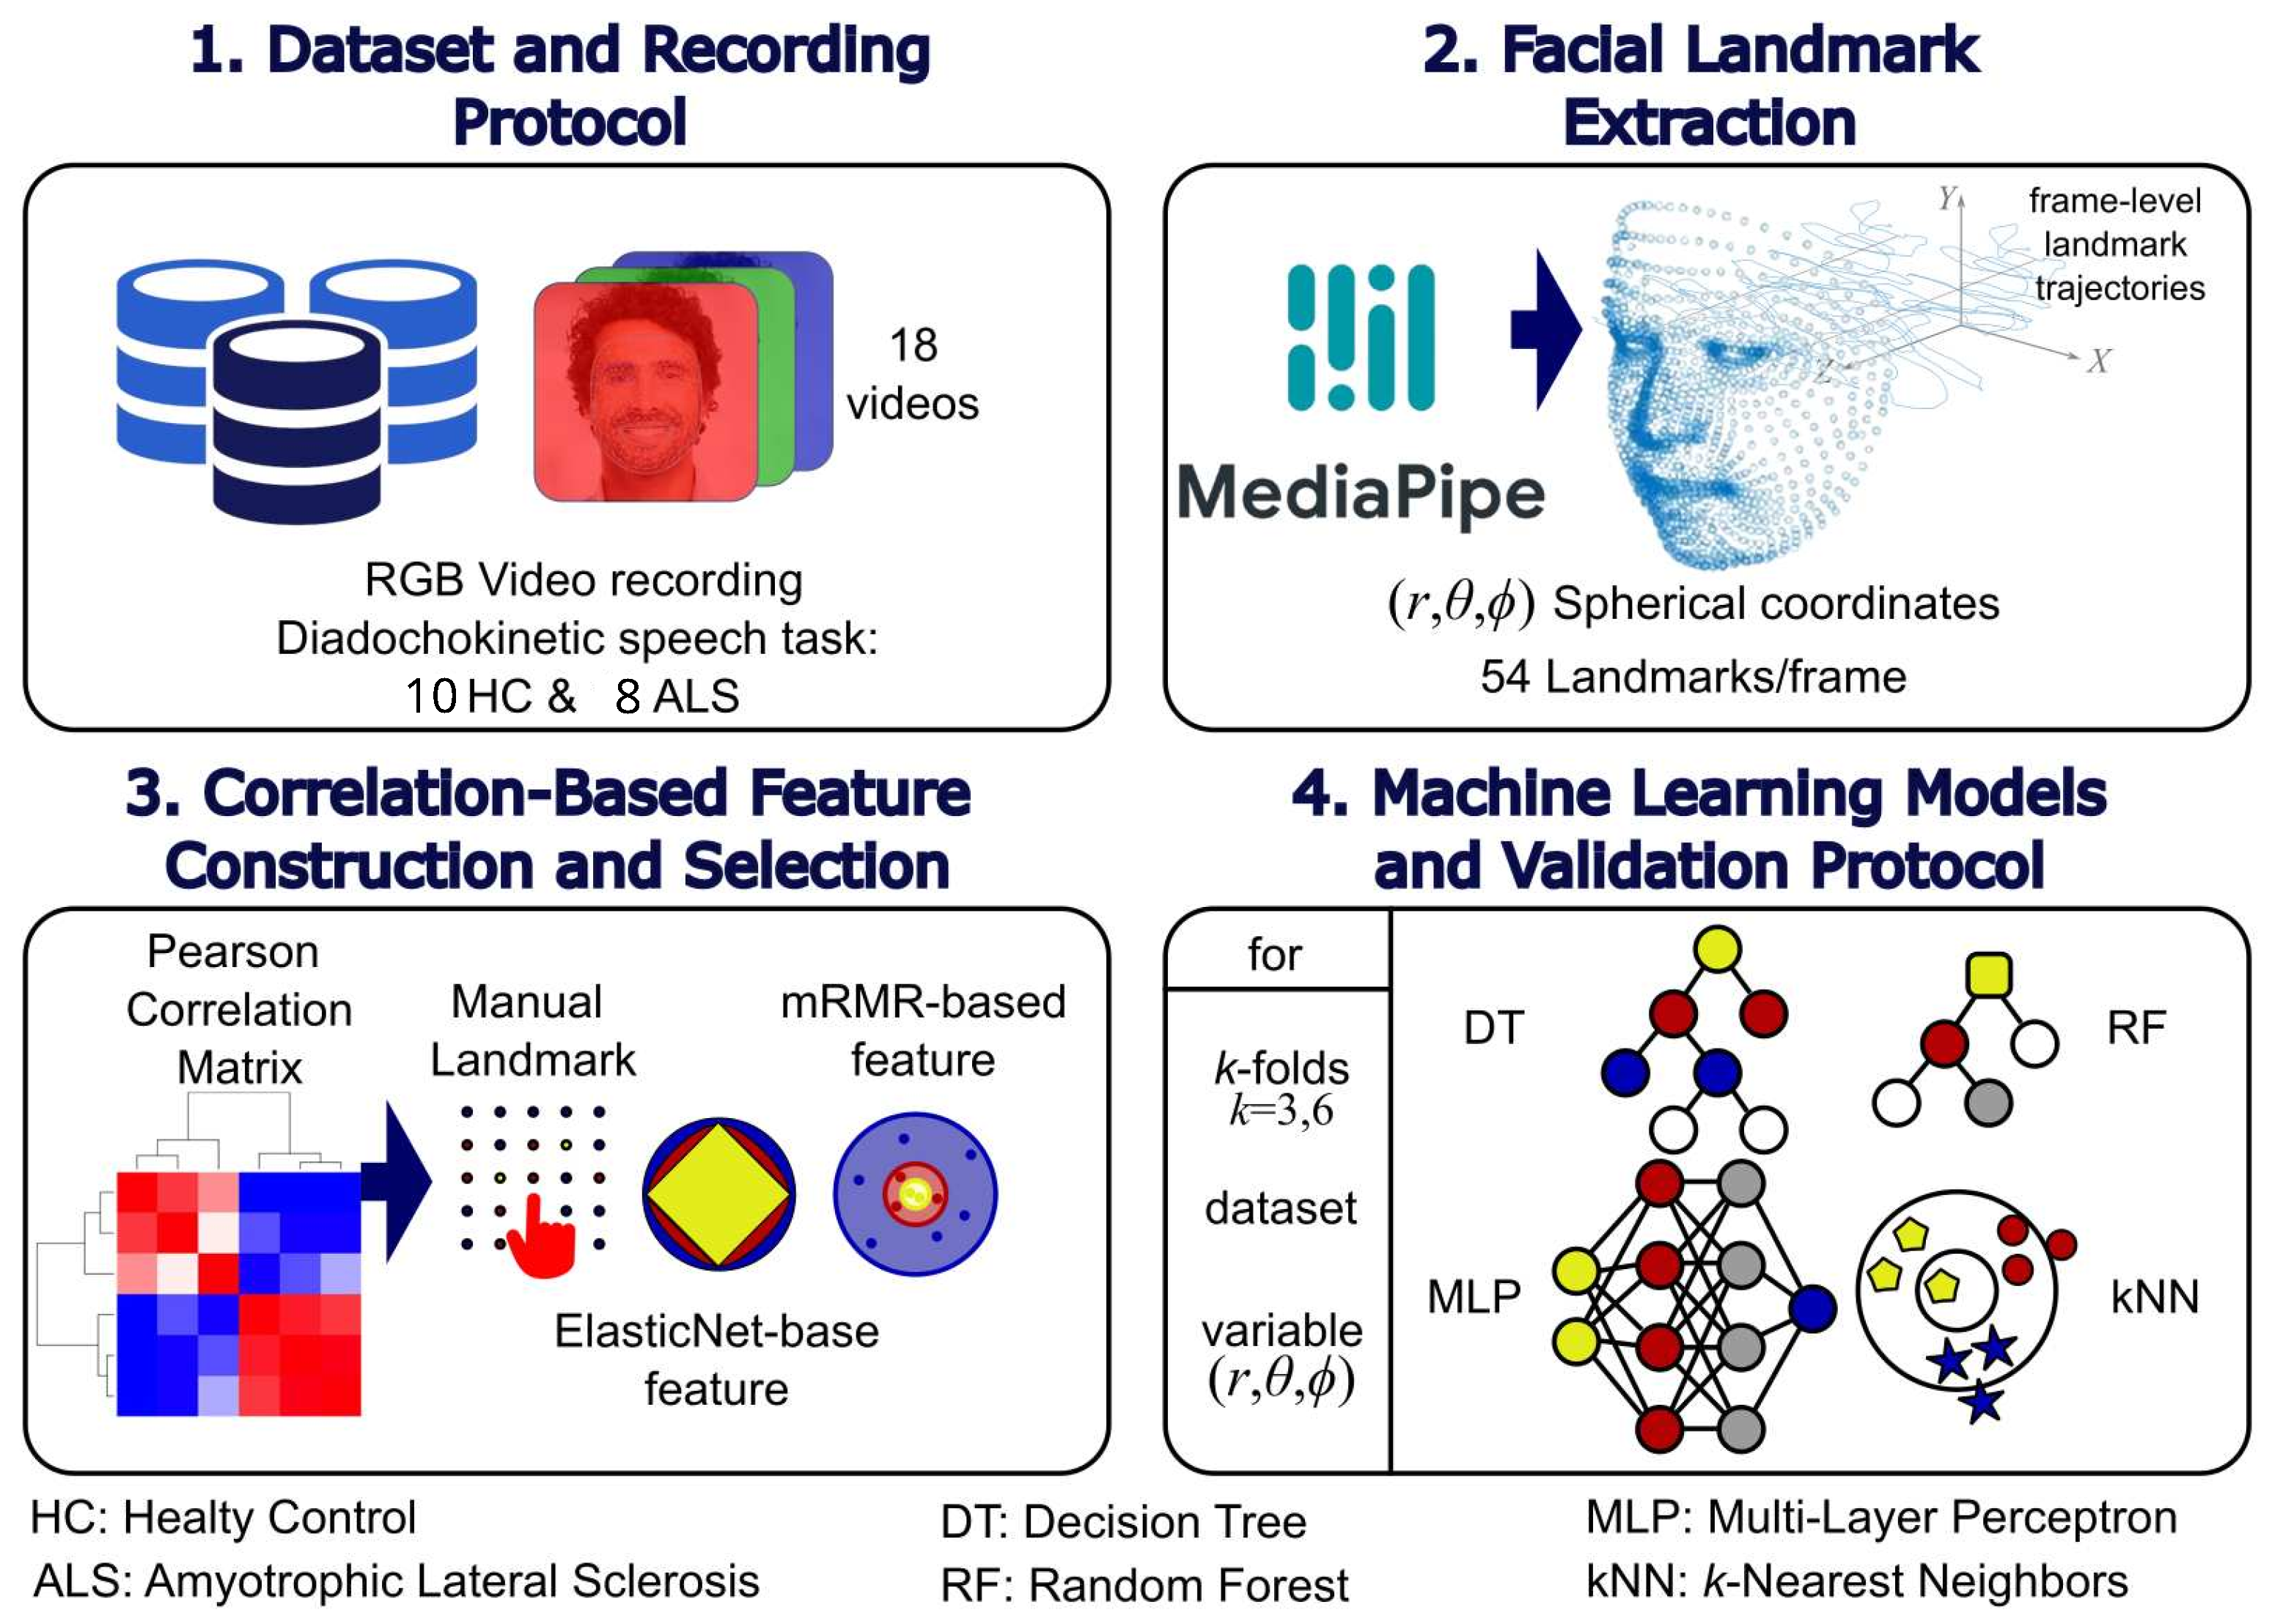
The graphical overview shown in
Figure 1 illustrates the proposed strategy for ALS detection using RGB video and spherical coordinate reference-point correlations.
2.1. Dataset and Recording Protocol
This study was conducted using the Toronto NeuroFace Dataset, an available research dataset designed for facial motion analysis in individuals with neurological disorders [
6]. The dataset was collected by the Vocal Tract Visualization and Bulbar Function Laboratory at the University Health Network (Toronto, ON, Canada) and includes video recordings of both healthy control (HC) subjects and individuals diagnosed with amyotrophic lateral sclerosis (ALS) by clinical specialists.
Video recordings were acquired using an Intel
® RealSense™ SR300 camera (Intel Corporation, Santa Clara, CA, USA) positioned at an approximate distance of 30–60 cm from the participant, under uniform lighting conditions and in an unconstrained clinical environment [
6]. Videos were recorded at a spatial resolution of
pixels and a temporal resolution of approximately 50 frames per second.
For each subject, several standardized speech-related orofacial tasks were recorded, including repetitive syllable articulation sequences designed to evaluate articulatory coordination. In particular, participants performed a diadochokinetic speech task consisting of rapid repetitions of the syllable sequence /pataka/ within a single breath, a standard task for assessing speech motor control involving coordinated movements of the lips, anterior tongue, and posterior tongue [
5,
11]. In this study, only frontal facial video recordings corresponding to the /pataka/ task were analyzed.
A total of 18 video recordings were included in the final dataset, after excluding two recordings due to video encoding corruption. Each recording was treated as an independent sample and labeled according to the subject group defined in
Table 1. Each subject contributed one /pataka/ recording to the analyzed subset; therefore, subject-wise grouping was not required for cross-validation. No additional demographic or clinical variables were incorporated into the modeling process, in order to focus exclusively on facial motion patterns derived from video data. All analyses were performed using the same set of recordings across subjects to ensure consistency.
All data used in this study were anonymized and publicly released by the dataset providers. Ethical approval and informed consent were obtained by the original data collection team; therefore, no additional institutional review board approval or participant consent was required for the present analysis [
6].
2.2. Facial Landmark Extraction
Facial landmarks were extracted from each video frame using the MediaPipe
® Face Mesh model, a real-time markerless approach for dense facial geometry estimation from monocular RGB images [
12,
13]. The model outputs a set of 468 facial landmarks per frame, providing normalized Cartesian coordinates
relative to the image frame, along with an estimated depth component
derived from a learned facial geometry representation.
MediaPipe
® Face Mesh was selected due to its robustness to moderate variations in head pose, illumination, and facial appearance, as well as its suitability for non-invasive and markerless facial motion analysis in unconstrained recording environments [
12]. This markerless paradigm is suitable for analyzing articulatory facial movements in neurological populations, avoiding the use of physical markers that may interfere with natural speech production or cause discomfort in clinical settings [
14].
From the full set of detected landmarks, a subset of 54 landmarks was selected to represent anatomically and functionally relevant regions involved in speech-related facial motion, with a primary focus on the lips, jaw, chin, and lower facial regions. This subset was defined to preserve bilateral coverage of the lower face and perioral region, allowing facial symmetry and inter-region coordination to be characterized during the diadochokinetic
/pataka/ task. The choice was guided by the physiological role of the lips and jaw in articulatory movement and by prior video-based studies showing that bulbar motor impairment in ALS affects speech-related orofacial motion patterns [
5,
6]. Landmarks from upper facial and periocular regions were excluded because they are less directly involved in the articulatory gestures required for
/pataka/. This anatomically constrained subset also reduces the dimensionality of the initial correlation space before automatic feature selection, which is important in a small-cohort setting where using all 468 MediaPipe landmarks would substantially increase the number of pairwise correlation features and the risk of unstable model estimates.
Landmark coordinates were extracted for each frame of the video sequences without temporal smoothing at this stage, preserving the raw temporal dynamics of facial motion. All subsequent processing and feature construction steps were performed using these frame-level landmark trajectories.
Face-mesh detection can occasionally fail due to rapid head motion, partial occlusions, or motion blur. In such cases, frames in which the face mesh is not detected are excluded from the landmark time series. Subsequent computations (spherical mapping and correlation estimation) are performed using only the remaining valid frames for each recording.
2.2.1. Spherical Coordinate Mapping
To characterize coordinated facial motion independently of global translation and to separate motion magnitude from directional components, each landmark trajectory was mapped from Cartesian coordinates to a spherical representation. In this formulation, each landmark position is expressed relative to a fixed anatomical reference point (defined in
Section 2.2.2), yielding a frame-wise displacement vector that captures local facial motion patterns. This relative mapping reduces sensitivity to camera framing and partial head translation, and it provides a compact way to analyze motion directionality through angular components.
Spherical coordinate representations have been explored in face analysis to obtain compact geometric descriptors and to support more invariant and interpretable decompositions of facial shape and expression-related geometry [
15,
16]. In our context, the radial component
r captures the magnitude of motion relative to the reference point, while the angular components
describe the direction of displacement on the sphere. By analyzing the three components independently, we can investigate which aspects of facial motion carry the most discriminative signal for ALS detection in the
/pataka/ task.
A practical consideration in RGB-based landmark pipelines is the reliability of the out-of-plane coordinate. Because the z coordinate is estimated rather than directly measured, the azimuthal component —which depends explicitly on —may be more sensitive to depth or pose estimation noise than r or . This motivates our component-wise reporting and interpretation, and it provides a plausible explanation for differences in performance across components observed in similar RGB-based settings.
2.2.2. Spherical Coordinate Transformation
Let denote the 3D landmark coordinates of landmark j at frame t, as provided by the face landmark detector, and let denote the reference landmark coordinates at the same frame. In our implementation, the reference landmark is fixed to the detector landmark with index 1, located near the nasal bridge in the MediaPipe® Face Mesh landmark topology. This landmark was selected as a central and relatively stable facial anchor because it is less directly affected by the large articulatory deformations of the lips and jaw during /pataka/ production. Using this point as a frame-wise reference allows each landmark trajectory to be expressed as a relative displacement within a common facial coordinate system, reducing sensitivity to global translation, camera framing, and partial head motion while preserving local motion patterns in the lower face.
For each
j-th landmark and frame
t, we compute the displacement vector relative to the reference landmark:
The reference landmark itself was excluded from the subsequent feature construction to avoid introducing a trivial zero displacement vector.
The corresponding spherical coordinates
are then computed using the convention implemented in the experimental pipeline:
Angles
and
are expressed in degrees and normalized to the range [−180°, 180°) for consistency across sequences.
This relative formulation emphasizes coordinated local facial motion patterns while reducing sensitivity to global translation and partial head motion. For reproducibility, the above equations define the exact spherical coordinate convention used throughout the pipeline; no alternative conventions were employed.
2.3. Correlation-Based Feature Construction and Selection
Facial motion trajectories extracted from the selected landmarks were transformed into spherical coordinates , as described in the previous section. To capture coordinated motion patterns between facial regions, correlation matrices were computed from the temporal trajectories of the selected landmarks for each spherical coordinate component. These matrices describe pairwise relationships between landmarks and constitute the basis for feature construction in the proposed framework.
2.3.1. Feature Vector Construction
Before computing Pearson correlation matrices, landmark trajectories for each recording were standardized using z-score normalization across time (per recording and per landmark series). This step ensures that correlation estimates reflect co-variation patterns rather than differences in scale across landmarks. Then, for each video recording and for each spherical coordinate component , a Pearson correlation matrix was computed using the temporal trajectories of the selected landmarks. The upper triangular elements of each correlation matrix, excluding the diagonal, were vectorized to form the input feature vector for subsequent analysis. This representation emphasizes inter-landmark coordination patterns rather than absolute displacement magnitudes and yields a compact, structured description of facial motion dynamics.
Recordings may differ in duration and therefore in the number of valid frames. Because Pearson correlation is computed across facial motion trajectories, the resulting correlation matrices are estimated directly from the available valid frames for each recording, without temporal resampling, padding, or sequence alignment. This design preserves each recording’s native timing while producing a fixed-size correlation representation (54 × 54 per coordinate component) for downstream modeling.
Correlation- and covariance-based representations have been widely adopted to capture dependency structures and coordinated patterns in facial and motion-related data, providing informative descriptors for classification tasks involving structured signals [
17,
18].
2.3.2. Feature Selection Strategies
To evaluate the impact of different selection paradigms on classification performance, three feature selection strategies were considered:
Manual landmark selection (baseline). A fixed subset of 24 facial landmarks previously proposed based on domain-informed anatomical considerations related to speech-related facial motion was used as a baseline configuration [
9,
10]. In this setting, correlation matrices and feature vectors were constructed exclusively from these 24 landmarks, and no additional automatic feature selection was applied. This strategy serves as a manually defined reference against which data-driven selection methods can be compared.
ElasticNet-based feature selection. Automatic feature selection was performed using ElasticNet regularization [
19] applied to the correlation-based feature vectors derived from the full set of 54 landmarks. ElasticNet combines
and
penalties, promoting sparse yet stable solutions in the presence of highly correlated predictors, which is particularly suitable for correlation-based descriptors where strong feature dependencies are expected. This approach has been successfully applied in multiple biomedical machine learning studies, including radiomics-based cancer prognosis and signal-based diagnostic tasks such as EEG-based mental health assessment [
20,
21]. Feature selection was conducted using only the training data within each cross-validation fold to prevent information leakage from the test set, retaining features associated with non-zero coefficients.
mRMR-based feature selection. As an alternative data-driven approach, feature selection was also performed using the minimum Redundancy Maximum Relevance (mRMR) criterion [
22]. This method selects features that maximize mutual information with the class labels while minimizing redundancy among the selected features. mRMR has demonstrated strong performance in biomedical applications, particularly in radiomics-based outcome prediction tasks involving highly correlated features [
23]. As with ElasticNet, mRMR-based selection was applied exclusively to the training data within each cross-validation fold.
Each feature selection strategy—manual landmark selection, ElasticNet-based selection, and mRMR-based selection—was applied independently for each spherical coordinate component , enabling a direct comparison under identical modeling and validation protocols.
To characterize the behavior of the automatic feature-selection stages, we also report the number of retained features per outer fold for ElasticNet and mRMR configurations. This analysis allows us to assess whether the automatic selectors produced compact and stable feature subsets across validation splits, in addition to their downstream classification performance.
2.4. Machine Learning Models and Validation Protocol
The correlation-based feature vectors described in
Section 2.3 were used as inputs to a set of supervised machine learning classifiers. Given the limited dataset size and the structured nature of the extracted features, classical machine learning models were selected due to their robustness, interpretability, and suitability for small to medium-sized biomedical datasets where the number of features may exceed the number of observations.
The classifiers evaluated included the k-Nearest Neighbors (kNN), Decision Tree (DT), Random Forest (RF), and Multi-Layer Perceptron (MLP) models. These algorithms represent complementary learning paradigms, including instance-based learning, tree-based methods, ensemble learning, and shallow neural networks, enabling a comprehensive comparison under a unified experimental framework.
For each classifier, three feature selection configurations were evaluated: (i) a manually defined baseline using a fixed set of 24 facial landmarks, (ii) automatic feature selection using ElasticNet regularization, and (iii) automatic feature selection using the mRMR criterion. In all cases, feature selection—when applicable—was performed using training data only within each cross-validation fold, ensuring that no information from the test data was used during feature selection.
Model performance was evaluated using stratified
k-fold cross-validation with
and
folds. These values were selected to balance computational efficiency and robustness of performance estimation. For each validation scheme, hyperparameter optimization was conducted using an inner stratified
k-fold cross-validation procedure (
) applied exclusively to the training data, resulting in a nested cross-validation design [
24]. This validation strategy helps obtain more reliable performance estimates in small-sample settings.
Hyperparameter search spaces for all classifiers and feature selection methods were predefined and kept fixed across experiments to ensure fair comparisons and reproducibility. Hyperparameter optimization was performed by maximizing the F1-score within the inner cross-validation loop. The complete set of hyperparameter ranges explored for each model and feature selection strategy is reported in
Table S1 of the Supplementary Materials.
For example, the multilayer perceptron (MLP) was included as a compact neural-network baseline and was evaluated under the same nested validation protocol as the other classifiers. The MLP used a single hidden layer, with hidden-layer size tuned over , activation function tuned over , solver tuned over , and initial learning rate tuned over . The maximum number of iterations was fixed to 2000 and the random seed was fixed to 0.
Model performance was evaluated using standard classification metrics derived from the confusion matrix, including accuracy, sensitivity, specificity, precision, and F1-score. All metrics were computed on the held-out test folds of the outer cross-validation procedure.
4. Discussion
4.1. Principal Findings
This study evaluated correlation-based facial-motion descriptors derived from spherical-coordinate landmark trajectories for ALS/HC separation during the diadochokinetic /pataka/ task. The results suggest that inter-landmark coordination patterns contain discriminative information, but performance varied across spherical components, feature-selection strategies, and validation protocols. The observed sensitivity–specificity trade-offs and fold-level variability support a cautious interpretation of the proposed approach as a proof-of-concept screening framework rather than a clinically validated diagnostic model.
4.2. Comparison with the State of the Art on the /Pataka/ Task
Table 8 provides a task-aligned context by summarizing studies that explicitly report
/pataka/ performance on Toronto NeuroFace (or closely related capture settings) and marking NR when
/pataka/-specific results are not reported. This alignment is essential because performance can differ substantially across NeuroFace subtasks (e.g.,
/pataka/ vs.
spread) and task aggregation can confound comparisons.
Bandini et al. [
5] reported strong
/pataka/ performance using marker-less 3D/depth acquisition and a compact set of kinematic/geometry features, achieving subject-level sensitivity of 90.0% and specificity of 75.0%, with 83.3% accuracy (
Table 8). Despite this robust reporting, Bandini’s results are not directly comparable to ours in sensing modality and evaluation style. Their pipeline relies on RGB-D/3D depth measurements, which provide higher geometric fidelity (notably for out-of-plane motion), whereas our approach operates on RGB-derived landmarks with estimated depth. Moreover, Bandini reports subject-level performance via majority voting under LOSO-CV, while we report fold-averaged performance as mean ± SD, explicitly quantifying variability across splits. These differences should be considered when benchmarking
/pataka/-based ALS detection across modalities and protocols. In practice, depth-based performance can be interpreted as a favorable upper-bound under richer capture conditions, while our method targets broader accessibility with standard RGB video. This characteristic may facilitate the deployment of video-based screening tools in clinical environments where specialized sensing hardware is not available.
Gomes et al. [
8] reported subject-level
/pataka/ performance of 66.6% accuracy, 70.0% sensitivity, and 63.6% specificity using Facial Point Graphs and a graph neural network (GNN) formulation. While their representation learning approach differs from ours (GNN-based graph learning vs. correlation-structure descriptors with embedded feature selection), both results support the premise that structured dependency information between facial regions is informative for ALS detection in
/pataka/. Notably, despite relying on comparatively lightweight models and a more compact feature representation, our primary configuration achieved sensitivity and specificity within a comparable task-level range, although with fold-level variability (
Table 8). This suggests that correlation-based coordination descriptors may retain clinically relevant signal without requiring the full complexity of graph representation learning, but strict performance equivalence should not be inferred.
Finally, GNN-based methods often benefit from larger training sets (or from pre-training/transfer learning) to improve generalization. In the available description, Gomes et al. do not report using pre-training or transfer learning, which may increase sensitivity to limited sample sizes and cohort heterogeneity. Differences in evaluation level (subject voting vs. fold-level reporting) and in how selection/tuning are nested within validation can also affect strict comparability; we discuss these benchmarking caveats in
Section 4.3.
An extended correlation-based landmark configuration reported by Suárez-Hernandez [
10] presents higher
/pataka/ sensitivity (88.89%) at 66.67% accuracy and 50.0% specificity for a setting using the
component and an MLP model (
Table 8). This provides a useful sensitivity-focused reference point within the same dataset and task setting. However, strict numerical comparability depends on evaluation details (e.g., CV design, model-selection criteria, and whether tuning/selection steps are nested), which can influence sensitivity estimates; see
Section 4.3 for comparability caveats.
A further methodological difference concerns how dimensionality is reduced prior to modeling. In the thesis, the reduced set of 24 landmarks is obtained through correlation-based redundancy filtering (with a fixed threshold) to remove near-duplicate landmark trajectories, yielding a deterministic index set. This strategy is reproducible given the threshold and the elimination rule, but it optimizes primarily for reducing redundancy rather than for maximizing predictive relevance to the diagnostic label. In contrast, our primary pipeline operates on correlation-derived features and applies mRMR within the training folds to select features that jointly maximize relevance to ALS/HC discrimination while minimizing redundancy. This distinction is important in correlation-feature spaces, where many candidate pairs can be mutually correlated: redundancy pruning alone may discard features that are individually redundant yet jointly informative, whereas relevance-aware selection can retain discriminative structure under a leakage-aware evaluation protocol.
4.3. Leakage-Safe Evaluation and Comparability Caveats
A central methodological aspect of our study is the leakage-aware evaluation design. Feature selection (mRMR) is performed strictly within the training portion of each outer cross-validation split, and performance is computed only on the corresponding held-out fold. This nesting is essential in high-dimensional settings, where selecting features (or tuning hyperparameters) using information beyond the training data can lead to optimistically biased estimates. In addition, we report fold-averaged metrics as mean ± SD, providing an explicit measure of stability across splits. This protocol ensures that model selection, feature selection, and performance estimation remain strictly separated, reducing the risk of information leakage between training and evaluation stages.
These design choices also clarify why strict numerical comparisons with prior work can be challenging even when the dataset and task are aligned. Several studies report subject-level voting or LOO-style protocols, often as point estimates without dispersion measures, which makes it difficult to assess variability and robustness under partition changes. Therefore, while task-aligned comparisons remain informative (
Table 8), differences in evaluation level (subject voting vs. fold-level reporting), uncertainty reporting, and nesting of selection/tuning steps should be considered when interpreting relative performance.
This principle applies not only to relevance-aware selectors (e.g., mRMR) but also to redundancy-reduction steps such as correlation-threshold filtering: when computed outside the evaluation loop, such preprocessing can inadvertently incorporate information from the full dataset and lead to optimistically biased performance estimates.
4.4. Coordinate-Wise Interpretation of Discriminative Facial Motion
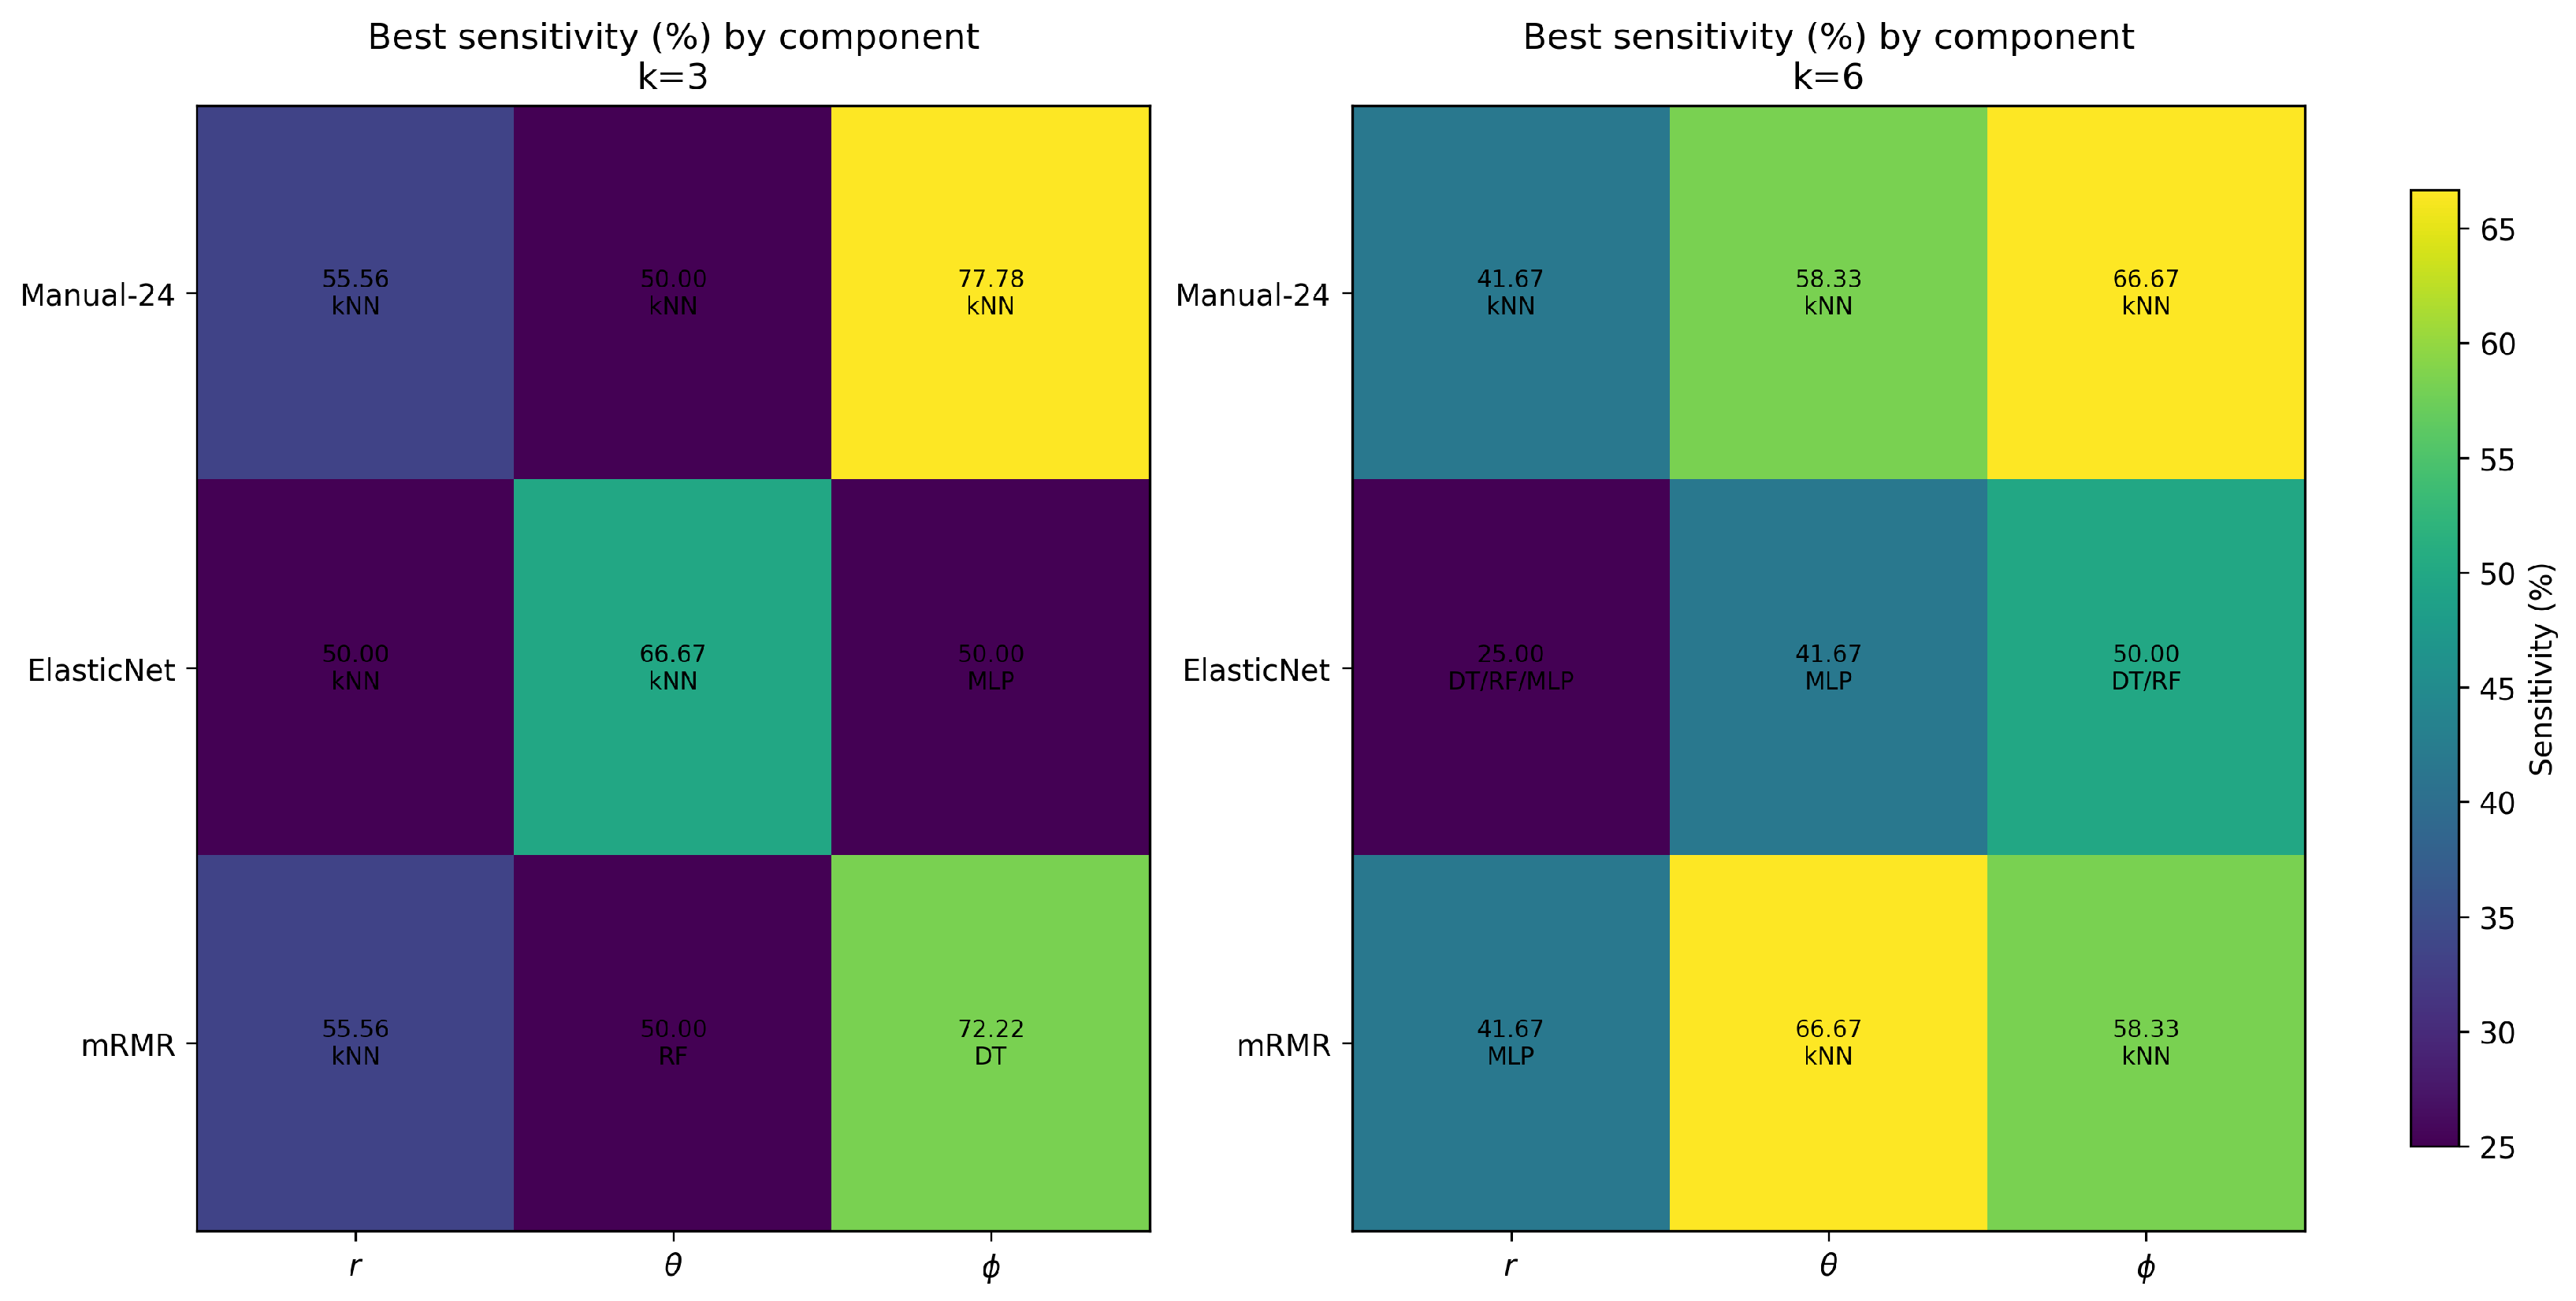
Across our experiments, performance differences across spherical components suggest that coordinate choice materially affects separability. Interpreting these effects in biomechanical terms, may reflect lateralized coordination patterns, while may capture vertical or jaw-related coordination relevant to articulatory control. These interpretations are consistent with the hypothesis that bulbar impairment affects coordinated lower-face motion during diadochokinetic speech, but should be considered associations rather than direct physiological measurements.
In addition, component-wise reliability may be affected by landmark estimation accuracy: because MediaPipe® provides an estimated out-of-plane coordinate, the azimuthal component can be more sensitive to depth/pose noise than r or , which may partially explain component-dependent performance differences in RGB-based pipelines.
4.5. Clinical Operating Points: Sensitivity Versus Specificity
From a clinical perspective, sensitivity is often prioritized in screening-like settings to reduce missed ALS cases, particularly when confirmatory assessment exists downstream. However, high sensitivity can incur reduced specificity, increasing false positives. Our results highlight the importance of selecting operating points according to the intended clinical context rather than relying on a single aggregate metric. In this sense, task-aligned reporting (
Table 8) helps clarify trade-offs across methods under
/pataka/.
4.6. Variability and Robustness
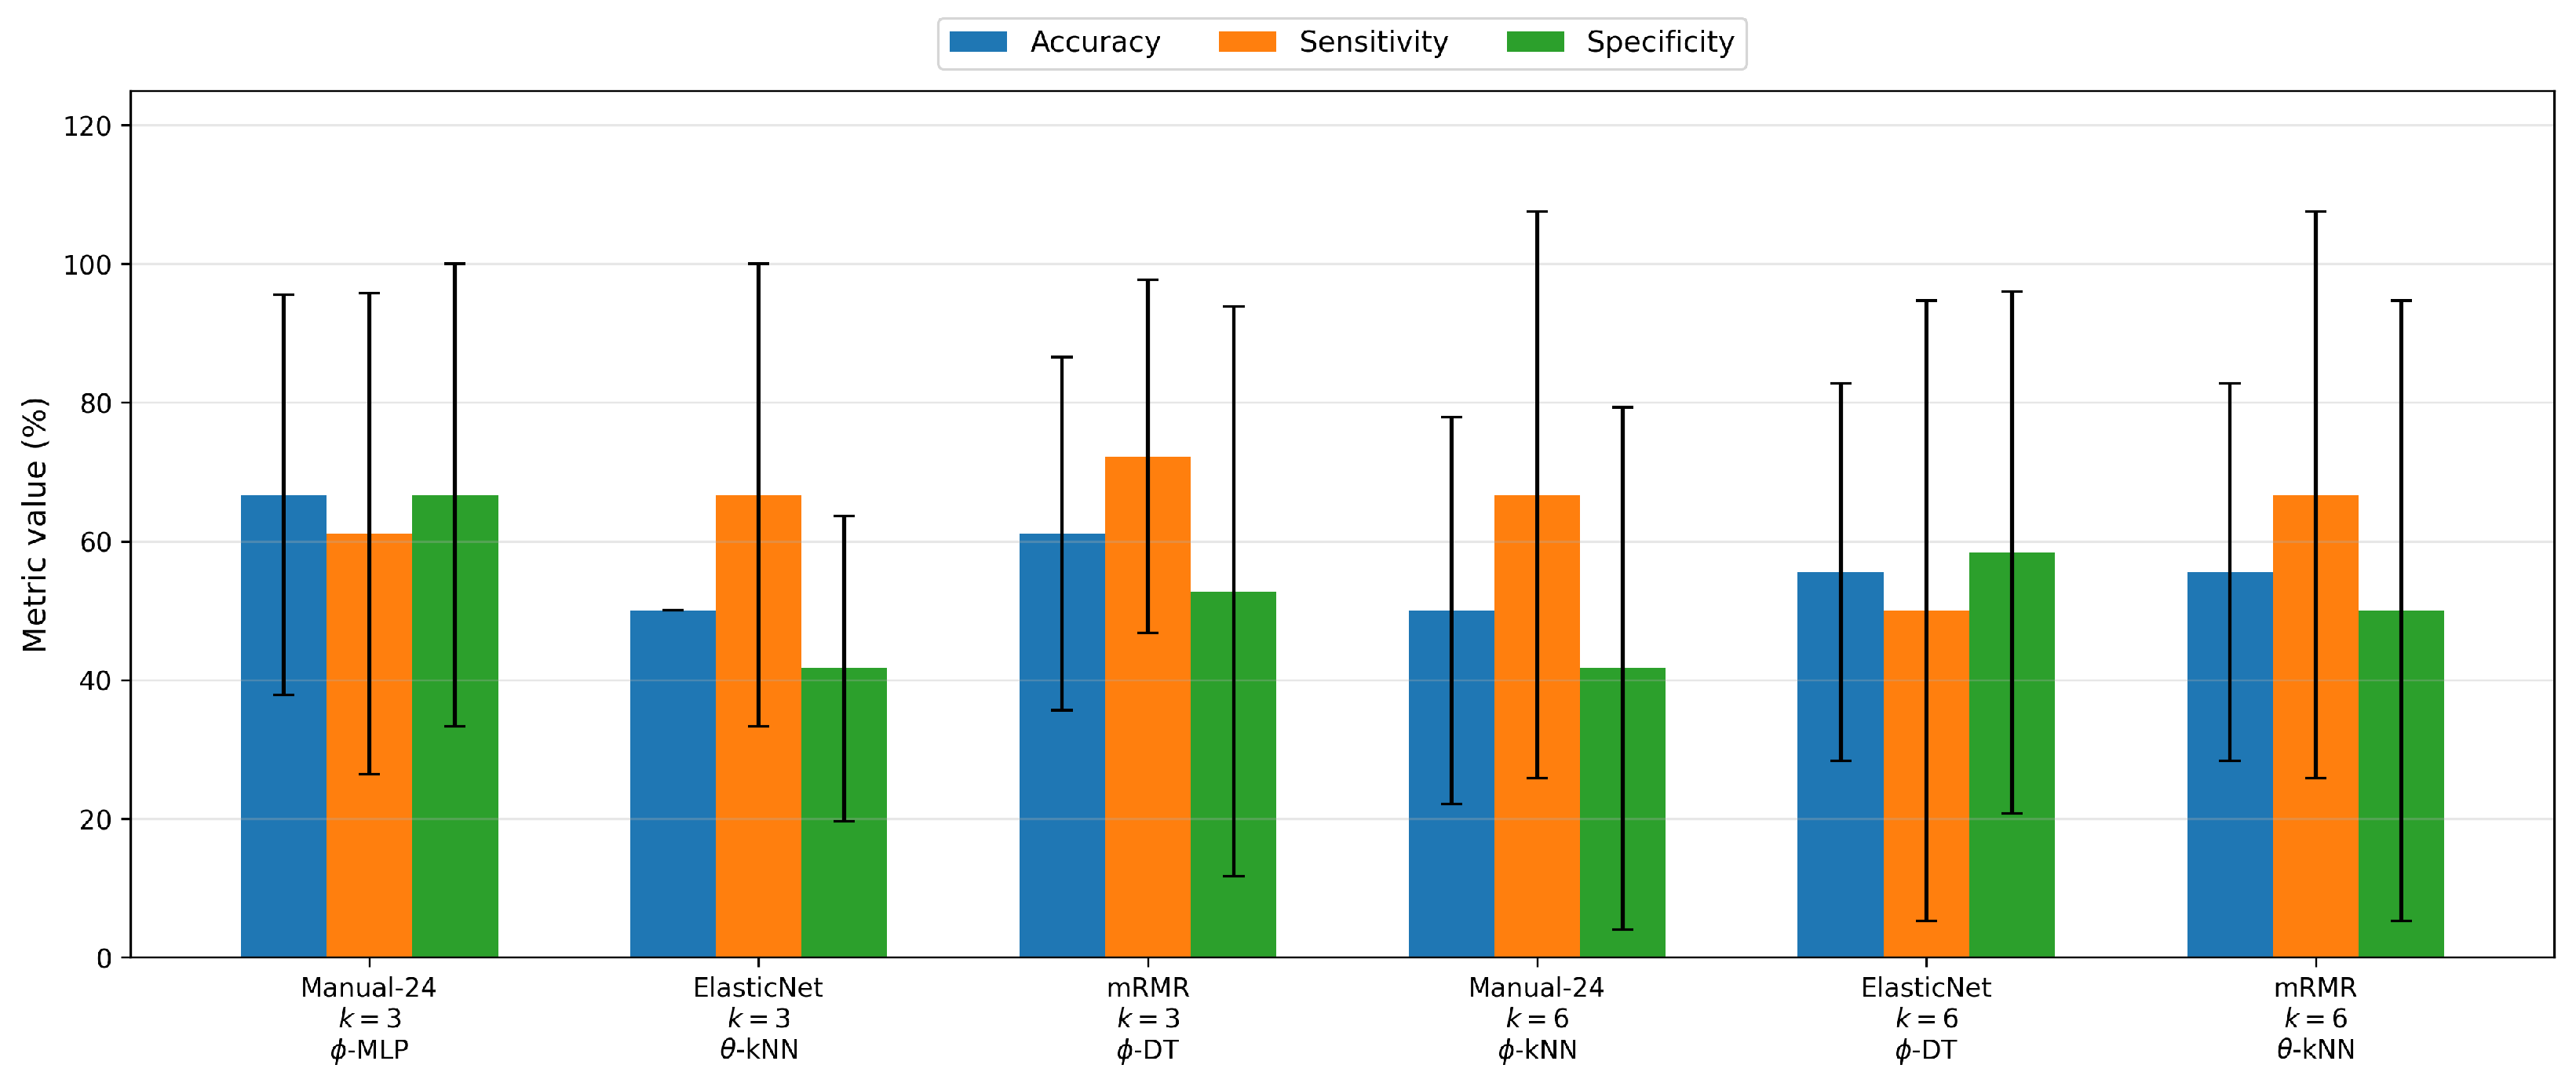
Standard deviations for several metrics are relatively large, indicating sensitivity to data partitioning and potential cohort heterogeneity. The use of outer-fold reporting quantifies this uncertainty, but also emphasizes the need for larger cohorts and external validation. Future evaluations could incorporate repeated cross-validation and confidence intervals to provide tighter uncertainty characterization. Particularly, although neural-network models can overfit in very small cohorts, the MLP was included as a compact comparative baseline under the same leakage-aware evaluation protocol used for the other classifiers. Its results should therefore be interpreted as part of a controlled algorithmic comparison rather than as evidence that higher-capacity neural models are preferable in this dataset.
4.7. Limitations
This study has several limitations. First, the analysis was conducted on a single dataset with 18 /pataka/ recordings, which limits statistical power and generalizability. Because the outer validation schemes provide only a small number of fold-level estimates, formal statistical testing between configurations would have low power and could lead to overinterpretation. Therefore, performance differences were treated as descriptive and interpreted together with their fold-level variability.
Second, the pipeline relies on RGB-derived facial landmarks, including an estimated depth coordinate, which can be affected by pose, illumination, tracking errors, and uncertainty in out-of-plane motion. This limitation is particularly relevant when interpreting differences between spherical coordinate components.
Third, the focus on the /pataka/ task improves task-level comparability with prior work but limits generalization to other speech or nonspeech facial tasks. Differences in evaluation level (subject voting vs. fold-averaged reporting), uncertainty reporting, and nesting of feature selection or hyperparameter tuning also complicate strict numerical comparisons with prior studies.
Finally, no external validation cohort was available. Larger independent datasets are required to evaluate generalization, calibration, and clinically meaningful operating thresholds for screening-oriented use.
4.8. Future Directions
Future work should prioritize external validation on independent cohorts and larger task-aligned datasets. It would also be valuable to investigate how improved depth fidelity, either through depth sensors or enhanced monocular depth estimation, affects /pataka/-based screening. Finally, interpretability analyses that map selected correlation features to anatomically meaningful landmark-pair interactions, together with calibration of decision thresholds and cost-sensitive evaluation, may improve clinical transparency and deployment relevance.
5. Conclusions
This work evaluated RGB video-based ALS screening during the diadochokinetic /pataka/ task using correlation-structure descriptors derived from spherical-coordinate facial landmark trajectories. By representing coordinated facial motion through Pearson correlation matrices and evaluating multiple learning strategies under a leakage-aware nested cross-validation design, the study provides a reproducible benchmark for correlation-based facial motion analysis on the Toronto NeuroFace dataset.
The results suggest that correlation-derived coordination patterns contain discriminative information for ALS/HC separation, although performance depends on the spherical coordinate component, feature-selection strategy, classifier, and validation protocol. The primary mRMR-based configuration achieved competitive sensitivity and specificity while providing a constrained feature-selection mechanism relative to ElasticNet. However, the observed fold-level variability underscores the need for cautious interpretation in small clinical cohorts.
Compared with prior /pataka/-based studies, depth-based acquisition and engineered kinematic features remain strong references, suggesting that geometric fidelity is an important factor for future improvement in RGB-based pipelines. Overall, correlation-based facial motion analysis combined with leakage-aware feature selection represents a transparent proof-of-concept approach for accessible video-based ALS screening. Future work should prioritize external validation, larger cohorts, improved depth estimation, and clinically oriented threshold calibration.