Article

Factor Analysis and Mechanism Revelation of Reservoir Conditions and Driving Fluids Affecting Geothermal Energy Extraction


1
Faculty of Engineering, China University of Petroleum-Beijing at Karamay, Karamay 834000, China
2
School of Petroleum Engineering and Environmental Engineering, Yan’an University, Yan’an 716000, China
*
Author to whom correspondence should be addressed.
Eng 2026, 7(5), 212; https://doi.org/10.3390/eng7050212
Submission received: 22 February 2026 / Revised: 22 April 2026 / Accepted: 28 April 2026 / Published: 1 May 2026

Abstract

Introduction: Efficient geothermal energy extraction has the potential to significantly alleviate the shortage of fossil energy, but low extraction efficiency and an insufficiently understood extraction mechanism remain key bottlenecks hindering its large-scale deployment. Method: This study develops a fluid–solid coupled numerical model based on the intrinsic physical properties of geological reservoirs to systematically analyze the energy extraction characteristics of geothermal systems. Simultaneously, the effects of key geological factors on fluid flow behavior within geothermal reservoirs are investigated. Furthermore, molecular dynamics simulations are employed to elucidate the microscopic mechanisms by which driving fluids facilitate geothermal energy extraction. Results: The results demonstrate that the thermo-hydraulic–mechanical (THM) numerical model was validated through a comparison with benchmark data reported in previous studies, exhibiting a high degree of agreement with geothermal extraction performance. The model further confirms that heat transport in the geothermal reservoir is characterized by a pronounced “tongue-in” isotherm pattern during the extraction process. Discussion: Lower initial temperatures of the driving fluid lead to more rapid geothermal energy extraction compared with higher initial temperatures, and the “tongue-in” phenomenon becomes increasingly pronounced as the initial injection temperature decreases. Moreover, increased injection pressure significantly enhances geothermal energy extraction efficiency; however, reduced pressure differentials markedly suppress the development of the “tongue-in” pattern and decrease reservoir permeability. In addition, water used as a heat-driving fluid achieves higher thermal extraction efficiency than water, while simultaneously exerting a stronger moderating effect on the permeability evolution of geothermal reservoirs. Conclusions: The simulation results obtained from the thermo-hydraulic-mechanical (THM) numerical model provide fundamental data to support the efficient development of geothermal reservoirs, while the associated analyses offer valuable insights into the selection of appropriate driving fluids for reservoirs with distinct geological characteristics.

1. Introduction

The depletion of fossil fuel resources has triggered an energy crisis and contributed to a global economic slowdown, thereby exacerbating energy competition and constraining industrial production [1]. Moreover, the excessive consumption of fossil fuels has intensified the greenhouse effect and caused substantial ecological degradation, thereby necessitating the development of alternative energy sources to simultaneously achieve environmental improvement and energy security [2,3]. Energy research has increasingly focused on two major categories: reservoir-based energy resources and clean energy [4]. (1) Clean energy sources [5], such as wind and solar energy, can effectively mitigate several inherent limitations of fossil fuels, including non-renewability and environmental pollution. Moreover, their wide spatial distribution provides a solid foundation for technological development, large-scale deployment, and practical application. However, climatic variability and variations in solar incidence angles directly influence energy availability, inevitably leading to significant fluctuations in power output [6]. In addition, the limited storage capacity of existing electrical energy storage systems constrains the large-scale deployment of clean energy sources such as wind and solar power, as they are unable to supply sufficient stored energy during periods of low generation to meet peak electricity demand [7,8]. (2) Geothermal energy, defined as the residual thermal energy that remains in geological reservoirs following the extraction of fossil fuels, has historically been underutilised and overlooked by geologists and petroleum engineers [9]. Nevertheless, as a promising supplement to conventional fossil energy, geothermal energy offers several notable advantages, including environmental sustainability, high operational stability, high energy density, and broad applicability [10]. It is evident that geothermal energy has become a pivotal area of research in the disciplines of geology and energy science, owing to its numerous merits [11].
At present, the exploration and exploitation of geothermal energy is predominantly investigated through numerical simulation approaches [12]. A variety of multiphysics coupling platforms, such as COMSOL Multiphysics and ABAQUS, are employed to construct geological reservoir models and to analyse the flow and heat transfer behaviour of geothermal fluids within subsurface formations [13]. Numerous researchers have developed representative numerical models that incorporate realistic geological parameters, thereby enabling the efficient utilisation of geothermal resources. Among these, the coupled temperature–seepage–stress field model has become the most commonly adopted framework for geothermal energy extraction studies, as it effectively captures reservoir fluid temperature evolution, permeability variation of the formation, and overall heat extraction efficiency [14]. Noorishad et al. [15] were among the first to formulate the fundamental governing equations for thermo-fluid–solid coupling in saturated porous media based on the thermoelastic theory of geological rocks. However, this formulation neglected heat exchange between the pore fluid and the rock matrix, as well as the influence of thermal effects on the mechanical properties of rocks. J. Rutqvist [16] established a thermo-fluid–solid coupled numerical framework for fractured–porous media by integrating the TOUGH2 and FLAC3D codes, enabling the simulation of multiphase flow-induced heat transfer and mechanical deformation within such media. This integrated approach facilitated the formulation and implementation of three-field coupling governing equations in fractured–porous geological systems. Gutierrez and Makurat [17] developed a thermo-hydraulic–mechanical (THM) coupled model to simulate the coupled processes associated with cold water injection in fractured reservoirs. However, their model did not account for the influence of rock deformation on the temperature field, i.e., the solid–thermal coupling effect was neglected, and therefore a fully coupled THM framework was not achieved. Furthermore, the mechanisms governing geothermal energy extraction in geological reservoirs have not yet been elucidated from a microscopic molecular dynamics perspective, which is essential for a fundamental understanding of geothermal heat conduction processes [18]. In addition, most previous studies have relied on limited or single evaluation indicators to assess geothermal extraction efficiency, and the lack of a multi-parameter evaluation framework remains a critical issue in current geothermal energy development and exploitation [19].
This study develops a thermo-mechanical–fluid coupled model for geothermal energy transfer (a multiphysics coupling platform) based on the geological characteristics of geothermal reservoirs, enabling systematic analysis of the processes governing efficient geothermal energy extraction in specific reservoirs. In parallel, the flow behaviour of geothermal fluids and the associated geothermal recovery mechanisms are investigated from a microscopic molecular dynamics perspective under varying controlling factors, which provides guidance for the selection and optimization of fluid parameters tailored to specific reservoir conditions. Finally, geothermal extraction efficiency is evaluated under different operational and geological scenarios, thereby providing fundamental data and theoretical support for the sustainable recovery and development of geothermal energy resources.

2. Model Building of Geothermal Reservoirs

2.1. Seepage Field Governing Equations

The seepage behaviour of fluids in geothermal reservoirs is assumed to be laminar under low flow-rate conditions, and the motion of the driving fluid is described using the linear Darcy law. In this formulation, nonlinear flow effects are neglected, and the low-velocity driving fluid is assumed to obey Newtonian shear behaviour. Moreover, the influence of fluid inertial effects associated with CO2 as the driving fluid is not considered, which leads to the adoption of a two-dimensional geological model. Accordingly, the linear Darcy law governing the flow of the driving fluid in geothermal reservoirs is given in Equation (1) [20].
q L = k μ L p
where qL and μ presented the apparent density and dynamic viscosity of the driving fluid. k displayed the rock permeability of geothermal reservoirs. p is the reservoir pressure.
The governing equations for fluid seepage in geothermal reservoirs consist primarily of two components. The first component describes the seepage behaviour of the driving fluid within the geological matrix, as expressed in Equation (2).
ρ L φ t + ( q L ρ L ) = Q s
where ρL presented the apparent density of the driving fluid. φ displays the solid density of geothermal reservoirs. Q s presents the quality source items.
In Equation (2), Q s represents the mass source, which accounts for the mass injection at the injection well and mass extraction at the production well. It has units of kg·m−3·s−1 and is non-zero only in the grid cells corresponding to the wells.
The deep flow control equation for the driving fluid in the fractures of a geothermal reservoir can be described by Equation (3).
d f ρ L ϕ f t + l ( d f ρ ( k f μ l p ) ) = d f Q m
where d f and ϕ f present the fracture width and porosity of geothermal reservoirs. l displays the gradient of the geological fractures vertically toward the Earth’s centre. k f is the rock permeability. Q m is the mass of driving fluids seeping into reservoir fractures.

2.2. Temperature Field Equation

The thermal radiation from the rocks and the heat-driving fluids in the geological reservoir are neglected, and the temperature fields of the two substances are described separately. The energy equation for the fluids contained within reservoir rocks is illustrated in Equation (4) [21].
( ρ L c L φ Δ T L ) t = ( ρ L c L ( k f μ p L ) T L ) + ( λ L φ T L ) + Q L
where c L , Δ T L , and λ L represent the isobaric specific heat capacity, the temperature gradient, and the thermal conductivity of the driving fluid in the reservoir fractures, respectively.
The compactness of geothermal reservoir rocks can be regarded as a solid entity devoid of voids, thereby reducing the nonlinearity of numerical simulations. Equation (5) presents the governing equations for the temperature field of the reservoir rocks, which are principally derived based on the energy conservation equation.
ρ s c s φ ( Δ T s ) t = T s α T K ξ V t + λ s ( ( T s ) ) + Q s
where ρ s , c s , and λ s are the density, specific heat capacity at a constant pressure, and thermal conductivity of the reservoir rock, respectively. In addition, α T and T s are the thermal expansion coefficient and bulk modulus of reservoir rocks. ξ V is the volumetric strain of reservoir rocks due to thermal expansion. Q s is the heat source term of reservoir rock.
The greater reservoir depth of geothermal reservoirs has been demonstrated to achieve thermal equilibrium between fluids and rocks. The thermal equilibrium equation (Equation (6)) can be utilised to construct the energy equation that drives the fluids and rocks in the reservoir rock.
( ρ L c L φ Δ T ) t + ρ s c s ( Δ T ) t = ( ρ L c L q L T ) + ( λ L φ T ) + T α T K ξ V t   + λ s ( ( T ) ) + Q s + Q L
where Q T = Q s + Q L .
The energy in Equation (6) is transformed into the weak integral form in Equation (7) to enhance the stability of the numerical model during solution.
Ω ω ( ρ L c L T ) t + ρ s c s ( Δ T ) t d Ω = Ω ρ L c L q L T     ω d Ω Ω λ L T     ω d Ω + Ω λ s T     ω d Ω + Ω ω T α T K ξ V t d Ω + Ω ( Q s + Q L ) d Ω
Concurrently, the temperature field equation and weak integral formulation of the reservoir fracture can be described by Equations (8) and (9).
d f ρ s c s ( T ) t l ( d f λ f l T ) d f ρ l c l ( k f μ l p ) l T = d f Q f
Ω d f ρ s c s ( T ) t d V + Ω d f λ f l T     v d V + Ω d f ρ l c l k f μ ( p T ) v d V = Ω ( d f q f + q . s ) v d V + Ω d f λ f T n d Ω + v d S
where λ f presents the thermal conductivity of reservoir fractures. Q f is the heat source term that satisfies Newton’s cooling equation. n is the unit vector perpendicular to the boundary, with a length of 1 and an outward direction. Wellbore diameter is set to 0.2 m to represent realistic EGS completion sizes, ensuring accurate flow resistance calculation.

2.3. Stress Field Governing Equations

The injection of cold driving fluids into the high-temperature solid matrix of geothermal reservoirs induces deformation of the reservoir rocks, thereby leading to variations in the in situ stress state. Moreover, geothermal reservoir rocks are generally characterized as viscoelastic solids with relatively high elastic moduli, which necessitates the incorporation of stress field governing equations in the reservoir model, as given in Equation (10) [22].
G u i , j + ( λ + G ) u j , j i α B p i α T T s , i + F = 0
G = E 2 ( 1 + v )
λ = E v ( 1 + v ) ( 1 2 v )
α B = 1 K K s
K = E 3 ( 1 2 μ )
where G presents the shear modulus. λ presents Lamé’s first constant. u i , j , u i , i , and u j , j present the displacement component. α B and α T display the Biot–Willis constant and temperature components, respectively. K is the bulk modulus of rock mass. Ks is the volume modulus of the rock matrix. E is the modulus of elasticity. v is the Poisson’s ratio.
Furthermore, the weak integral form of the stress field control equation (see Equation (15)) contributes to the stability and sustainability of the numerical model during operation.
Ω G δ u i , j u i , j + ( λ + G ) δ u i , i u j , j d Ω Ω ( α B δ u i , j p + α T δ u i , i T )   d Ω + Ω δ u i F i d Ω + Γ t δ u i t i d Γ = 0
where F i is the physical fitness items, and t i is the boundary forces. In addition, Γ is the external loads on the boundary. p i and T s , i are the pressure component and temperature component, respectively.

2.4. Permeability Governing Equations of Geothermal Reservoirs

The permeability and porosity of geothermal reservoirs directly control the flow and seepage behaviour of driving fluids within the reservoir matrix, thereby necessitating explicit constraints on these parameters in the numerical model. Equations (16) and (17) present the governing relationships for reservoir permeability and porosity, respectively, which are primarily influenced by the coupled effects of the seepage field, stress field, and temperature field [23].
ϕ = 1 ( 1 ϕ 0 ) exp [ 1 K s ( p p 0 ) + α T ( T T 0 ) ( ζ V ζ V 0 ) ]
k = k 0 { 1 ϕ 0 ( 1 ϕ 0 1 ) exp [ 1 K s ( p p 0 ) + α T ( T T 0 ) ( ζ V ζ V 0 ) ] } 3
where ϕ and ϕ 0 are the real time porosity and initial porosity of geothermal reservoirs. k and k 0 are the real time permeability and initial permeability of geothermal reservoirs.

2.5. Coupling Relationships in Geothermal Reservoirs

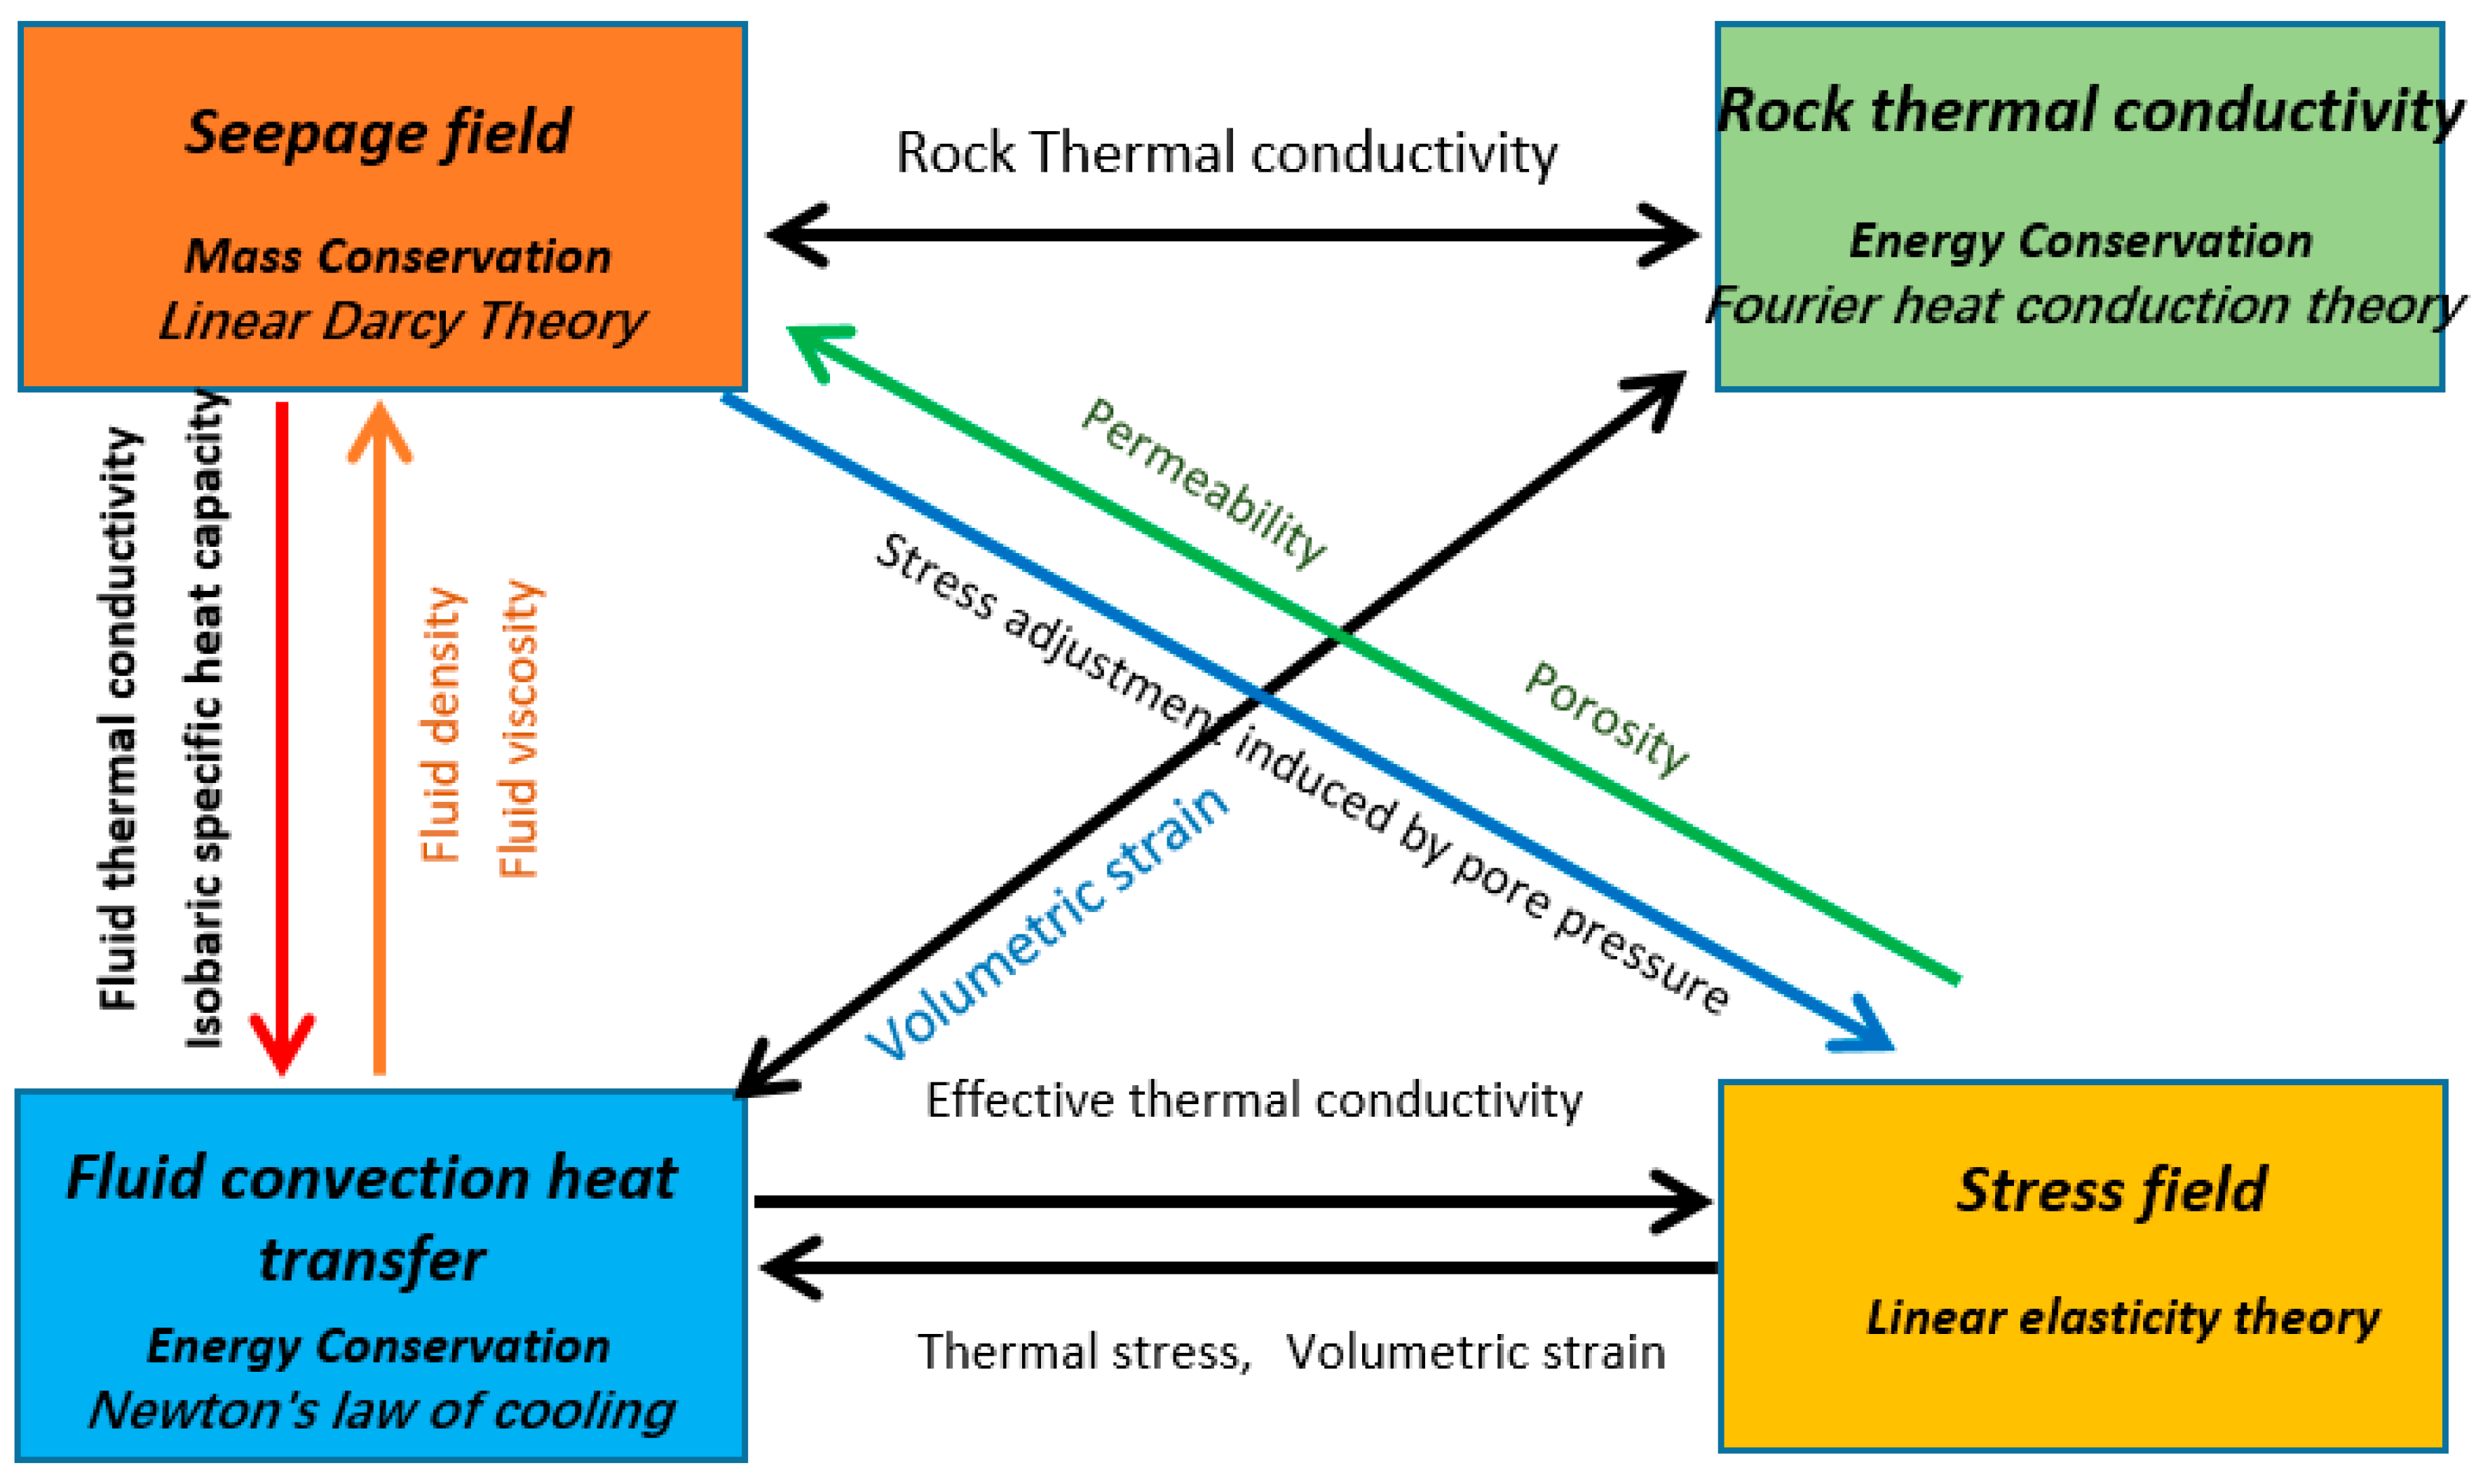
Numerical modelling of geothermal reservoirs involves multiple interacting physical fields, including the seepage field, temperature field, stress field, and chemical field (Figure 1). In the context of geothermal reservoir development, the chemical field is commonly neglected, as the injected driving fluids are generally assumed not to induce significant chemical reactions with the reservoir rocks.

2.6. Boundary Conditions

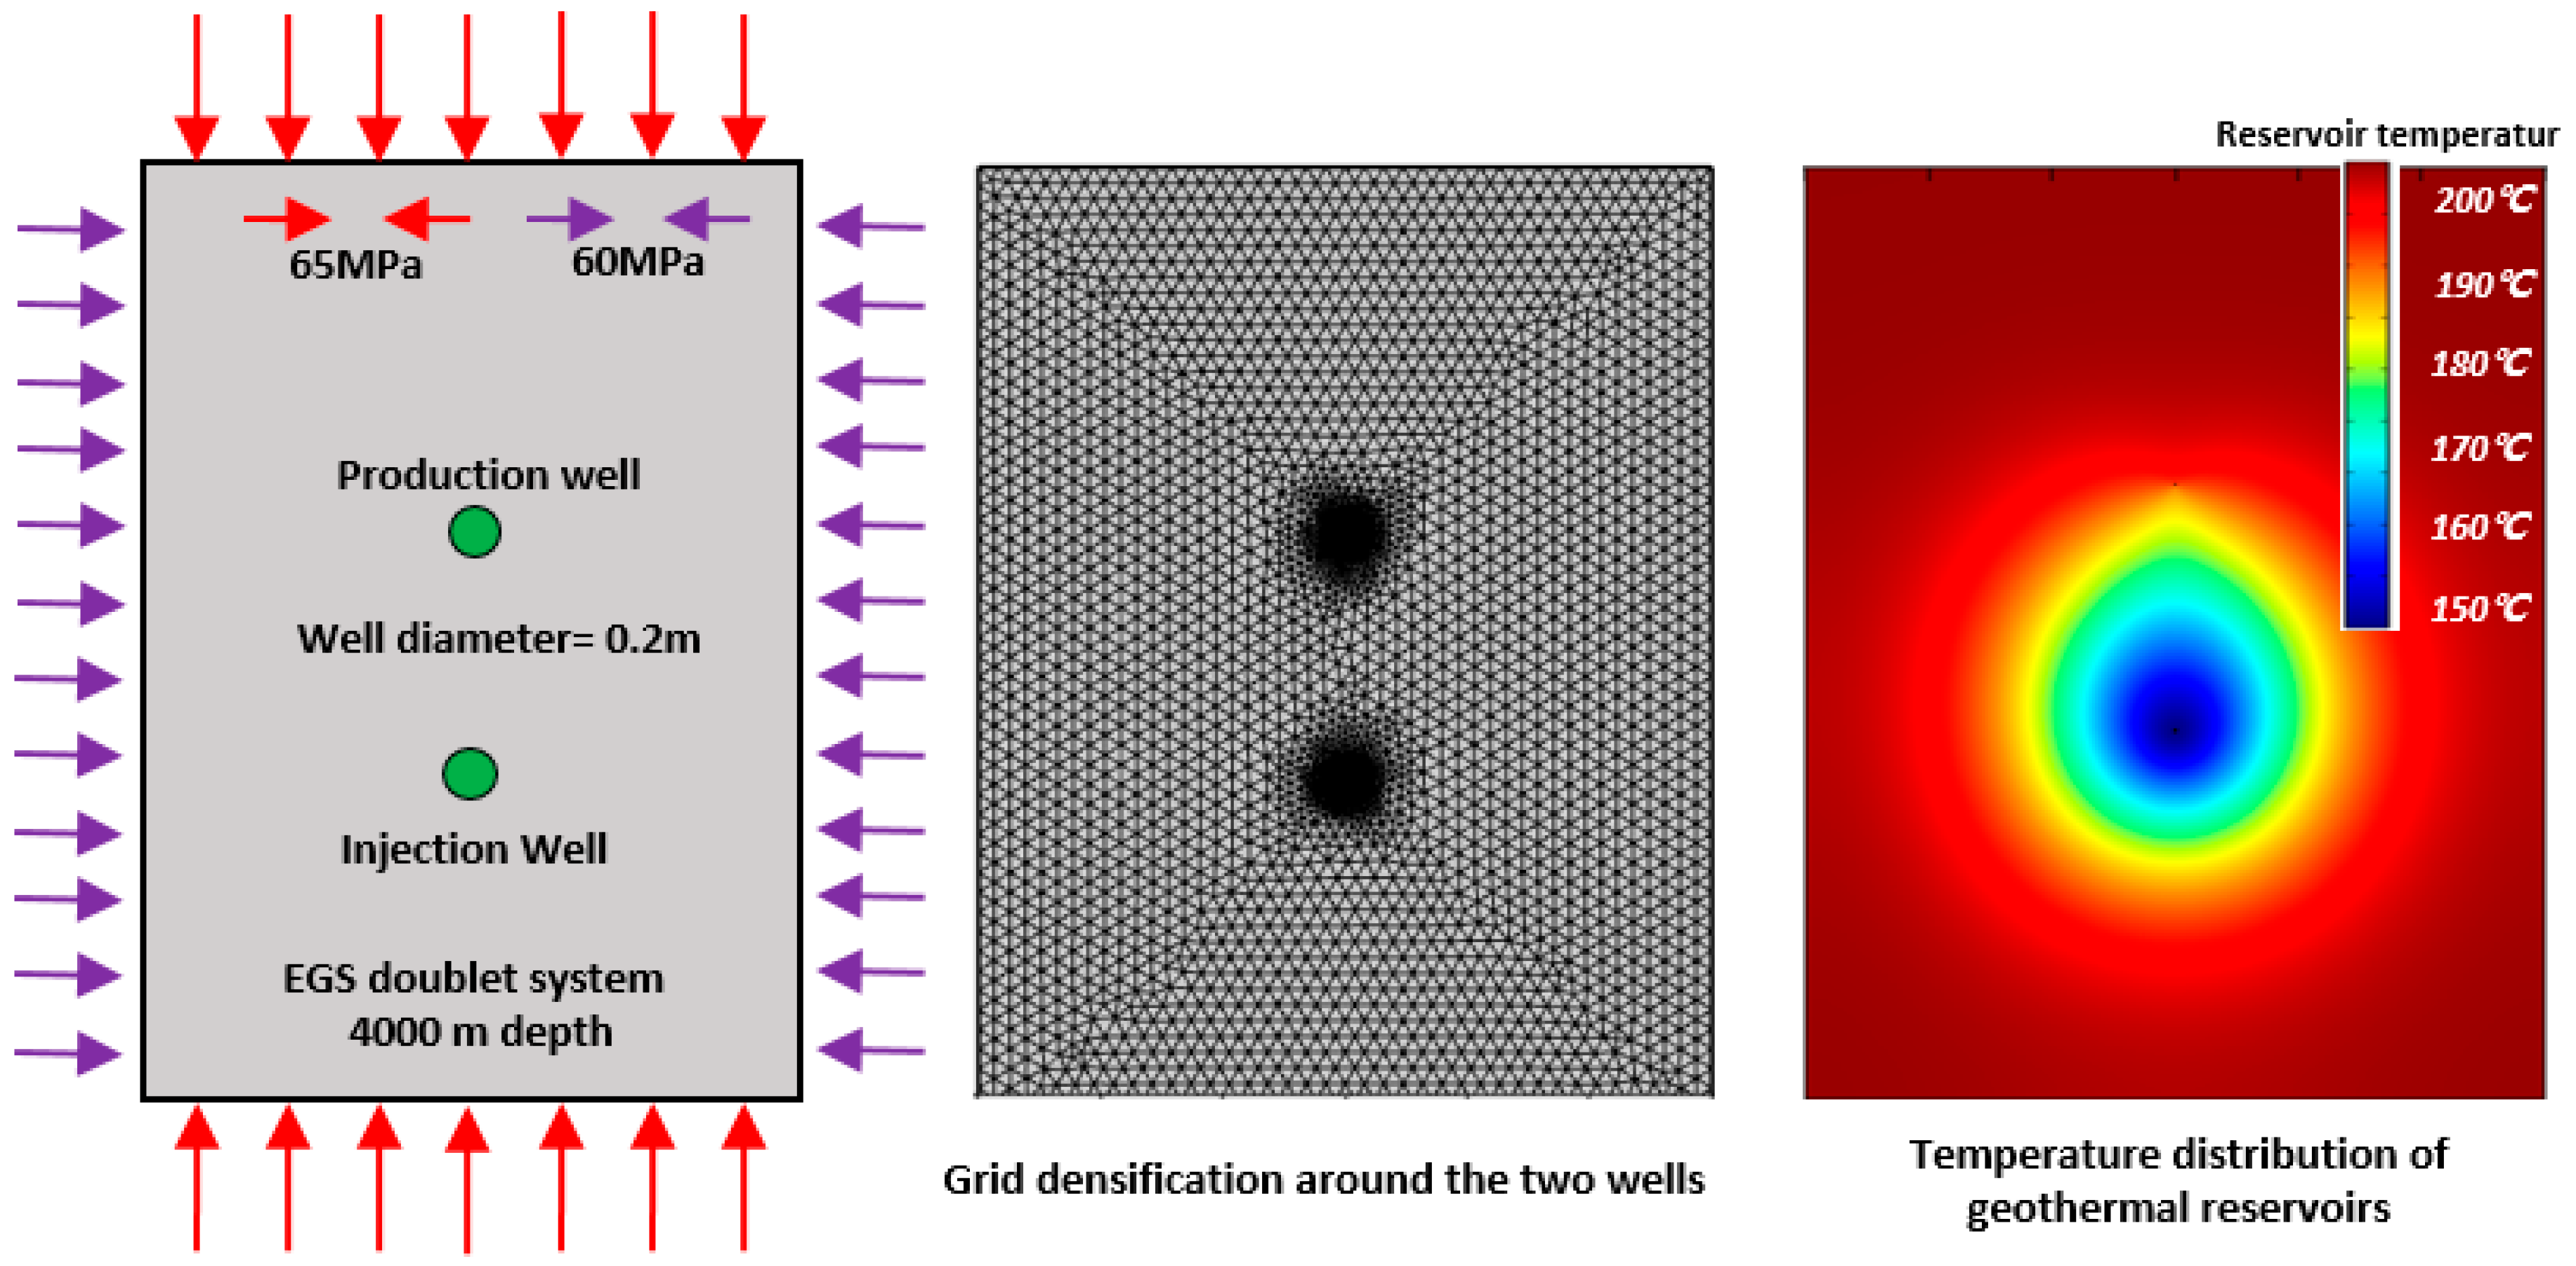
The geothermal reservoir in this study is modelled as an Enhanced Geothermal System (EGS) in hot dry rock at a depth of approximately 4000 m, with an initial rock temperature of 200 °C. The diameters of both the injection and production wells are set to 0.2 m (corresponding to a common production casing inner diameter of approximately 7–8 inches in EGS projects). The thermal boundaries are adiabatic (zero heat flux). The seepage boundaries are set as no-flow boundaries except at the wellbores. The initial reservoir pressure is set to 40 MPa (approximating hydrostatic pressure at 4000 m depth). To reflect realistic operational conditions, the wellhead injection pressure is set in the range of 15–25 MPa (adjustable according to injection rate), and the production well back pressure is maintained at 1 MPa. This results in an inter-well pressure difference of approximately 8–15 MPa, which is more representative of actual EGS circulation tests while avoiding excessive induced seismicity risks. The upper and lower boundaries are subjected to an initial vertical in situ stress of 65 MPa, and the lateral boundaries have a horizontal stress of 60 MPa (Figure 2).
The thermal boundaries of the model are set as adiabatic with zero heat flux. This is a common simplification in numerical studies of geothermal systems, assuming that the model domain is large enough that heat conduction from far-field rock masses has negligible influence during the simulated time scale (hundreds of days). In actual reservoirs, a natural geothermal gradient and heat supply from surrounding formations exist. To evaluate the impact of this assumption, additional simulations incorporating a geothermal gradient of 25–30 °C/km at the outer boundaries were performed. The results show that while the absolute outlet temperature is maintained at a slightly higher level under non-adiabatic conditions, the overall trends with respect to injection temperature, fluid viscosity, and injection rate remain qualitatively consistent. Therefore, the adiabatic boundary condition does not affect the main conclusions of this study.

2.7. Data Comparison and Validation of Numerical Models

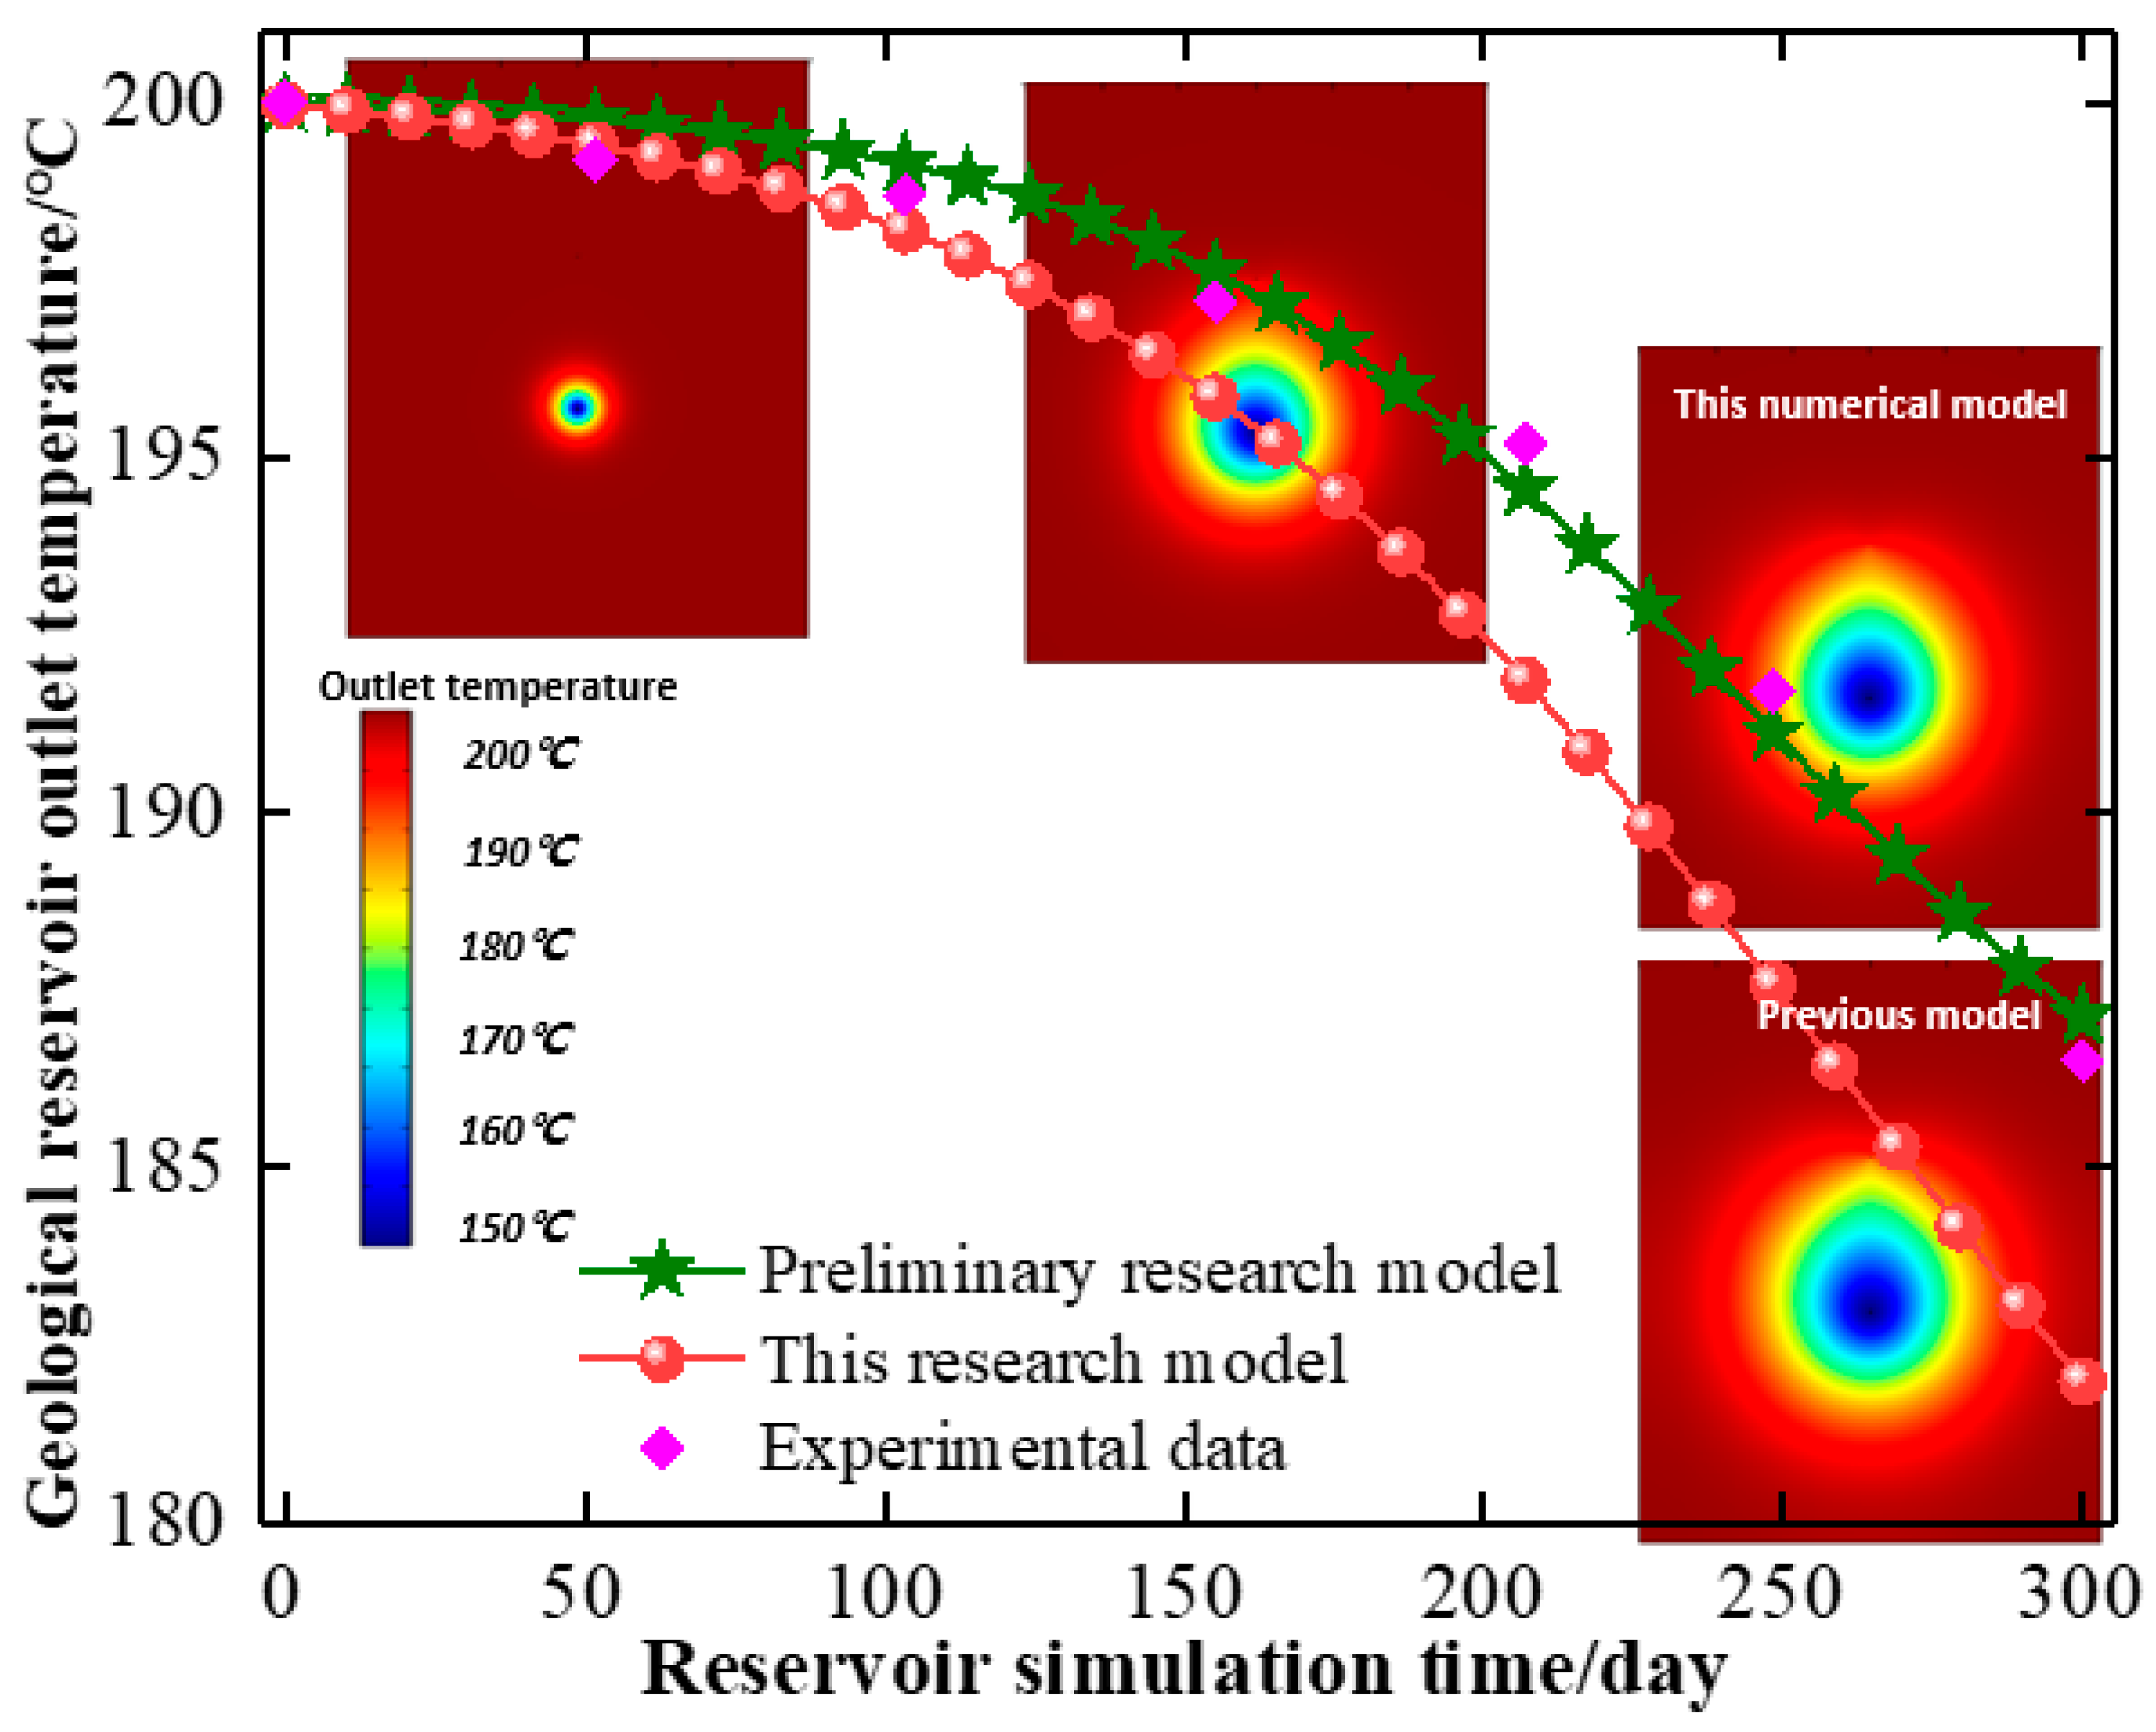
To validate the reliability of the thermo-hydro-mechanical (THM) coupled numerical model developed in this study, the simulated outlet temperature of the production well was systematically compared with benchmark numerical results from previous studies and laboratory-scale experimental data.
As illustrated in Figure 3, the present model exhibits good agreement with the numerical results reported by Sun et al. [12] (discrete fracture network THM model implemented in multiphysics coupling platform) and Pandey et al. [5] (coupled THM modelling of fracture aperture evolution during heat extraction). The temporal evolution trends (including a gradual temperature decline during the initial 150 days followed by a more pronounced decrease) are consistent across all datasets. Furthermore, comparison with laboratory-scale experimental data on thermo-hydro-mechanical damage evolution in fractured granite, as reported by Wei et al. [24], demonstrates a reasonable agreement. The relative error between the present simulation and experimental measurements remains within 8% after 300 days of operation. It is noteworthy that the present model is developed based on a refined framework incorporating more realistic boundary conditions, including a wellbore diameter of 0.2 m and an operational pressure differential range of 8–15 MPa. Although minor deviations are observed compared with earlier preliminary models (which exhibited slightly closer agreement with experimental data), the present model successfully captures the overall trends and key physical mechanisms. Figure 3 shows a comparison of production well outlet temperature versus time among the present THM model, benchmark numerical results from previous studies [5,12], and laboratory experimental data [24]. The present model shows good agreement with both numerical and experimental benchmarks, with relative errors remaining within acceptable engineering tolerances.
All transient results (outlet temperature, permeability evolution, fracture propagation, etc.) are reported against simulation time, where t = 0 marks the instant when cold driving fluid injection begins and production starts. This convention is consistent with standard practice in THM-coupled geothermal simulations.
In this study, geothermal energy extraction efficiency is primarily evaluated using the production well outlet temperature as a key proxy indicator. A higher and more sustained outlet temperature over time corresponds to better extraction performance and higher overall efficiency. Conversely, a rapid decline in outlet temperature indicates earlier thermal breakthrough (cold front reaching the production well) and thus lower long-term extraction efficiency. No full energy balance calculation (e.g., total thermal power or recovery factor) was performed in the present parametric study.

3. Results and Discussion

3.1. The Influence of Initial Viscosity of Injected Fluid

3.1.1. Outlet Temperature

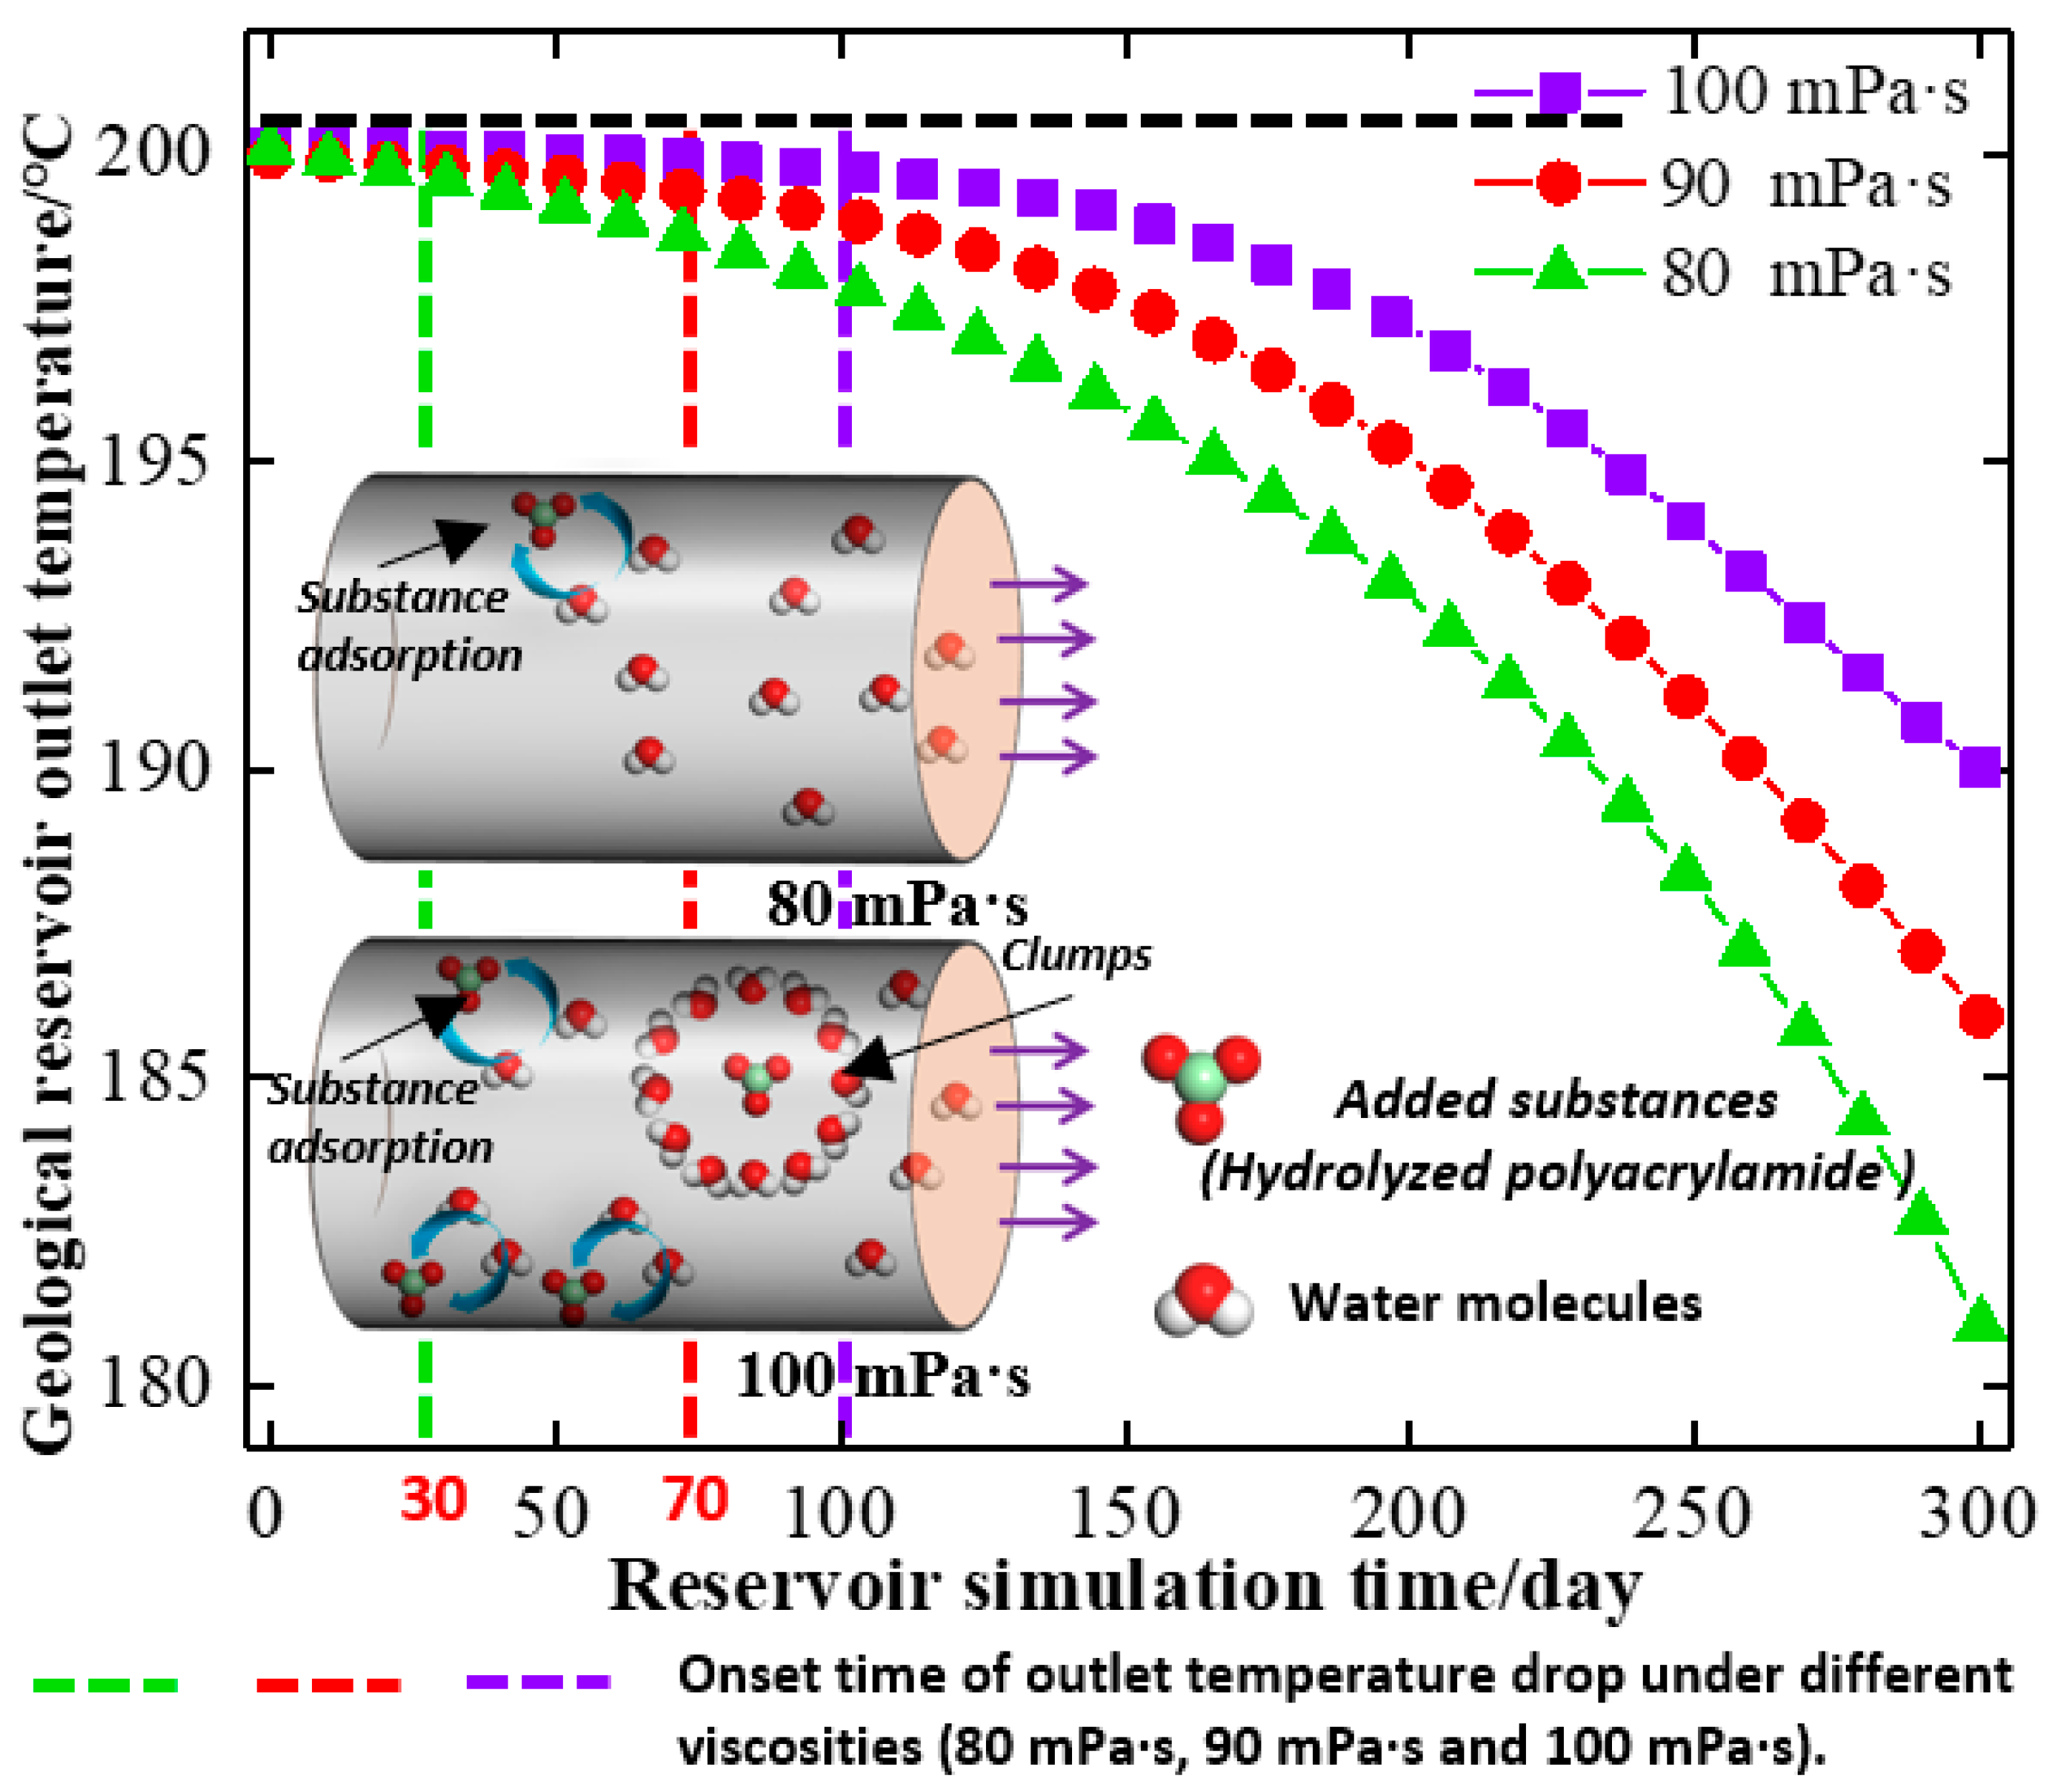
The fluid properties of the injected medium play a critical role in governing geothermal energy transport and recovery within geological reservoirs, among which fluid viscosity directly controls flow resistance and seepage behaviour. Figure 4 illustrates the influence of viscosity variations on the outlet temperature of the production well, thereby providing a basis for selecting appropriate driving fluids for specific geothermal reservoirs. Variations in fluid viscosity do not alter the overall declining trend of the outlet temperature, but they significantly affect both the rate and duration of the temperature decrease. Lower-viscosity fluids lead to a markedly earlier inflection point in outlet temperature, indicating a higher geothermal energy extraction rate. In contrast, higher-viscosity fluids substantially prolong the period during which the outlet temperature remains close to the formation temperature, although the overall geothermal extraction capacity is reduced compared with that achieved under low-viscosity conditions. As shown in Figure 4, a driving fluid with a viscosity of 80 mPa·s results in a gradual decline in outlet temperature within approximately 70 days, whereas a viscosity of 90 mPa·s delays the onset of temperature reduction by about 20 days. Furthermore, during the gradual decline stage of the outlet temperature, the temperature reduction rate associated with low-viscosity driving fluids is significantly higher than that of high-viscosity fluids, which is unfavourable for sustained geothermal energy extraction during the later production stage. In summary, low-viscosity driving fluids can transport geothermal energy to the production well more rapidly, thereby enabling high initial extraction efficiency, whereas high-viscosity fluids exhibit a limited capacity to drive geothermal energy toward the production well within a short time frame.
The markedly different trends in geothermal reservoir extraction efficiency associated with fluid viscosity can be attributed to viscosity-induced variations in driving velocity. Low-viscosity driving fluids experience reduced flow resistance within reservoir fractures, primarily due to weaker molecular adsorption and diminished microscale drag effects [25]. The limited formation of intermolecular bonds and interaction forces in low-viscosity fluids inhibits extensive molecular adsorption onto rock surfaces, thereby minimizing macroscopic flow resistance and ensuring smoother transport of heat-carrying fluids through fracture networks. In contrast, high-viscosity fluids exhibit stronger intermolecular interactions at the microscale [26], which promote fluid aggregation and surface adsorption, consequently impeding fluid migration toward the production well. As observed in Figure 4, lower injection temperatures lead to a faster decline in outlet temperature after the stable production stage. Although this results in higher initial heat extraction rates, it also causes earlier thermal breakthrough, which is detrimental to long-term geothermal extraction efficiency.
Furthermore, fluid viscosity can induce localized adsorption and partial blockage within geological reservoirs, resulting in temperature heterogeneity at the production well outlet. This phenomenon arises from the coupled effects of molecular adsorption, fluid flow dynamics, and geothermal heat transfer. Low-viscosity fluids [23], characterized by weak intermolecular interactions within reservoir fractures, exhibit minimal adsorption and low flow resistance. Consequently, the limited formation of macroscopic aggregates scarcely obstructs microscopic fracture pathways in geothermal reservoirs. The resulting smooth fracture flow enables low-viscosity fluids to transport geothermal energy to the production well more rapidly. In contrast, high-viscosity fluids exhibit markedly different transport behaviour. Strong intermolecular interactions promote significant adsorption onto rock surfaces, leading to fluid aggregation and fracture blockage, which substantially increases flow resistance and reduces migration velocity. The obstruction of fracture pathways hampers the effective transport of injected fluids toward the production well, ultimately resulting in lower geothermal extraction efficiency compared with low-viscosity fluids.

3.1.2. Reservoir Permeability

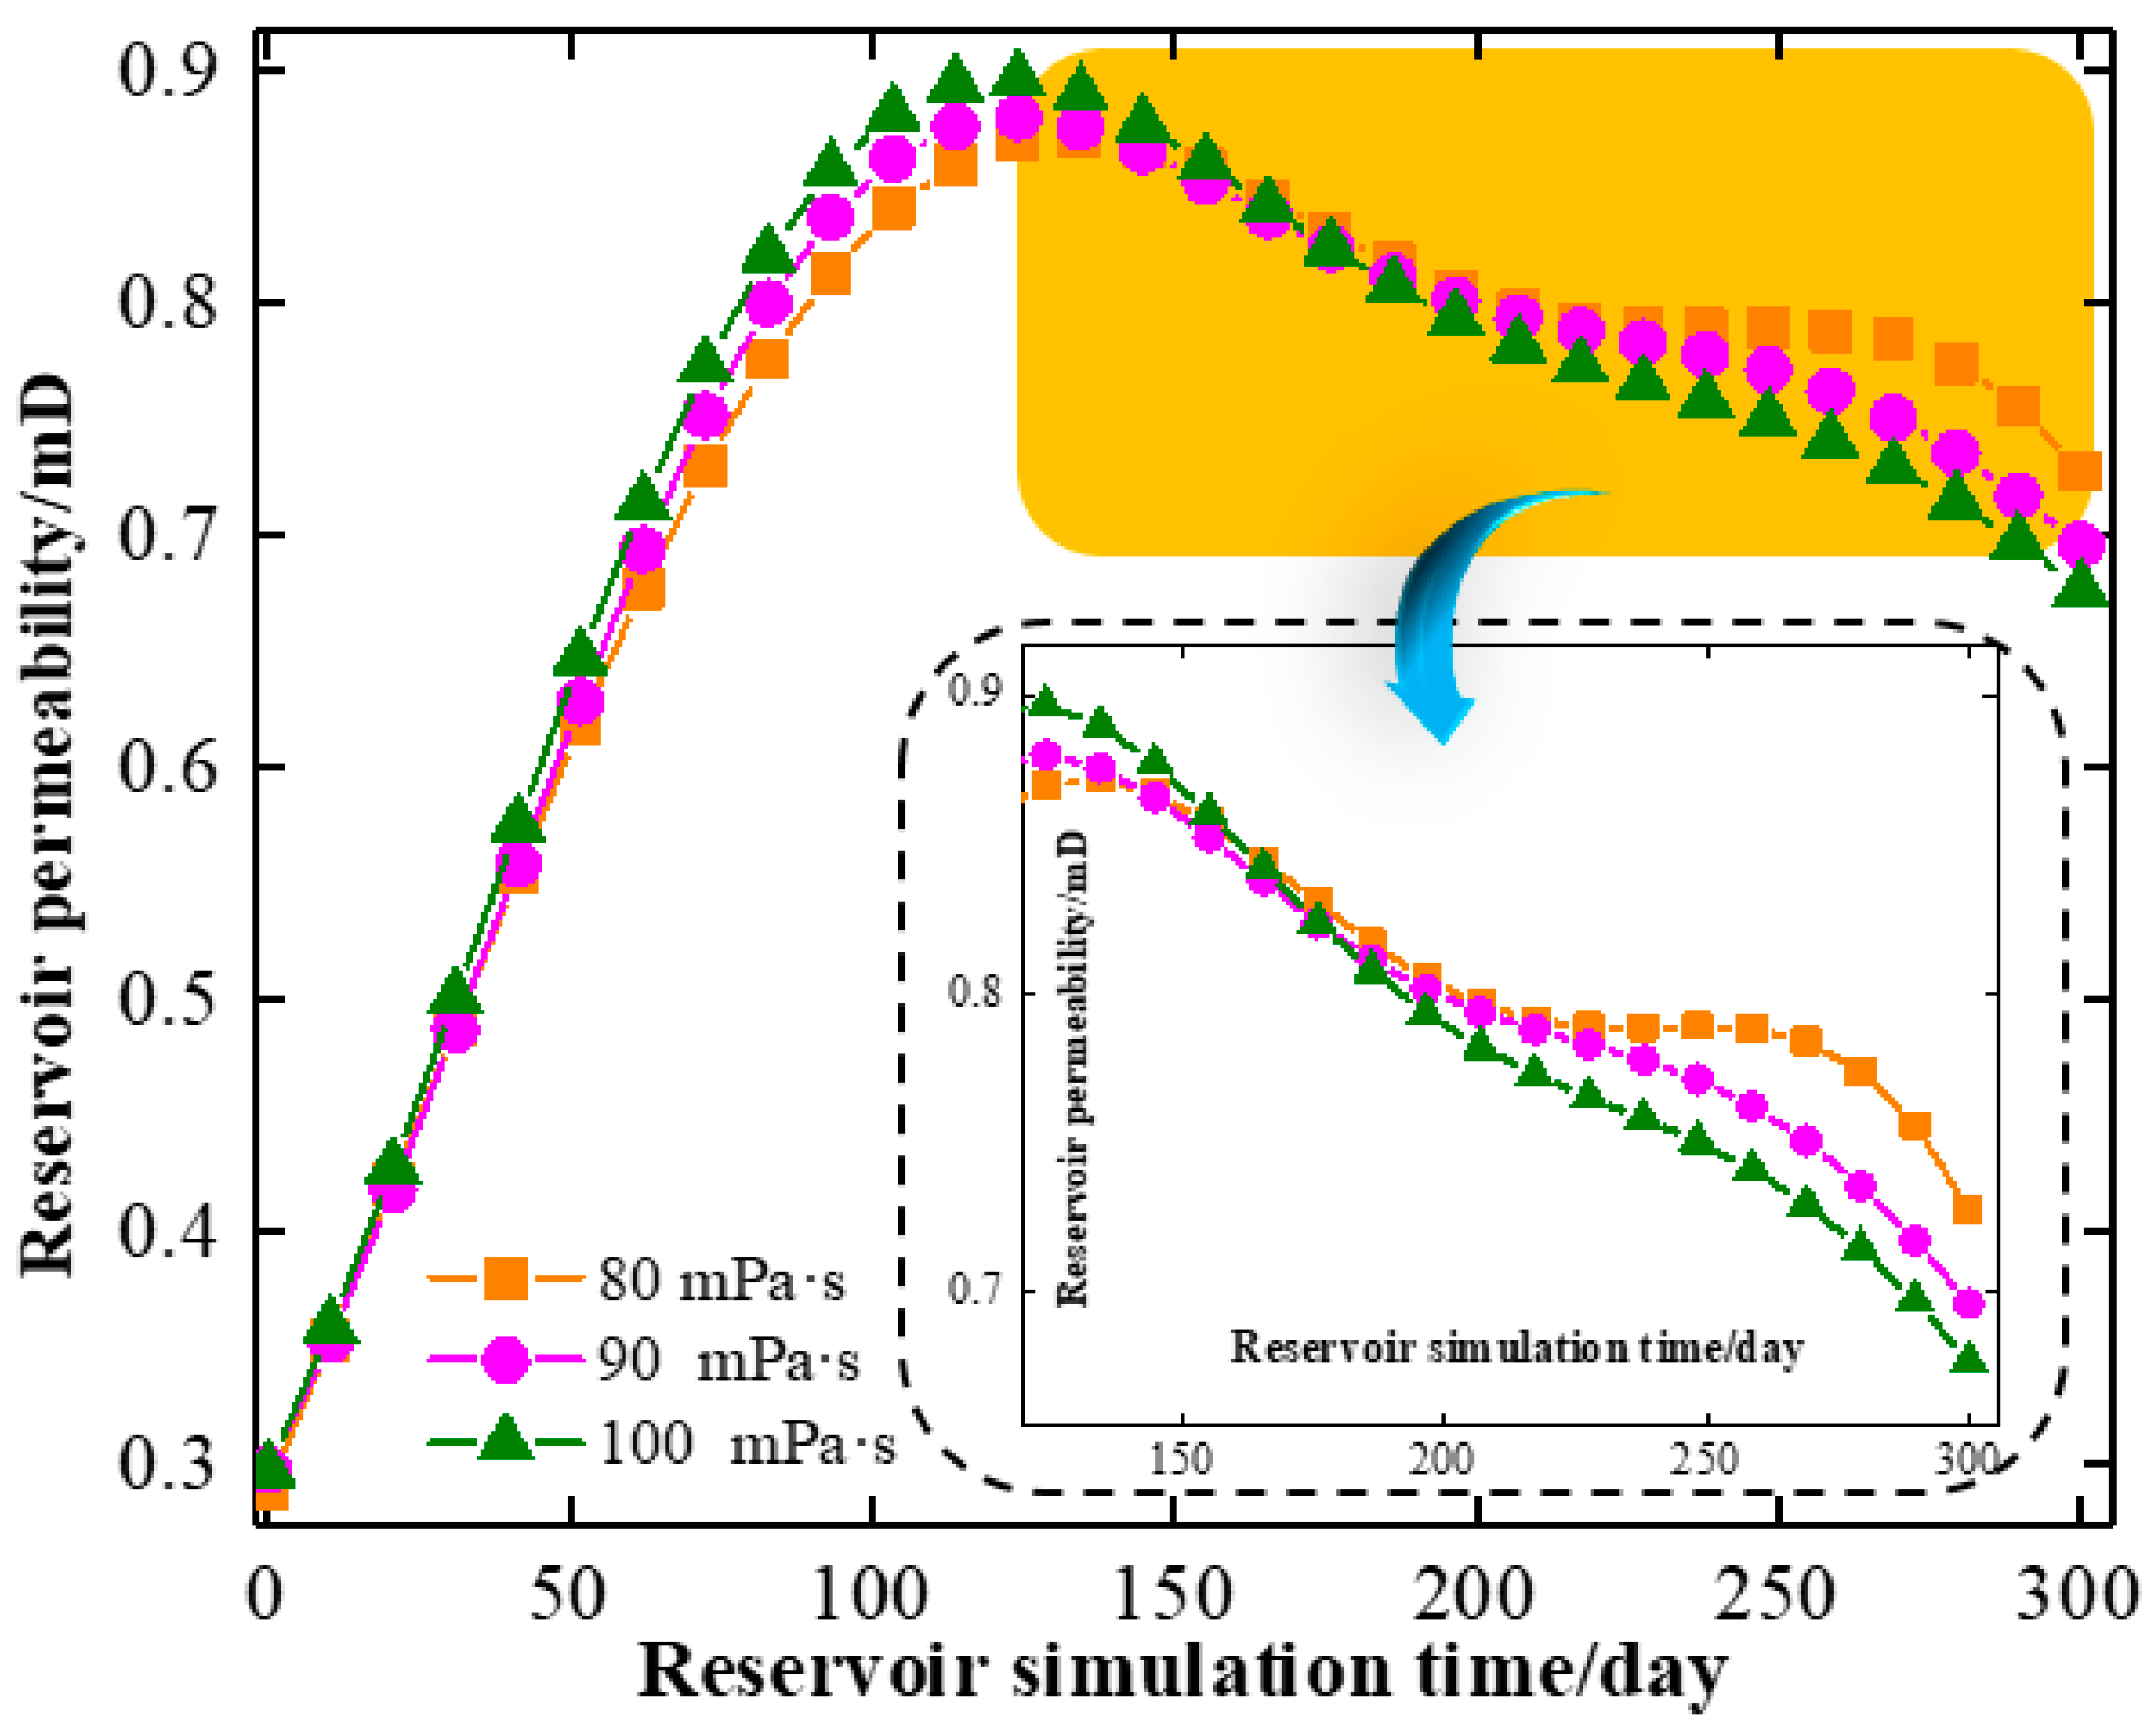
Figure 5 illustrates the influence of the apparent viscosity of the driving fluid on geothermal reservoir permeability. Overall, reservoir permeability exhibits an initial increasing trend followed by a slight decline with increasing driving time. During the permeability enhancement stage, the curves corresponding to different fluid viscosities largely overlap, indicating a similar permeability evolution behaviour. In contrast, minor discrepancies emerge in the subsequent decline stage. Specifically, the low-viscosity driving fluid results in a permeability reduction of approximately 0.12 mD during the decline stage, whereas the higher-viscosity driving fluid leads to a more pronounced permeability decrease of about 0.20 mD, suggesting a stronger permeability degradation effect associated with increased fluid viscosity.
The enhancement of reservoir permeability is primarily attributed to the increase in fracture aperture induced by thermally driven contraction of the rock matrix under confined conditions. During the early stage of injection, this permeability increase is dominated by the cooling effect associated with low-temperature fluid injection. When a cold working fluid is introduced into a high-temperature reservoir, the rock matrix undergoes thermal contraction. Owing to mechanical confinement imposed by the surrounding formation, this contraction generates tensile stresses that promote the opening and extension of pre-existing fractures, thereby increasing fracture aperture. Since permeability in fractured reservoirs is highly sensitive to fracture aperture (following the cubic law), even small increases in aperture can result in significant permeability enhancement. As shown in Figure 6, lower injection temperatures produce more pronounced thermal contraction, resulting in greater fracture opening and thus higher reservoir permeability. In contrast, higher injection temperatures cause less contraction, limiting fracture aperture enhancement and leading to lower permeability. In contrast, the subsequent reduction in permeability observed for fluids with different viscosities is mainly governed by material adsorption and agglomeration processes, which directly control the flow behaviour of the driving fluid within reservoir fractures. Low-viscosity fluids exhibit limited adsorption onto fracture surfaces, thereby reducing flow resistance and mitigating pore blockage due to the presence of relatively clean fracture pathways. Moreover, the weaker intermolecular interactions associated with low-viscosity fluids hinder the formation of large agglomerates, further decreasing the likelihood of fracture clogging. Conversely, high-viscosity fluids readily adhere to rock surfaces [27], resulting in increased flow resistance, while additives retained on the fracture walls can further alter reservoir permeability. In addition, agglomerates formed by high-viscosity fluids tend to accumulate within fractures, causing significant blockage and a pronounced reduction in permeability, which constitutes the dominant mechanism governing permeability evolution [28]. Consequently, high-viscosity fluids not only limit the enhancement of geothermal energy extraction efficiency but also intensify fracture blockage and potential environmental risks within geothermal reservoirs.

3.2. Injection Temperature of the Driving Fluid

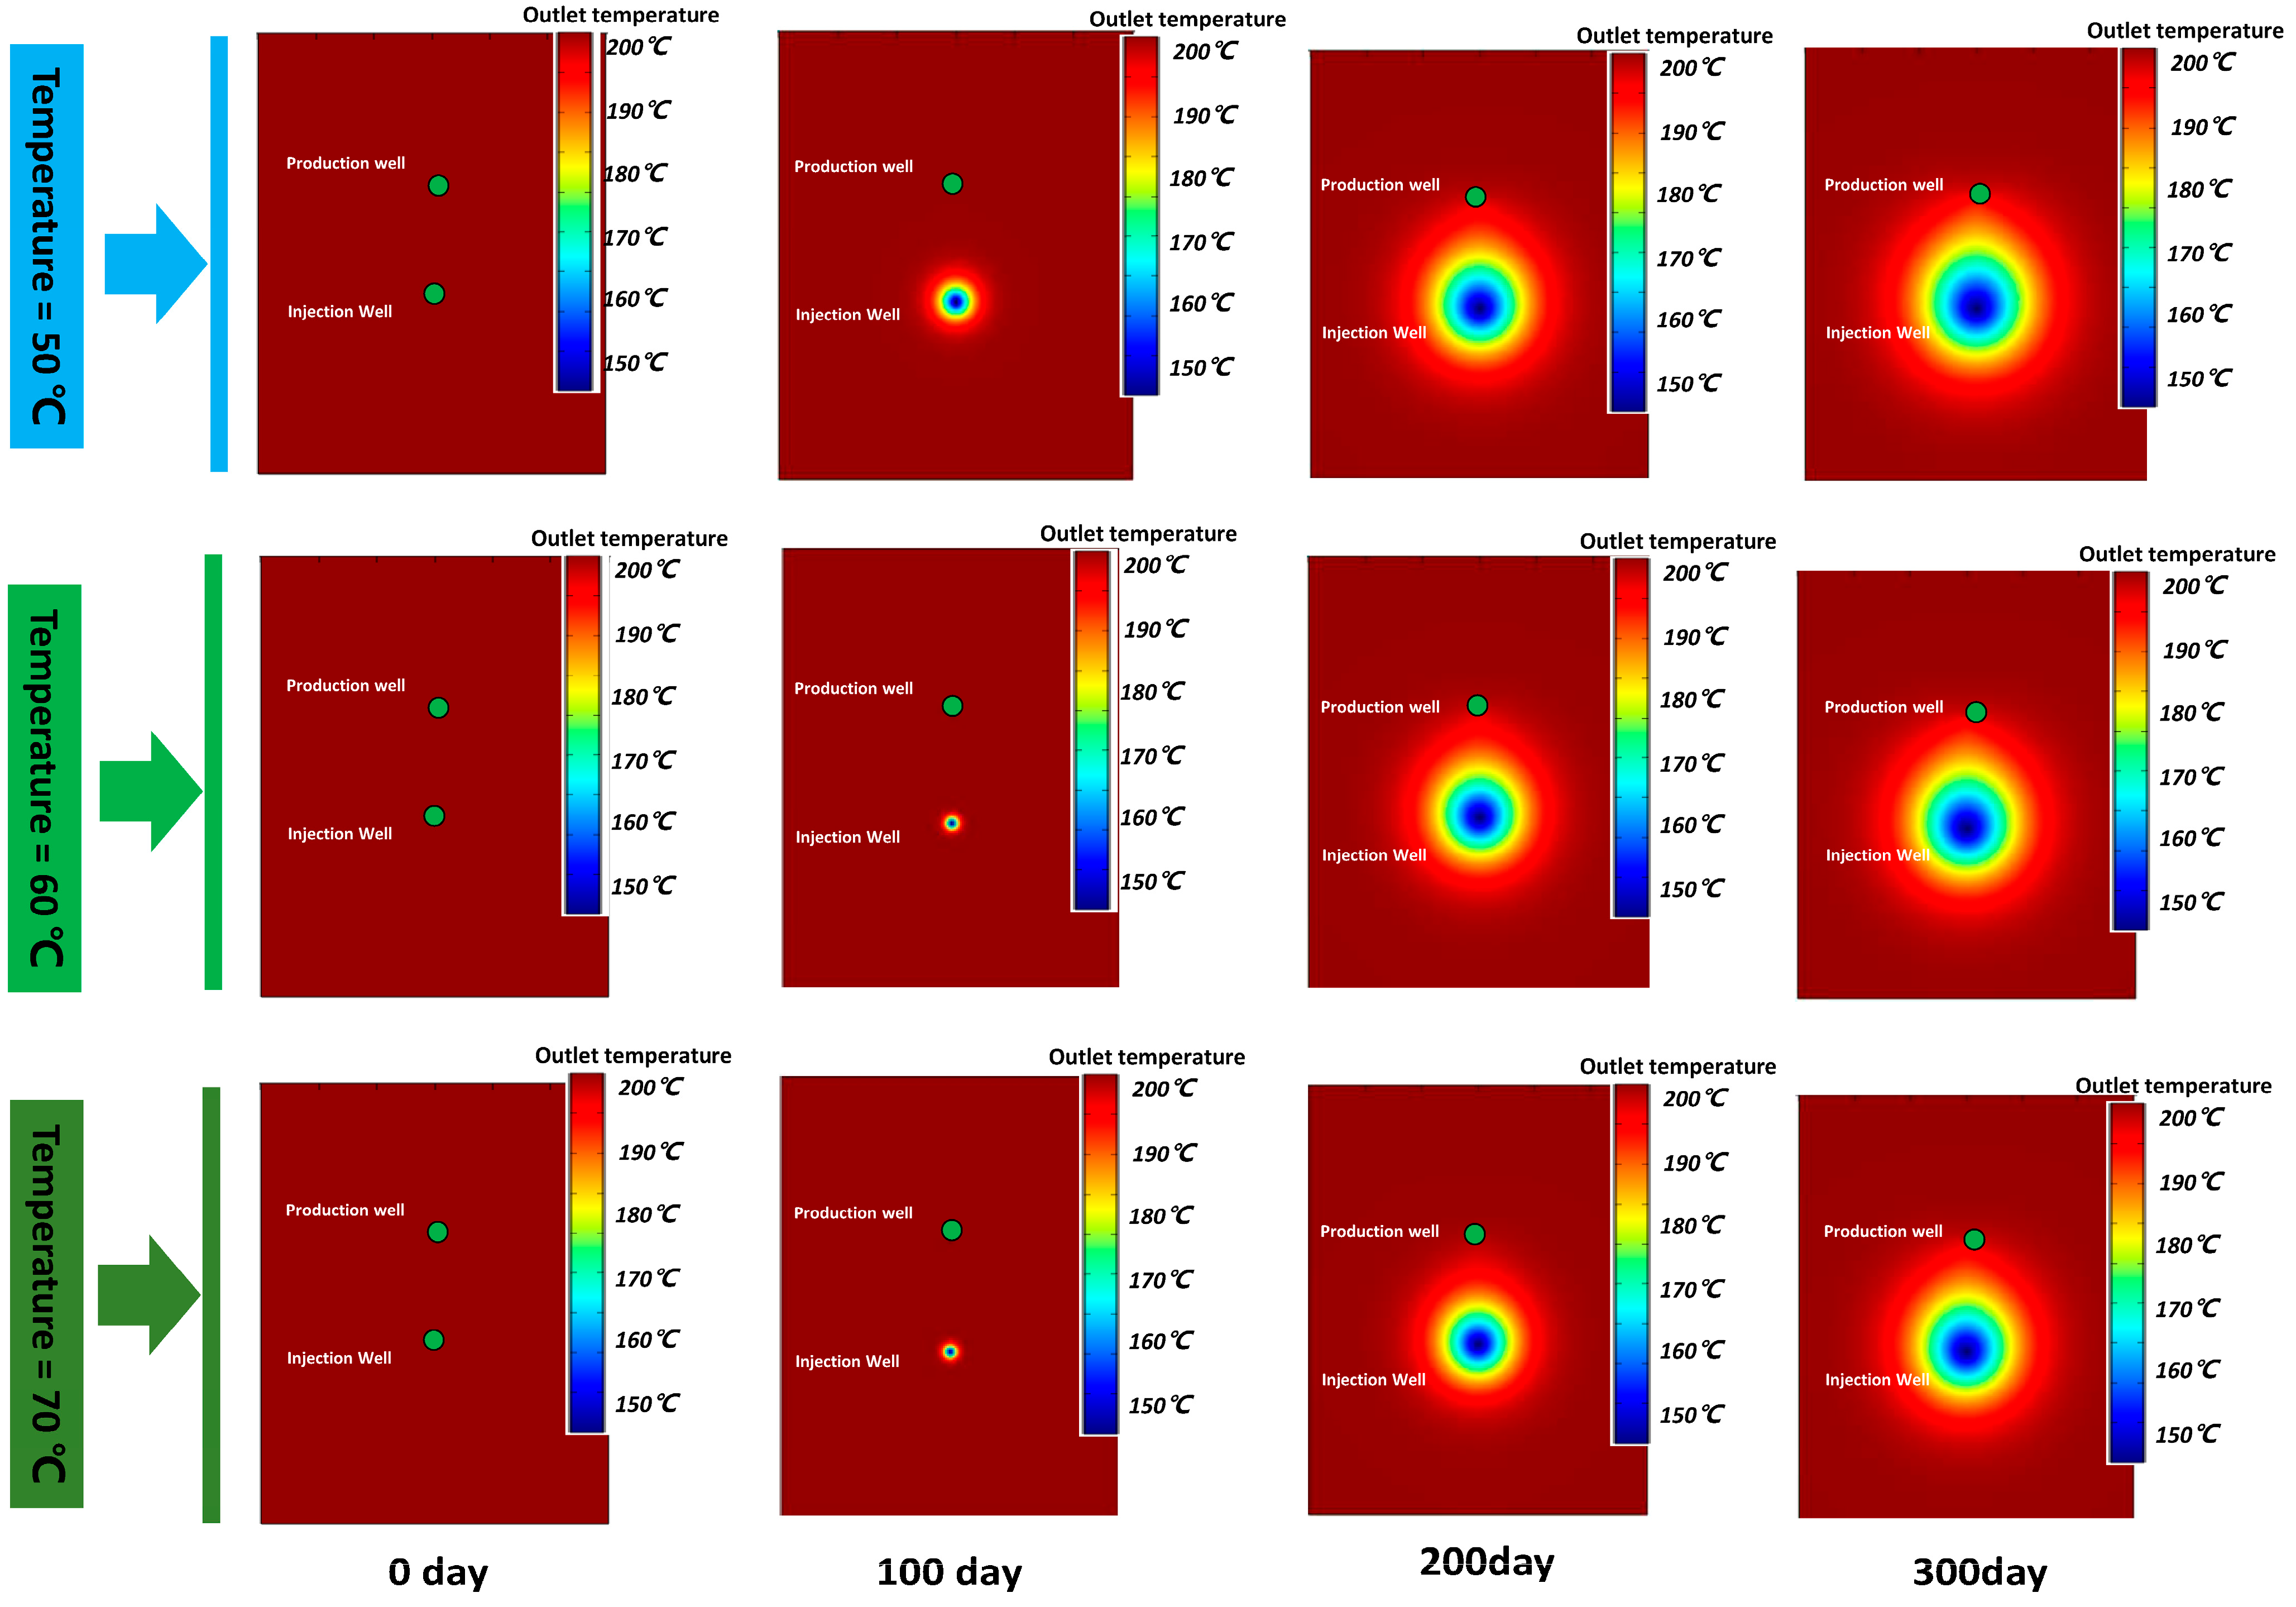
Previous studies have demonstrated that the injection temperature of the driving fluid significantly influences both reservoir permeability and porosity, while reservoir permeability directly governs the rate at which geothermal energy is transported to the production well by the injected fluid. Figure 6 illustrates the variations in reservoir permeability and production well outlet temperature under different injection temperatures, thereby enabling an analysis of the correlations and underlying microscopic mechanisms among these three factors. The results shown in Figure 6 indicate that injection temperature exerts a negligible influence on the outlet temperature during the early stage of geothermal extraction; the outlet temperature remains nearly constant, and geothermal energy is efficiently recovered at the production well. This initial stage corresponds to a period of relatively high geothermal extraction rates, during which the injected driving fluid has not yet reached the production well. With the sustained injection of fluid, a distinct low-temperature zone gradually develops between the injection and production wells (see blue region in Figure 6). This is primarily due to the sustained migration of cold fluid toward the production well. In this region, geothermal energy has already been displaced and transported to the production well, and the pore space is subsequently occupied by the injected low-temperature fluid. As the injection time increases, the low-temperature zone exhibits a progressive “tongue-shaped” extension, a phenomenon that has been commonly observed during geothermal energy extraction processes. This phenomenon, termed “tongue-in,” is primarily driven by the pressure gradient between the injection and production wells, which preferentially directs the injected cold water toward the producer. This driven flow typically follows the highest-permeability pathways within the reservoir, leading to the rapid advancement of the cooling front in a characteristic “tongue” shape as observed in the isothermal distribution. Conversely, fluid migration along secondary fracture pathways occurs at a more gradual pace, leading to delayed geothermal energy recovery in the surrounding regions and a gradual decline in local extraction efficiency.
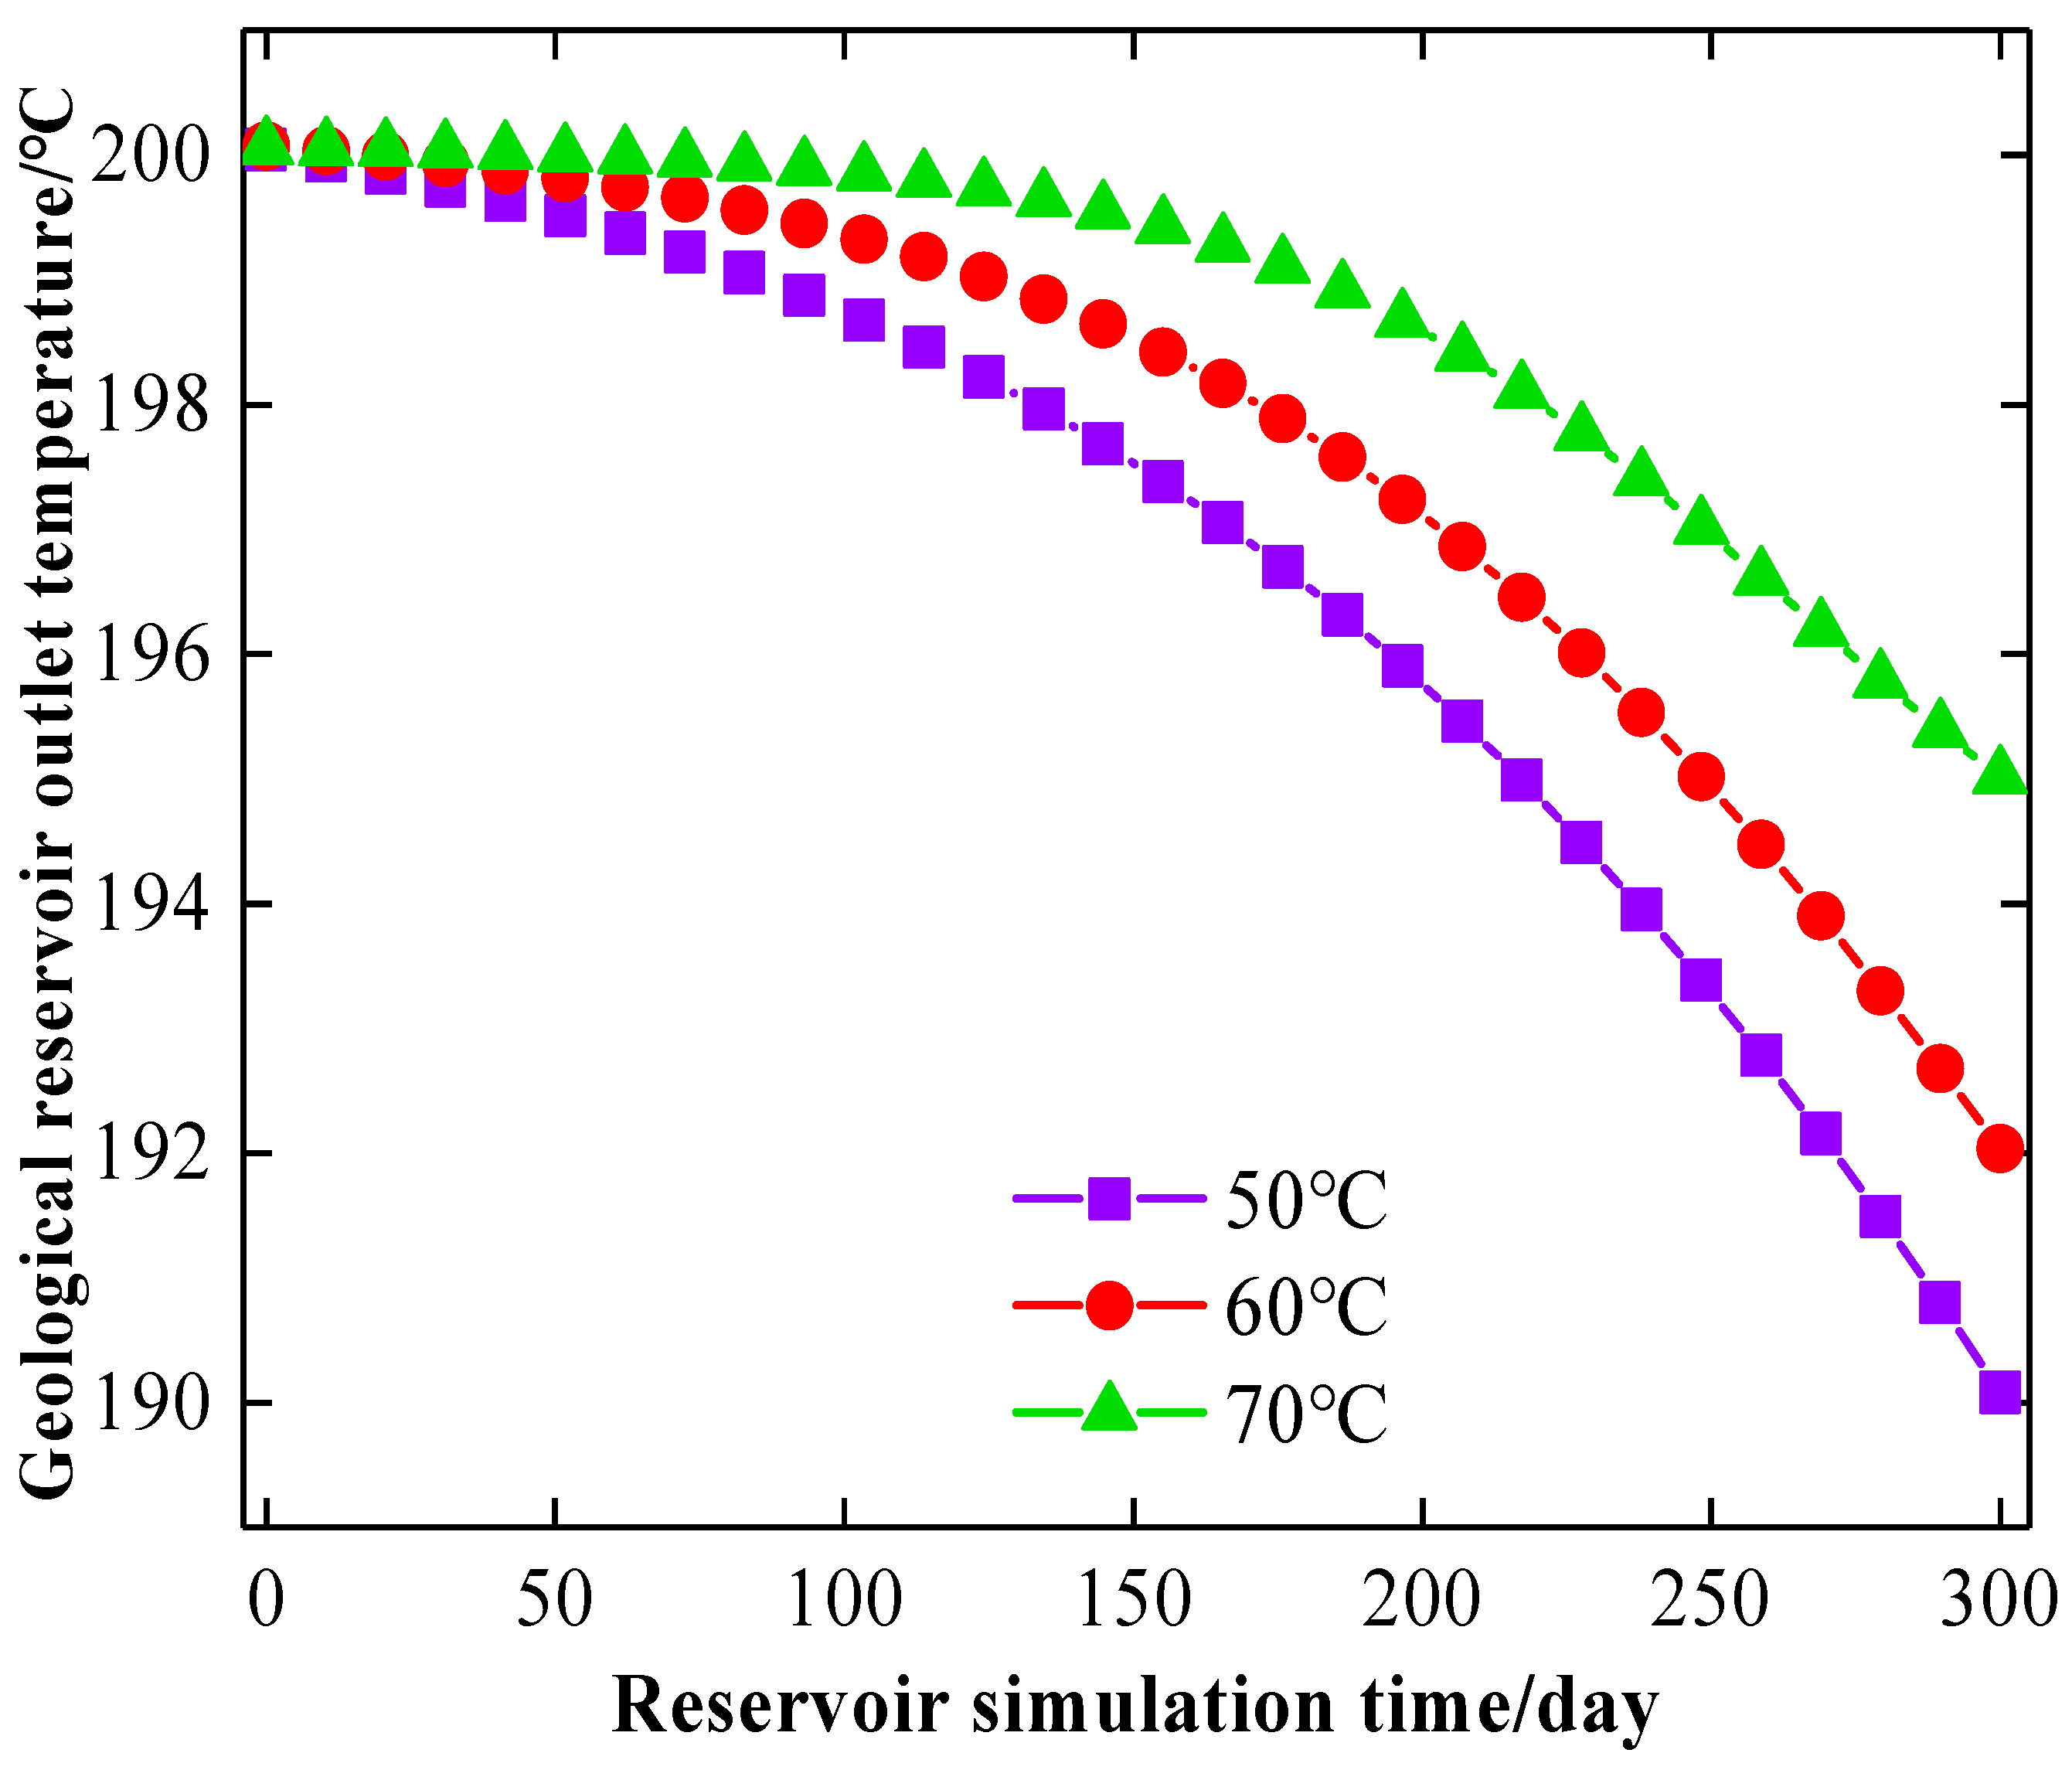
The geothermal temperature evolution of driving fluids under different injection temperatures exhibits a consistent pattern, characterized by a stable geothermal output during the early extraction stage and a pronounced “tongue-like” thermal front propagating along the preferential high-permeability flow path in the later stage. Nevertheless, the initial injection temperature directly governs the geothermal extraction rate and constitutes a key controlling parameter in the extraction process. Figure 7 illustrates the temporal variations in the production well outlet temperature under different injection temperatures. During the stable production stage, the outlet temperature remains almost unaffected by variations in injection temperature. Conversely, during the subsequent extraction stage, the emergence of a “tongue-like” thermal front leads to an augmentation in the outlet temperature with an escalation in the injection temperature. This phenomenon is inherently disadvantageous for the efficient extraction of geothermal energy. In the same driving time, a lower injection temperature is associated with a lower outlet temperature, while a higher injection temperature leads to a relatively higher outlet temperature at the production well (Figure 7). However, the extraction effectiveness is determined by the total energy recovered, which is a function of the temperature difference between the injector and producer. The results indicate that low-temperature fluids are more effective because they maintain a larger thermal gradient with the reservoir rock, thereby facilitating a higher rate of heat transfer despite the lower absolute output temperature.
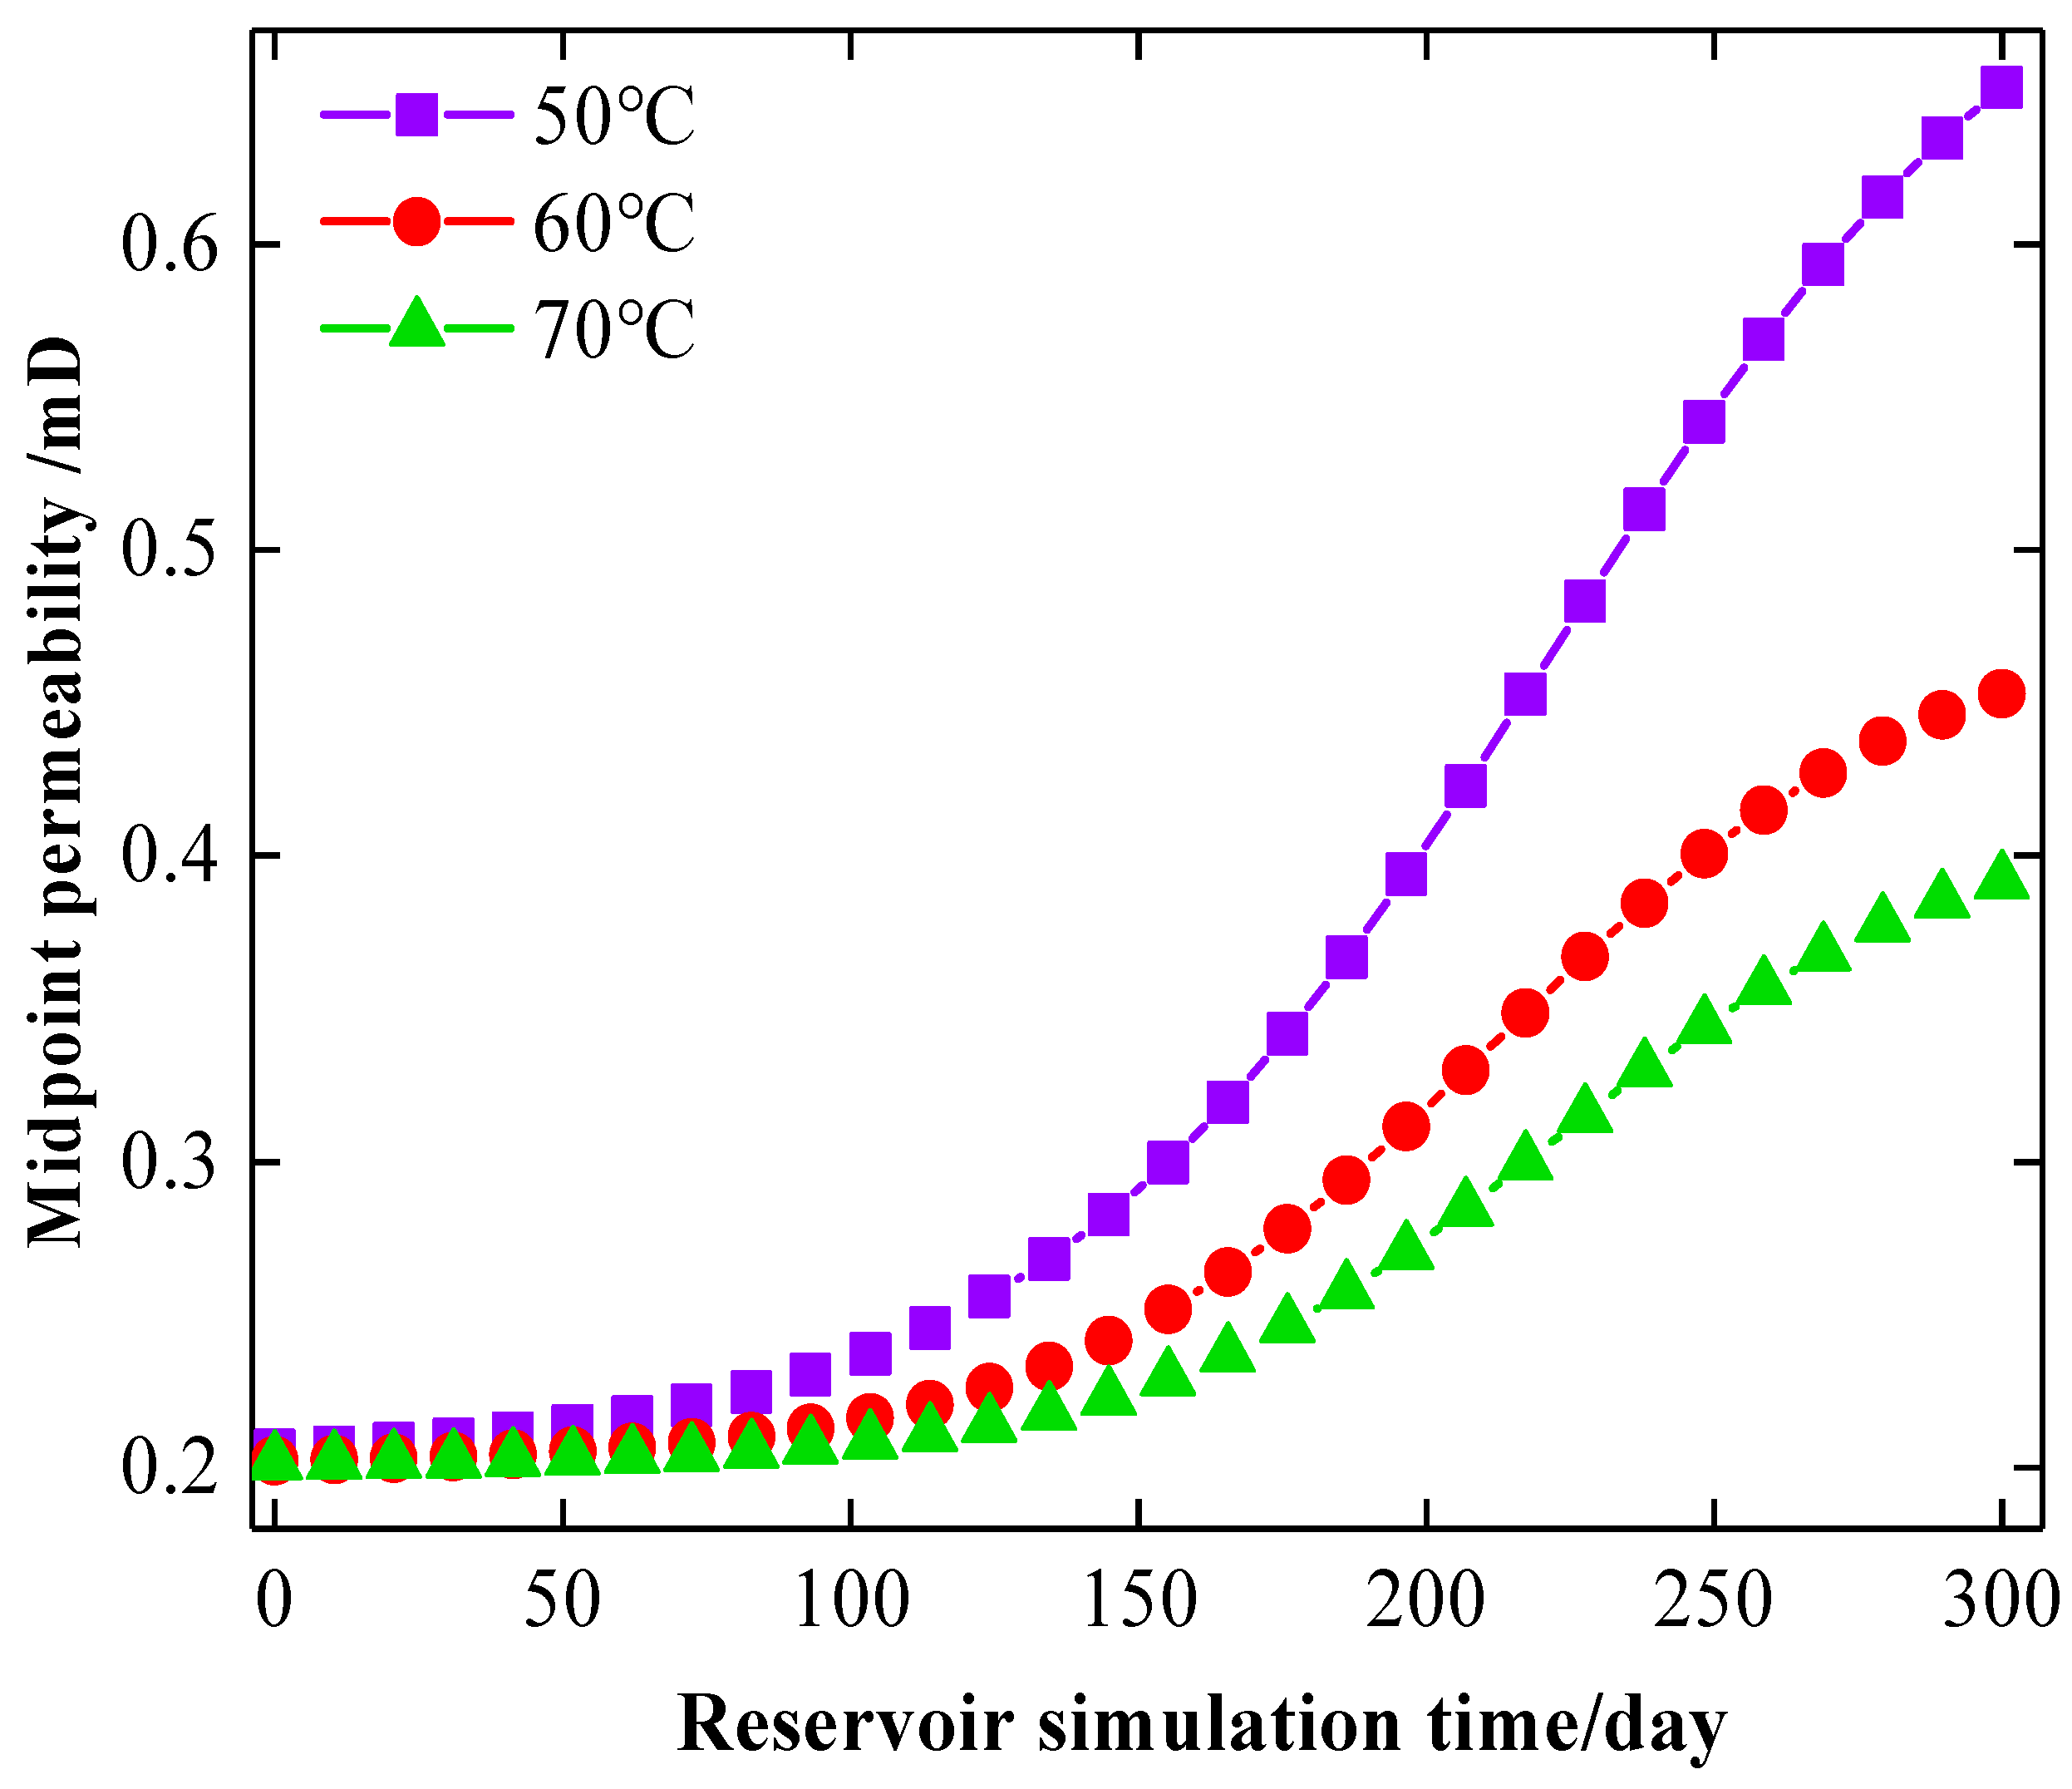
Another important factor contributing to the differences in production well outlet temperature under varying initial injection temperatures is the temperature-dependent evolution of reservoir rock permeability, as illustrated in Figure 8. As shown in Figure 8, a clear inverse relationship exists between the initial temperature of the driving fluid and reservoir permeability, whereby higher injection temperatures correspond to lower permeability values. This behaviour is primarily attributed to thermoelastic expansion and contraction of the reservoir rock, an effect that is most pronounced in the vicinity of the injection well [29]. Driving fluids with lower initial temperatures absorb substantial geothermal energy from the surrounding fracture network, inducing significant cooling and consequent contraction of the geothermal rock. As the initial temperature of the driving fluid decreases, the magnitude of rock contraction intensifies, leading to an effective widening of fracture apertures and an increase in reservoir permeability. This permeability enhancement facilitates more rapid fluid migration toward the production well and promotes efficient geothermal energy flowback [30]. In contrast, driving fluids with higher initial temperatures extract less thermal energy from the reservoir, resulting in limited rock cooling and minimal volumetric shrinkage. Consequently, fracture aperture expansion remains restricted, permeability enhancement is suppressed, and fluid transport toward the production well is significantly impeded [31]. Therefore, the stronger contraction induced by low-temperature driving fluids enables a larger volume of fluid to be transported efficiently from the injection well to the production well along the preferential high-permeability flow path, whereas the reduced rock contraction associated with high-temperature driving fluids leads to lower flow velocities and diminished geothermal extraction efficiency [32].

3.3. Injection Speed of the Driving Fluid

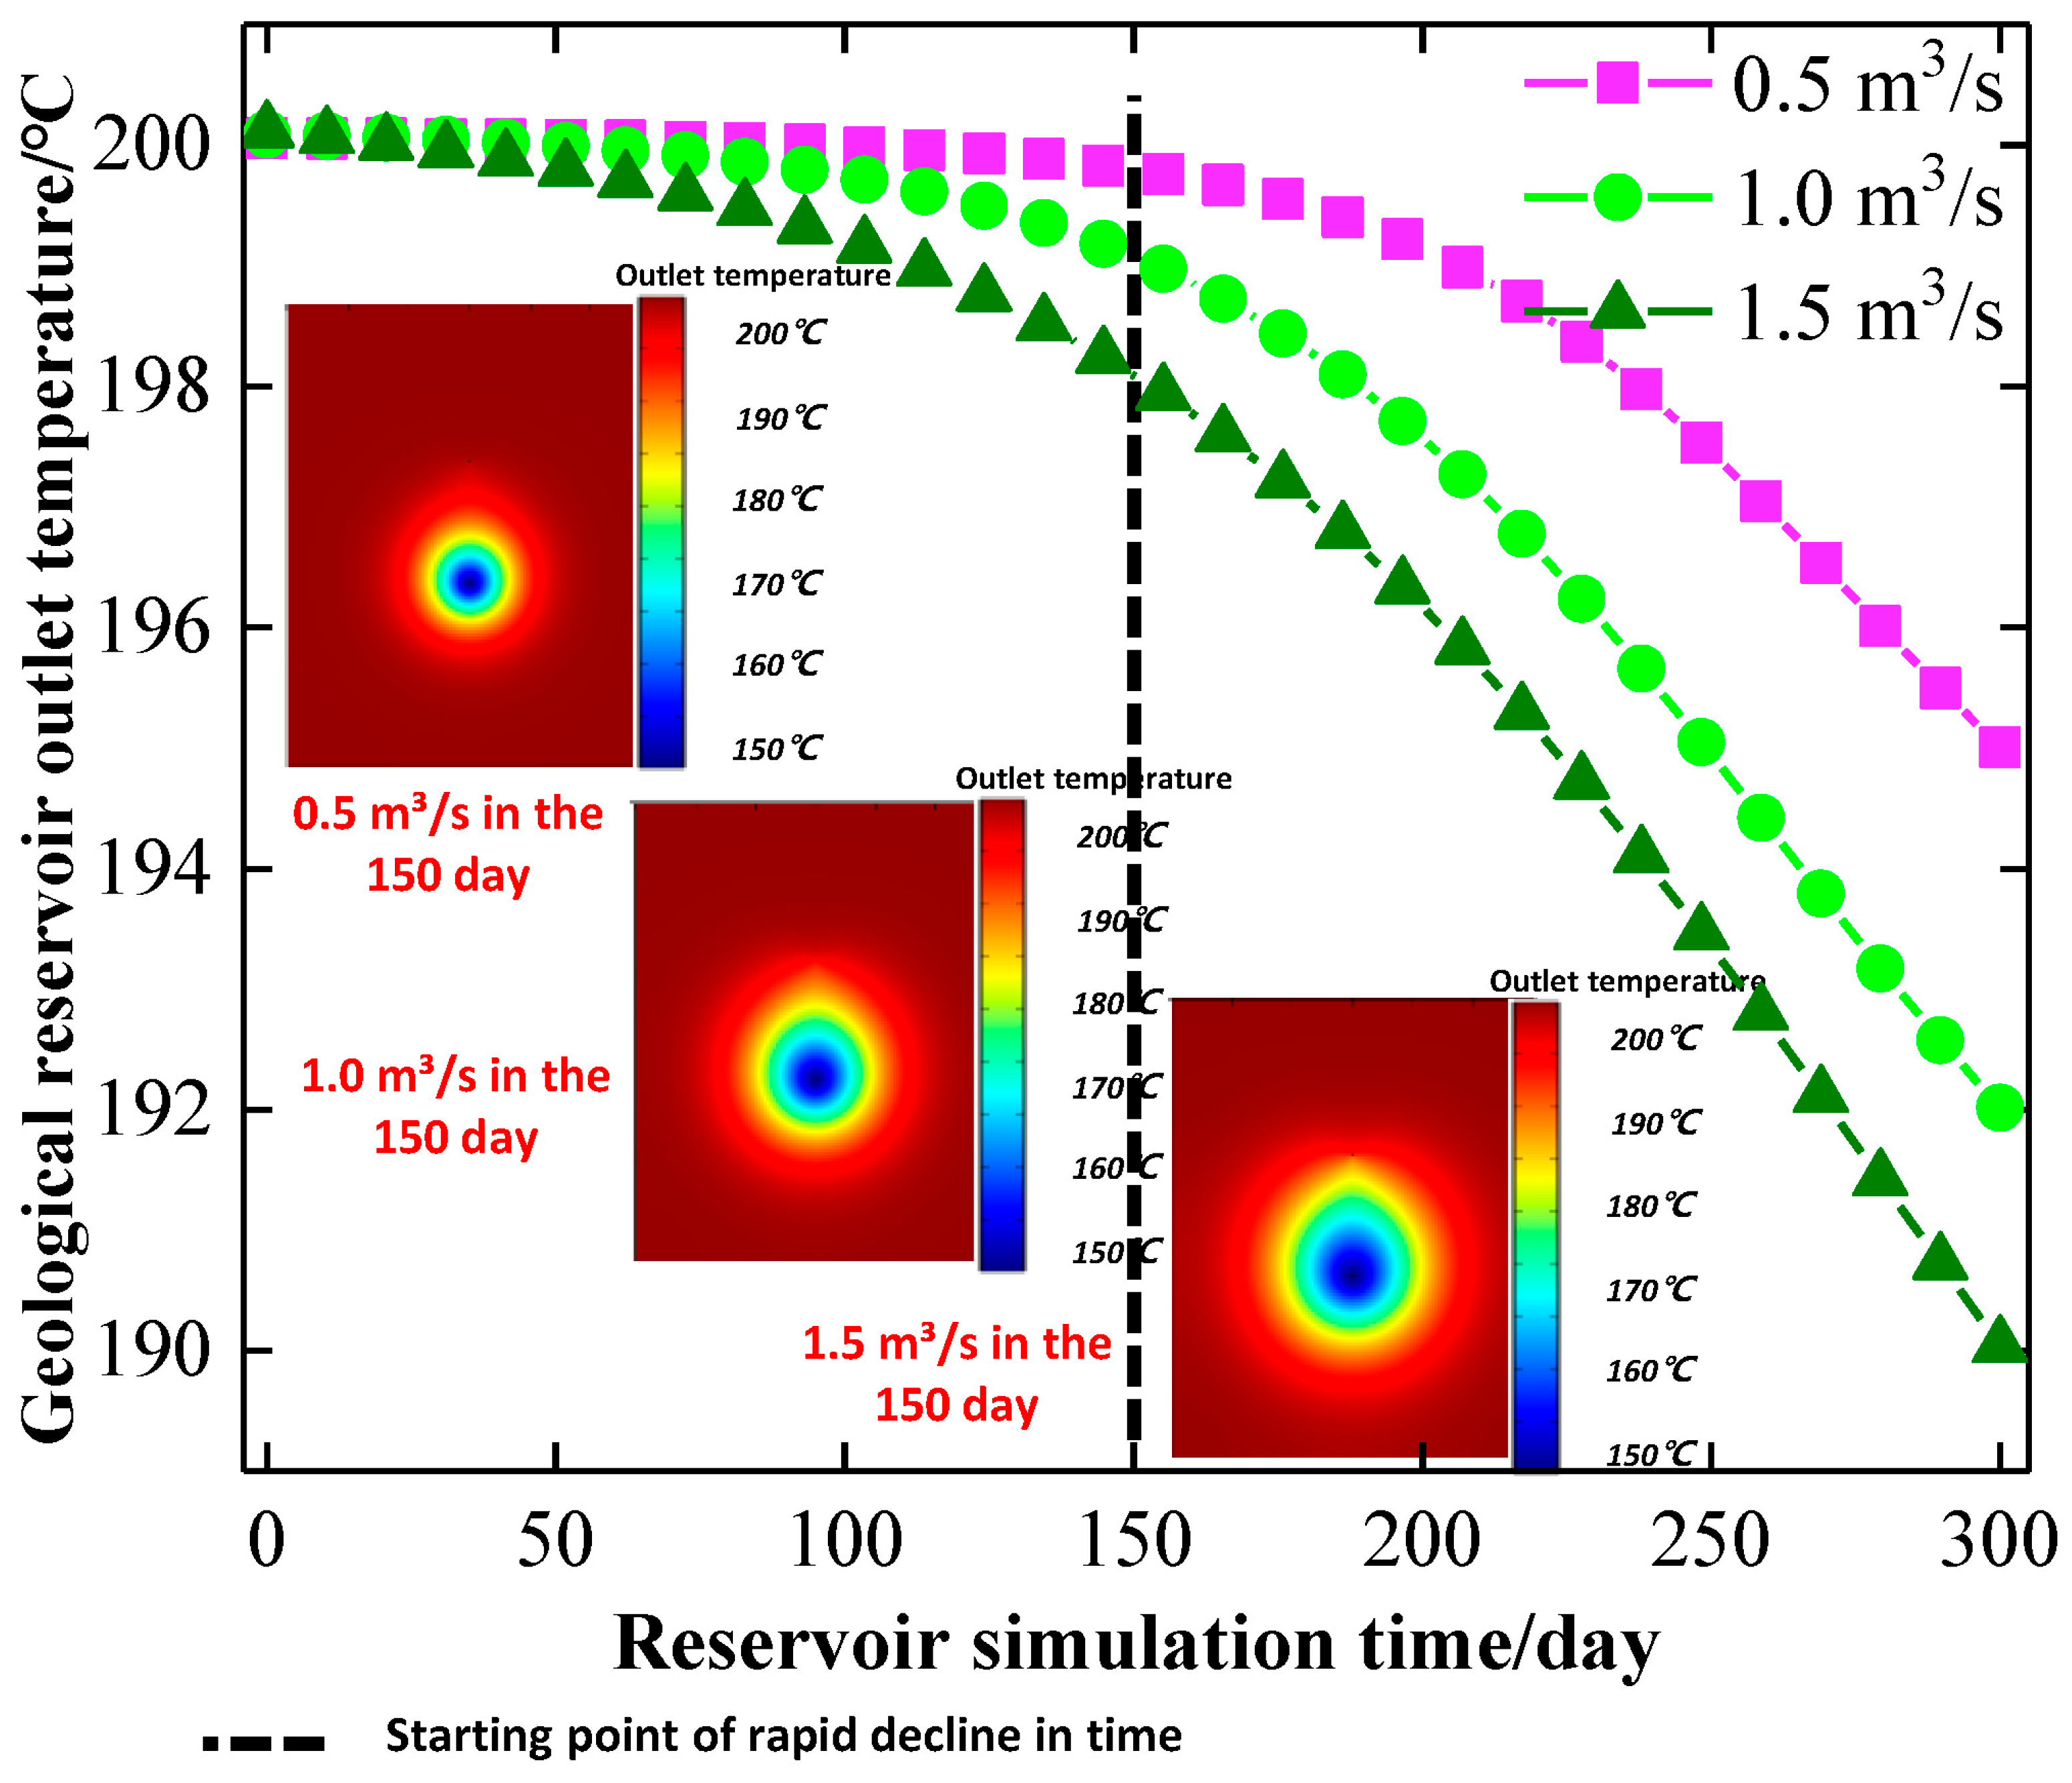
In addition to injection temperature and apparent viscosity, which significantly influence geothermal extraction efficiency and reservoir porosity, the injection rate of the driving fluid represents another critical parameter governing outlet temperature evolution and overall extraction performance. Figure 9 illustrates the temporal variations in outlet temperature under different injection rates, revealing a clear inverse relationship between injection rate and outlet temperature after approximately 100 days of operation. At lower injection rates, the decline in outlet temperature occurs more gradually, whereas higher injection rates induce a markedly accelerated temperature reduction. Moreover, variations in injection rate shift the onset of the temperature drop below 200 °C, with higher injection rates causing this transition to occur substantially earlier. Specifically, an injection rate of 0.5 m3/s requires approximately 150 days for the outlet temperature to gradually decrease below 200 °C, whereas an injection rate of 1 m3/s results in a rapid temperature reduction to below 200 °C within about 80 days. An injection rate of 1 m3/s induces the earlier development of a low-temperature zone along the preferential high-permeability flow path between the injection and production wells compared with an injection rate of 0.5 m3/s. This behaviour represents a macroscopic manifestation of accelerated pressure accumulation under higher injection rates, which promotes more rapid fracture initiation and propagation. Higher injection rates accelerate the development of the low-temperature zone along the preferential flow path, leading to a more rapid drop in the production well outlet temperature. While this enhances short-term heat extraction rates (Figure 9), it reduces long-term extraction efficiency due to earlier thermal breakthrough.
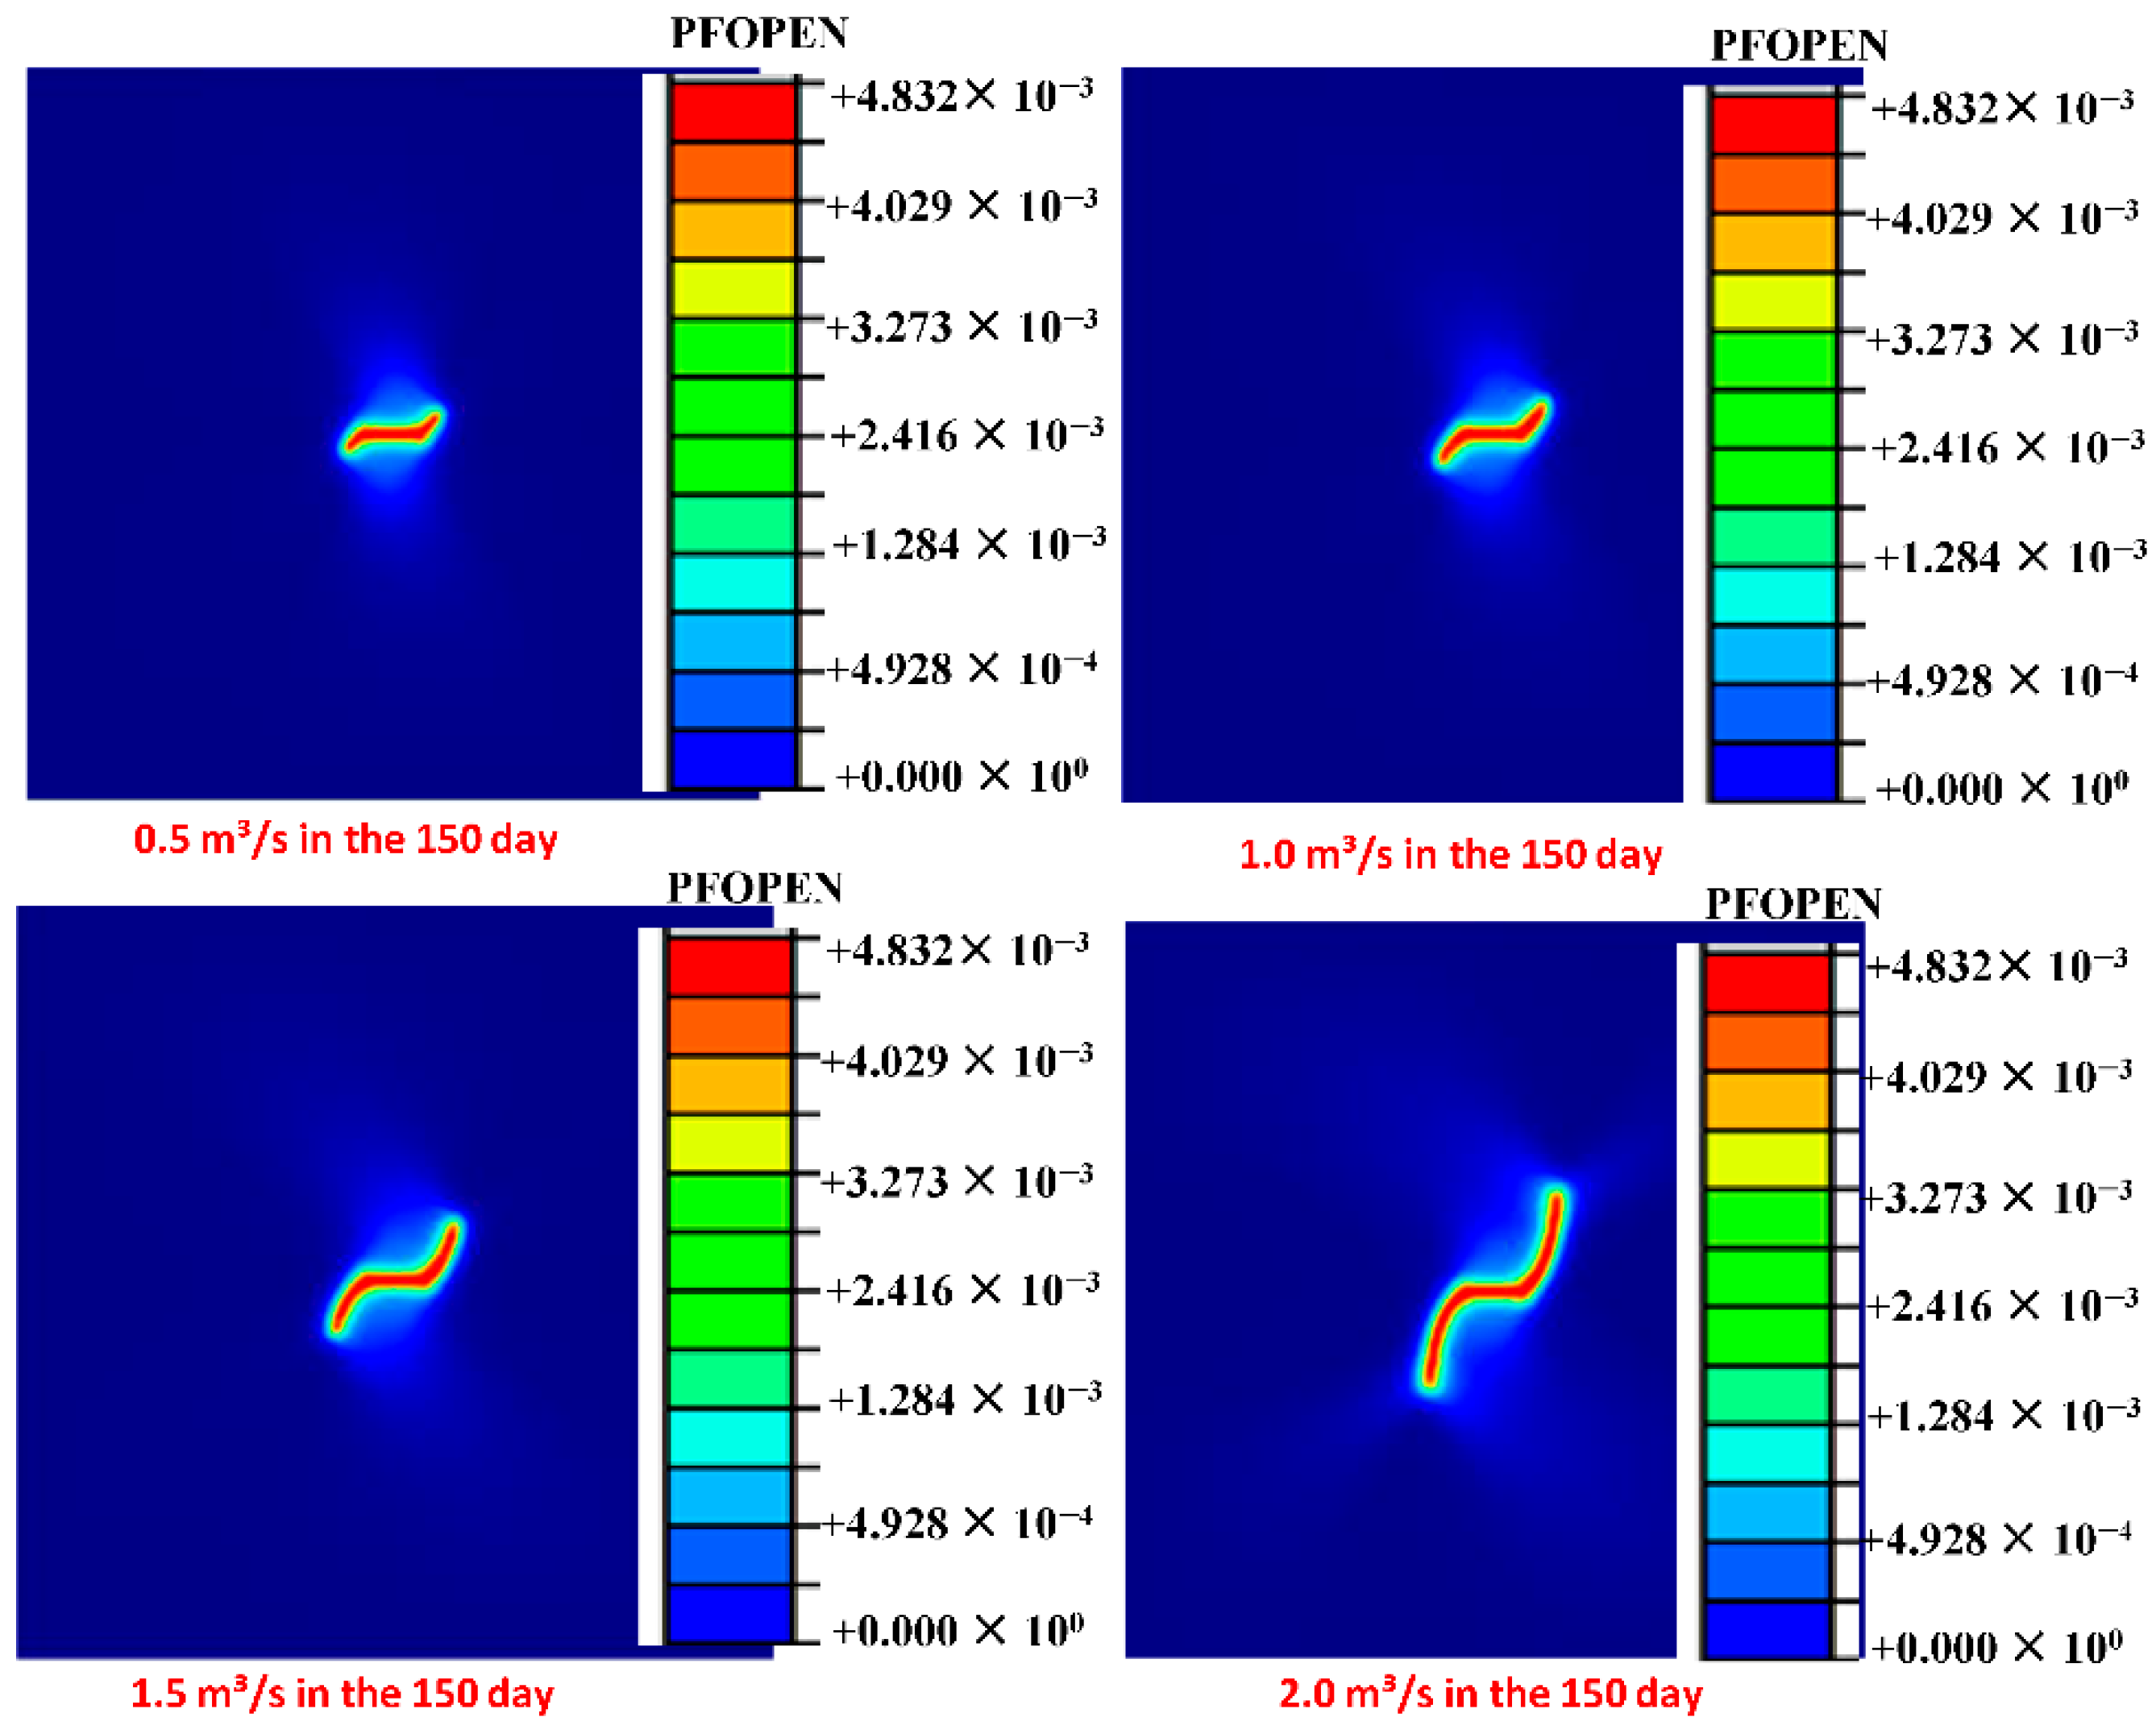
The variation in outlet temperature induced by different injection rates is primarily associated with differences in fracture propagation behaviour [33], which are closely related to fracture initiation and abrupt stress redistribution within the geothermal reservoir. Fracture propagation is predominantly triggered when the internal pressure of the injected driving fluid reaches the critical fracture initiation pressure of the reservoir rock, a condition directly controlled by the injection rate. A higher injection rate more rapidly elevates fracture internal pressure to the minimum threshold required for fracture initiation and subsequent propagation [34,35]. As shown in Figure 10, higher injection rates lead to more extensive fracture propagation from the injection well toward the production well. The fractures exhibit a characteristic S-shaped or slightly curved geometry, primarily controlled by the anisotropic in situ stress field (vertical stress 65 MPa, horizontal stress 60 MPa). This S-shape results from the fracture propagating preferentially along the direction of the maximum principal stress while being deflected by stress shadowing and local heterogeneity. The colour bar represents pore fluid pressure (MPa), with higher pressure near the injection well driving fracture initiation and growth. Under an injection rate of 1.5 m3/s, the fracture network becomes more interconnected, significantly enhancing fluid transport and geothermal extraction efficiency.
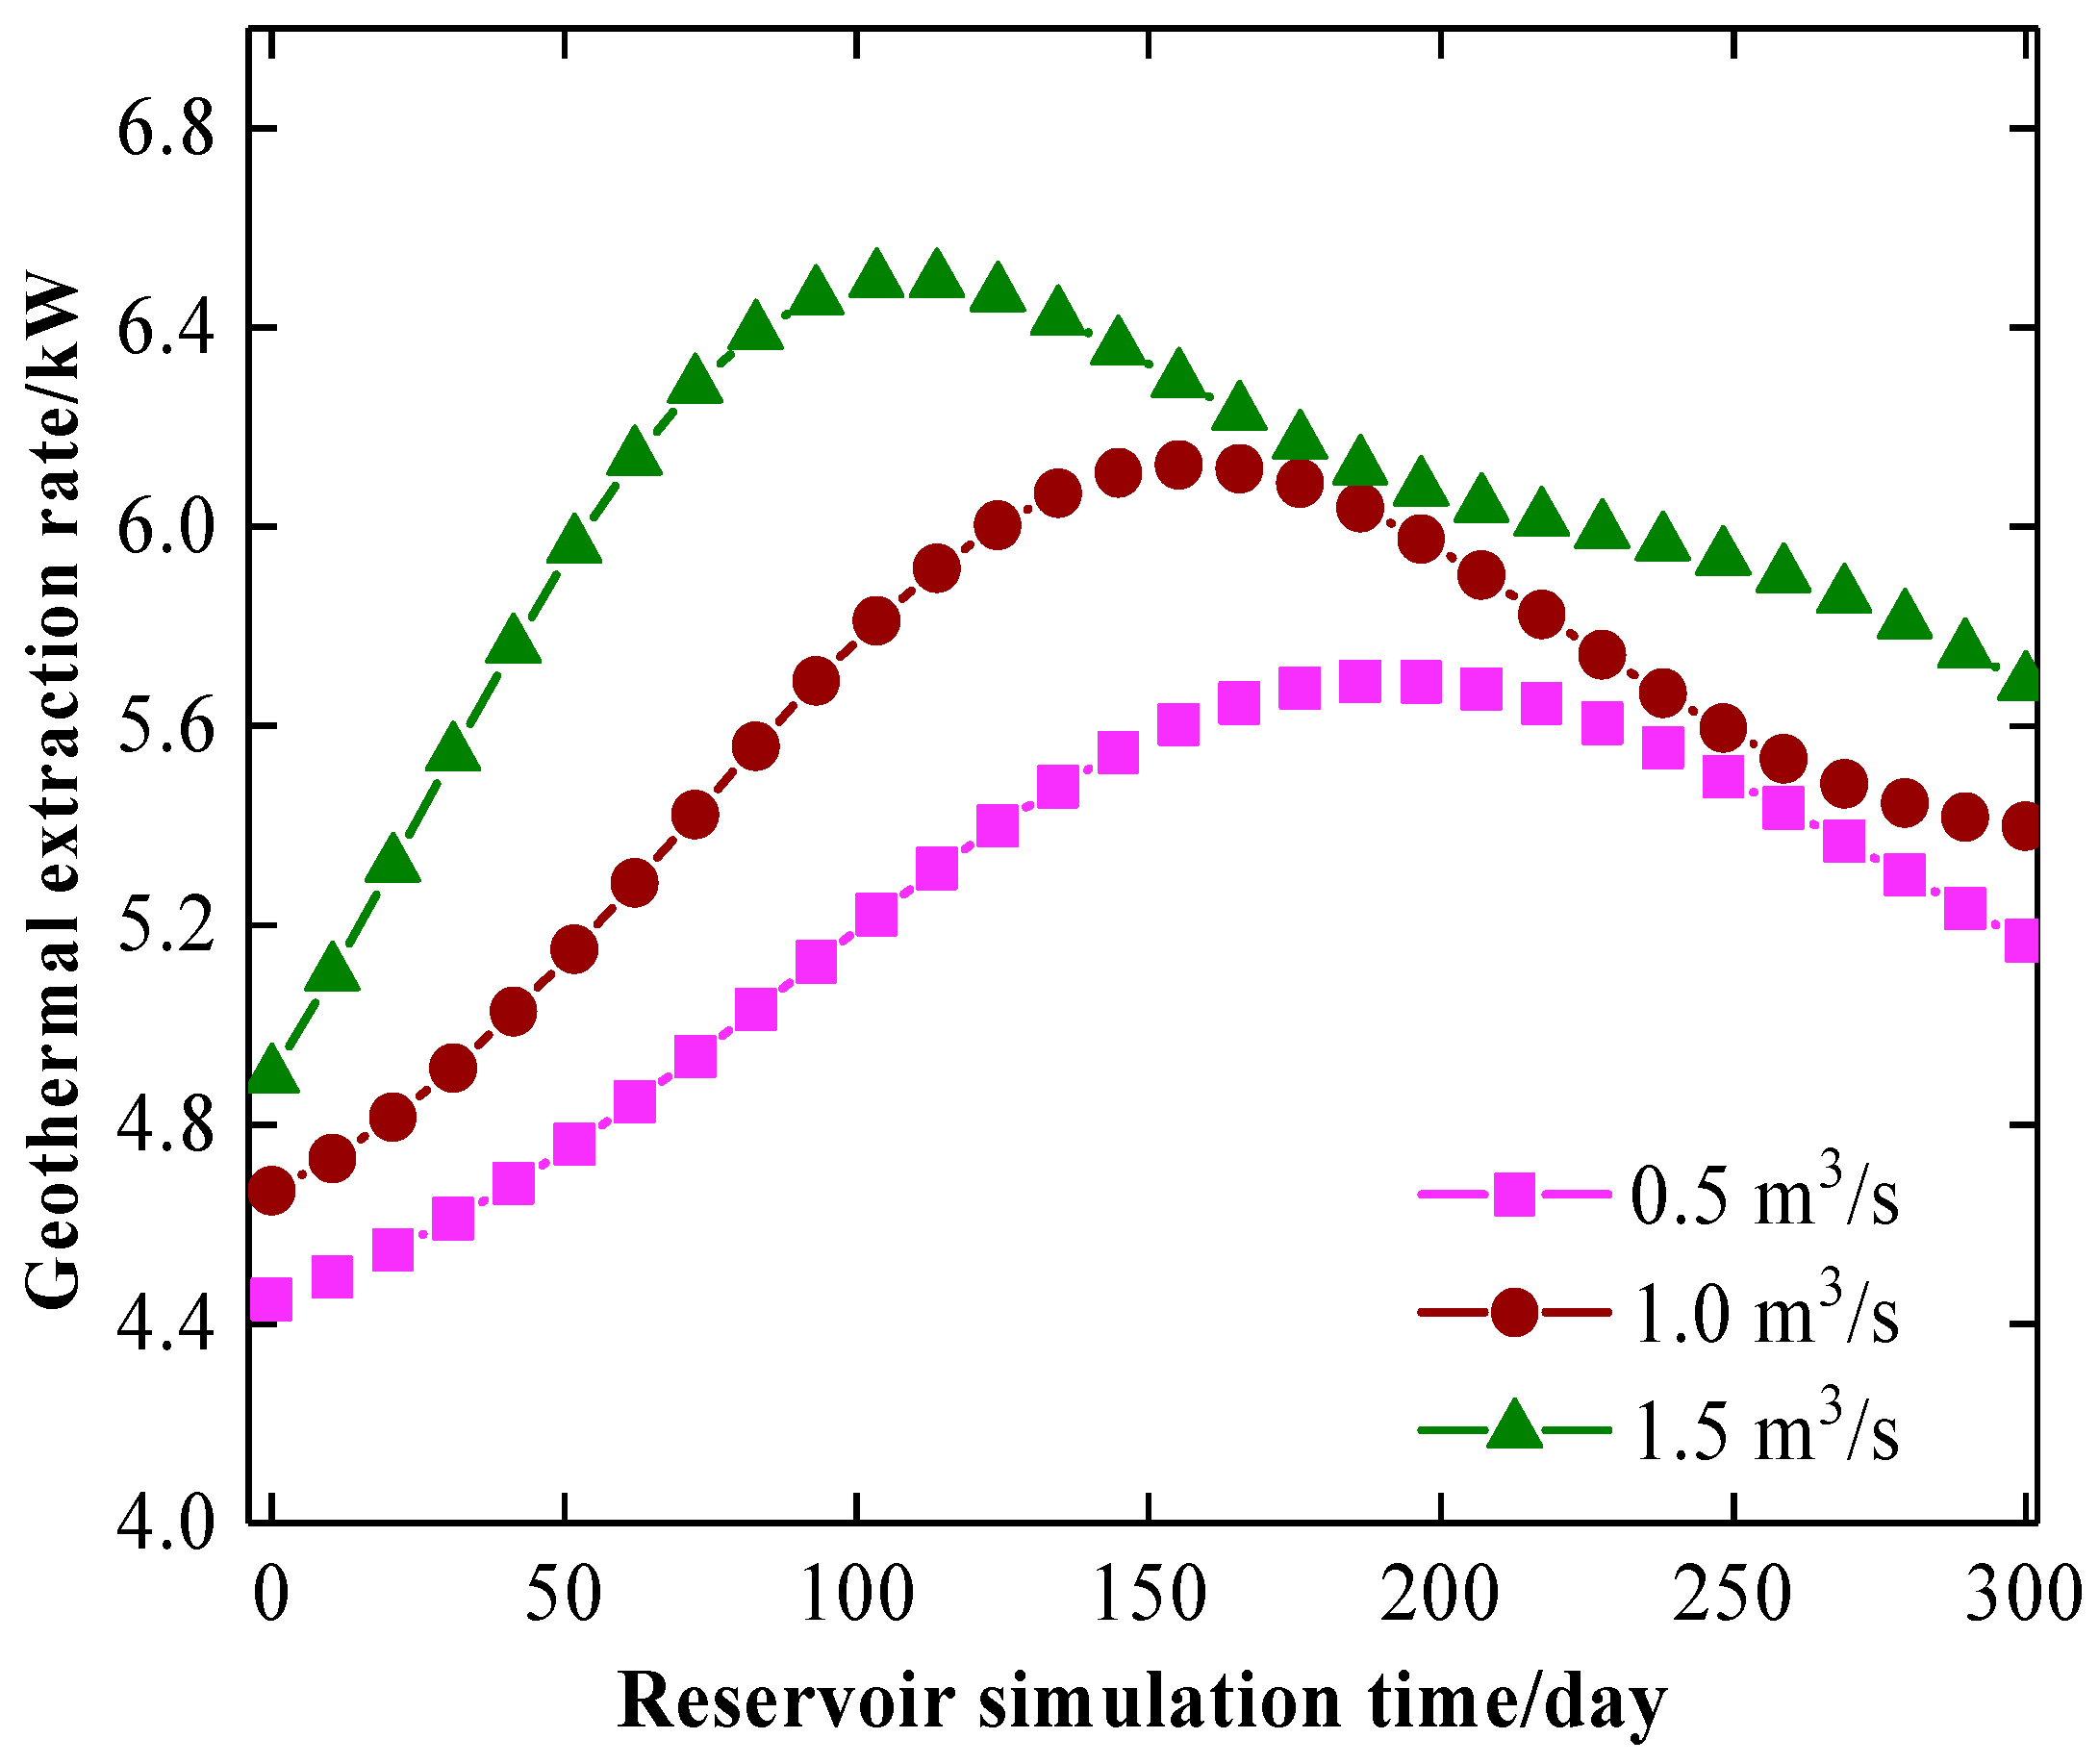
Figure 11 illustrates the influence of injection rate on the geothermal energy extraction rate, thereby directly reflecting its impact on overall extraction efficiency. As shown in Figure 11, a clear positive correlation exists between injection rate and geothermal extraction rate, with higher injection rates yielding significantly enhanced energy recovery performance. Specifically, an injection rate of 0.5 m3/s increases the geothermal extraction rate to a maximum value of approximately 5.8 kW, whereas an injection rate of 1.5 m3/s elevates the extraction rate to about 6.5 kW. This relationship between injection rate and geothermal extraction rate is primarily governed by injection-induced variations in reservoir pressure, which directly influence fracture connectivity. Lower injection rates generate relatively low fracture pressures, resulting in limited fracture initiation and shorter propagation lengths. Restricted fracture growth reduces the likelihood of micro-fracture interconnection, thereby impeding fluid migration and prolonging the transport time of the driving fluid toward the production well [36,37]. In contrast, higher injection rates substantially increase reservoir pressure, promoting more extensive fracture propagation and enhanced interconnection among micro-fractures [38]. The improved fracture network connectivity reduces flow resistance and facilitates more efficient transport of the driving fluid, ultimately leading to higher geothermal extraction rates.

4. Conclusions

The thermo-mechanical–hydraulic (TMH) coupled model developed in this study provides an effective framework for simulating geothermal energy extraction from geothermal reservoirs. The general consistency between the simulation results obtained from the thermo-hydraulic–mechanical (THM) coupled numerical model and both previous numerical benchmarks and laboratory-scale experimental data validates the reliability of the proposed model. Although the present model, with more realistic boundary conditions, shows slightly larger deviation than a preliminary framework in some periods, it still captures the essential trends of temperature evolution and permeability variation with acceptable accuracy. The results indicate that intermolecular interactions and material adsorption constitute the primary microscopic mechanisms governing outlet temperature variations associated with fluid viscosity. Injection temperature influences geothermal extraction efficiency predominantly through thermoelastic rock contraction, which modifies reservoir permeability. In addition, injection rate primarily regulates fracture pressure, thereby promoting fracture initiation, propagation, and inter-fracture connectivity, ultimately facilitating fluid transport toward the production well. Higher flow velocities and shear rates further enhance the disruption of intermolecular interactions, reducing flow resistance and promoting fluid backflow. Overall, parameters that accelerate fluid migration from the injection well to the production well significantly enhance geothermal extraction performance, whereas intermolecular interactions serve as the key microscopic control mechanism underlying macroscopic transport behaviour. Nevertheless, the extraction performance of unconventional working fluids, such as CO2 and N2, was not investigated within the present modelling framework. The extension of this thermo-mechanical–hydraulic model to such fluids represents an important direction for future research.

Author Contributions

Conceptualization, F.W. and H.C.; Methodology, Y.Z.; Software, H.C.; Validation, Y.Z.; Formal analysis, C.T. and R.D.; Investigation, Y.Z.; Resources, F.W.; Writing—original draft, C.T.; Writing—review & editing, C.L. and Y.Y.; Visualization, C.L.; Supervision, C.L. and R.D.; Project administration, Y.Y.; Funding acquisition, Y.Y. All authors have read and agreed to the published version of the manuscript.

Funding

This work was financially supported by the “Tianchi Talents” Young Doctor Introduction Program Project (2024592109, 2023592120) and Campus Launch Project in China University of Petroleum Beijing at Karamay (KL01JB20260017).

Institutional Review Board Statement

Not applicable.

Informed Consent Statement

Not applicable.

Data Availability Statement

The data and supportive information are available within this article.

Conflicts of Interest

The authors declare no conflicts of interest, financial or otherwise.

References

  1. Xu, C.; Dowd, P.A.; Tian, Z.F. A simplified coupled hydro-thermal model for enhanced geothermal systems. Appl. Energy 2015, 140, 135–145. [Google Scholar] [CrossRef]
  2. Guo, T.; Zhang, S.; Ge, H.; Wang, X.; Lei, X.; Xiao, B. A new method for evaluation of fracture network formation capacity of rock. Fuel 2015, 140, 778–787. [Google Scholar] [CrossRef]
  3. Chamorro, C.R.; García-Cuesta, J.L.; Mondéjar, M.E.; Pérez-Madrazo, A. Enhanced geothermal systems in Europe: An estimation and comparison of the technical and sustainable potentials. Energy 2014, 65, 250–263. [Google Scholar] [CrossRef]
  4. Yang, Y.; Huang, F.; Kang, S. Mechanism of Penetration Rate Improvement in Hot Dry Rock Under the Coupling of Impact Load and Confining Pressure Release. Reserv. Sci. 2026, 2, 52–64. [Google Scholar] [CrossRef]
  5. Pandey, S.N.; Chaudhuri, A.; Kelkar, S. A coupled thermo-hydro-mechanical modeling of fracture aperture alteration and reservoir deformation during heat extraction from a geothermal reservoir. Geothermics 2017, 65, 17–31. [Google Scholar] [CrossRef]
  6. Najari, M.; Selvadurai, A.P.S. Thermo-hydro-mechanical response of granite to temperature changes. Environ. Earth Sci. 2014, 72, 189–198. [Google Scholar] [CrossRef]
  7. Tahir, M.U.; Guo, S. Preliminary Investigation of Fracture Behavior during Carbon Dioxide Fracturing of Natural Hydrogen Reservoir with Hard-Core Imperfections. Reserv. Sci. 2026, 2, 34–51. [Google Scholar] [CrossRef]
  8. Liu, X.; Liu, Q.; Liu, B.; Kang, Y.; He, J. Numerical manifold method for thermal–hydraulic coupling in fractured enhance geothermal system. Eng. Anal. Bound. Elem. 2019, 101, 67–75. [Google Scholar] [CrossRef]
  9. Bujakowski, W.; Barbacki, A.; Miecznik, M.; Pająk, L.; Skrzypczak, R.; Sowiżdżał, A. Modelling geothermal and operating parameters of EGS installations in the lower triassic sedimentary formations of the central Poland area. Renew. Energy 2015, 80, 441–453. [Google Scholar] [CrossRef]
  10. Qu, Z.Q.; Zhang, W.; Guo, T.K. Influence of different fracture morphology on heat mining performance of enhanced geothermal systems based on COMSOL. Int. J. Hydrogen Energy 2017, 42, 18263–18278. [Google Scholar] [CrossRef]
  11. Li, W.; Liao, J. Microscopic Analysis of Flow Resistance of Oil Displacement Fluid in Reservoir Fractures. Reserv. Sci. 2026, 2, 16–33. [Google Scholar] [CrossRef]
  12. Sun, Z.X.; Zhang, X.; Xu, Y.; Yao, J.; Wang, H.X.; Lv, S.; Sun, Z.L.; Huang, Y.; Cai, M.Y.; Huang, X. Numerical simulation of the heat extraction in EGS with thermal-hydraulic-mechanical coupling method based on discrete fractures model. Energy 2017, 120, 20–33. [Google Scholar] [CrossRef]
  13. Chen, B.G.; Song, E.X.; Cheng, X.H. A numerical method for discrete fracture network model for flow and heat transfer in two-dimensional fractured rocks. Chin. J. Rock Mech. Eng. 2014, 33, 43–51. [Google Scholar]
  14. Hofmann, H.; Weides, S.; Babadagli, T.; Zimmermann, G.; Moeck, I.; Majorowicz, J.; Unsworth, M. Potential for enhanced geothermal systems in Alberta, Canada. Energy 2014, 69, 578–591. [Google Scholar] [CrossRef]
  15. Noorishad, J.; Tsang, C.F.; Witherspoon, P.A. Coupled thermal-hydraulic-mechanical phenomena in saturated fractured porous rocks: Numerical approach. J. Geophys. Res. Solid Earth 1984, 89, 10365–10373. [Google Scholar] [CrossRef]
  16. Rutqvist, J.; Wu, Y.S.; Tsang, C.F.; Bodvarsson, G. A modeling approach for analysis of coupled multiphase fluid flow, heat transfer, and deformation in fractured porous rock. Int. J. Rock Mech. Min. Sci. 2002, 39, 429–442. [Google Scholar] [CrossRef]
  17. Gutierrez, M.; Makurat, A. Coupled HTM modelling of cold water injection in fractured hydrocarbon reservoirs. Int. J. Rock Mech. Min. Sci. 1997, 34, 62.e1–62.e15. [Google Scholar] [CrossRef]
  18. Yu, S.; Zheng, Y.; Li, L. A comprehensive evaluation of the development and utilization of China’s regional renewable energy. Energy Policy 2019, 127, 73–86. [Google Scholar] [CrossRef]
  19. Xu, N.; Wang, Y. Effect of Nanomaterials on Improving the Apparent Viscosity of Heavy Oil and the Environmental Evaluation of Reservoir Environment. Reserv. Sci. 2026, 2, 1–15. [Google Scholar] [CrossRef]
  20. Hubbert, M.K. Darcy’s law and the field equations of the flow of underground fluids. Hydrol. Sci. J. 1957, 2, 23–59. [Google Scholar] [CrossRef]
  21. Tardy, E.; Morel, C. Two-phase flow equations in porous media for PEMFC (Proton Exchange Membrane Fuel Cells). Sci. Technol. Energy Transit. 2025, 80, 49. [Google Scholar] [CrossRef]
  22. Coussy, O. Poromechanics; John Wiley & Sons: Hoboken, NJ, USA, 2004. [Google Scholar]
  23. Permann, C.J.; Gaston, D.R.; Andrš, D.; Carlsen, R.W.; Kong, F.; Lindsay, A.D.; Miller, J.M.; Peterson, J.W.; Slaughter, A.E.; Stogner, R.H.; et al. MOOSE: Enabling massively parallel multiphysics simulation. SoftwareX 2020, 11, 100430. [Google Scholar] [CrossRef]
  24. Wei, C.; Zhu, W.; Chen, S.; Ranjith, P.G. A coupled thermal–hydrological–mechanical damage model and its numerical simulations of damage evolution in APSE. Materials 2016, 9, 841. [Google Scholar] [CrossRef]
  25. Hu, Y.; Yang, Y. A comparative study on drag reduction methods for continental shale drilling in the Fuxing Block, southeastern Sichuan Basin. Reserv. Sci. 2026, 2, 81–96. [Google Scholar] [CrossRef]
  26. Li, M.; Liu, J.; Xia, Y. Risk prediction of gas hydrate formation in the wellbore and subsea gathering system of deep-water turbidite reservoirs: Case analysis from the south China Sea. Reserv. Sci. 2025, 1, 52–72. [Google Scholar] [CrossRef]
  27. Gan, Q.; Elsworth, D. Production optimization in fractured geothermal reservoirs by coupled discrete fracture network modeling. Geothermics 2016, 62, 131–142. [Google Scholar] [CrossRef]
  28. Cao, L.; Lv, M.; Li, C.; Sun, Q.; Wu, M.; Xu, C.; Dou, J. Effects of crosslinking agents and reservoir conditions on the propagation of fractures in coal reservoirs during hydraulic fracturing. Reserv. Sci. 2025, 1, 36–51. [Google Scholar] [CrossRef]
  29. Anya, B.; Mohammadpourfard, M.; Akkurt, G.G.; Mohammadi-Ivatloo, B. Exploring geothermal energy based systems: Review from basics to smart systems. Renew. Sustain. Energy Rev. 2025, 210, 115185. [Google Scholar] [CrossRef]
  30. Khan, M.; Nawaz, S.; Gao, X.; Khan, N.M. Reservoir Characterization of Eocene Carbonates and Cambrian Sands in the Eastern Potwar Region, Pakistan. Reserv. Sci. 2026, 2, 111–125. [Google Scholar] [CrossRef]
  31. Shah, M.; Prajapati, M.; Yadav, K.; Sircar, A. A comprehensive review of geothermal energy storage: Methods and applications. J. Energy Storage 2024, 98, 113019. [Google Scholar] [CrossRef]
  32. Korucan, A.; Derin-Gure, P.; Celebi, B.; Baker, D.; Vander Velde, M. Opportunities and challenges of geothermal energy in Turkiye. Energy Sustain. Dev. 2024, 79, 101417. [Google Scholar] [CrossRef]
  33. Wu, J.; Ansari, U. From CO2 Sequestration to Hydrogen Storage: Further Utilization of Depleted Gas Reservoirs. Reserv. Sci. 2025, 1, 19–35. [Google Scholar] [CrossRef]
  34. Magdy, A.; Ogunleye, O.; Mroueh, H.; Di Donna, A.; Singh, R.M. A review of exploiting shallow geothermal energy through tunnels: Current status and future prospects. Renew. Energy 2025, 238, 121958. [Google Scholar] [CrossRef]
  35. Cheng, W.L.; Li, T.T.; Nian, Y.L.; Han, B.B. Effects of injection temperature and flow rate on geothermal energy extraction from hot dry rock. Appl. Energy 2016, 164, 467–475. [Google Scholar]
  36. Li, Q.; Li, Q.; Wang, F.; Wu, J.; Wang, Y.; Jin, J. Effects of geological and fluid characteristics on the injection filtration of hydraulic fracturing fluid in the wellbores of shale reservoirs: Numerical analysis and mechanism determination. Processes 2025, 13, 1747. [Google Scholar] [CrossRef]
  37. Li, Q.; Li, Q.; Wu, J.; He, K.; Xia, Y.; Liu, J.; Wang, F.; Cheng, Y. Wellhead Stability During Development Process of Hydrate Reservoir in the Northern South China Sea: Sensitivity Analysis. Processes 2025, 13, 1630. [Google Scholar] [CrossRef]
  38. Tian, L.; Zhang, Q.; Li, X.; Li, C. Fracturing effectiveness evaluation based on flowback data using pressure transient testing. Reserv. Sci. 2026, 2, 97–110. [Google Scholar] [CrossRef]
Figure 1. Coupling relationships in geothermal reservoirs.
Eng 07 00212 g001
Figure 2. Numerical model construction and boundary conditions.
Eng 07 00212 g002
Figure 3. Validation of numerical models and data comparison. Validation was performed under the same injection conditions as the benchmark cases (injection temperature = 50 °C, flow rate = 0.5 m3/s).
Eng 07 00212 g003
Figure 4. Influence and mechanism of different fluid viscosities on outlet temperature.
Eng 07 00212 g004
Figure 5. Influence of apparent viscosity of driving fluid on reservoir permeability.
Eng 07 00212 g005
Figure 6. Temperature distribution of geothermal reservoirs at different injection temperatures. (Validation was performed under the same injection conditions as the flow rate = 0.5 m3/s).
Eng 07 00212 g006
Figure 7. Outlet temperature variation under different injection temperatures. (Validation was performed under the same injection conditions as the flow rate = 0.5 m3/s).
Eng 07 00212 g007
Figure 8. The permeability at the midpoint between the two wells changes with the initial temperature.
Eng 07 00212 g008
Figure 9. Outlet temperature variation at different injection rates.
Eng 07 00212 g009
Figure 10. Fracture propagation patterns (white lines) and pore fluid pressure distributions (colour contour) under different injection rates. The S-shaped fracture geometry is induced by anisotropic in-situ stresses. (Colour bar: fluid pressure).
Eng 07 00212 g010
Figure 11. Geothermal extraction rate variation with injection rate.
Eng 07 00212 g011
Disclaimer/Publisher’s Note: The statements, opinions and data contained in all publications are solely those of the individual author(s) and contributor(s) and not of MDPI and/or the editor(s). MDPI and/or the editor(s) disclaim responsibility for any injury to people or property resulting from any ideas, methods, instructions or products referred to in the content.