Article

Numerical Investigation of Thermodynamic Performance in Gradient-Pitch Twisted Square Ducts with Variable Aspect Ratio

1
School of Engineering and Industrial Technology, Mahanakorn University of Technology, Bangkok 10530, Thailand
2
Engineering Innovation Unit, Graduate School of Regional Innovation Studies, Mie University, Tsu 514-8507, Mie, Japan
3
Department of Mechanical Engineering, Faculty of Engineering, Mie University, Tsu 514-8507, Mie, Japan
4
Department of Mechanical Engineering, Faculty of Engineering, Aichi Institute of Technology, Toyota 470-0392, Aichi, Japan
5
Department of Mechanical Engineering, Faculty of Engineering, Srinakharinwirot University, Nakhonnayok 26120, Thailand
6
School of Engineering, King Mongkut’s Institute of Technology Ladkrabang, Bangkok 10520, Thailand
7
Department of Mechanical and Manufacturing Engineering, Faculty of Science and Engineering, Kasetsart University, Chalermphrakiat Sakonnakhon Province Campus, Sakonnakhon 47000, Thailand
*
Author to whom correspondence should be addressed.
Eng 2026, 7(4), 166; https://doi.org/10.3390/eng7040166
Submission received: 20 February 2026 / Revised: 22 March 2026 / Accepted: 27 March 2026 / Published: 3 April 2026

Abstract

This study numerically investigates heat transfer and thermodynamic behavior in twisted square and rectangular air ducts while keeping a constant hydraulic diameter (Dh = 30 mm). Three aspect ratios are considered (AR = 1.00, 0.75, and 0.50). The heated test section (900 mm) is divided into three equal segments, and three pitch patterns are examined: a uniform pitch (400–400–400 mm, P444) and two axial gradients (300–400–500 mm, P345; 500–400–300 mm, P543). All results are compared to a standard reference, the straight square duct (SD-AR1.00), to ensure fair comparisons across all cases with Reynolds numbers between 5000 and 20,000. Among the twisted ducts, the strongest rectangularity combined with the increasing pitch sequence, TSD-AR0.50-P345, provides the best overall balance. Its heat transfer rises from Nu = 39.39 to 88.62, giving Nu/Nu0 = 1.493 → 1.433, while the pressure penalty increases to f/f0 = 1.345 → 1.405. Under cube-root weighting of friction, this case maintains the highest thermal performance factor, TPF = 1.352 at Re = 5000 and TPF = 1.279 at Re = 20,000. Second-law trends support the same ranking: exergy destruction decreases from 12.81 W (baseline) to 8.44 W at Re = 5000 (≈34% reduction) and from 6.54 W to 4.84 W at Re = 20,000 (≈26% reduction). The Bejan number remains high at low Reynolds numbers (≈0.998), indicating heat-transfer irreversibility dominance, but drops at higher Reynolds numbers (≈0.87) as frictional effects become more important. In general, the results show that adding a small axial pitch increase to rectangularity can improve near-wall mixing while reducing losses downstream. This leads to a clear improvement in both first-law performance and exergy-based measures.

1. Introduction

Heat transfer enhancement methods are commonly divided into two main groups. Passive techniques do not need any extra power input, while active techniques require external energy. The performance of both groups depends strongly on the heat transfer mode, such as natural or forced convection, single-phase flow, boiling, or condensation. A twisted duct is a passive device. It improves heat transfer by creating a swirling motion in the flow. In internal ducts, this swirl can be produced either by placing an insert such as a twisted tape inside a straight duct or by twisting the duct wall itself. When a twisted duct is used in a heat exchanger, it can intensify heat transfer not only inside the duct but also in the surrounding duct-to-duct region of a tube bundle. The swirl inside the passage increases the convective heat transfer coefficient to a level comparable to that obtained with twisted tapes or other turbulators. However, twisted tapes reduce the open flow area because they occupy space inside the tube and therefore tend to cause a larger pressure drop than twisted ducts for a similar degree of heat transfer enhancement. Passive methods rely on changing the surface or geometry of the flow passage, often by adding inserts or small devices. These measures increase the heat transfer coefficient by disturbing the original flow pattern, and they usually also increase the pressure drop. According to [1], common passive methods include (i) treated surfaces, where the wall is coated or modified at a fine scale, often for boiling and condensation, (ii) rough surfaces, where the near wall region is roughened to promote turbulence in single phase flows without increasing the overall area, (iii) extended surfaces, such as fins or perforated elements attached to the main surface, used in single phase flow, boiling, and condensation, (iv) coiled tubes, which generate secondary flows and vortices that enhance heat transfer in single phase and boiling flows, and (v) swirl flow devices, which superimpose swirl or secondary motion on the axial flow. This last group includes twisted tapes, twisted ducts, and screw-type inserts, and is of particular interest in the present study. Yang et al. [2] tested five twisted elliptical tubes in experiments using water. They varied the ellipse aspect ratio (major/minor diameter) from 1.49 to 2.15 and used twist ratios between 17.4 and 32.8, covering Reynolds numbers from 600 to 55,000. Their results suggested that the twisted-duct flow can stay laminar up to about Re ≈ 2300, and that the relative heat-transfer gain is more noticeable in the laminar range than in the transition and turbulent ranges. Chang et al. [3] performed a numerical study of laminar flow in a twisted elliptic tube using a finite-difference approach. They focused on large twist ratios (H = 21, 53, 106) and examined how twist ratio and ellipse aspect ratio affect the axial and circumferential velocity components, as well as the resulting streamline structures. Many other heat-transfer enhancement studies have focused on circular tubes with twisted-tape inserts rather than on twisted ducts. For example, Arasteh et al. [4] examined rotating and stationary twisted tapes, Mashoofi et al. [5] studied perforated twisted tapes, and Harish and Manjunath [6], Saysroy and Eiamsaard [7], Natarajan et al. [8], Nakhchi and Esfahani [9,10], Abed et al. [11], and Dandoutiya and Kumar [12] reported thermal-hydraulic improvements using several modified twisted-tape geometries. He et al. [13] and Paneliya et al. [14] further showed that advanced and variable-pitch twisted-tape inserts can provide stronger enhancement than conventional constant-pitch designs.
Some previous studies have examined straight square ducts equipped with twisted tape inserts to improve thermal performance. These works cover a wide range of insert designs, including dual and quadruple twisted tapes [15], twisted tapes with inclined ribs and slots [16], twisted tapes arranged in ascending and descending twist ratio orders [17], short length, full length, and regularly spaced twisted tapes [18], and twisted tapes with variable twist ratios [19]. Khoshvaght-Aliabadi et al. [20] investigated heat transfer and pressure-drop behavior in a new curved geometry called a spirally coiled twisted duct, using both experiments and numerical simulations. They used water and Cu/water nanofluid at 0.5% and 1.0% (mass fraction) and varied the geometry with twist-pitch (tp = 0.05, 0.1, 0.15 m) and coil-pitch (cp = 0.015, 0.025, 0.035 m). The largest increases in Nusselt number and friction factor occurred at the smallest pitches (tp = 0.05 m, cp = 0.015 m). Using a combined performance index, the best case with the base fluid was 1.39 at the maximum Graetz number for tp = 0.05 m and cp = 0.025 m, and the index increased up to 1.88 when using 1.0% nanofluid at the same geometry. They also proposed correlations for Nusselt number and friction factor over a Graetz number range of 14–58. Promthaisong et al. [21] varied the twist ratio (TR) of 3.0–6.0 (step 0.5) and considered Re = 3000–20,000 (based on hydraulic diameter) with a straight square duct as the reference. Compared with the straight duct, heat transfer increased by 52, 49.8, 45.9, 42.2, 39.5, 35.4, and 31.8% for TR = 3.0, 3.5, 4.0, 4.5, 5.0, 5.5, and 6.0, respectively, while lower TR also led to higher friction. The highest thermal enhancement factor was 1.42 at a twist ratio of 3.5 and Re = 3000. Bhadouriya et al. [22] examined heat transfer and friction factor for air flow in a twisted square duct using experiments and three-dimensional simulations under a uniform wall temperature condition. The experiments used twist ratios of 11.5 and 16.5 over Re = 600–70,000, while the simulations covered twist ratios of 2.5, 5, 10, and 20 over Re = 100–100,000 and Pr = 0.7–20. They identified the laminar–turbulent transition, and the maximum enhancement factor was 10.5 at a twist ratio of 2.5, Pr = 20, and Re = 3000 (constant pumping power). In a related work, Bhadouriya et al. [23] investigated heat transfer and friction factor in an annulus formed by an inner twisted square duct and an outer circular pipe, based on experiments with air and supporting simulations. The inner wall was kept at a uniform temperature, and the outer pipe was insulated. They tested twist ratios of 10.6 and 15 over Re = 400–60,000, studied the effect of the annulus parameter by changing the outer pipe diameter, and extended the numerical ranges to Re = 100–100,000 and Pr = 0.7–20. The transition Reynolds number was reported as Re = 3000, and for a fixed twist ratio, smaller annulus parameters gave higher Nusselt numbers and higher friction factors. Only a limited number of studies have extended this type of problem to second-law evaluation, even though entropy generation and exergy destruction can provide additional insight into the balance between heat-transfer enhancement and frictional penalty.
Against this backdrop, recent work has applied second-law tools to a variety of novel inserts. Promvonge et al. [24] examined louver-perforated V-baffles. They found that a V-up array with a 20° trailing-edge louver produced the lowest entropy generation and a reduced-entropy factor of nearly 20.3, marking the best second-law performance. Promvonge et al. [25] placed trapezoidal louvered winglets on a flat tape. Exergy efficiency peaked at the smallest louver angle (θ1 = 0°) while entropy generation fell as θ1 and the Reynolds number dropped, yielding a top thermal-effectiveness factor of 2.45 at θ1 = 45° and PR = 1.0. Alsharifi et al. [26] optimized a PVT collector with porous twisted tapes. Single-objective runs reached 2.11% thermal and 11.27% electrical exergy efficiency. Multi-objective tuning achieved a desirability of 1.0. Elmasry et al. [27] simulated a V-cut tape in a PVT absorber. They showed that a 100 mm pitch raised overall exergy efficiency by 4.03–13.08% for Re = 500–2000, with the largest gains at Re = 2000 when the thermal and electrical efficiencies climbed to 75.5% and 16.3%, respectively. Kalateh et al. [28] ran indoor tests on a water-cooled PVT with clockwise and counterclockwise tapes. These inserts increased the overall exergy efficiency to 14.86%, up from 13.57% for a conventional unit, while lowering entropy generation. Jayranaiwachira et al. [29] conducted a second-law appraisal of round tubes fitted with flapped V-baffle vortex generators. They showed that the dimensionless entropy-generation rate fell steadily as either flap angle (θ) or baffle-pitch ratio (PR) increased. It reached its lowest value—and thus the highest exergy efficiency—when the baffles lay flat (θ = 0°) at PR = 1.0 under low-Reynolds-number operation. Raising θ improved heat-transfer performance at the cost of greater irreversibility. The true thermal-exergy factor (TEF) peaked at ≈2.44 for θ = 45° and PR = 1.0. A balanced compromise emerged at θ = 25° (Nuᵣ = 5.42, TEF = 2.39), confirming that moderate flap angles can maximize useful energy recovery without unduly elevating entropy production.
From the above literature, three main gaps can be identified. First, many studies have examined twisted tapes in circular tubes and straight square ducts, and some works have considered twisted square ducts without inserts. However, almost all of these studies use a constant twist pitch along the heated length. Systematic use of gradient pitch within a single test section is rarely reported, even though a streamwise change in pitch can offer extra control over the local swirl strength and pressure loss. Second, previous works on twisted square or rectangular passages do not usually keep the hydraulic diameter constant when changing the cross-section. As a result, the individual effects of aspect ratio and size are mixed, which makes it difficult to isolate the role of variable aspect ratio. Third, most available studies focus on thermal and hydraulic performance based on the first law. Only a few extend the analysis to a full thermodynamic assessment that also includes entropy generation and exergy-based measures.
The present work is designed to address these gaps. Gradient pitch twisted square and rectangular ducts are studied numerically for turbulent air flow. Three cross-sectional aspect ratios are considered, 1:1, 3:4, and 1:2, and all are scaled to have the same hydraulic diameter. For each aspect ratio, one uniform pitch case and two gradient pitch cases (increasing and decreasing pitch sequences) are simulated. Straight ducts with the same cross-sections are also included as baselines. The thermodynamic performance is evaluated in terms of heat transfer, friction loss, entropy generation, Bejan number, and exergy destruction, so that the combined effects of gradient pitch and variable aspect ratio can be quantified in a consistent framework. Therefore, this study provides a clearer comparison of pitch-distribution and aspect-ratio effects under a fixed hydraulic diameter and extends the evaluation from conventional thermal-hydraulic performance to thermodynamic performance.

2. Governing Equations

The numerical analysis relies on the Reynolds-Averaged Navier–Stokes (RANS) equations to solve for flow and heat transfer. We treat the flow as three-dimensional, steady, turbulent, and incompressible. The governing equations for mass, momentum, and energy are solved throughout the domain. Air is used as the working fluid, assumed to be Newtonian with constant properties that do not change with temperature [30].
Continuity equation:
x i ( ρ u i ) = 0
Momentum equation:
( ρ u i u j ) x j = p x i + x j [ μ ( u i x j + u j x i 2 3 δ i j u k x k ) ] +   x j ( ρ u i u j ¯ )
Energy equation:
x i [ u i ( ρ E + p ) ] = x j ( k e f f T x j )
E = c p T p ρ + u 2 2
The Reynolds stresses, ρ u i u j ¯ in Equation (2) must be accurately applied to use the Reynolds-averaged approach to turbulence modeling.
To close the RANS equations for continuity, momentum, and energy, we employ the Realizable k–ε turbulence model. In the present study, the realizable k–ε model was used together with the standard wall functions available in ANSYS Fluent 14. The standard model constants were kept at their default Fluent values for all cases. No separate sensitivity analysis was performed on these constants, since the present work used the standard calibrated form of the model for all simulations. This model was selected because it has been used for swirling and twisted internal flows, including the configuration reported in Ref. [21], and is also widely used in simulations involving twisted-tape inserts [31,32].
( ρ k ) t + ( ρ k u j ) x j = x j [ ( μ + μ t σ k ) k x j ] + G k + G b ρ ε + S k
and
( ρ ε ) t + ( ρ ε   u j ) x j = x j [ ( μ + μ t σ ε ) ε x j ] + ρ C 1 S ε ρ C 2 ε 2 k + ν ε + C 1 ε ε k C 3 ε G b + S ε
here,
C 1 = max [ 0.43 , η η + 5 ] , η = S k / ε , S = ( 2 S i j S i j ) 0.5 ,   S i j = 0.5 ( u j x i + u i x j )
The following are the model constants:
σ k = 1.0 , σ ε = 1.2 , C 1 ε = 1.44 ,   C 2 = 1.9

2.1. Definition of Parameters

To evaluate the performance from a first-law standpoint, several important parameters were computed from the convergent simulation data. The two parameters of interest are the Nusselt number and the friction factor. Equation (9) is used to calculate the friction factor, f:
f = Δ P [ L D ] [ ρ u 2 2 ]
where Δp is the pressure drop across the length of the tube (L).
The Nusselt number, an indicator of heat transport, can be expressed as follows:
N u = h D k
The average Nusselt number can be obtained by the following:
N u a v e = 1 A N u x A
The following is an expression for the thermal performance:
T P F = ( N u t N u p ) ( f t f p ) 1 / 3

2.2. Analysis of Entropy and Exergy

In addition to the first-law results, a second-law analysis is carried out to locate where the system loses availability. We use the entropy-generation rate as the key measure and consider two primary contributors to irreversibility: (i) heat transfer across a finite temperature difference and (ii) viscous dissipation due to fluid friction. The governing relations for this entropy analysis follow [25].
Entropy generation in a plain tube is summarized as follows:
S ˙ g , 0 = ( S ˙ g , 0 ) h t +   ( S ˙ g , 0 ) f r = ( q 2 π . T b 2 . k . N u 0 ) h t +   ( 8 . m ˙ 3 f 0 π 2 . ρ 2 . T b . D 5 ) f r
The total entropy creation of a tube with an TDS insert is expressed as follows:
S ˙ g , T D S = ( S ˙ g , T D S ) h t +   ( S ˙ g , T D S ) f r = ( q 2 π . T b 2 . k . N u 0 ) h t +   ( 8 . m ˙ 3 f 0 π 2 . ρ 2 . T b . D 5 ) f r
The useful energy output divided by the total energy used is the formula for energy efficiency.
η E x   = 1 T a   x   ( S ˙ g , T D S ) h t [ 1 ( T a T w ) ]   x   q
The ambient temperature, the test tube’s surface temperature, and the rate of heat transfer per unit length are denoted by Ta, Ts, and q′ in this instance.
The entropy generation ratio (NS) is the dimensionless ratio of entropy generated in a tube with an insert to that in a plain tube. This “entropy generation number” indicates the level of flow/thermal losses. A representative example of NS is shown below.
N S = S ˙ g , T D S / S ˙ g , 0
The Bejan number (Be) indicates the share of total irreversibility arising from heat-transfer effects. It is evaluated from the entropy-generation components and indicates how the balance shifts between heat-transfer and friction losses.
B e = ( S ˙ g ) h t / S ˙ g
The Bejan number (Be) is employed to determine which mechanism contributes to entropy generation. When Be > 0.5, entropy generation is primarily associated with heat transfer, indicating a heat transfer–dominated behavior. In contrast, Be < 0.5 suggests that frictional effects are the dominant source of entropy generation. Accordingly, a strong heat transfer enhancement is expected when Be approaches unity at a given Reynolds number (Re).

3. Methodology

3.1. Physical Models

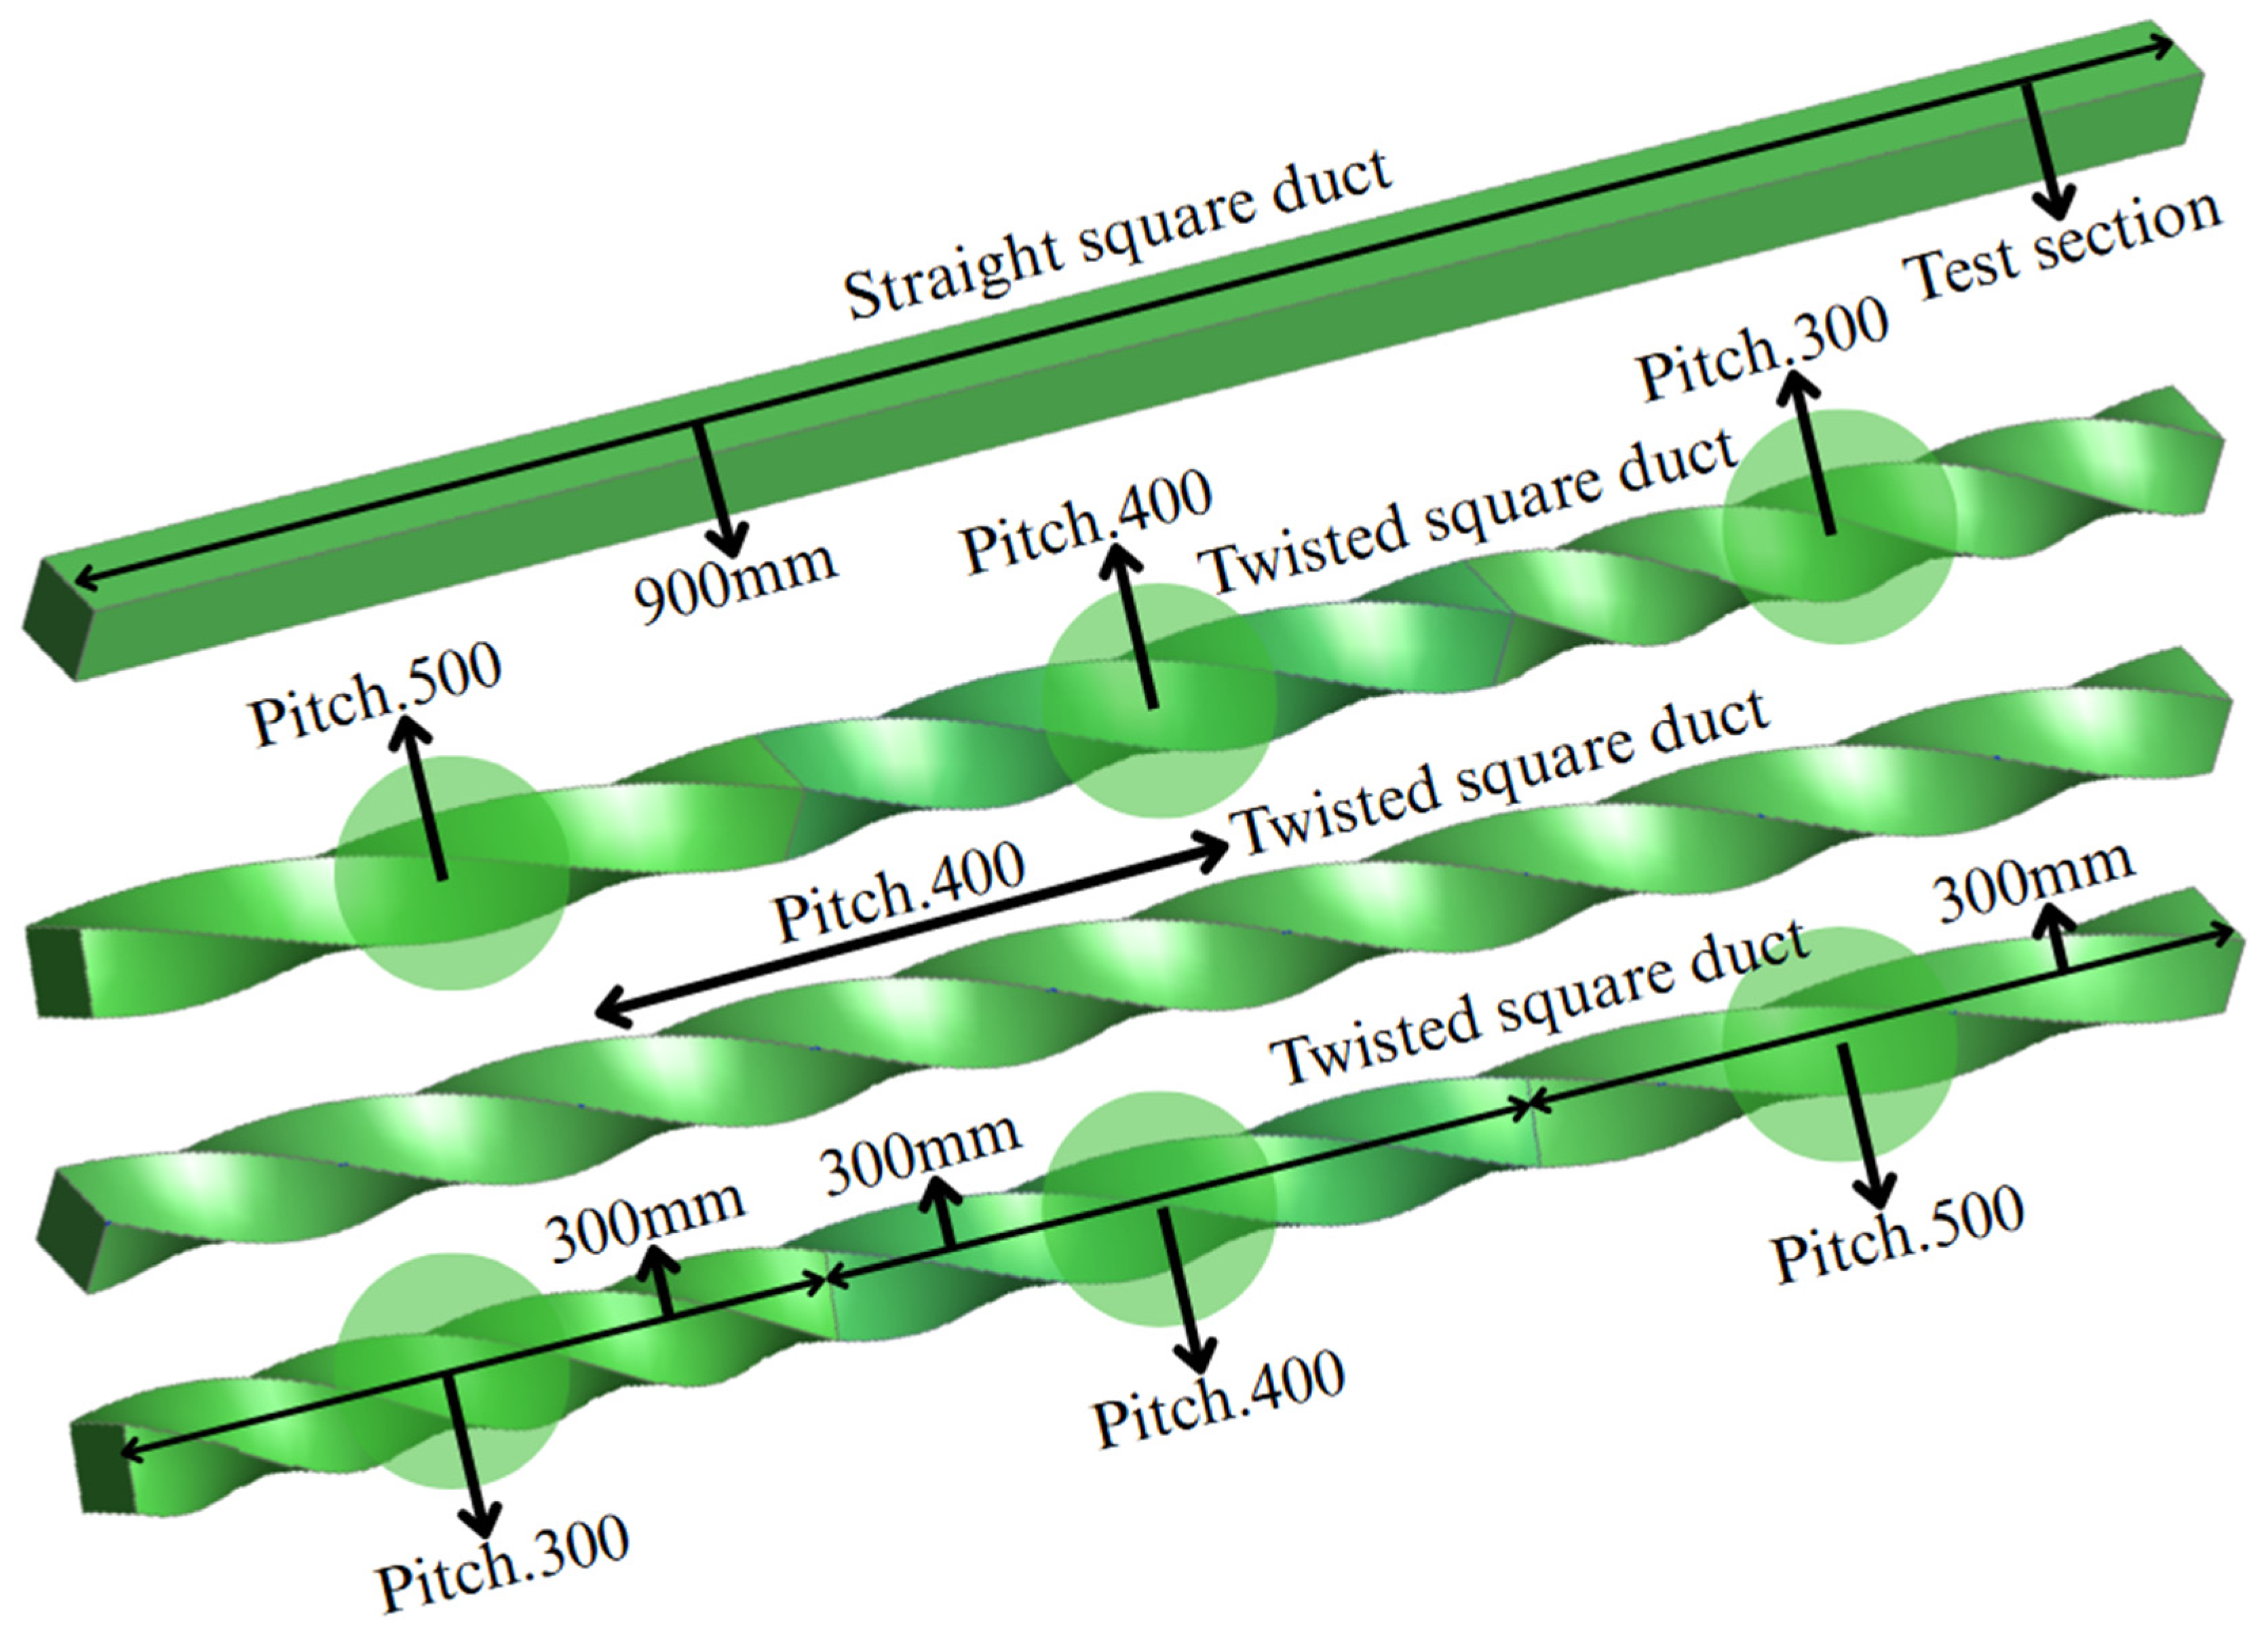
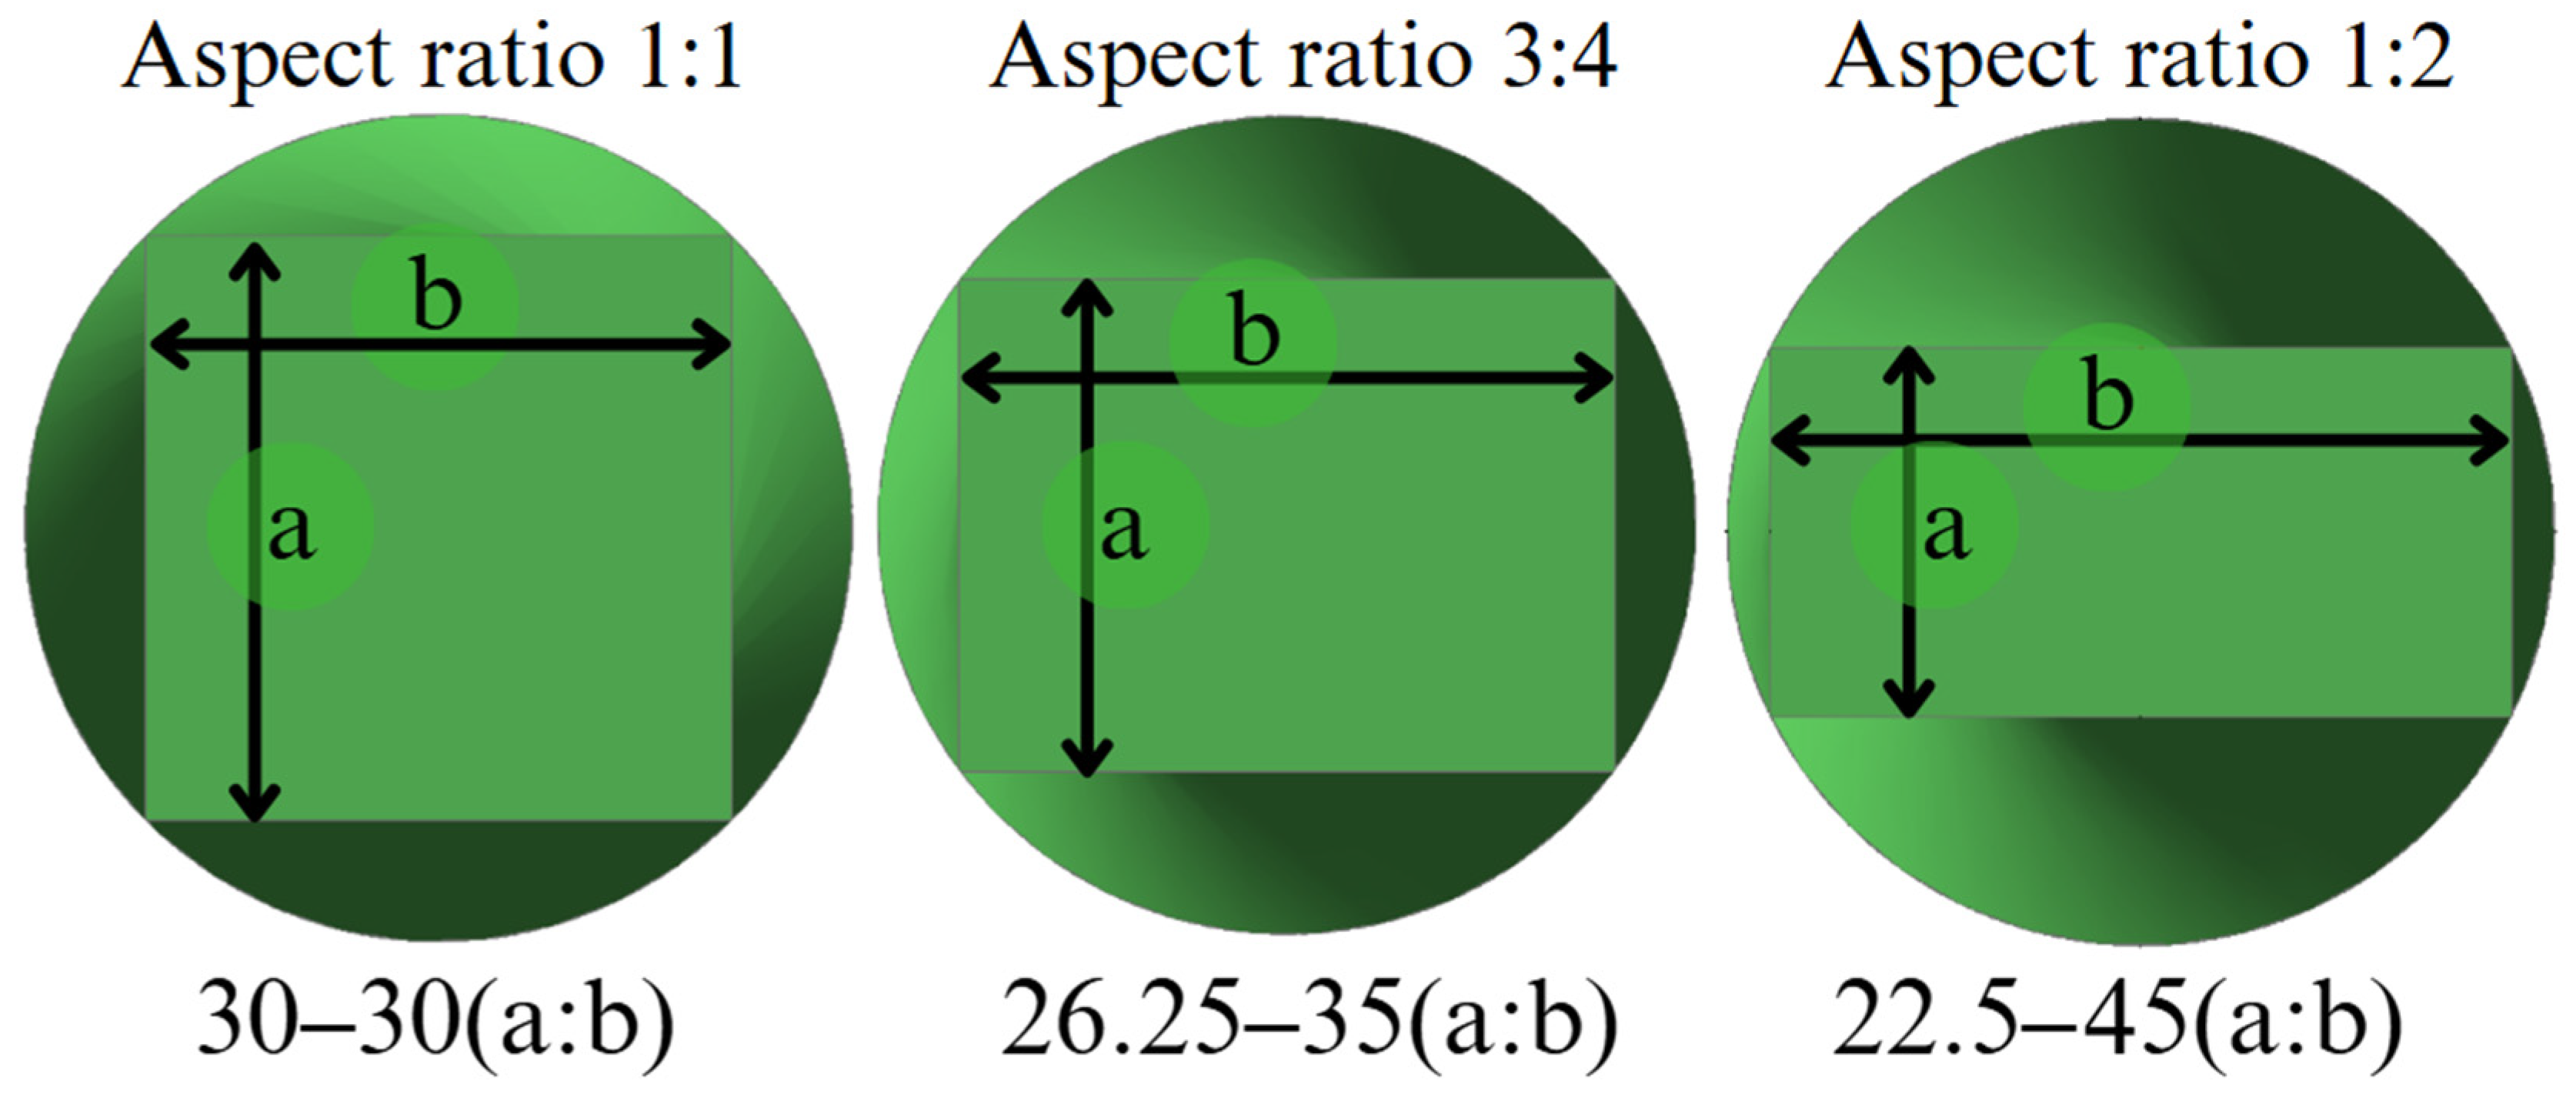
Heat transfer and thermodynamic performance are studied in air ducts with twisted square and rectangular cross-sections. All ducts have the same hydraulic diameter, Dh = 30 mm, to allow a direct comparison among aspect ratios. The reference duct has a 30 × 30 mm2 square section (AR1.00). Two additional sections, 26.25 × 35 mm2 (AR0.75) and 22.50 × 45 mm2 (AR0.50), represent moderate and strong rectangularity. The computational domain consists of a heated test section of 900 mm length (30Dh), located between unheated entrance and exit sections. The upstream entrance section is 300 mm (10Dh), and the downstream exit section is 300 mm (10Dh). The entrance length is chosen to provide a fully developed velocity profile at the inlet of the heated section. The exit extension prevents numerical feedback from the outlet boundary into the test section, as sketched in Figure 1. The working fluid is dry air with constant thermophysical properties. The duct wall is twisted about the streamwise axis to generate a steady swirling flow instead of inserting a twisted tape. The twist is applied only over the heated test section, while the upstream and downstream unheated sections remain straight ducts. The heated test section is divided into three equal segments of 300 mm. Within these segments, the twist pitch can be uniform or follow a simple axial gradient. A uniform pitch of 400 mm is selected as the non-gradient reference. Two gradient pitch profiles are then defined: an increasing pitch sequence 300–400–500 mm and a decreasing pitch sequence 500–400–300 mm. These three pitch patterns are combined with three ratios to form nine twisted duct cases. In addition, straight (untwisted) ducts are also simulated for each aspect ratio. However, SD-AR1.00 is used as the single global baseline for all normalized comparisons in this study.
For compact notation, each twisted duct case is labeled TSD-ARx.xx-Pyyy, where ARx.xx indicates the short-to-long side ratio, and Pyyy encodes the axial pitch sequence. For example, TSD-AR1.00-P444 denotes the square duct with a uniform pitch of 400 mm in all three segments, while TSD-AR0.75-P345 refers to the AR0.75 duct with the increasing pitch sequence 300–400–500 mm. Detailed information for all geometries and case codes is provided in Table 1, and the configurations are illustrated in Figure 2 and Figure 3.

3.2. Boundary Conditions

Dry air with constant thermophysical properties, as provided by ANSYS Fluent, is employed to isolate the effects of duct geometry. The air density, specific heat, thermal conductivity, and dynamic viscosity are taken as 1.225 kg m−3, 1006.43 J kg−1 K−1, 0.0242 W m−1 K−1, and 1.7894 × 10⁻⁵ kg m−1 s−1, respectively. At the inlet, a uniform axial velocity profile is prescribed and adjusted to achieve target Reynolds numbers in the range of 5000 ≤ Re ≤ 20,000. The inlet temperature is fixed at 300 K. Turbulence is specified using an intensity of 10%, from which the corresponding turbulent kinetic energy (k) and dissipation rate (ε) are calculated for the realizable k–ε model. This value was applied consistently to all cases.
A uniform heat flux of 1000 W m−2 is imposed over the 900 mm heated section of the duct, while the upstream and downstream unheated extensions are treated as adiabatic. All solid walls satisfy the no-slip boundary condition, ensuring accurate resolution of the near-wall viscous region and reliable prediction of pressure losses under identical thermal loading for all configurations. At the outlet, a constant static pressure of 101,325 Pa is applied. Standard zero-gradient conditions are enforced for transported scalar quantities, with a backflow temperature of 300 K specified if required. This boundary-condition setup minimizes numerical reflections and backflow contamination, ensuring that the flow and heat transfer characteristics within the computational domain are governed primarily by the imposed heat flux, inlet Reynolds number, and the duct cross-sectional geometry and twist pitch distribution.
To assess the constant-property assumption, the highest Reynolds number case in the present dataset (Re ≈ 20,000) was examined under steady state flow. Under the applied heat flux of 1000 W m−2, the bulk mean air temperature remained in the range of 305.02–306.41 K, while the average wall temperature was 320.4–325.07 K. The resulting wall-to-bulk temperature difference was therefore limited to about 13.99–20.04 K. Over this temperature interval, the variation in air thermophysical properties, particularly viscosity, is small and is not expected to alter the comparative trends of friction factor and exergy destruction among the tested cases.

3.3. Grid Independence

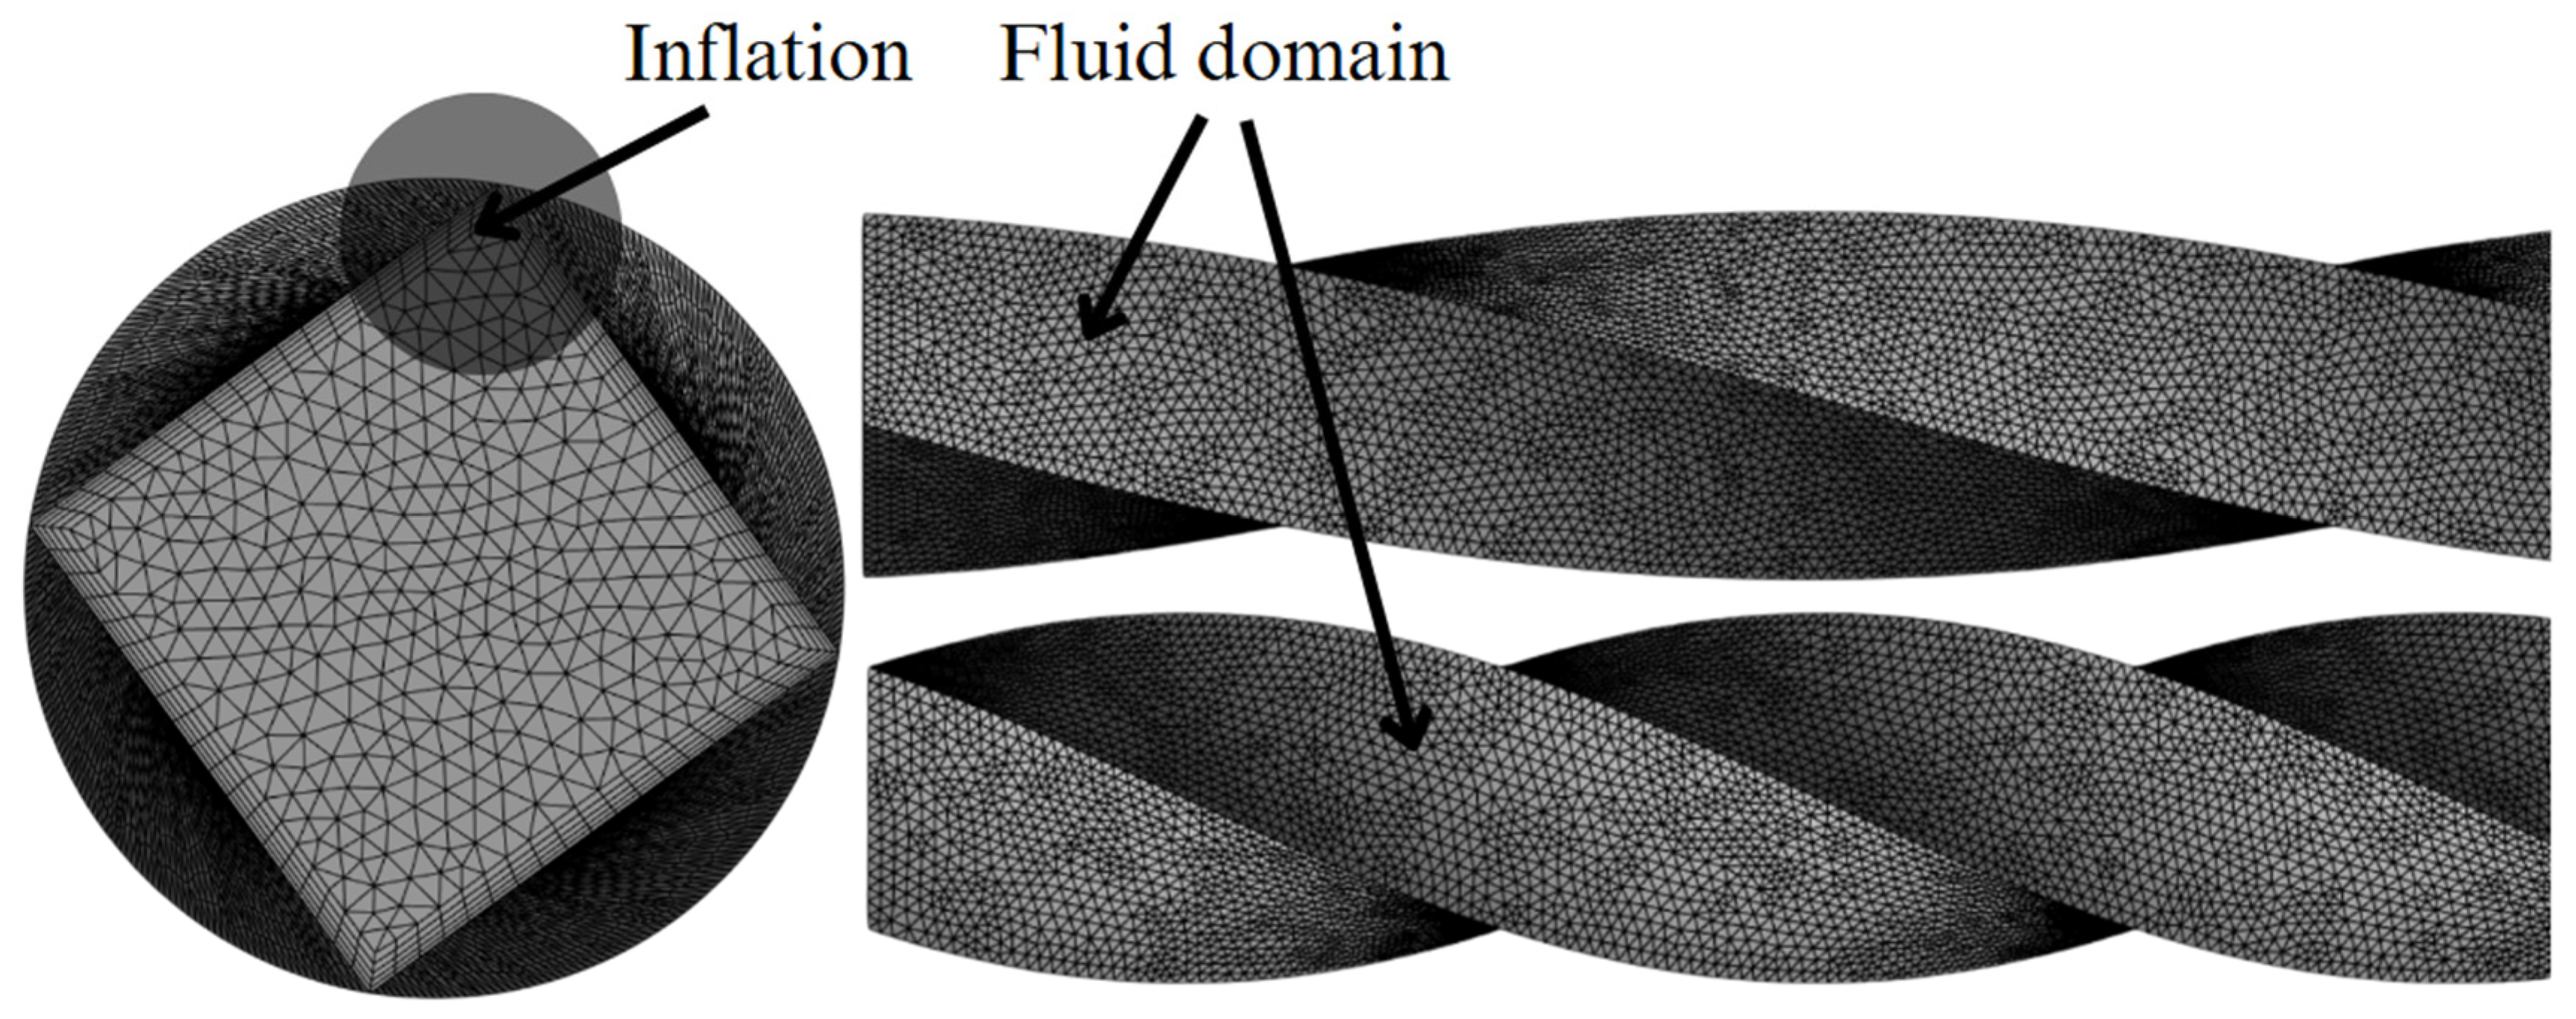
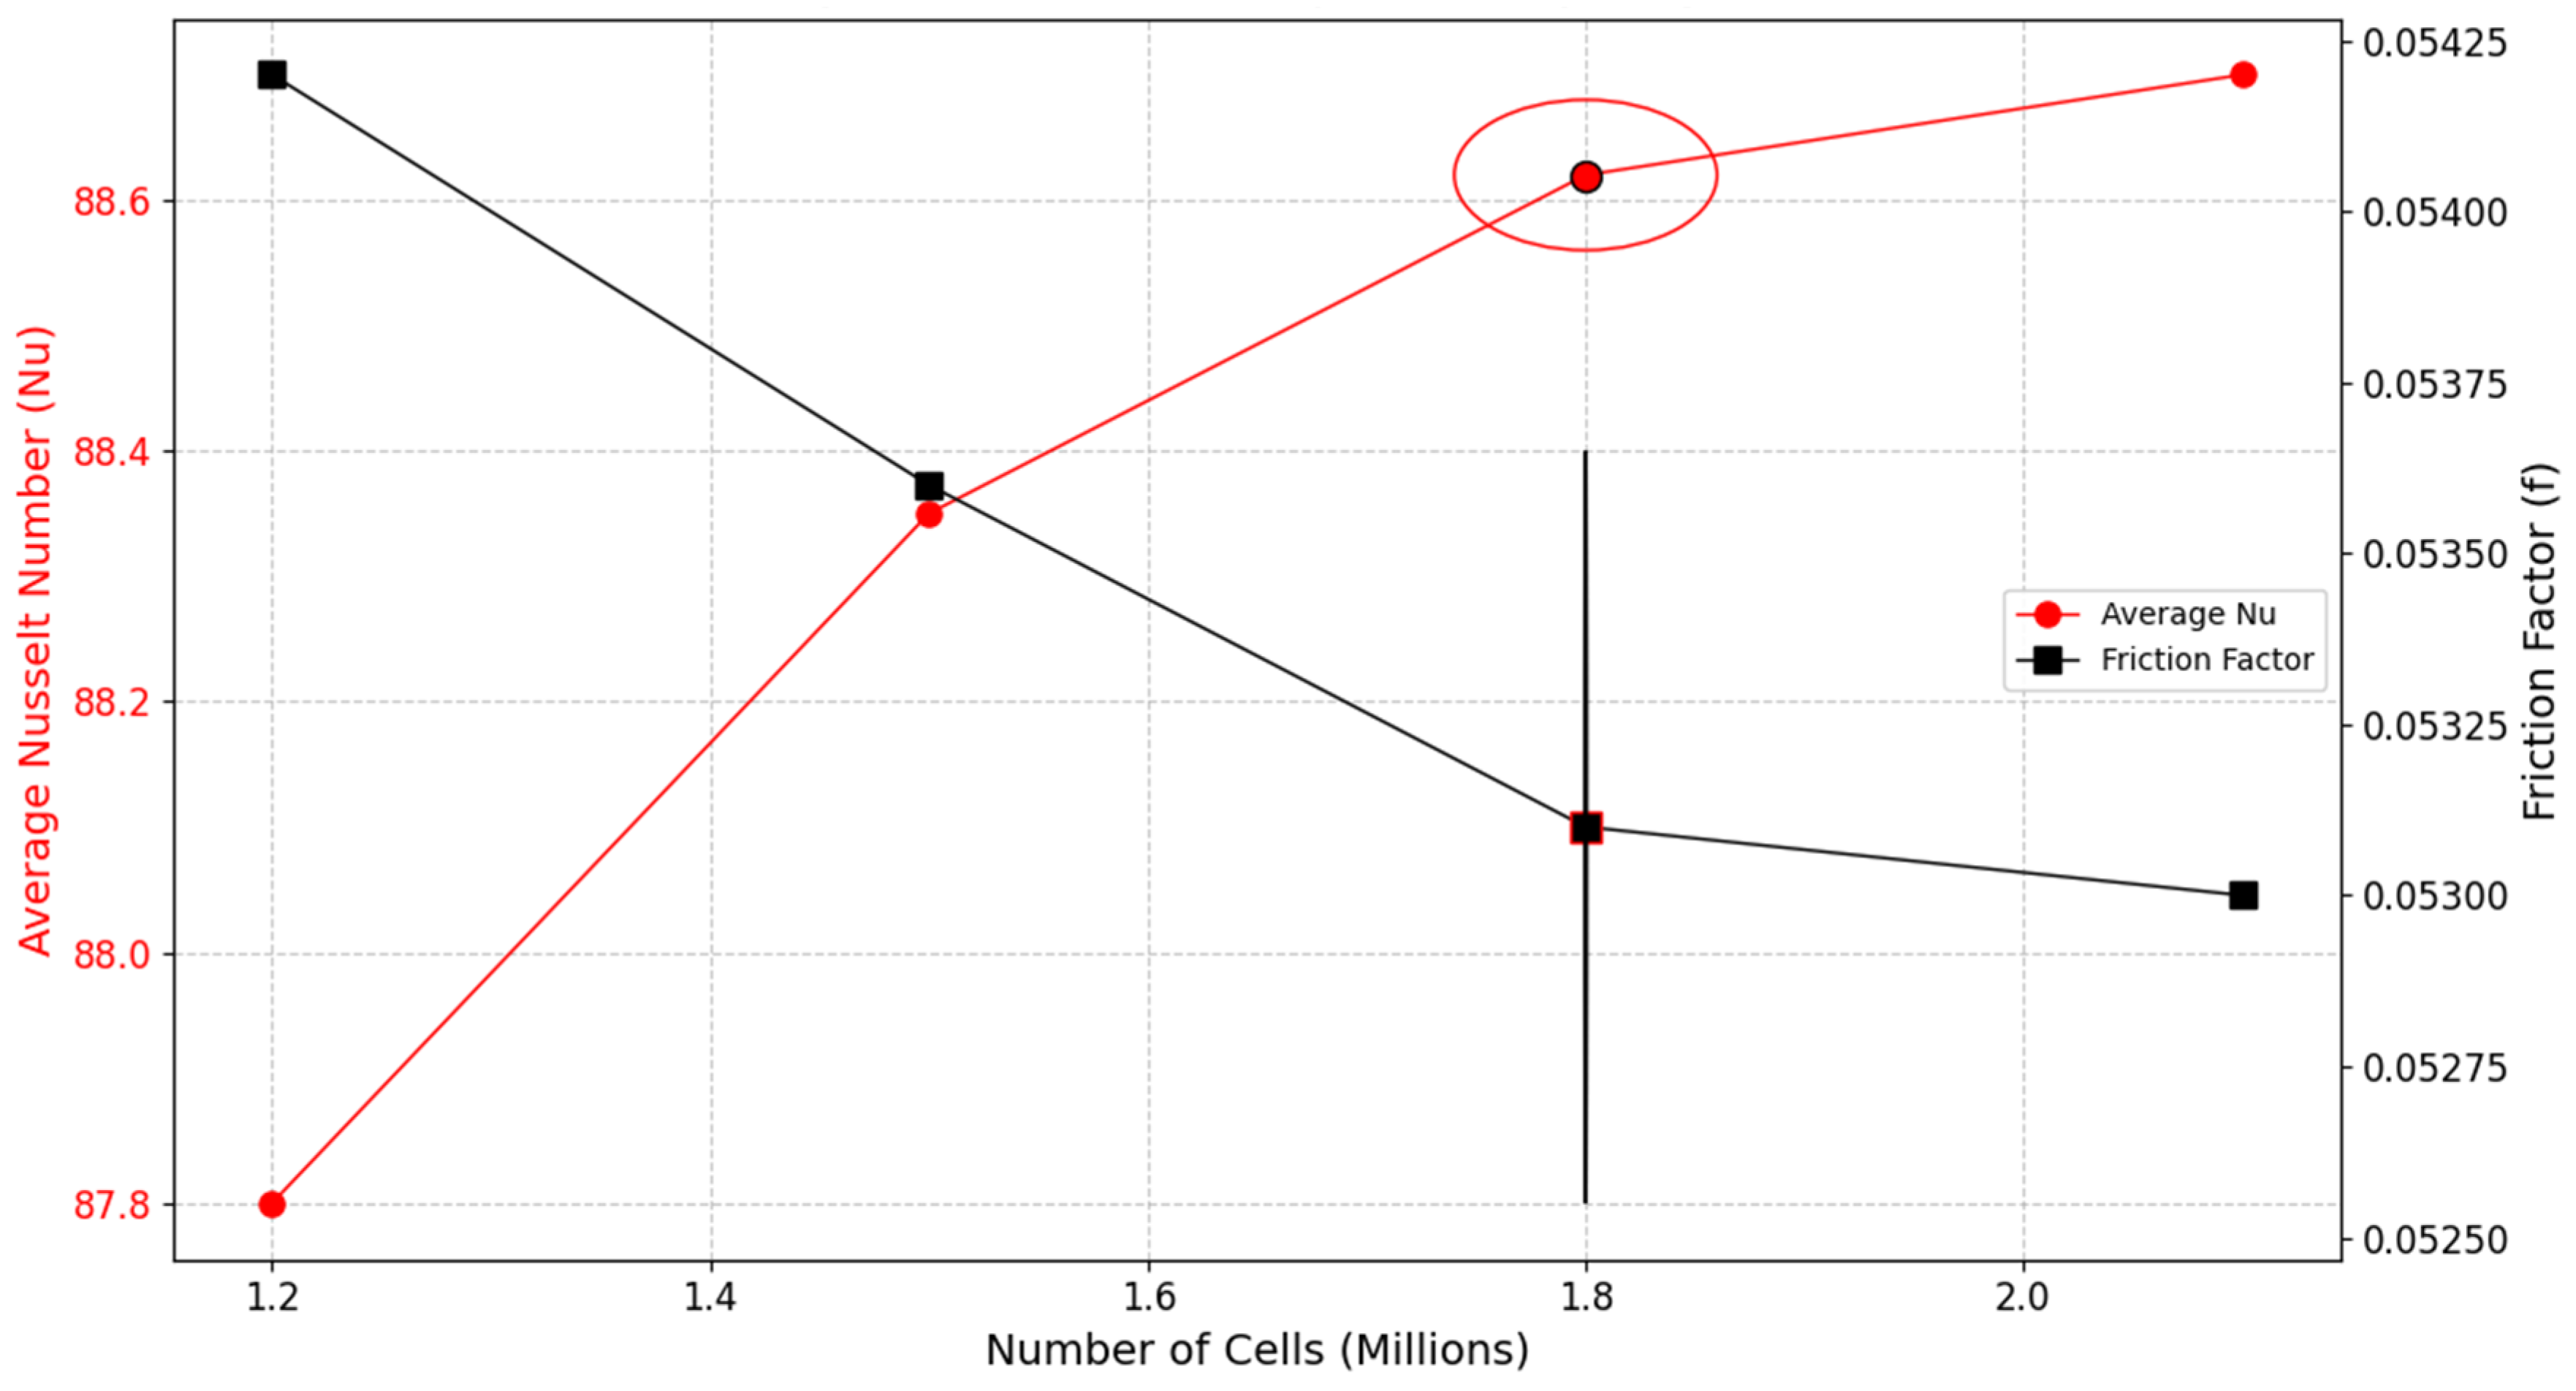
Figure 4 presents the meshing workflow used in this study. The twisted square-duct domain was first discretized with an unstructured tetrahedral mesh to capture the twist-induced curvature and near-wall gradients and then converted to a polyhedral mesh in ANSYS Fluent. Polyhedral cells help reduce numerical diffusion and often give faster and more stable convergence, while preserving the near-wall resolution required for turbulent heat transfer. The polyhedral grid was utilized across the whole computational domain; the near-wall area (y+ ≈ 5) formed a high-density grid because the viscous sublayer greatly altered the temperature and velocity, while the actual y+ values fell within roughly 30–100 on the duct walls across all grids. This range is suitable for the realizable k–ε model with standard wall functions. To confirm that the CFD results are not sensitive to the mesh density, a grid-independence study was conducted for a representative gradient-pitch configuration, TSD-AR0.50-P345, at Re = 20,000. Four successively refined polyhedral meshes were tested, as shown in Figure 5: G1 (≈1.2 million), G2 (≈1.5 million), G3 (≈1.8 million), and G4 (≈2.1 million) cells. The corresponding Nu and f values are summarized in Table 2. At this operating point, the target values from the present dataset are Nu = 88.62 and f = 0.0531. The solution shows a clear convergence trend with mesh refinement. G3 reproduces the target values (Nu = 88.62, f = 0.0531), while a further refinement to G4 changes the results only slightly (Nu = 88.7, f = 0.053), which corresponds to differences of 0.09% in Nu and 0.19% in f relative to G3. These variations are well below the 1% independence criterion. Therefore, G3 (≈1.8 million polyhedral cells) was selected for the remaining simulations as a practical balance between computational cost and predictive fidelity.

3.4. Method Validation

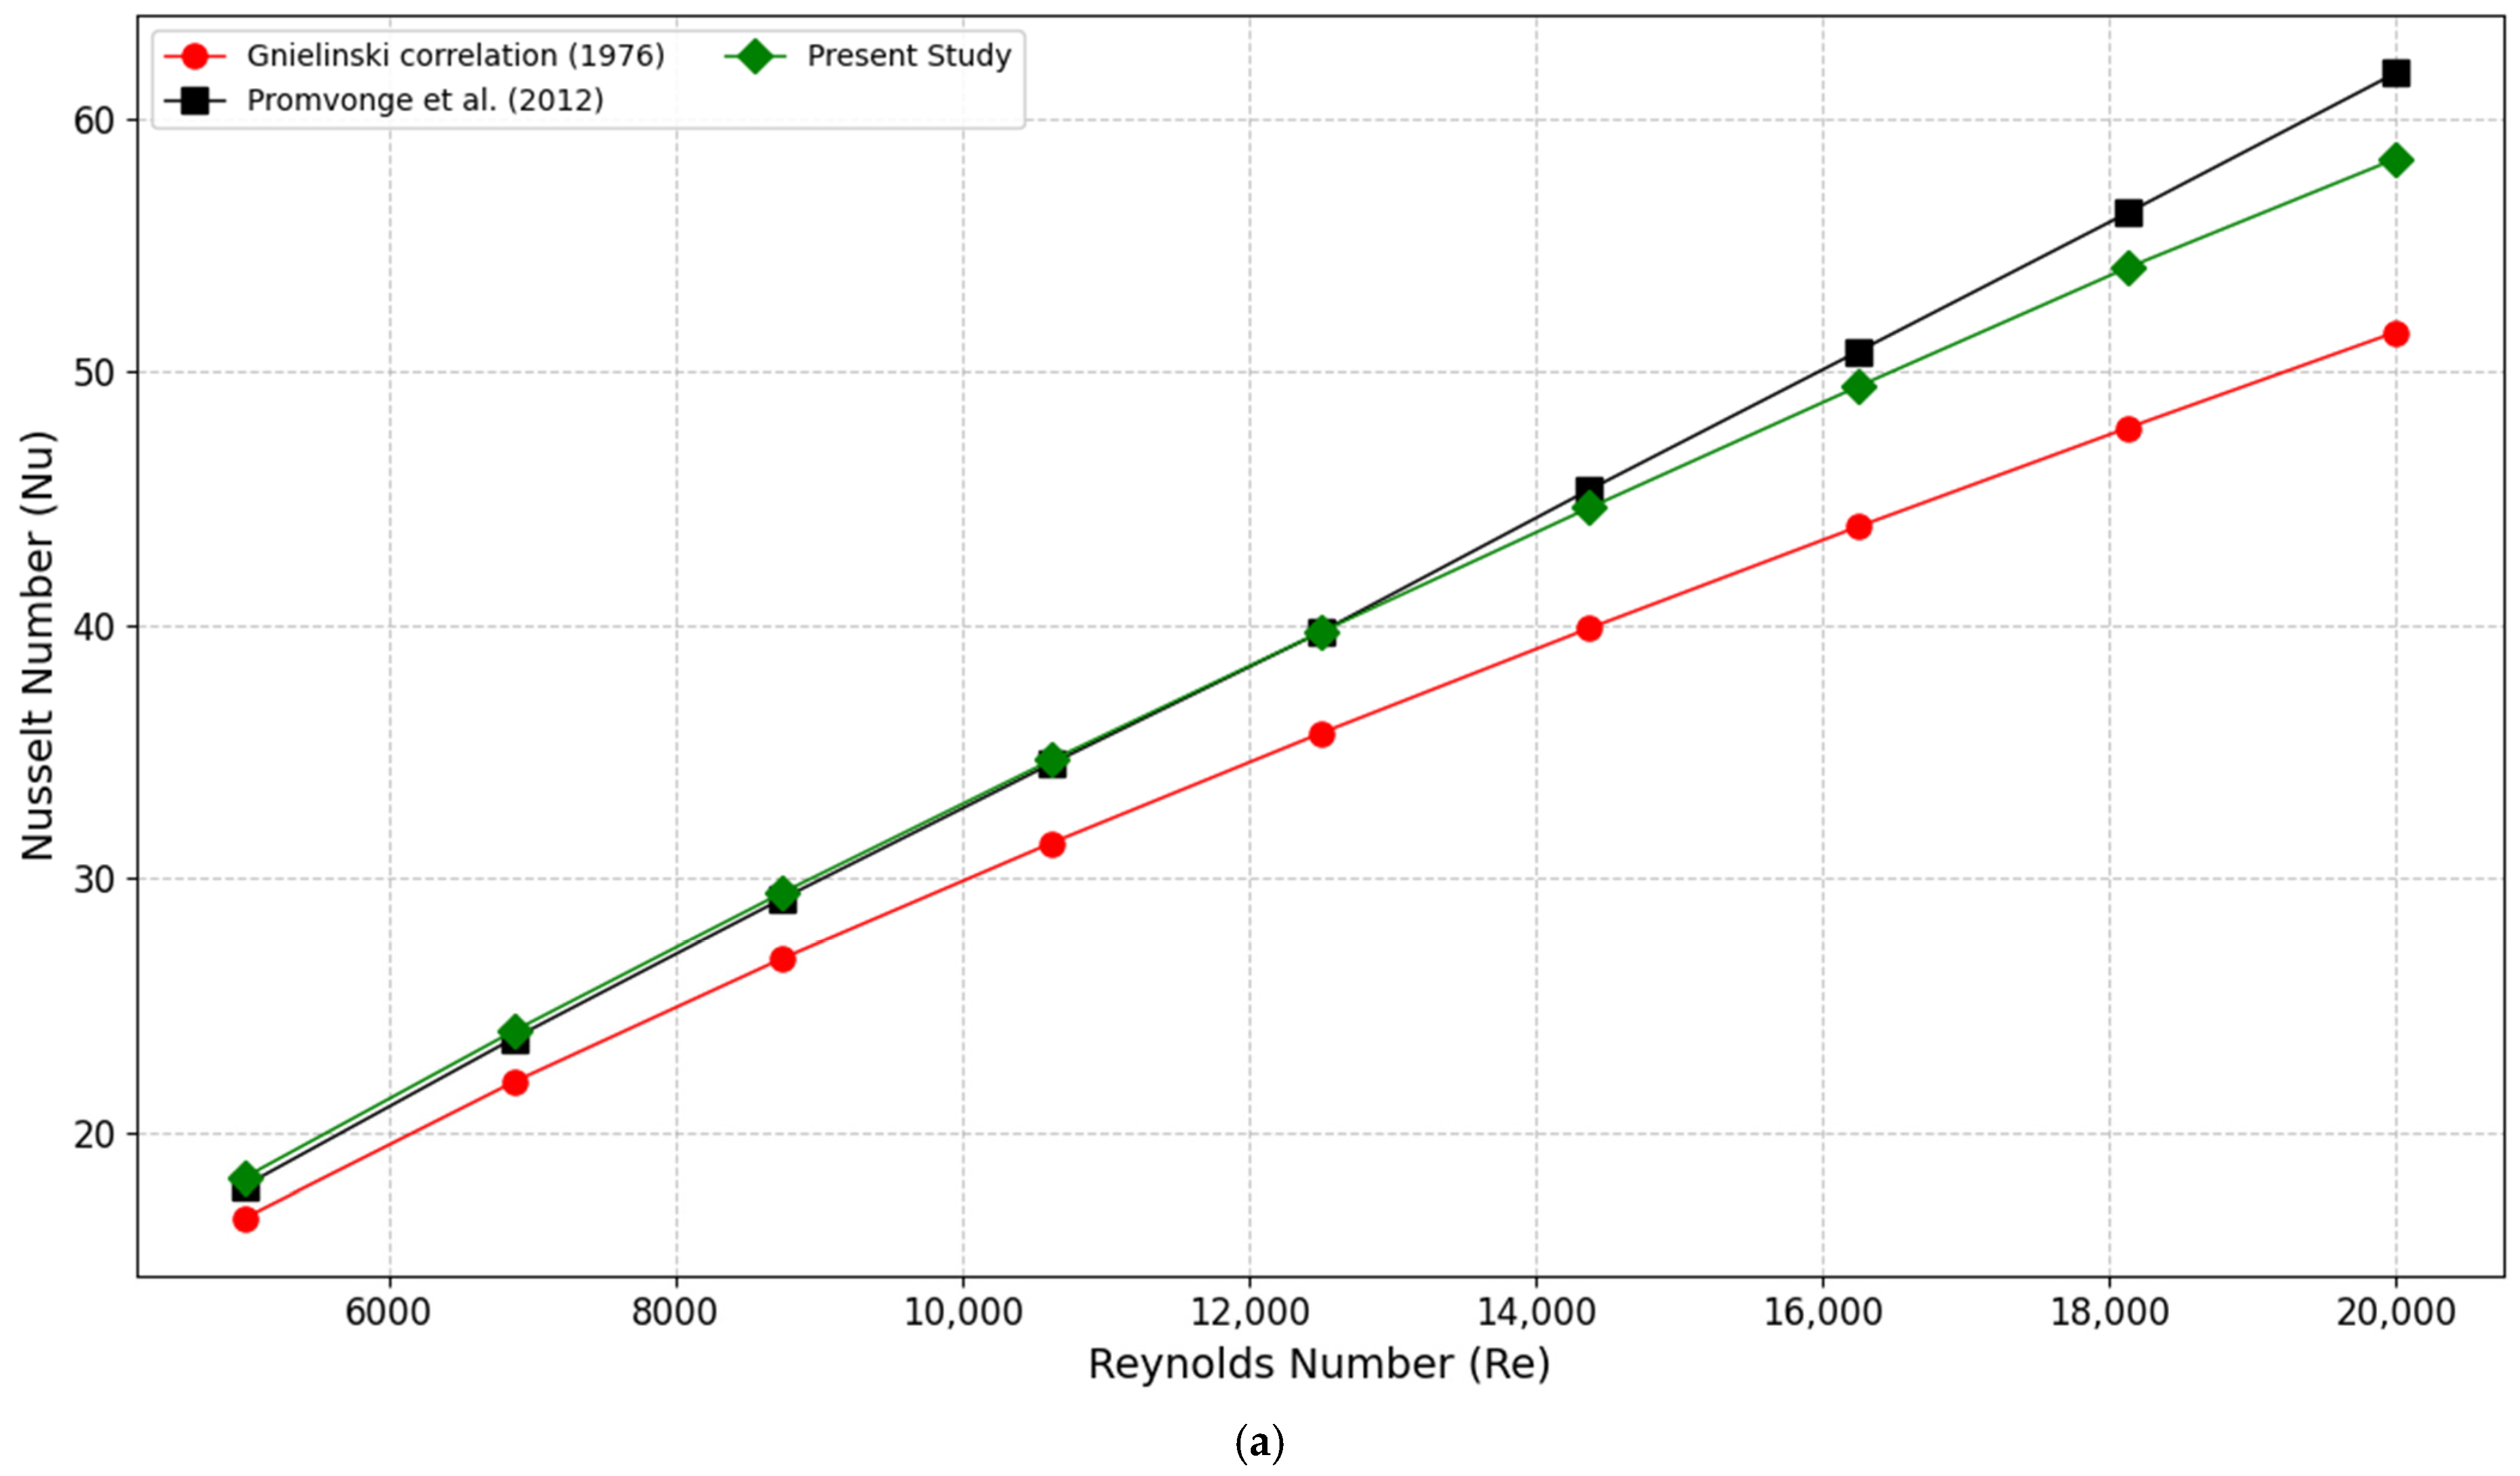
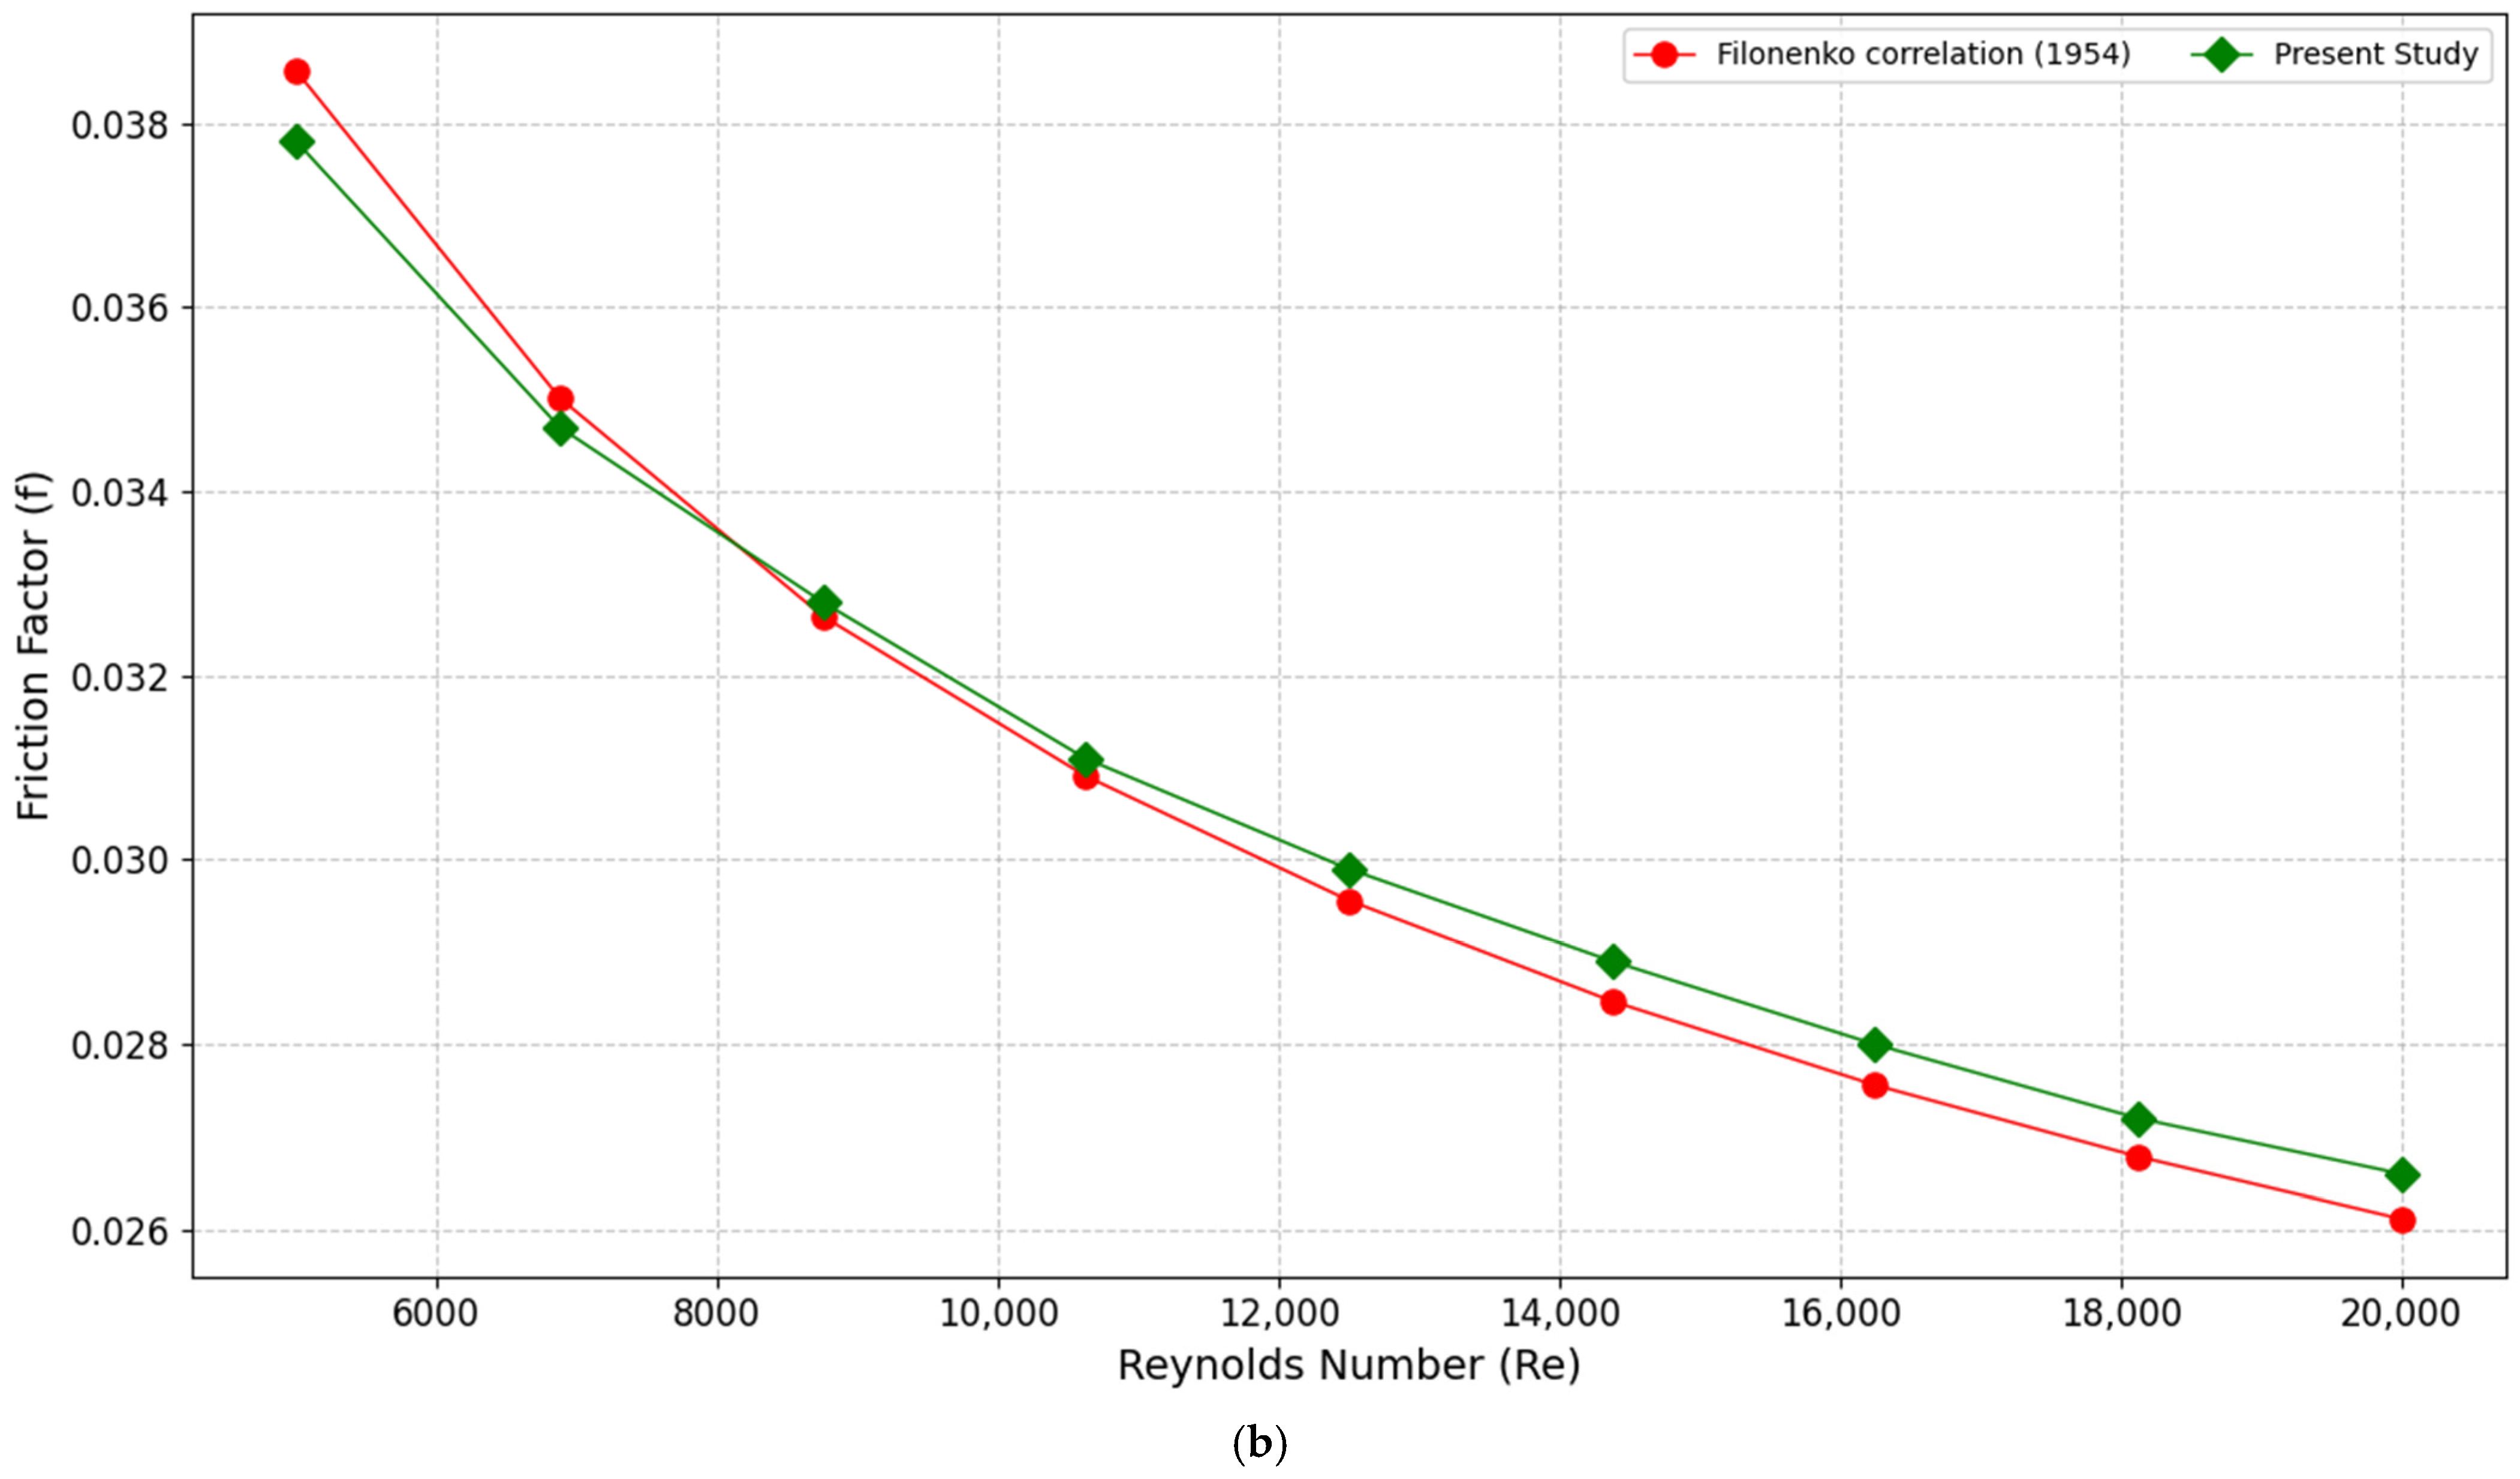
To verify the numerical setup used in this study, we first simulated the straight (untwisted) square duct case, SD-AR1.00, using the same hydraulic diameter (Dh = 30 mm), flow conditions, and thermal boundary conditions as those applied in the twisted-duct simulations. The realizable k–ε turbulence model with standard wall functions was employed. The predicted Nusselt number (Nu) for Re = 5000–20,000 was compared with the Gnielinski correlation [33] and with the baseline experimental data reported for a smooth square duct by Promvonge et al. [34]. The predicted Darcy friction factor (f) was validated against the Filonenko correlation [35]. Across the full Reynolds range, the present Nu values show the same monotonic trend as both references. Based on the SD-AR1.00 dataset points in this work, the maximum deviation of Nu from the Gnielinski correlation is about 13.3%, while the maximum deviation from the experimental baseline is about 5.5%. On the hydraulic side, the present Darcy friction factors agree well with Filonenko, with a maximum discrepancy of about 2.0%. The validation results, as illustrated in Figure 6a,b, demonstrate that the selected numerical setup and solver parameters can reliably predict turbulent heat transfer and pressure losses in a straight square duct. This validation also supports the use of the selected Realizable k–ε model for the present comparative simulations. This satisfactory agreement provides confidence in the subsequent simulations of twisted square and rectangular ducts and in the comparative analyses presented in this paper.

4. Results and Discussion

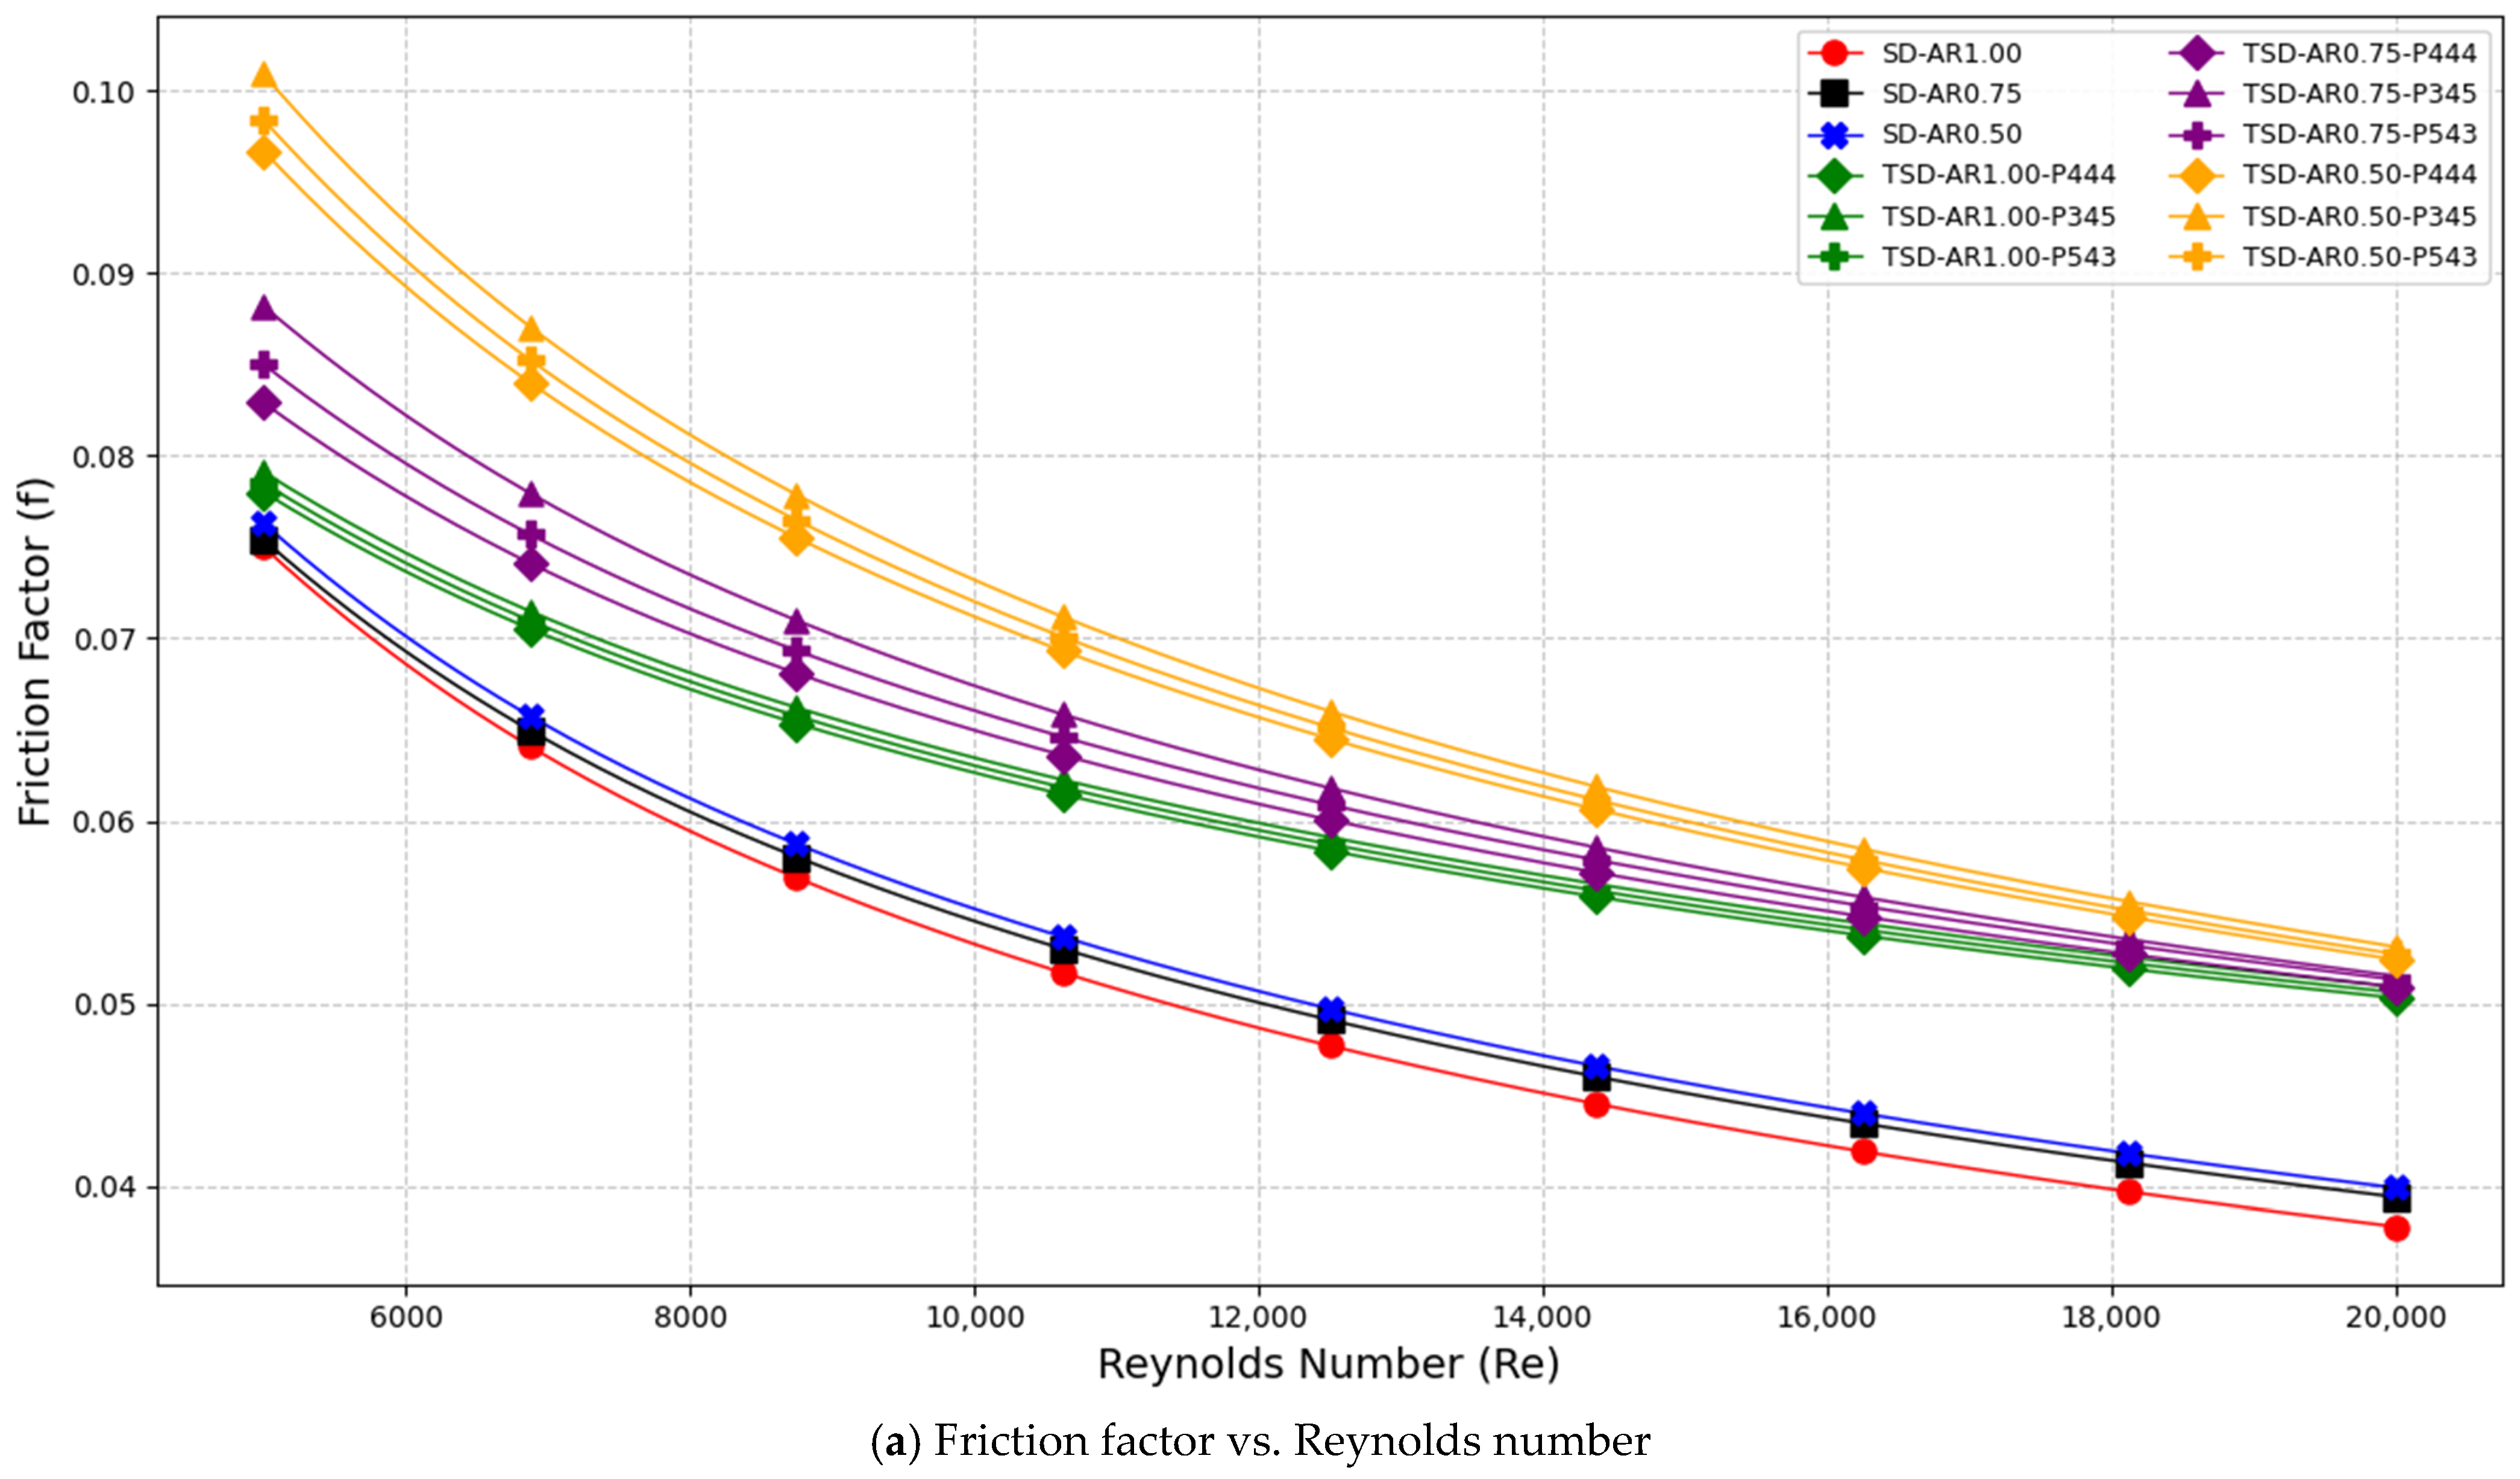
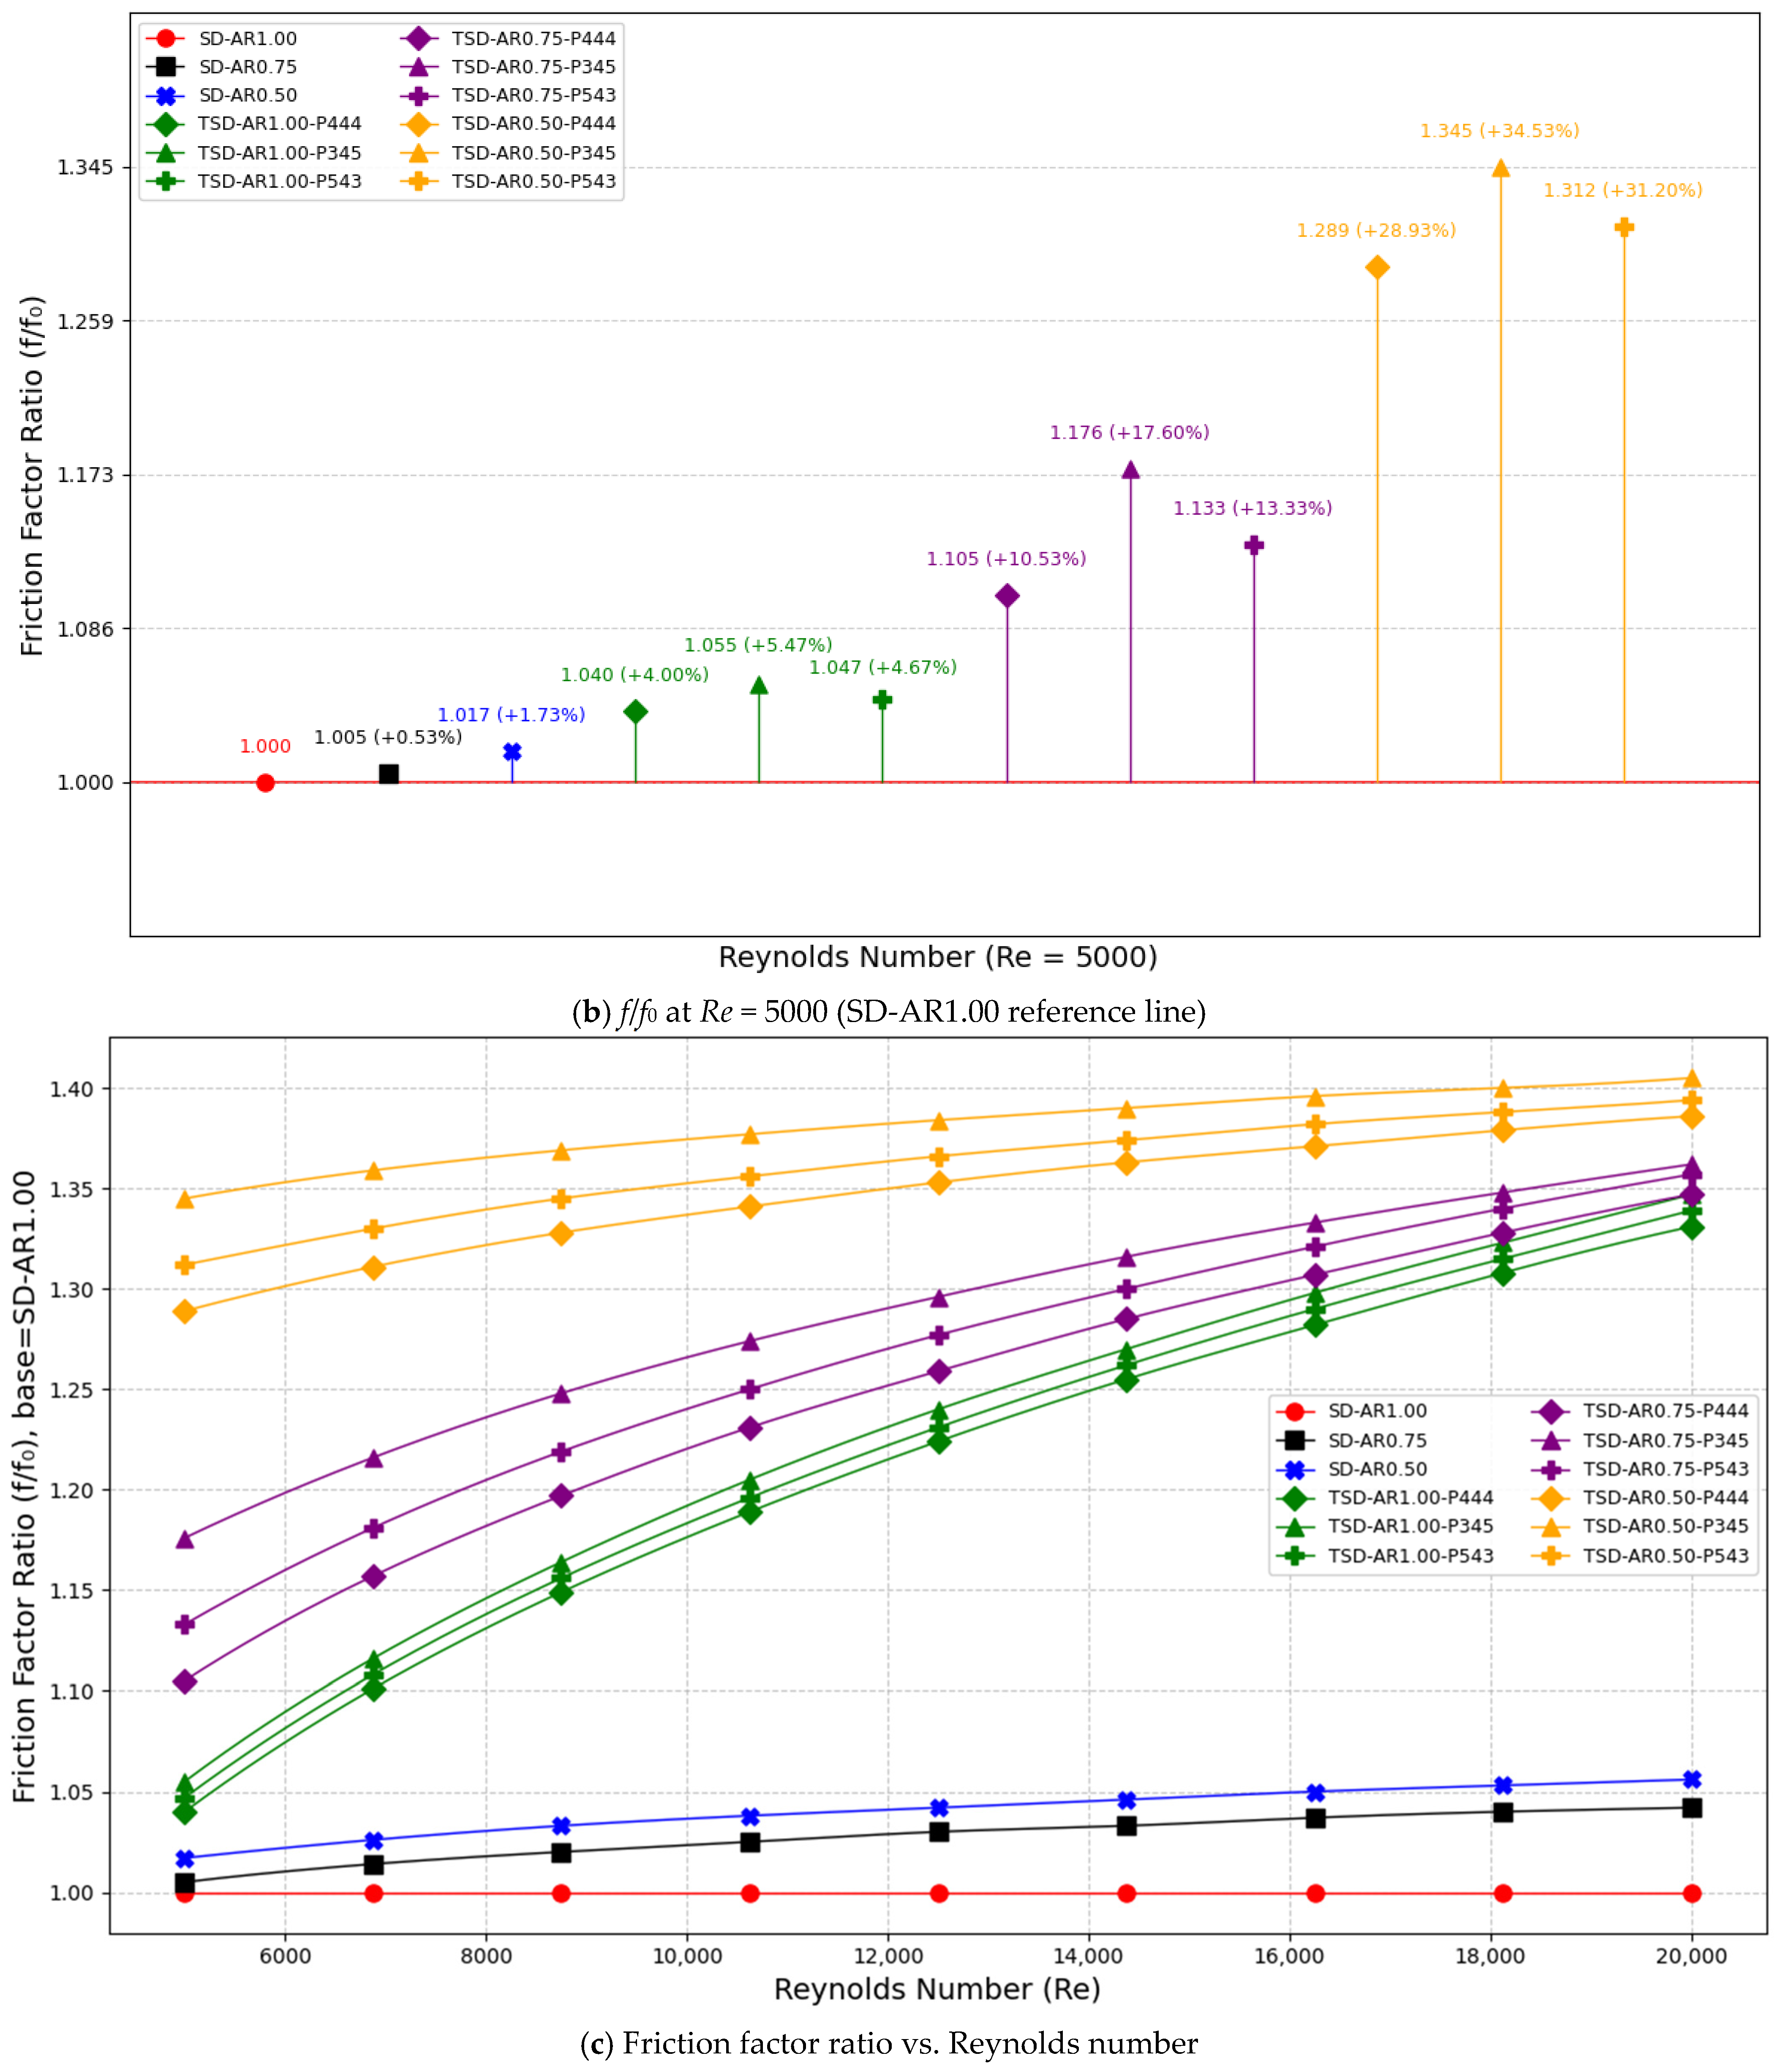
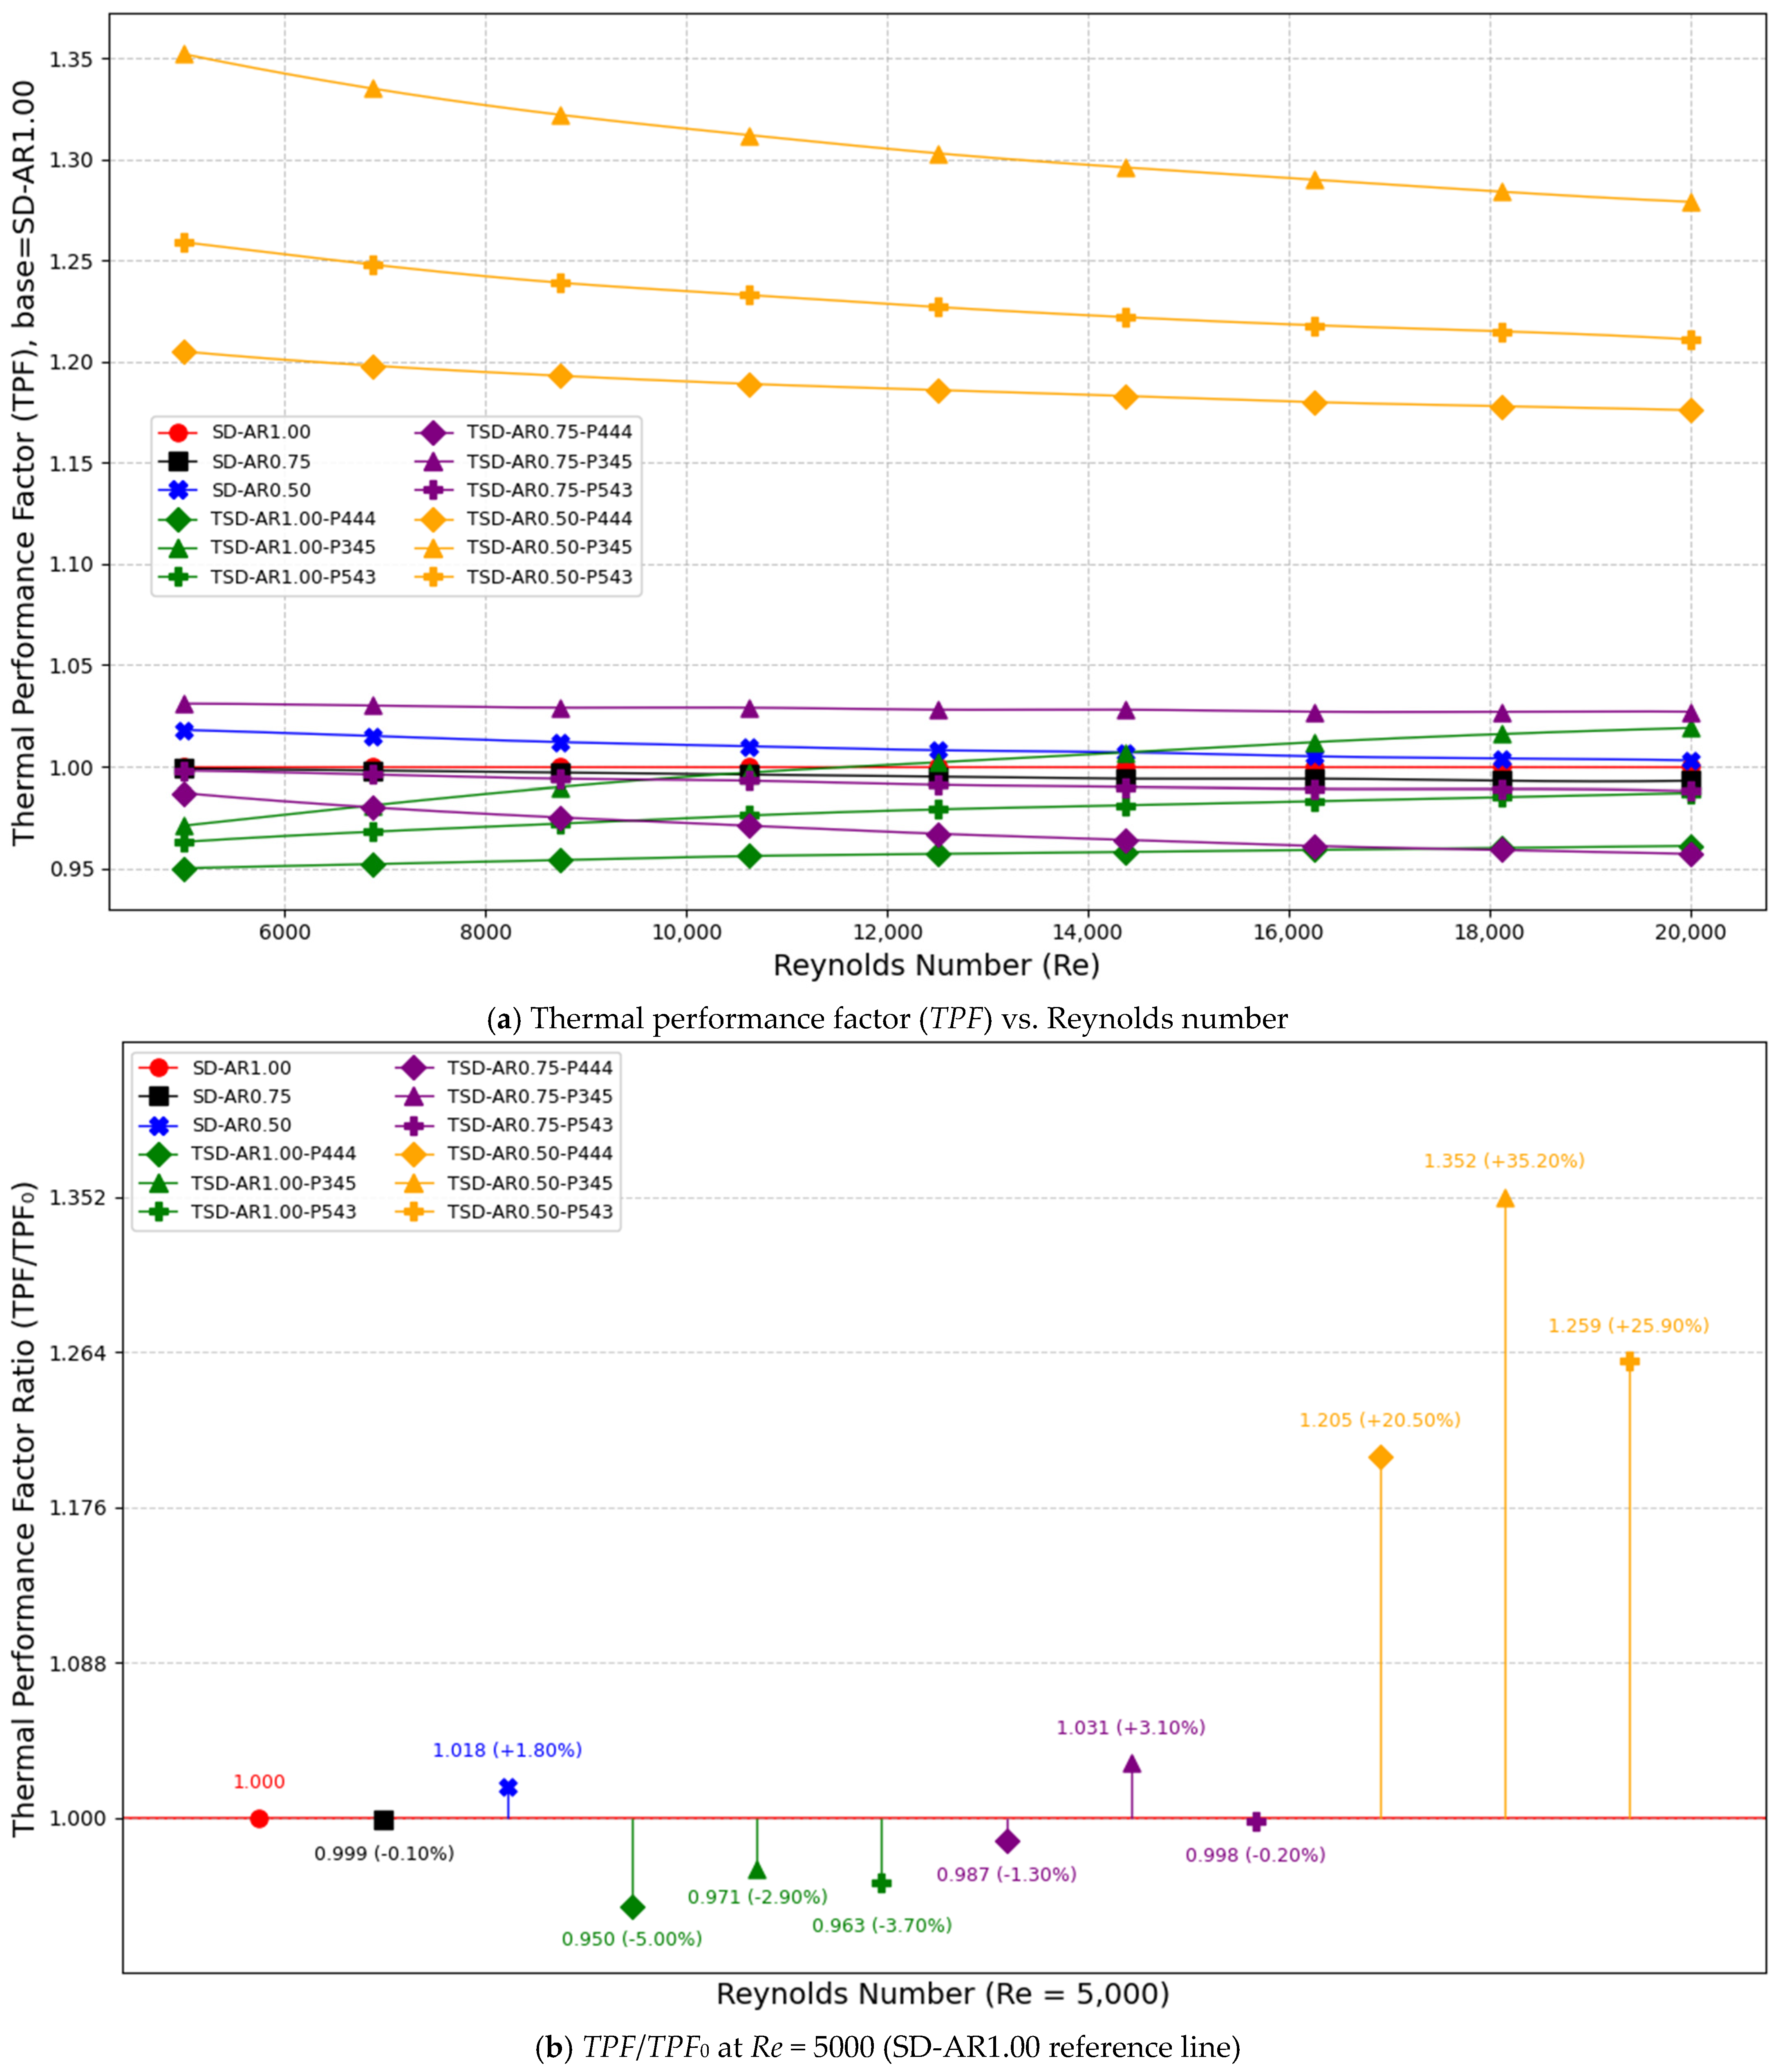
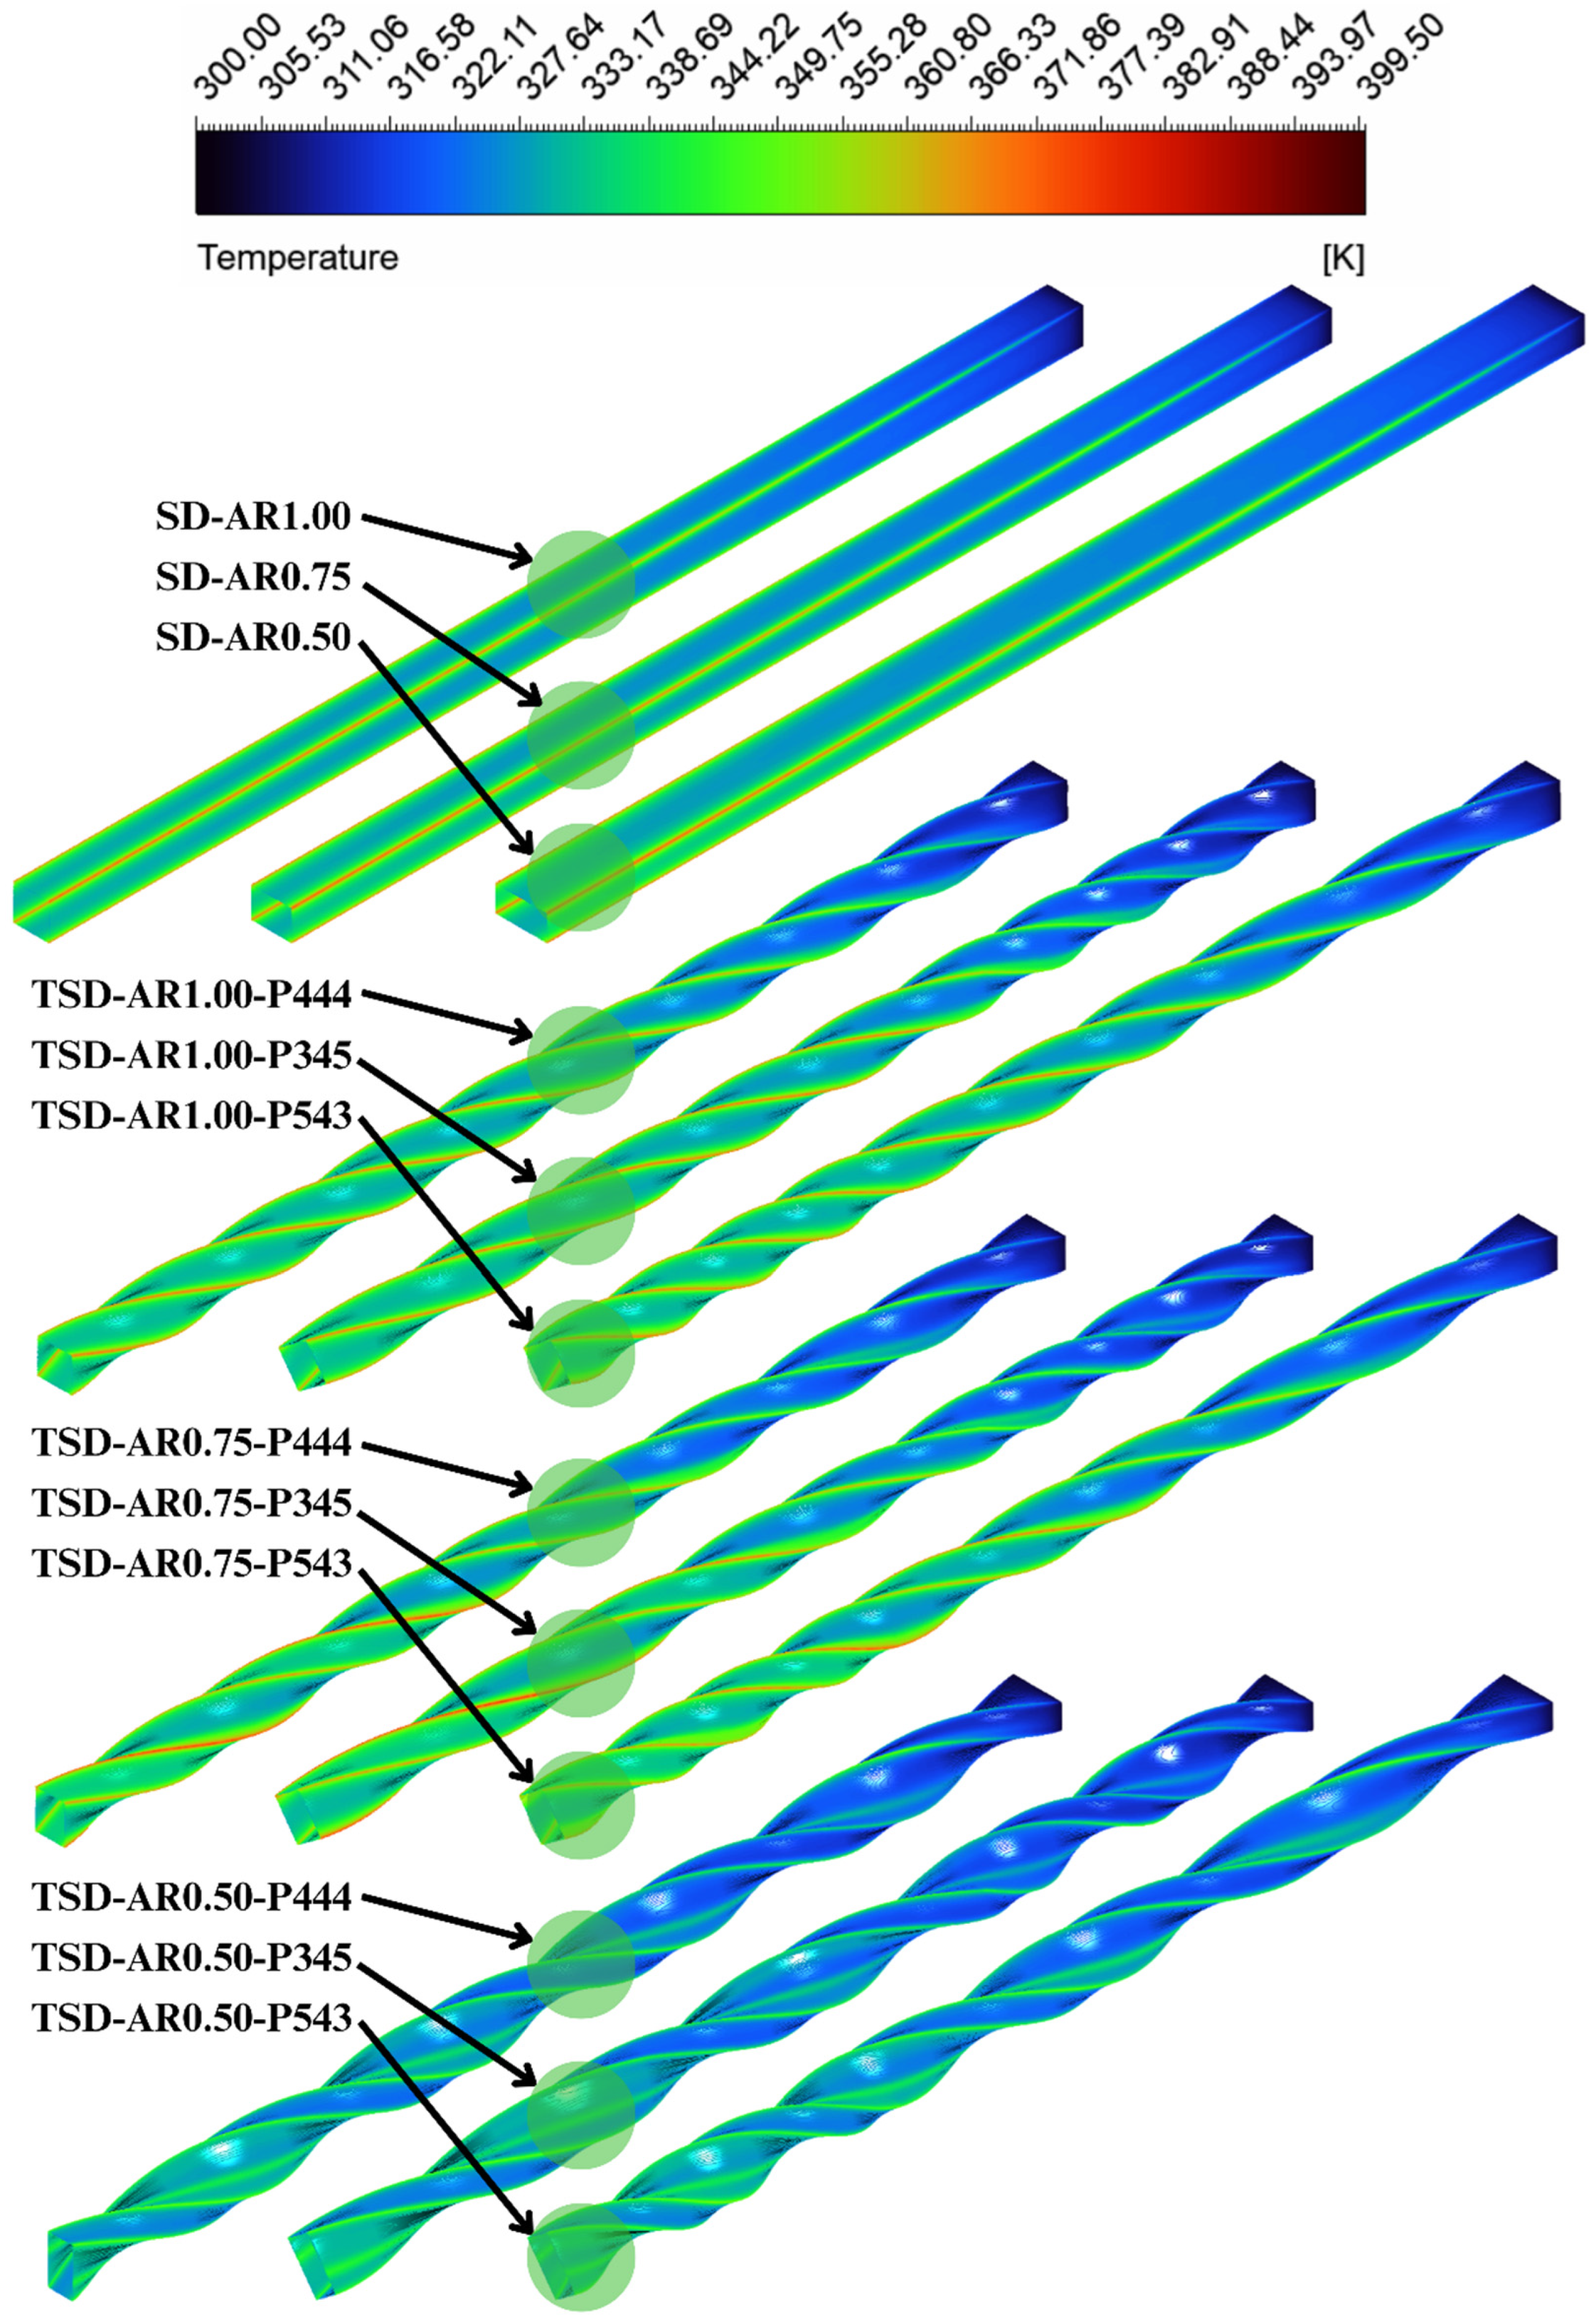
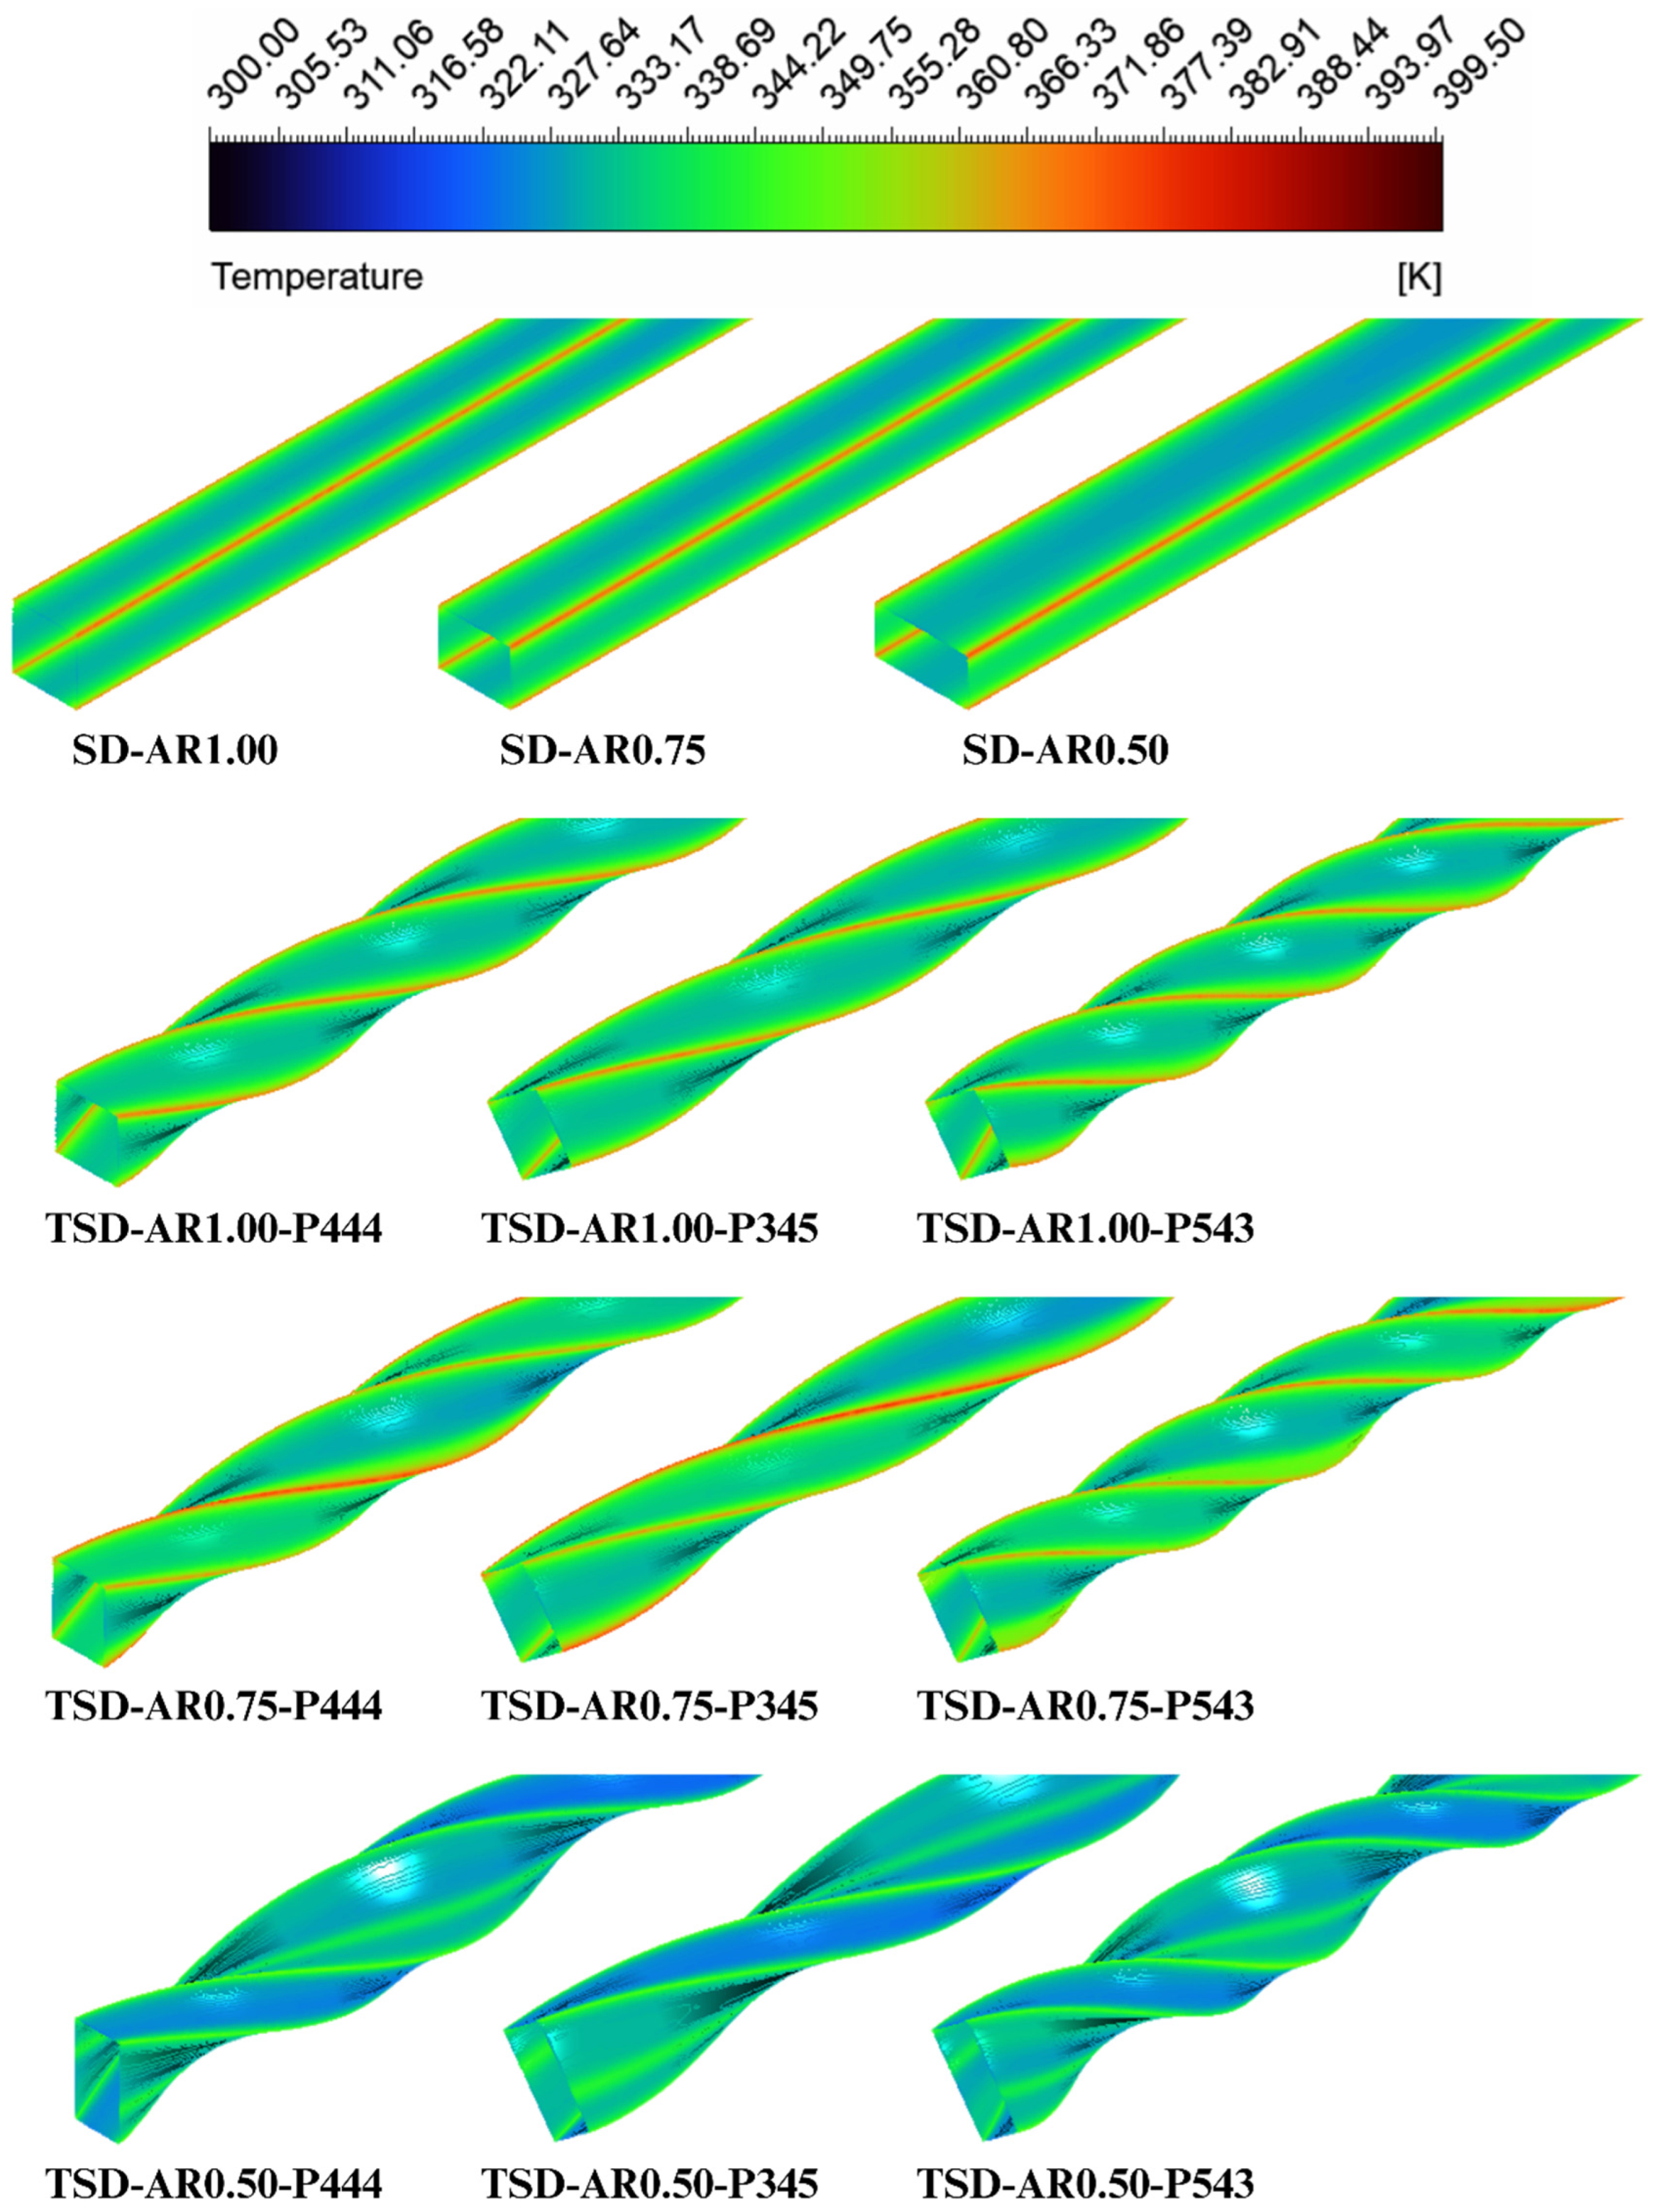
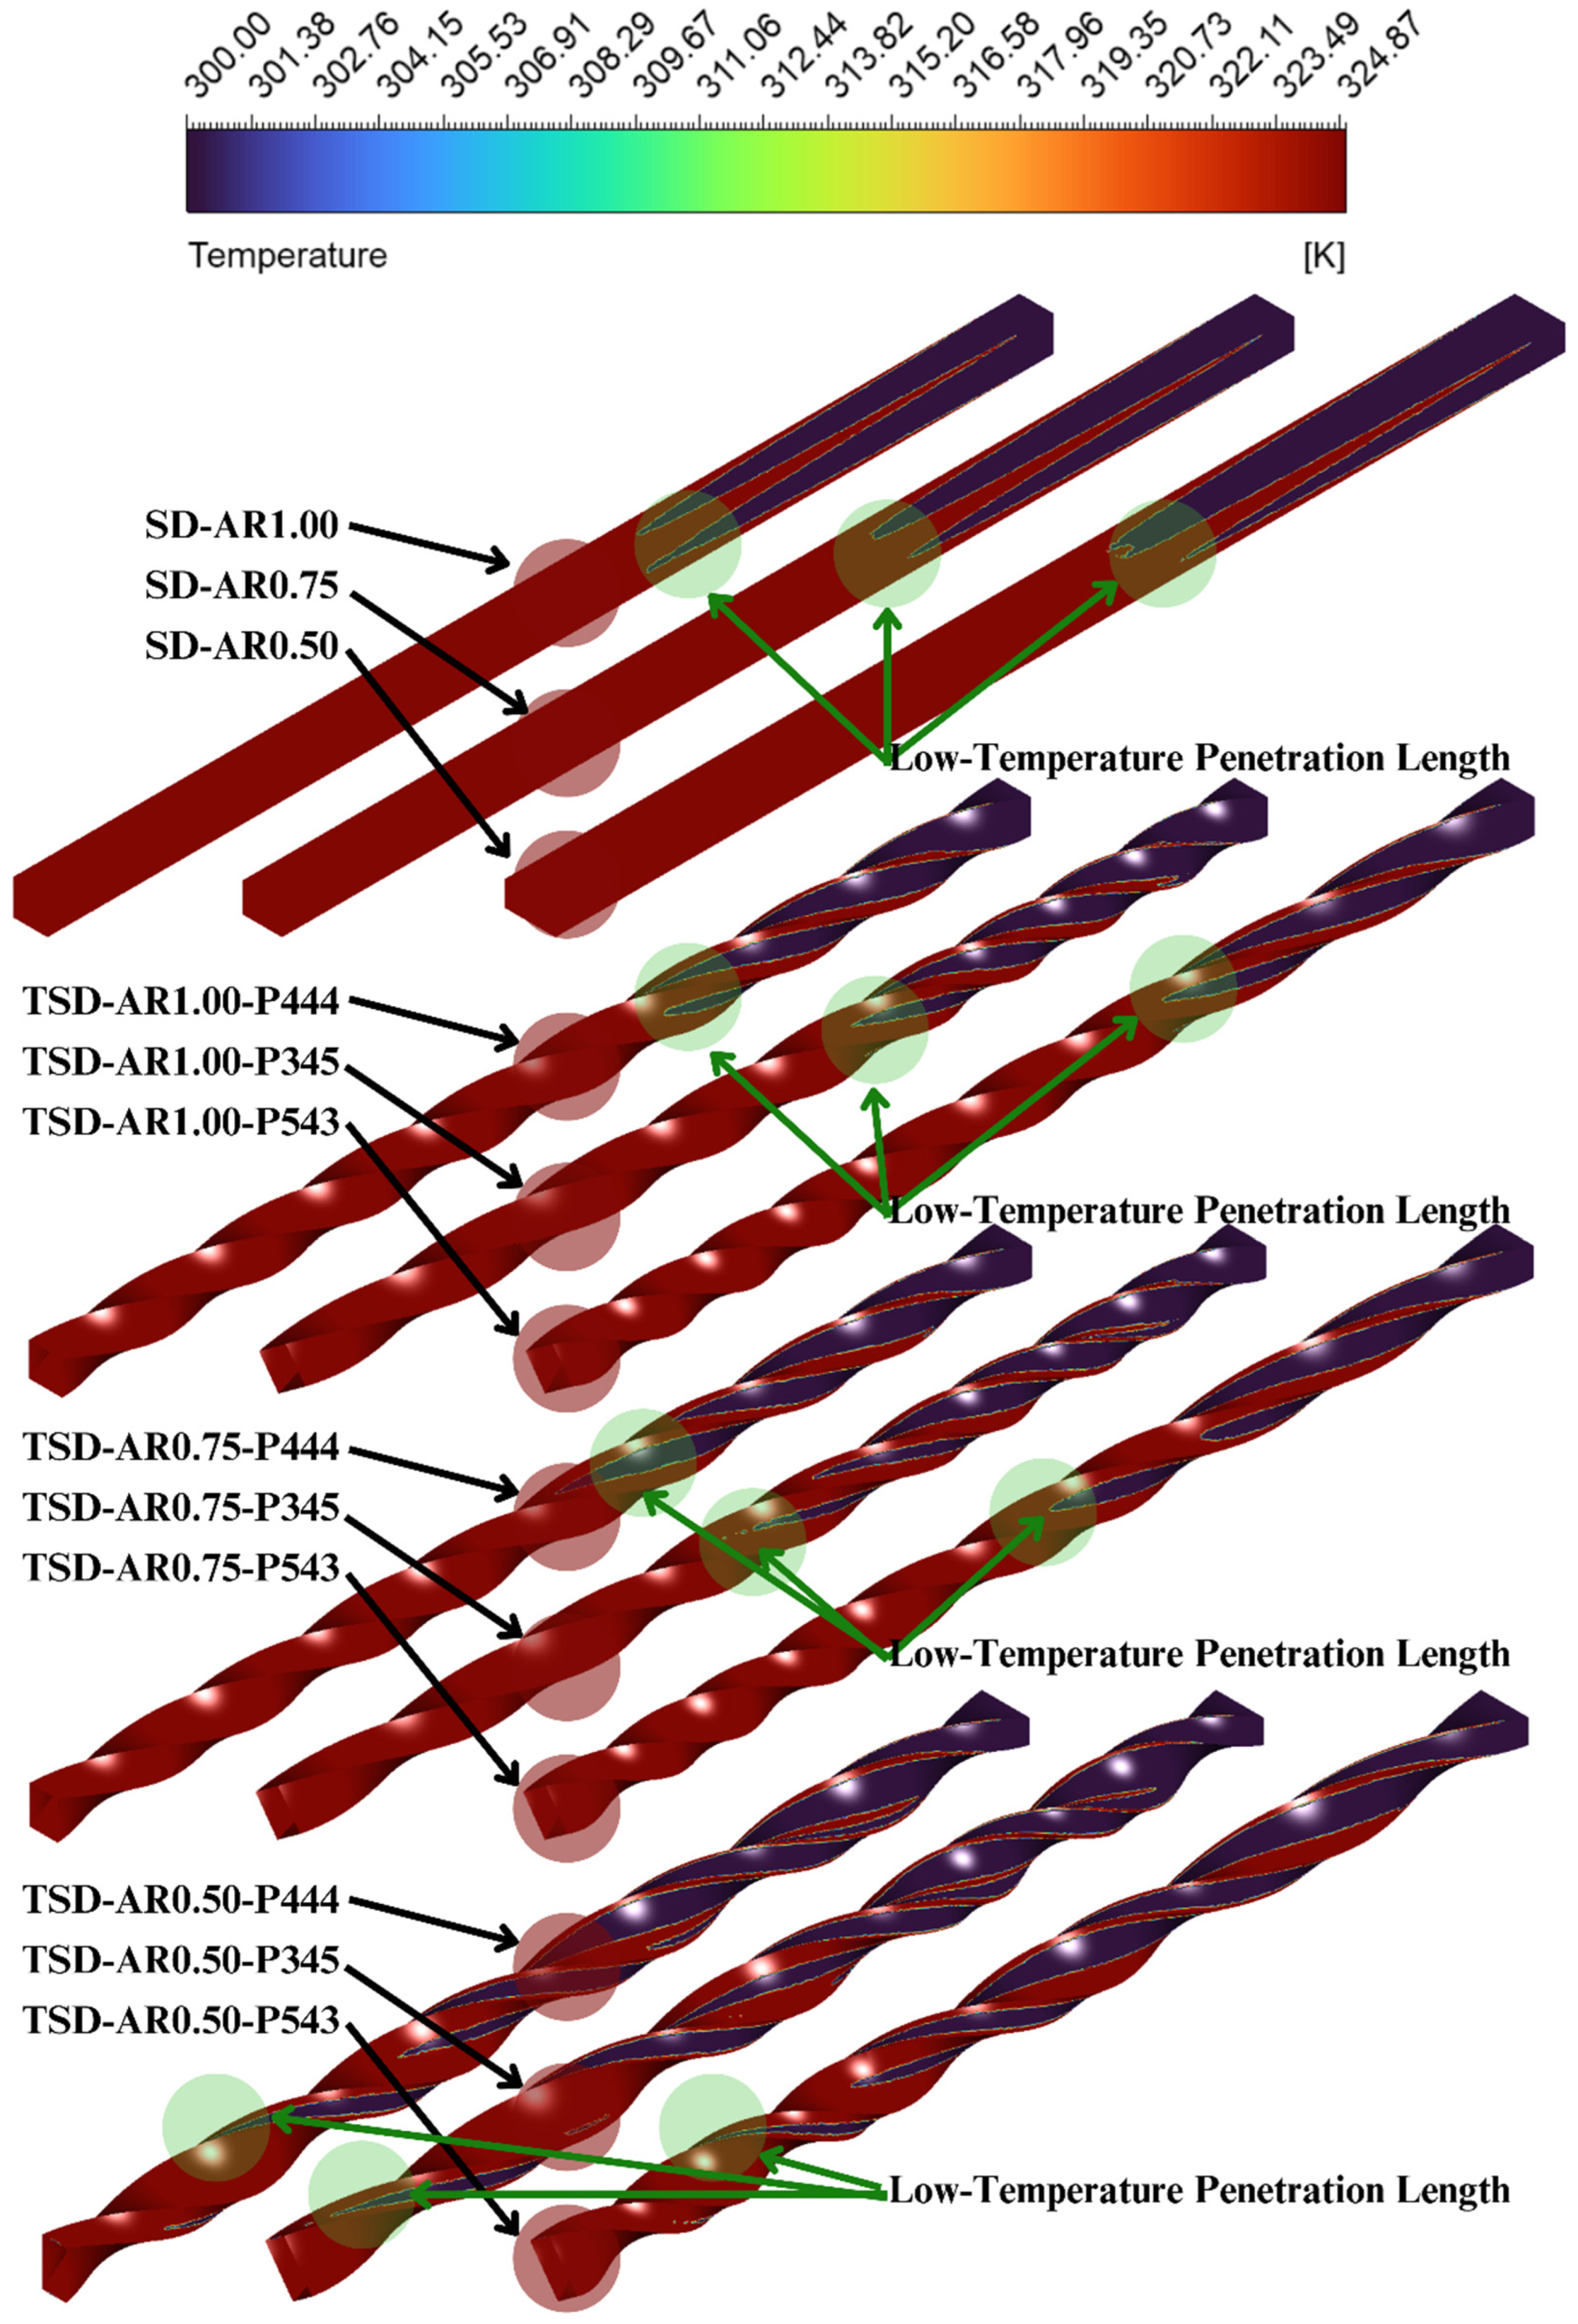
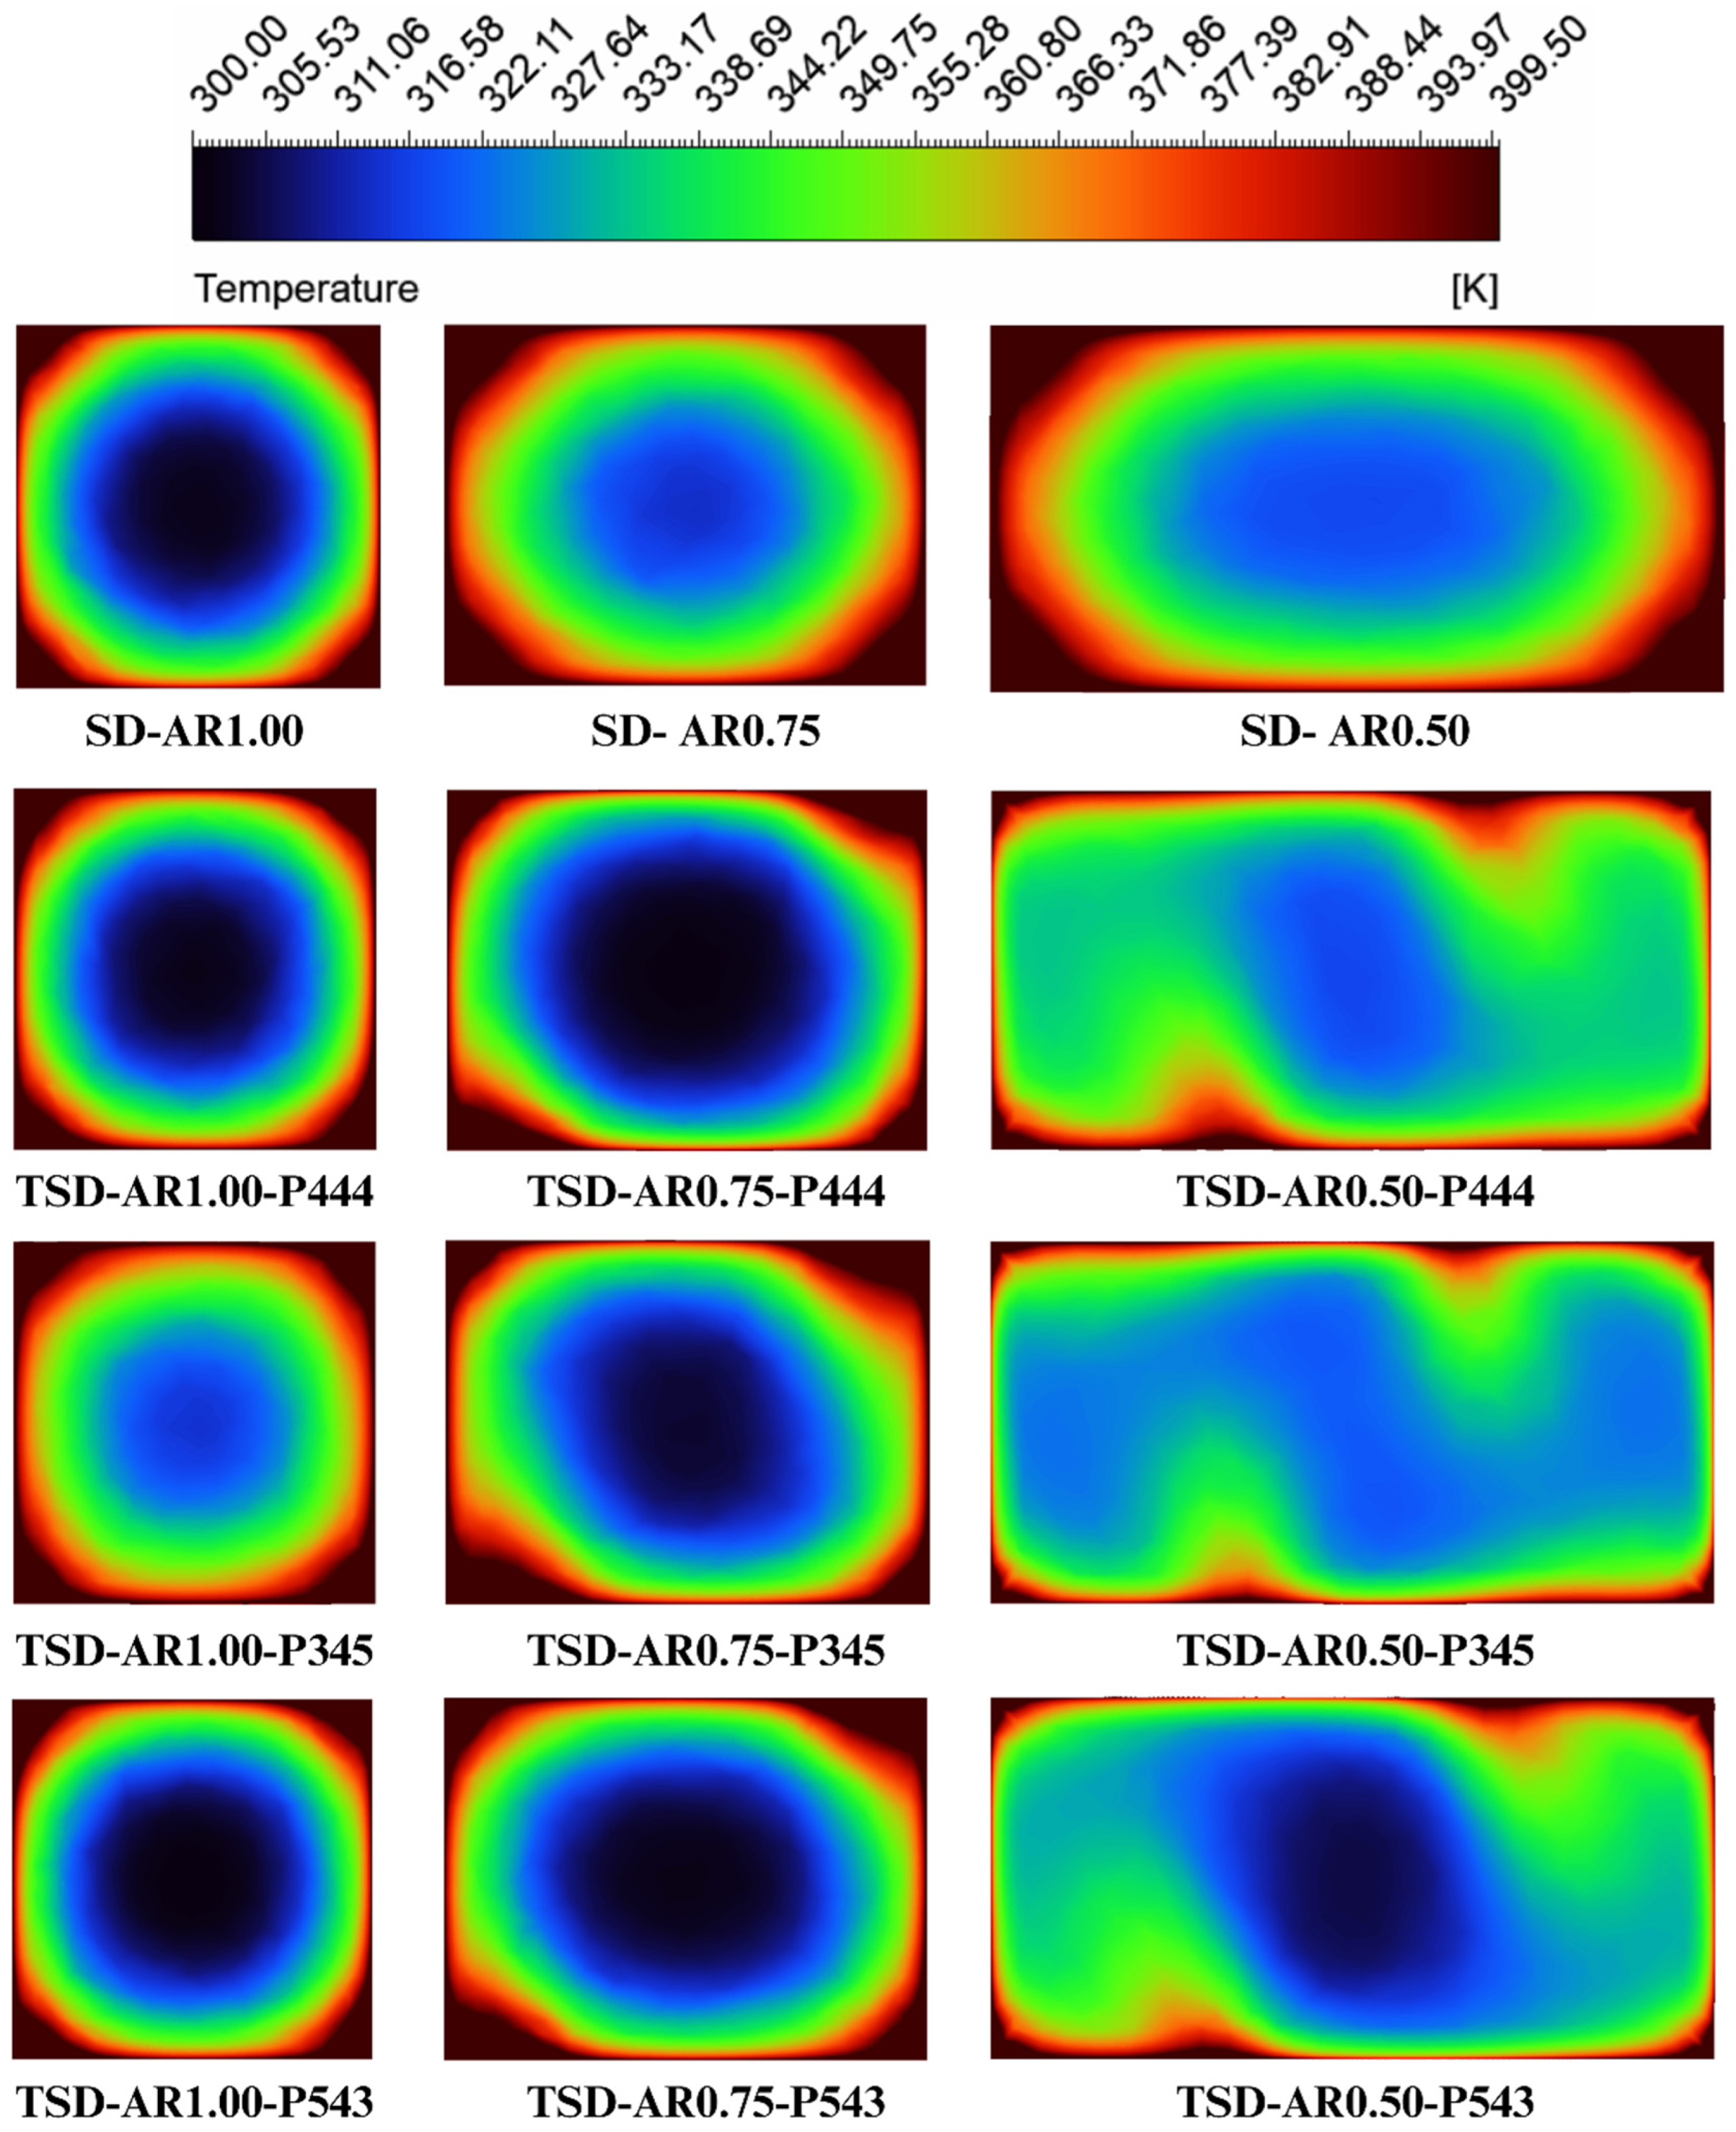
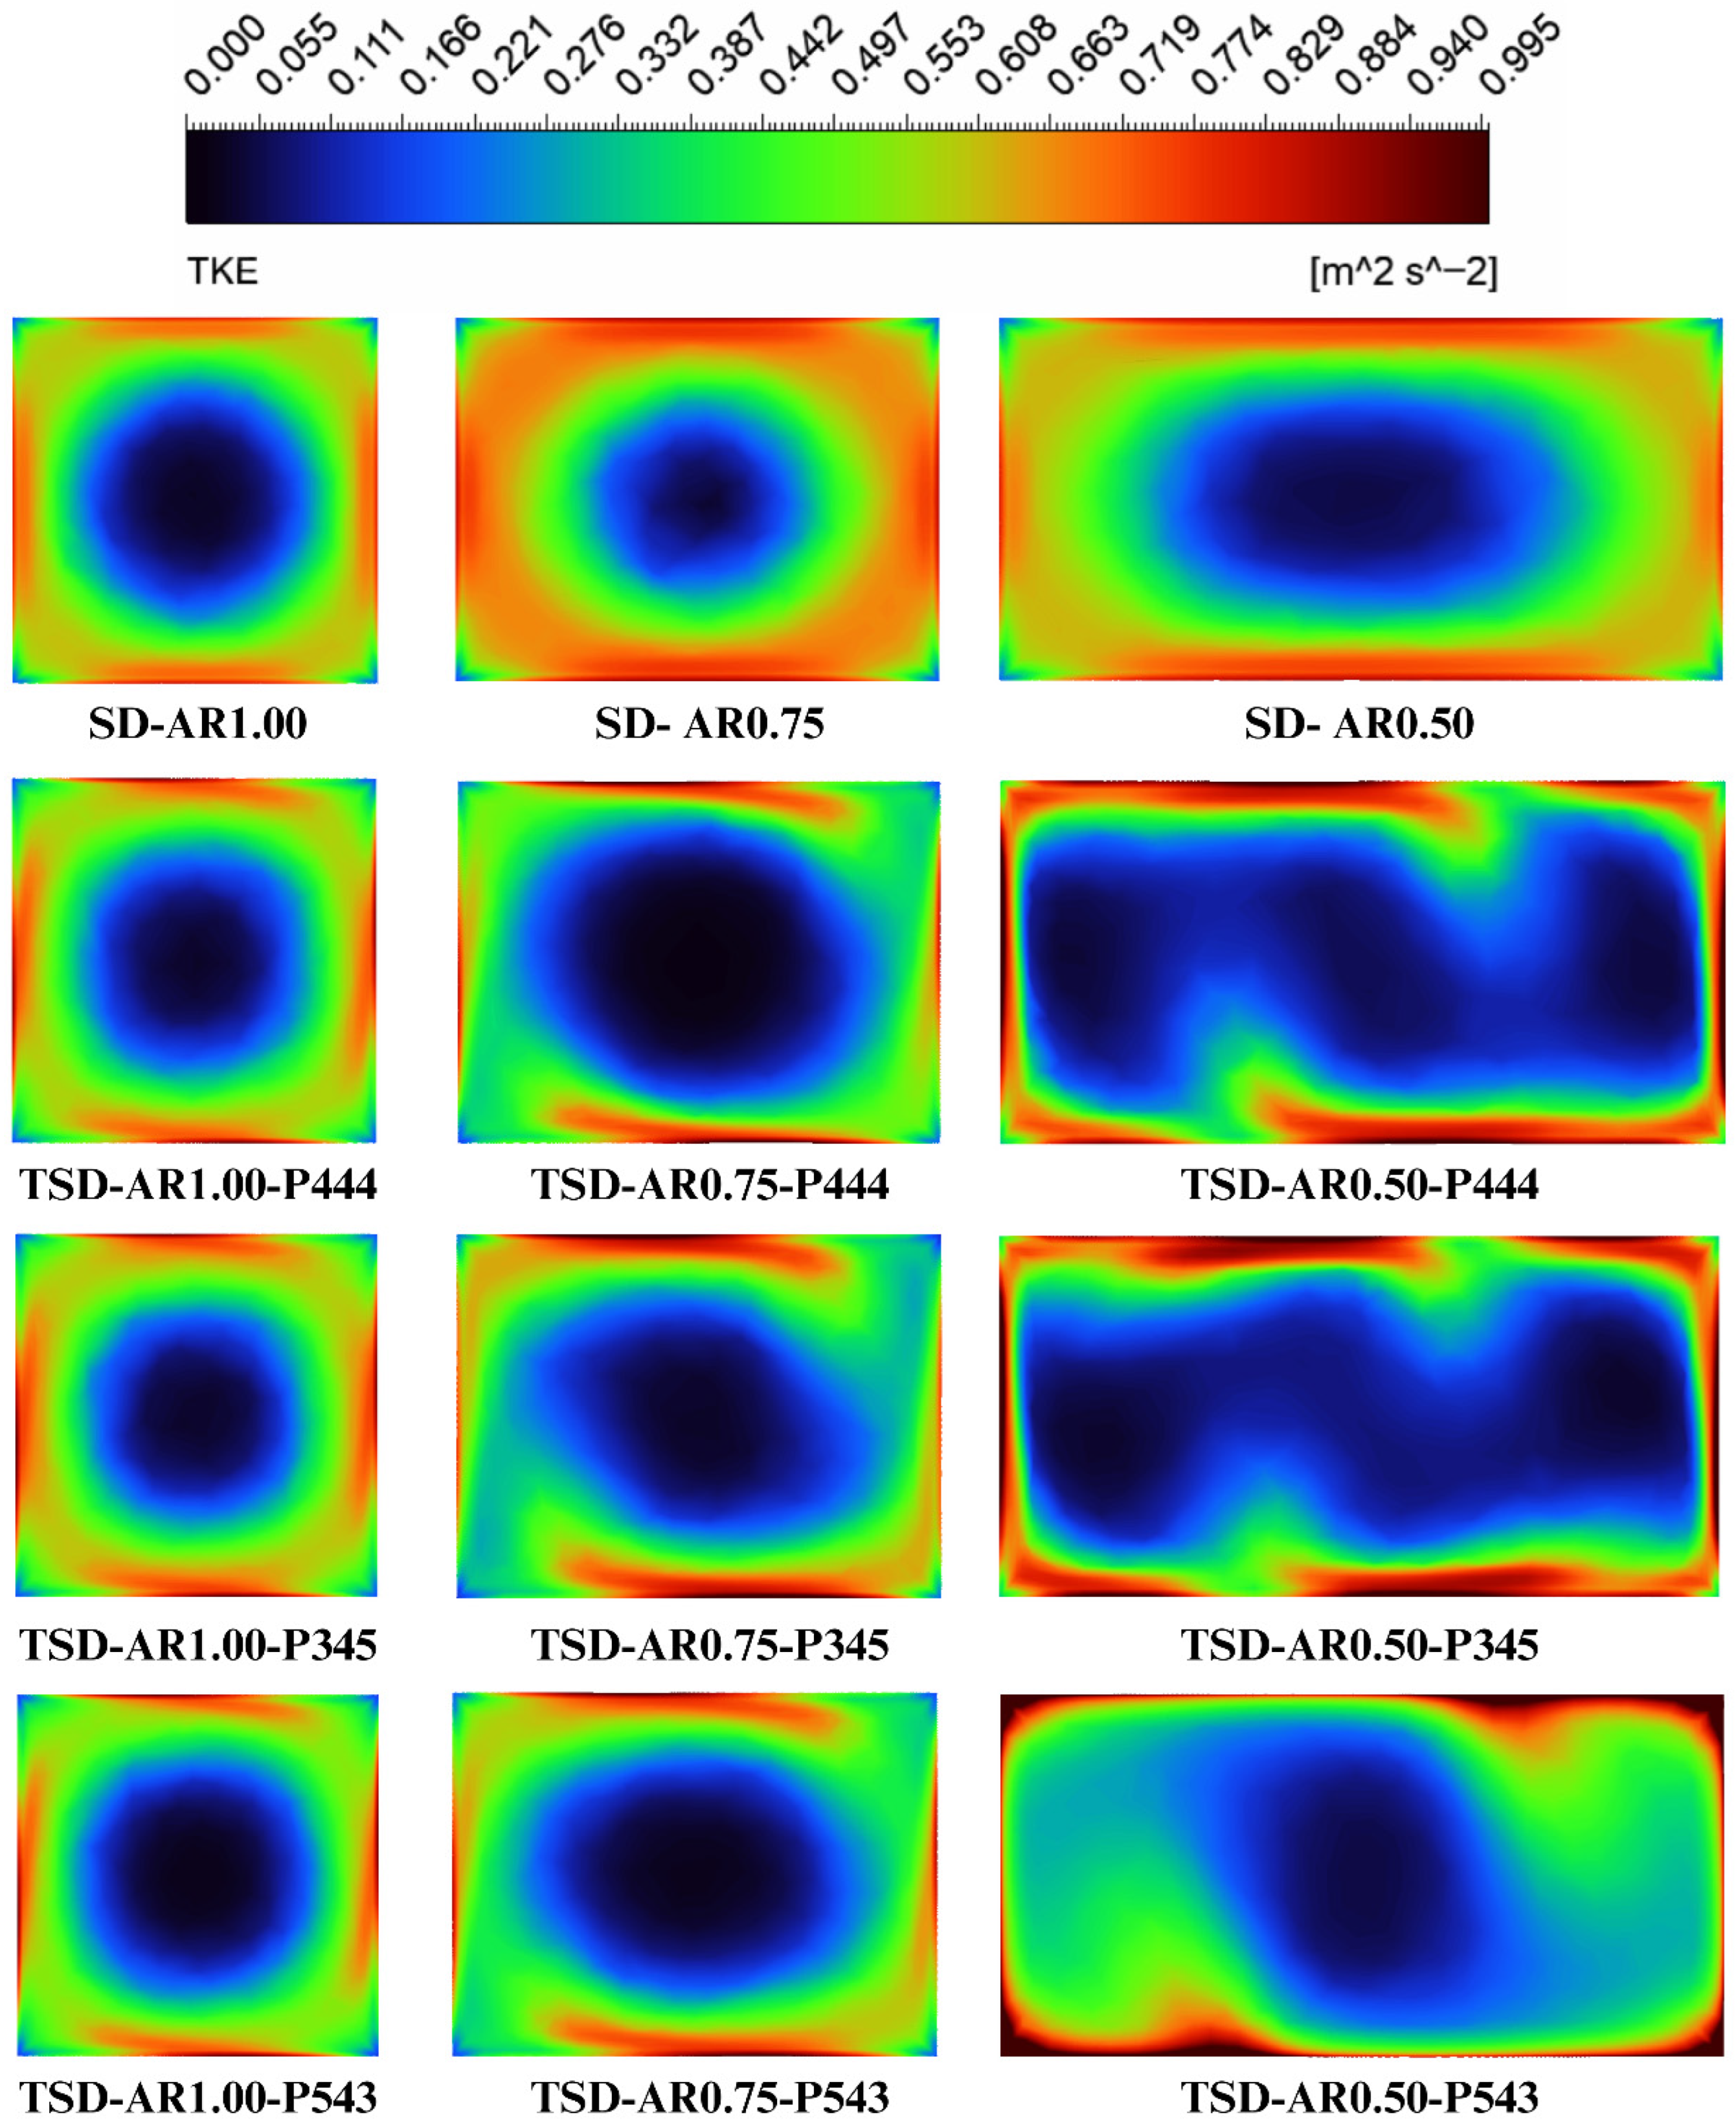
In this section is presented the effect of the gradient-pitch twisted square ducts with variable aspect ratio on Nusselt number (Figure 7a–c), friction factor (Figure 8a–c), thermal performance factor (Figure 9a,b), wall fluid temperature contours for full test section and enlarged outlet region (Figure 10 and Figure 11), high- and low-temperature regions over the full test section and highlighting the temperature penetration length (Figure 12), cross-sectional temperature contours at x/L = 0.8 (Figure 13), cross-sectional turbulent kinetic energy (TKE) contours at x/L = 0.8 (Figure 14), streamlines (velocity vectors) at x/L = 0.8 (Figure 15), entropy generation due to heat transfer (Figure 16, Figure 17 and Figure 18), Bejan number (Figure 19), and Exergy destruction rate (Figure 20).

4.1. Overall Trends with Reynolds Number

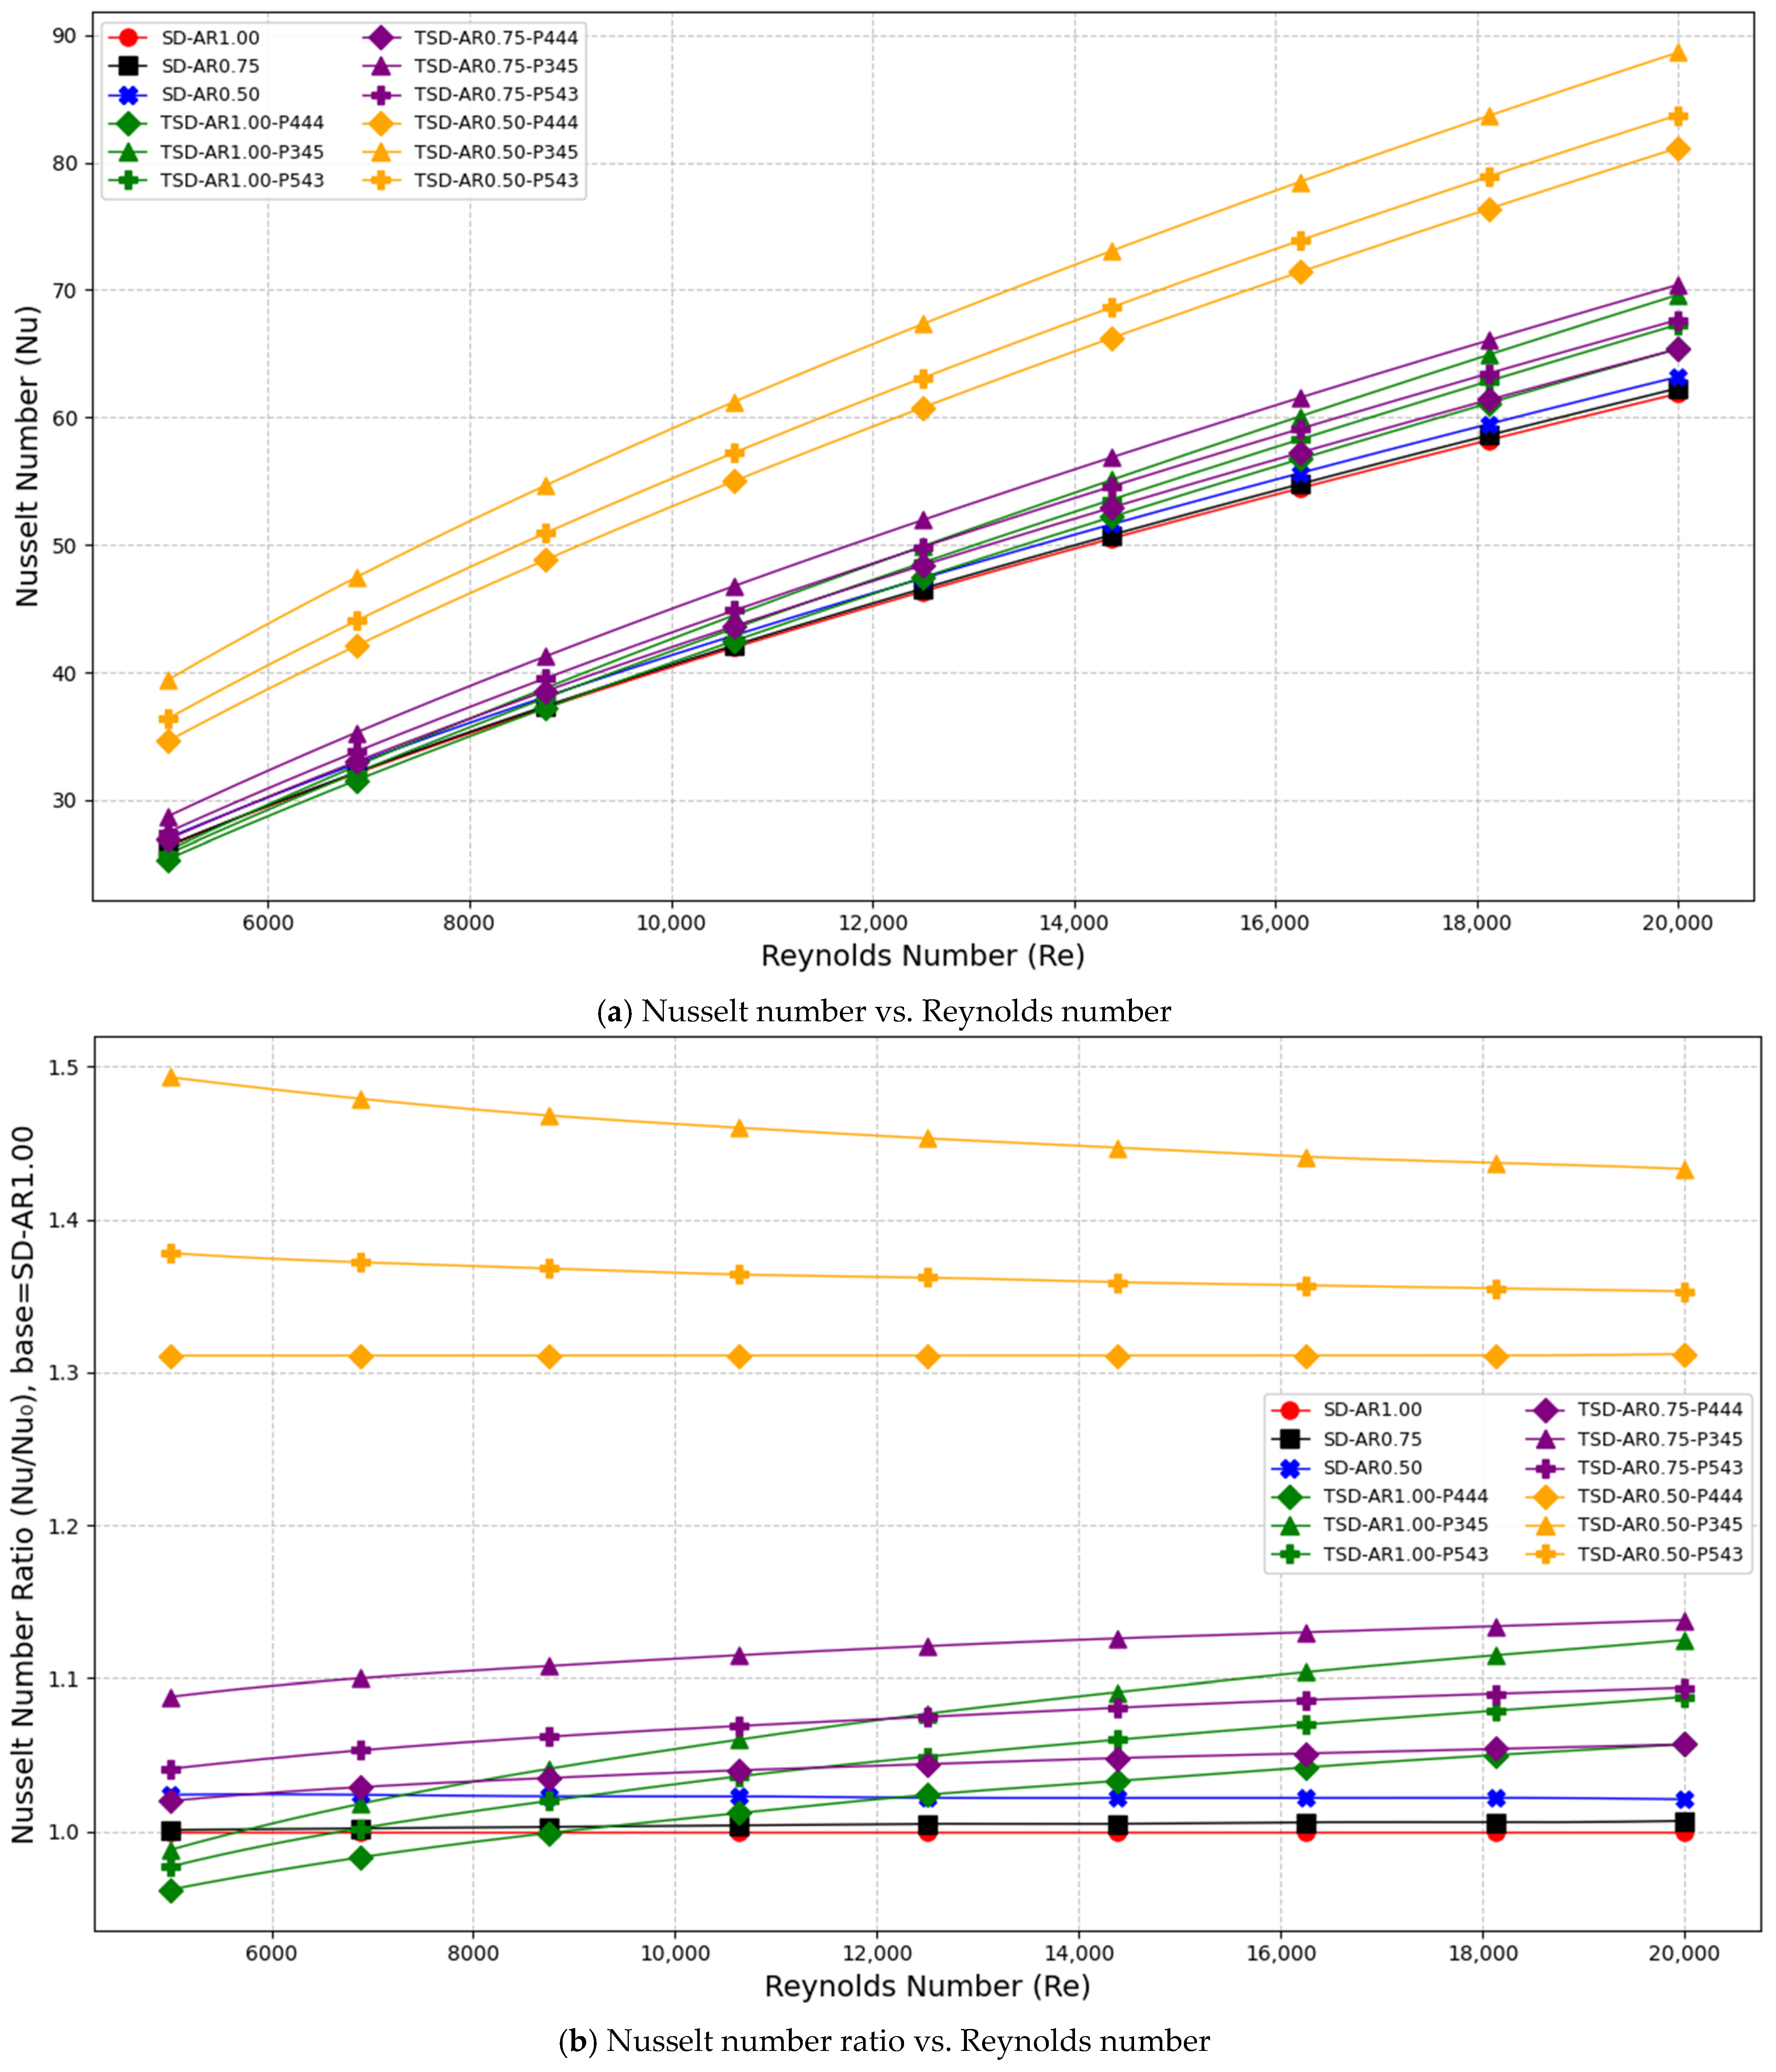
Across all cases, increasing Reynolds number strengthens forced convection and raises the Nusselt number, while the friction factor decreases with Reynolds number as shown in Figure 7, Figure 8 and Figure 9. This basic trend is observed for both straight ducts (SD) and twisted ducts (TSD). Using the global baseline SD-AR1.00, the Nusselt number increases from Nu = 26.39 at Re = 5000 to Nu = 61.86 at Re = 20,000 (about +134%). In contrast, the friction factor decreases from f = 0.075 to f = 0.0378 (about −50%). These trends are consistent with turbulent internal flow, where a higher Reynolds number intensifies mixing and reduces the relative effect of viscous resistance in the friction-factor definition. The overall spread among all geometries also becomes clear from the endpoints. At Re = 5000, Nu ranges from 25.39 (TSD-AR1.00-P444) to 39.39 (TSD-AR0.50-P345). At Re = 20,000, Nu ranges from 61.86 (SD-AR1.00) to 88.62 (TSD-AR0.50-P345). For pressure loss, f ranges from 0.075 to 0.1009 at Re = 5000, and from 0.0378 to 0.0531 at Re = 20,000, with the largest f again occurring for TSD-AR0.50-P345. In normalized form relative to SD-AR1.00, Nu/Nu0 spans 0.962–1.493 at Re = 5000 and 1.0–1.433 at Re = 20,000, while f/f0 spans 1.0–1.345 at Re = 5000 and 1.0–1.405 at Re = 20,000. These ranges already indicate the expected trade-off: stronger enhancement is accompanied by higher pressure penalties.
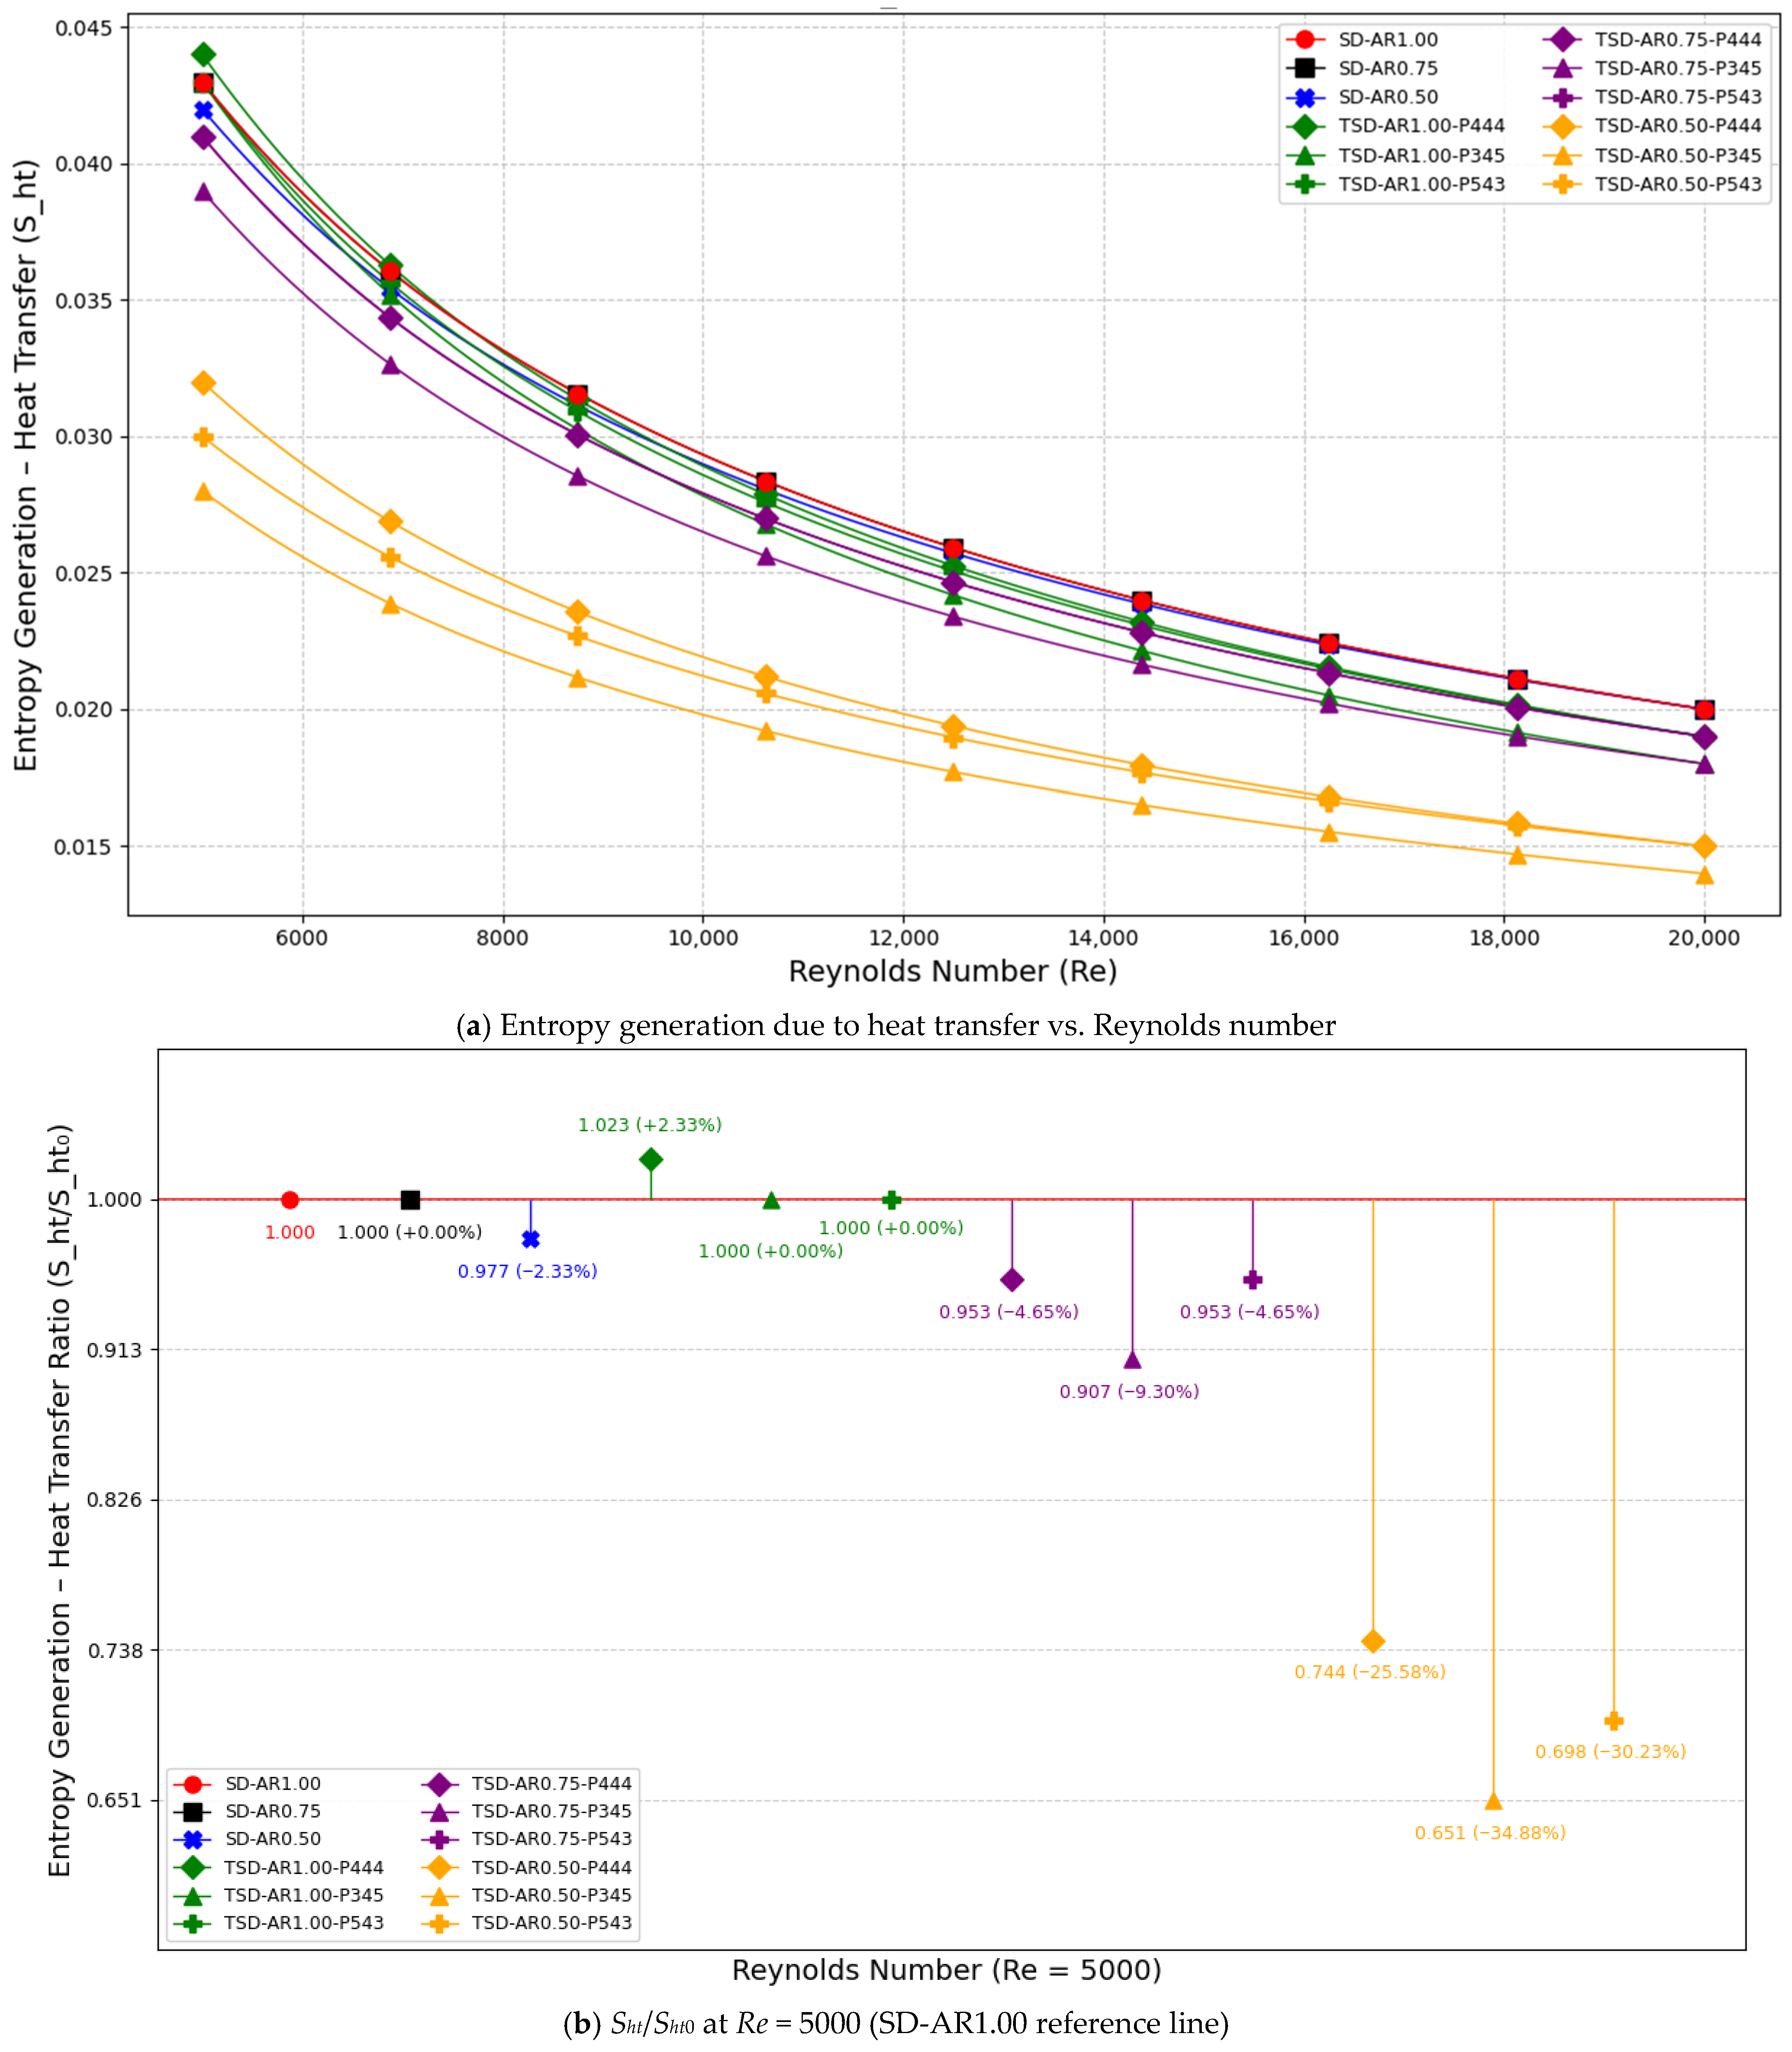
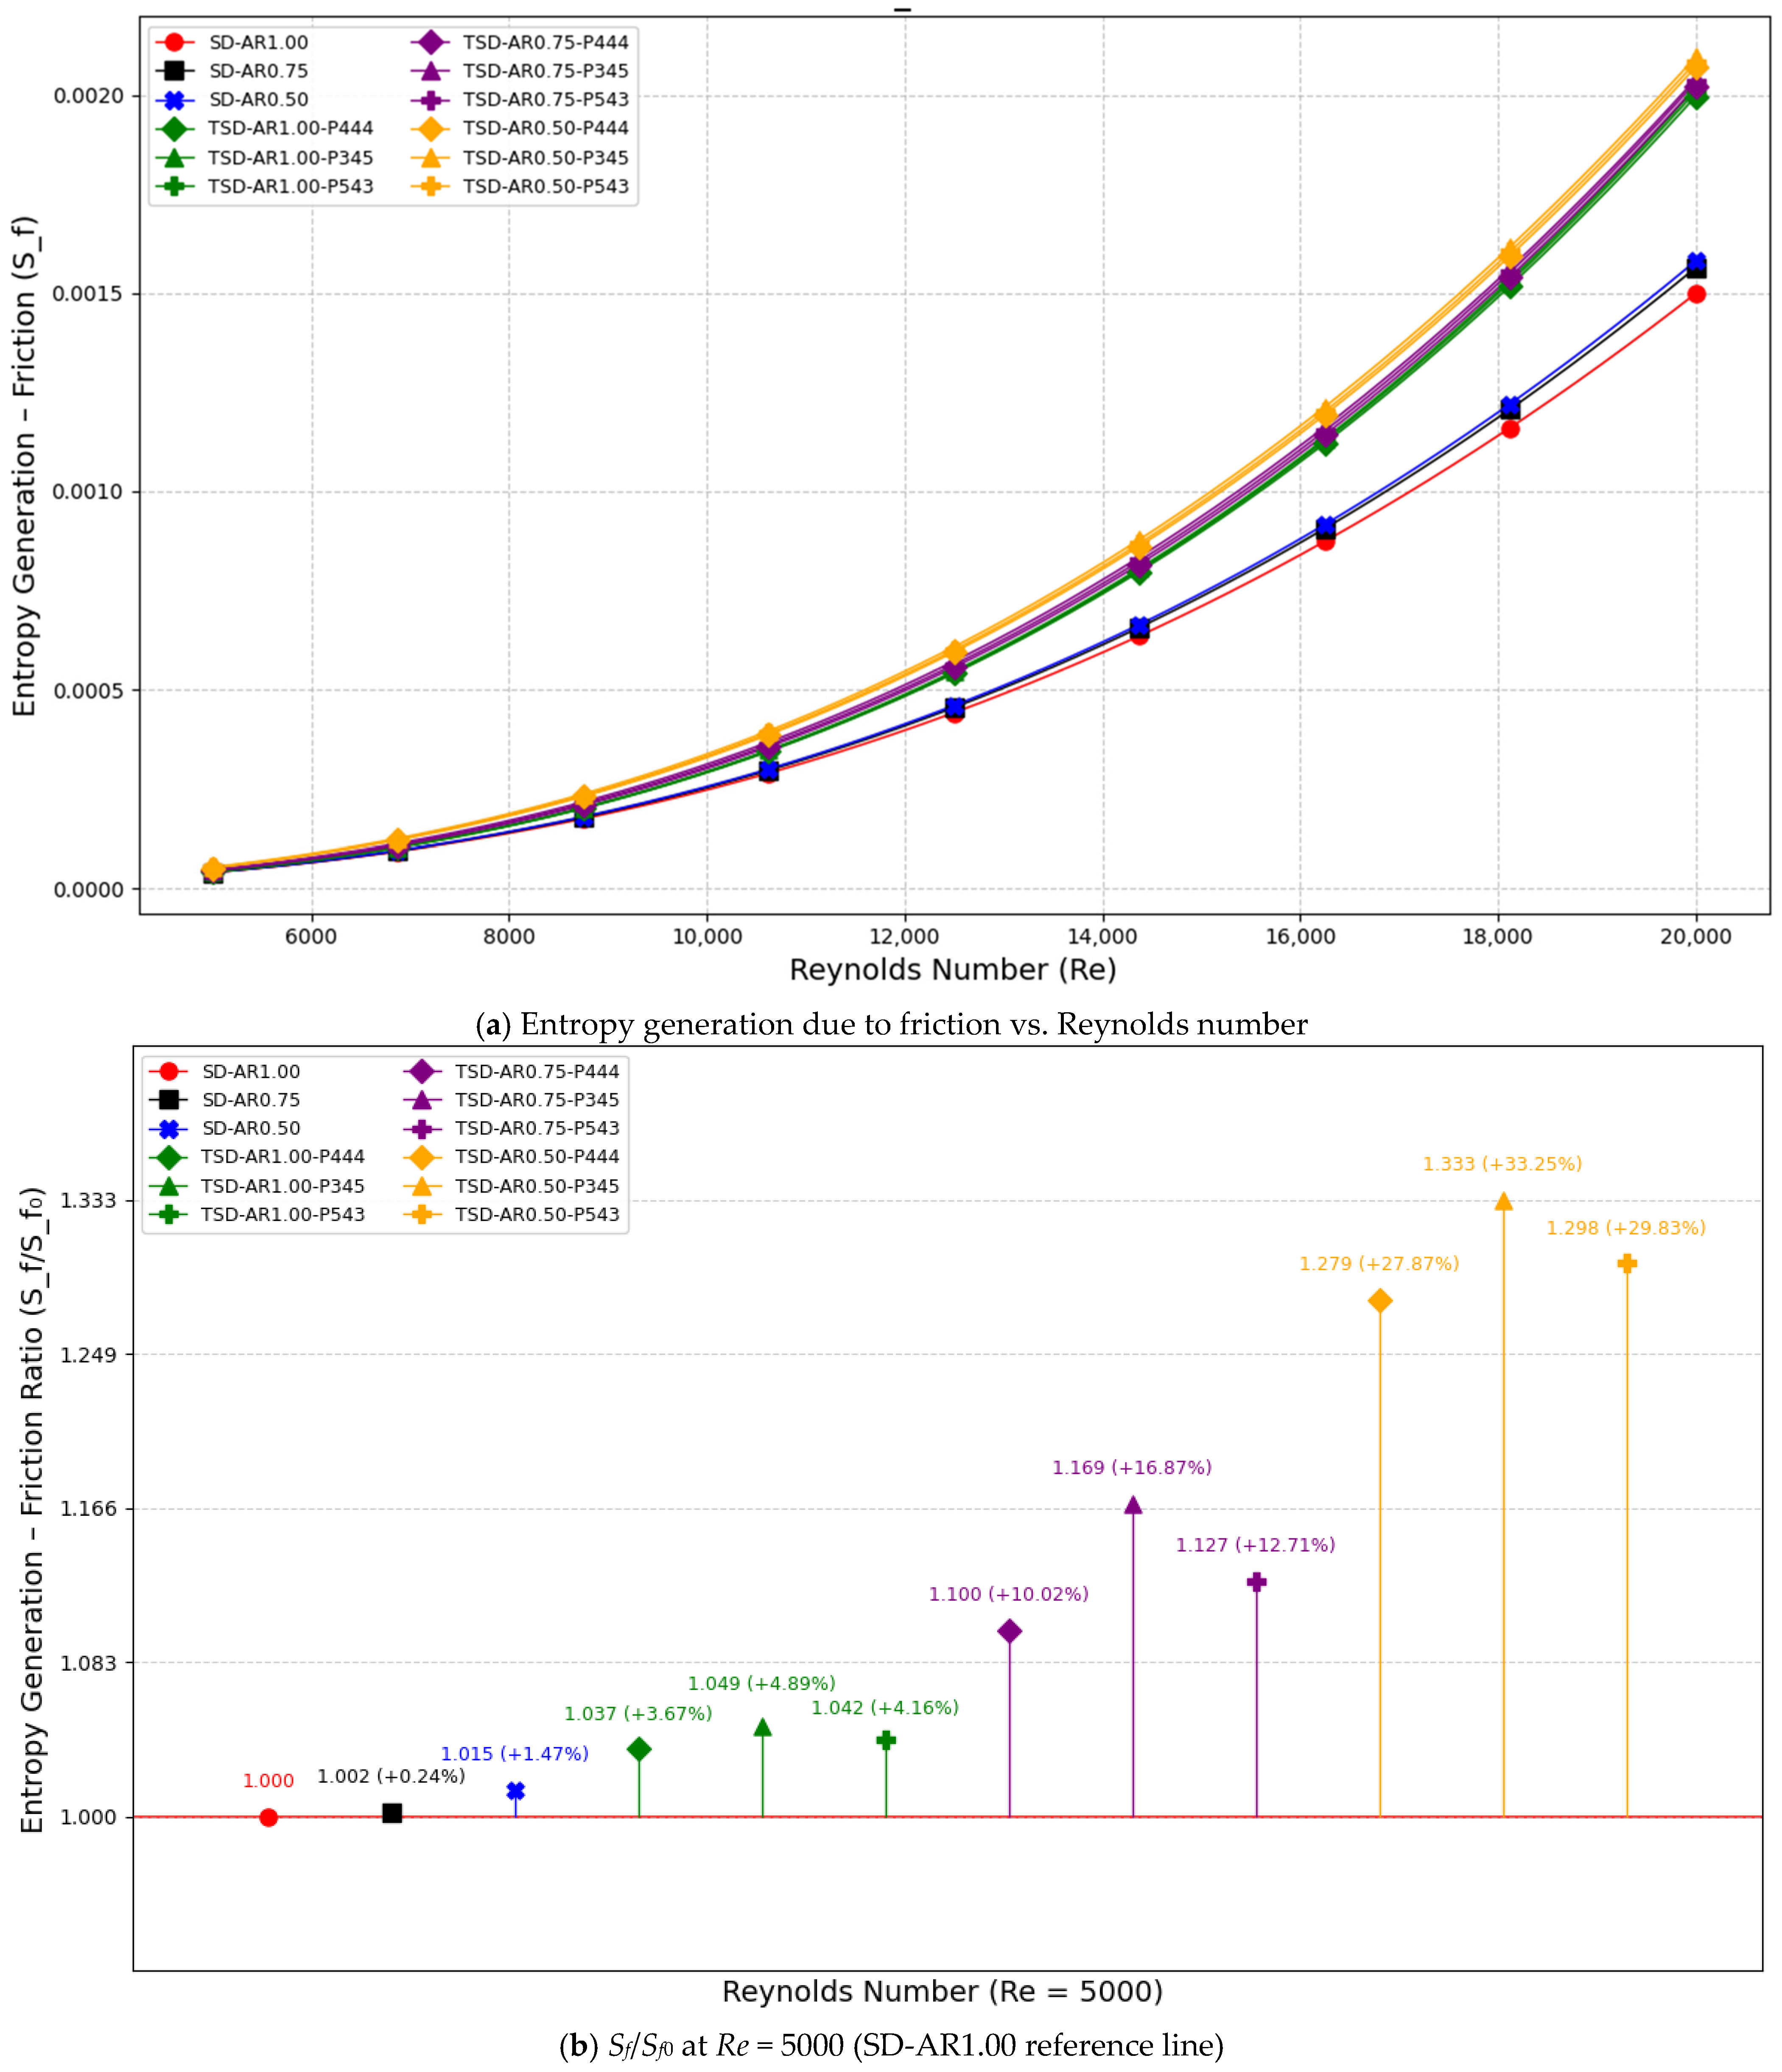
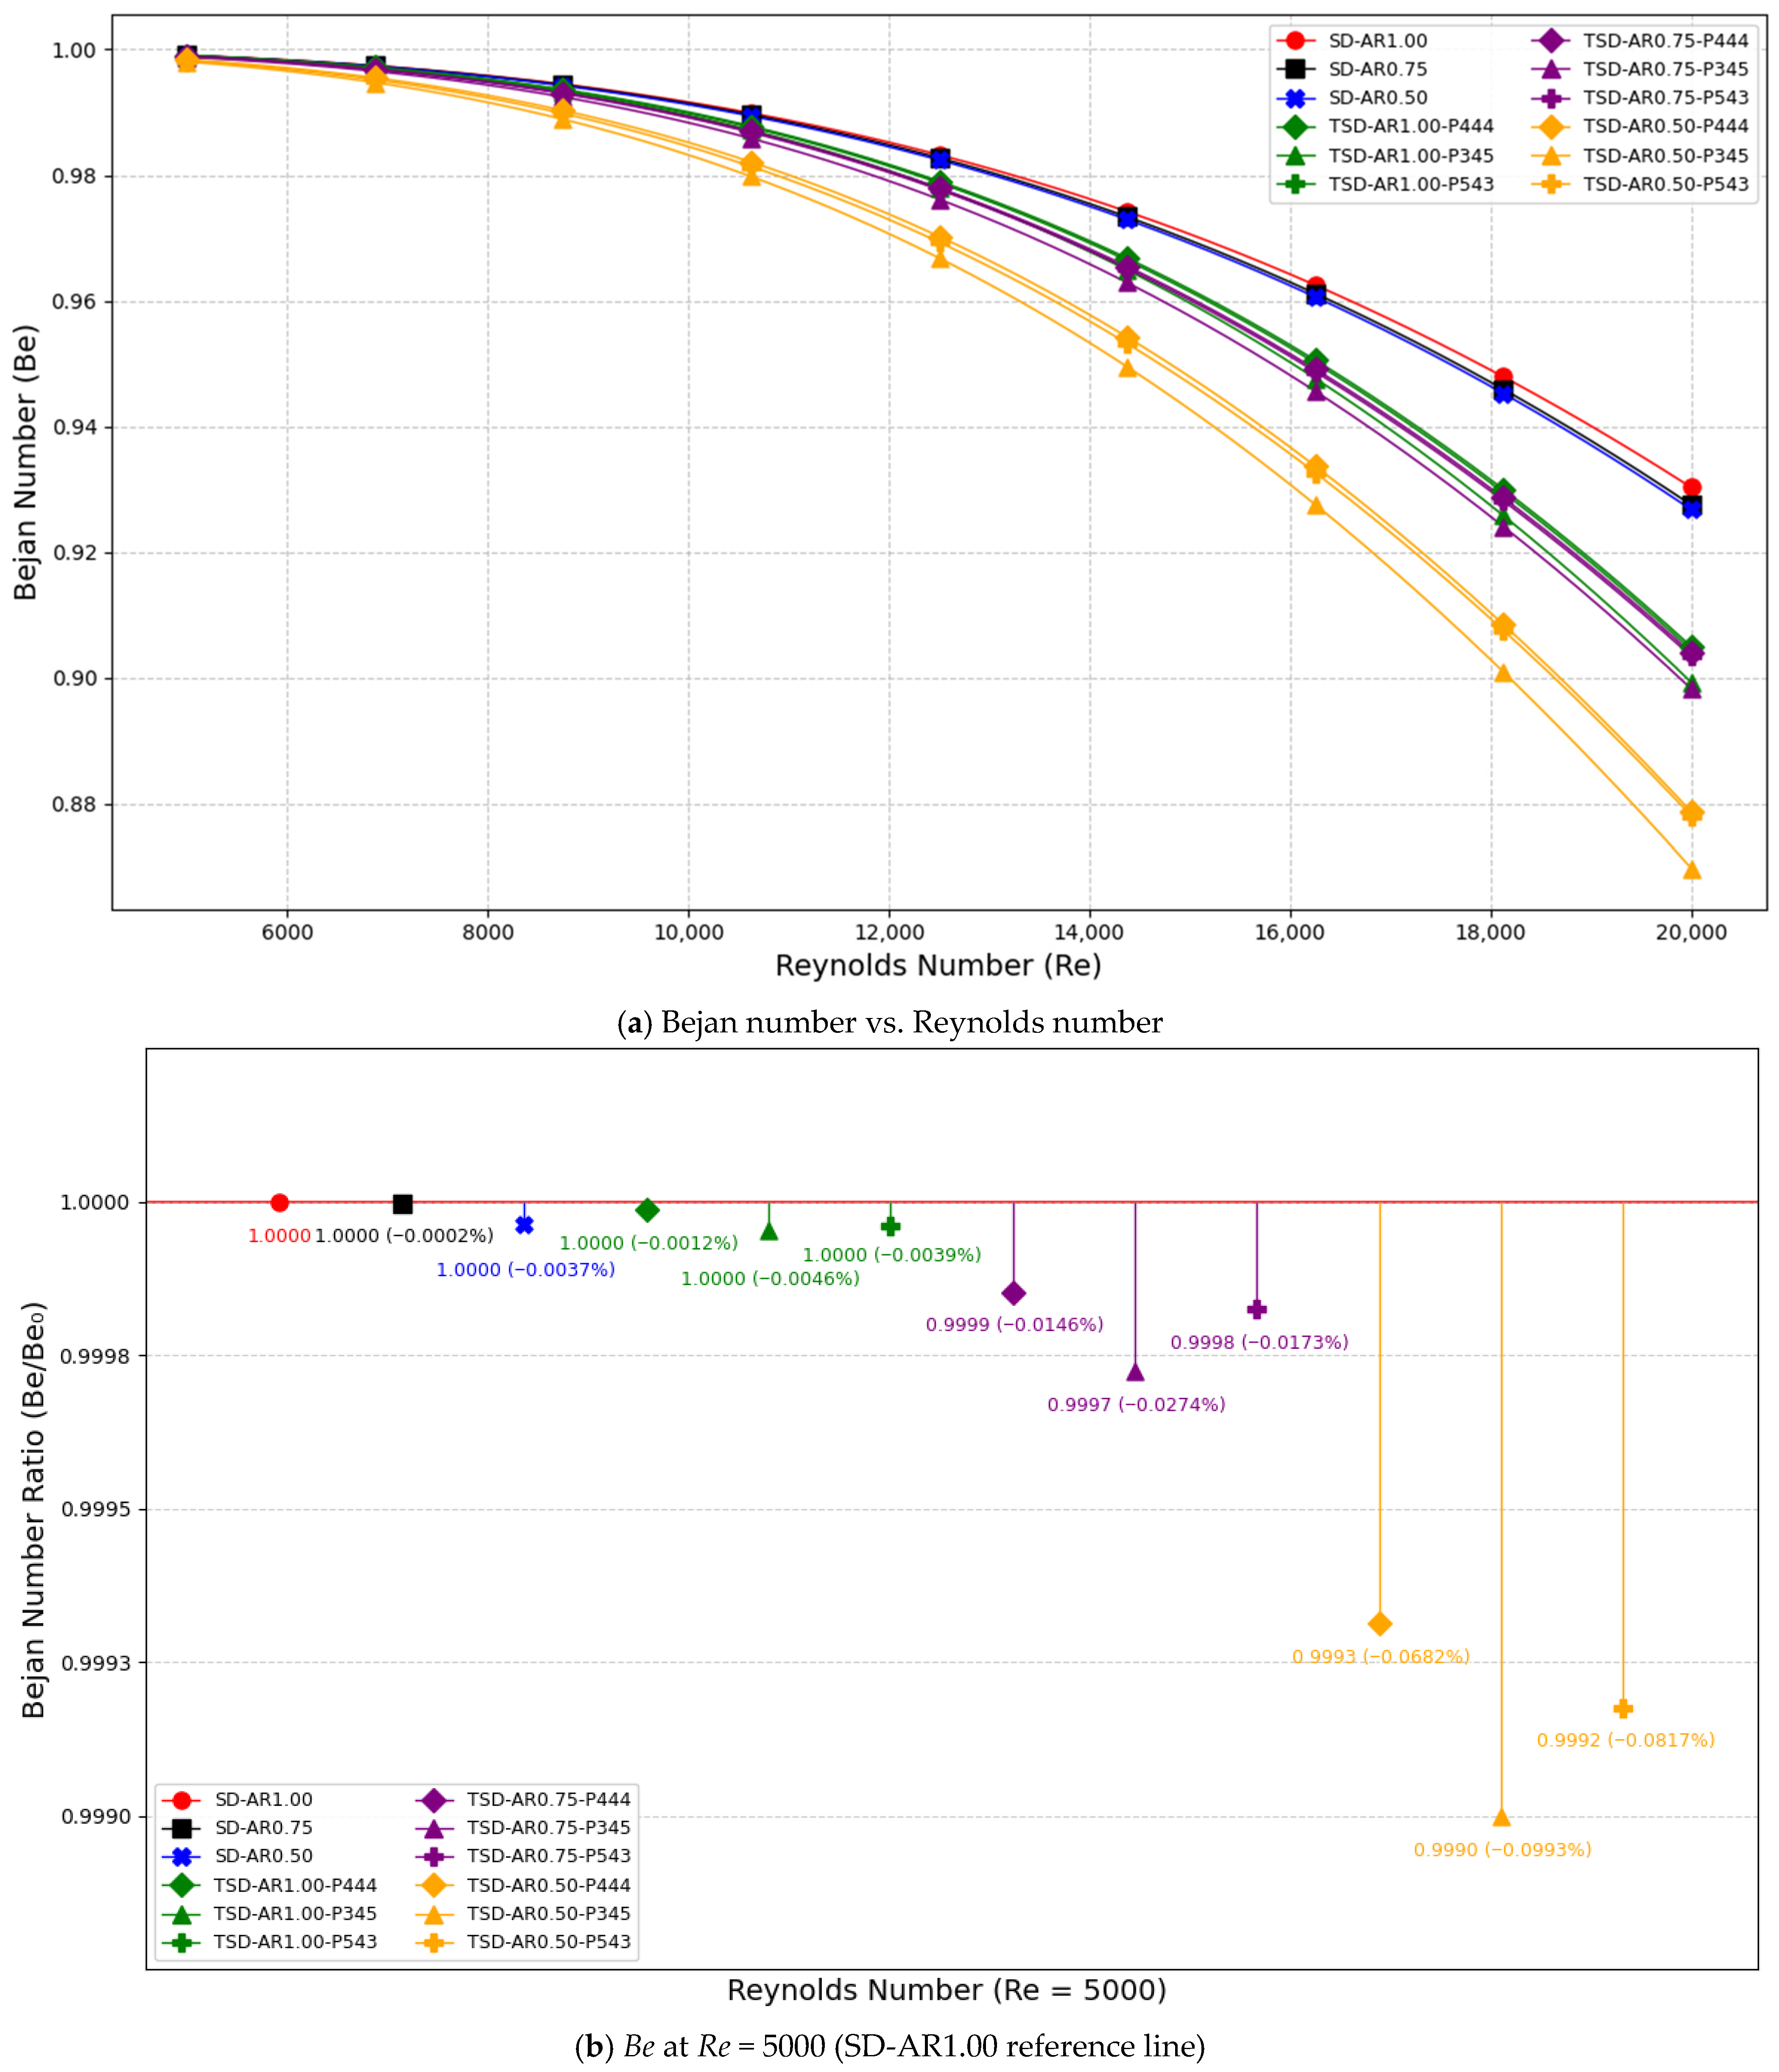
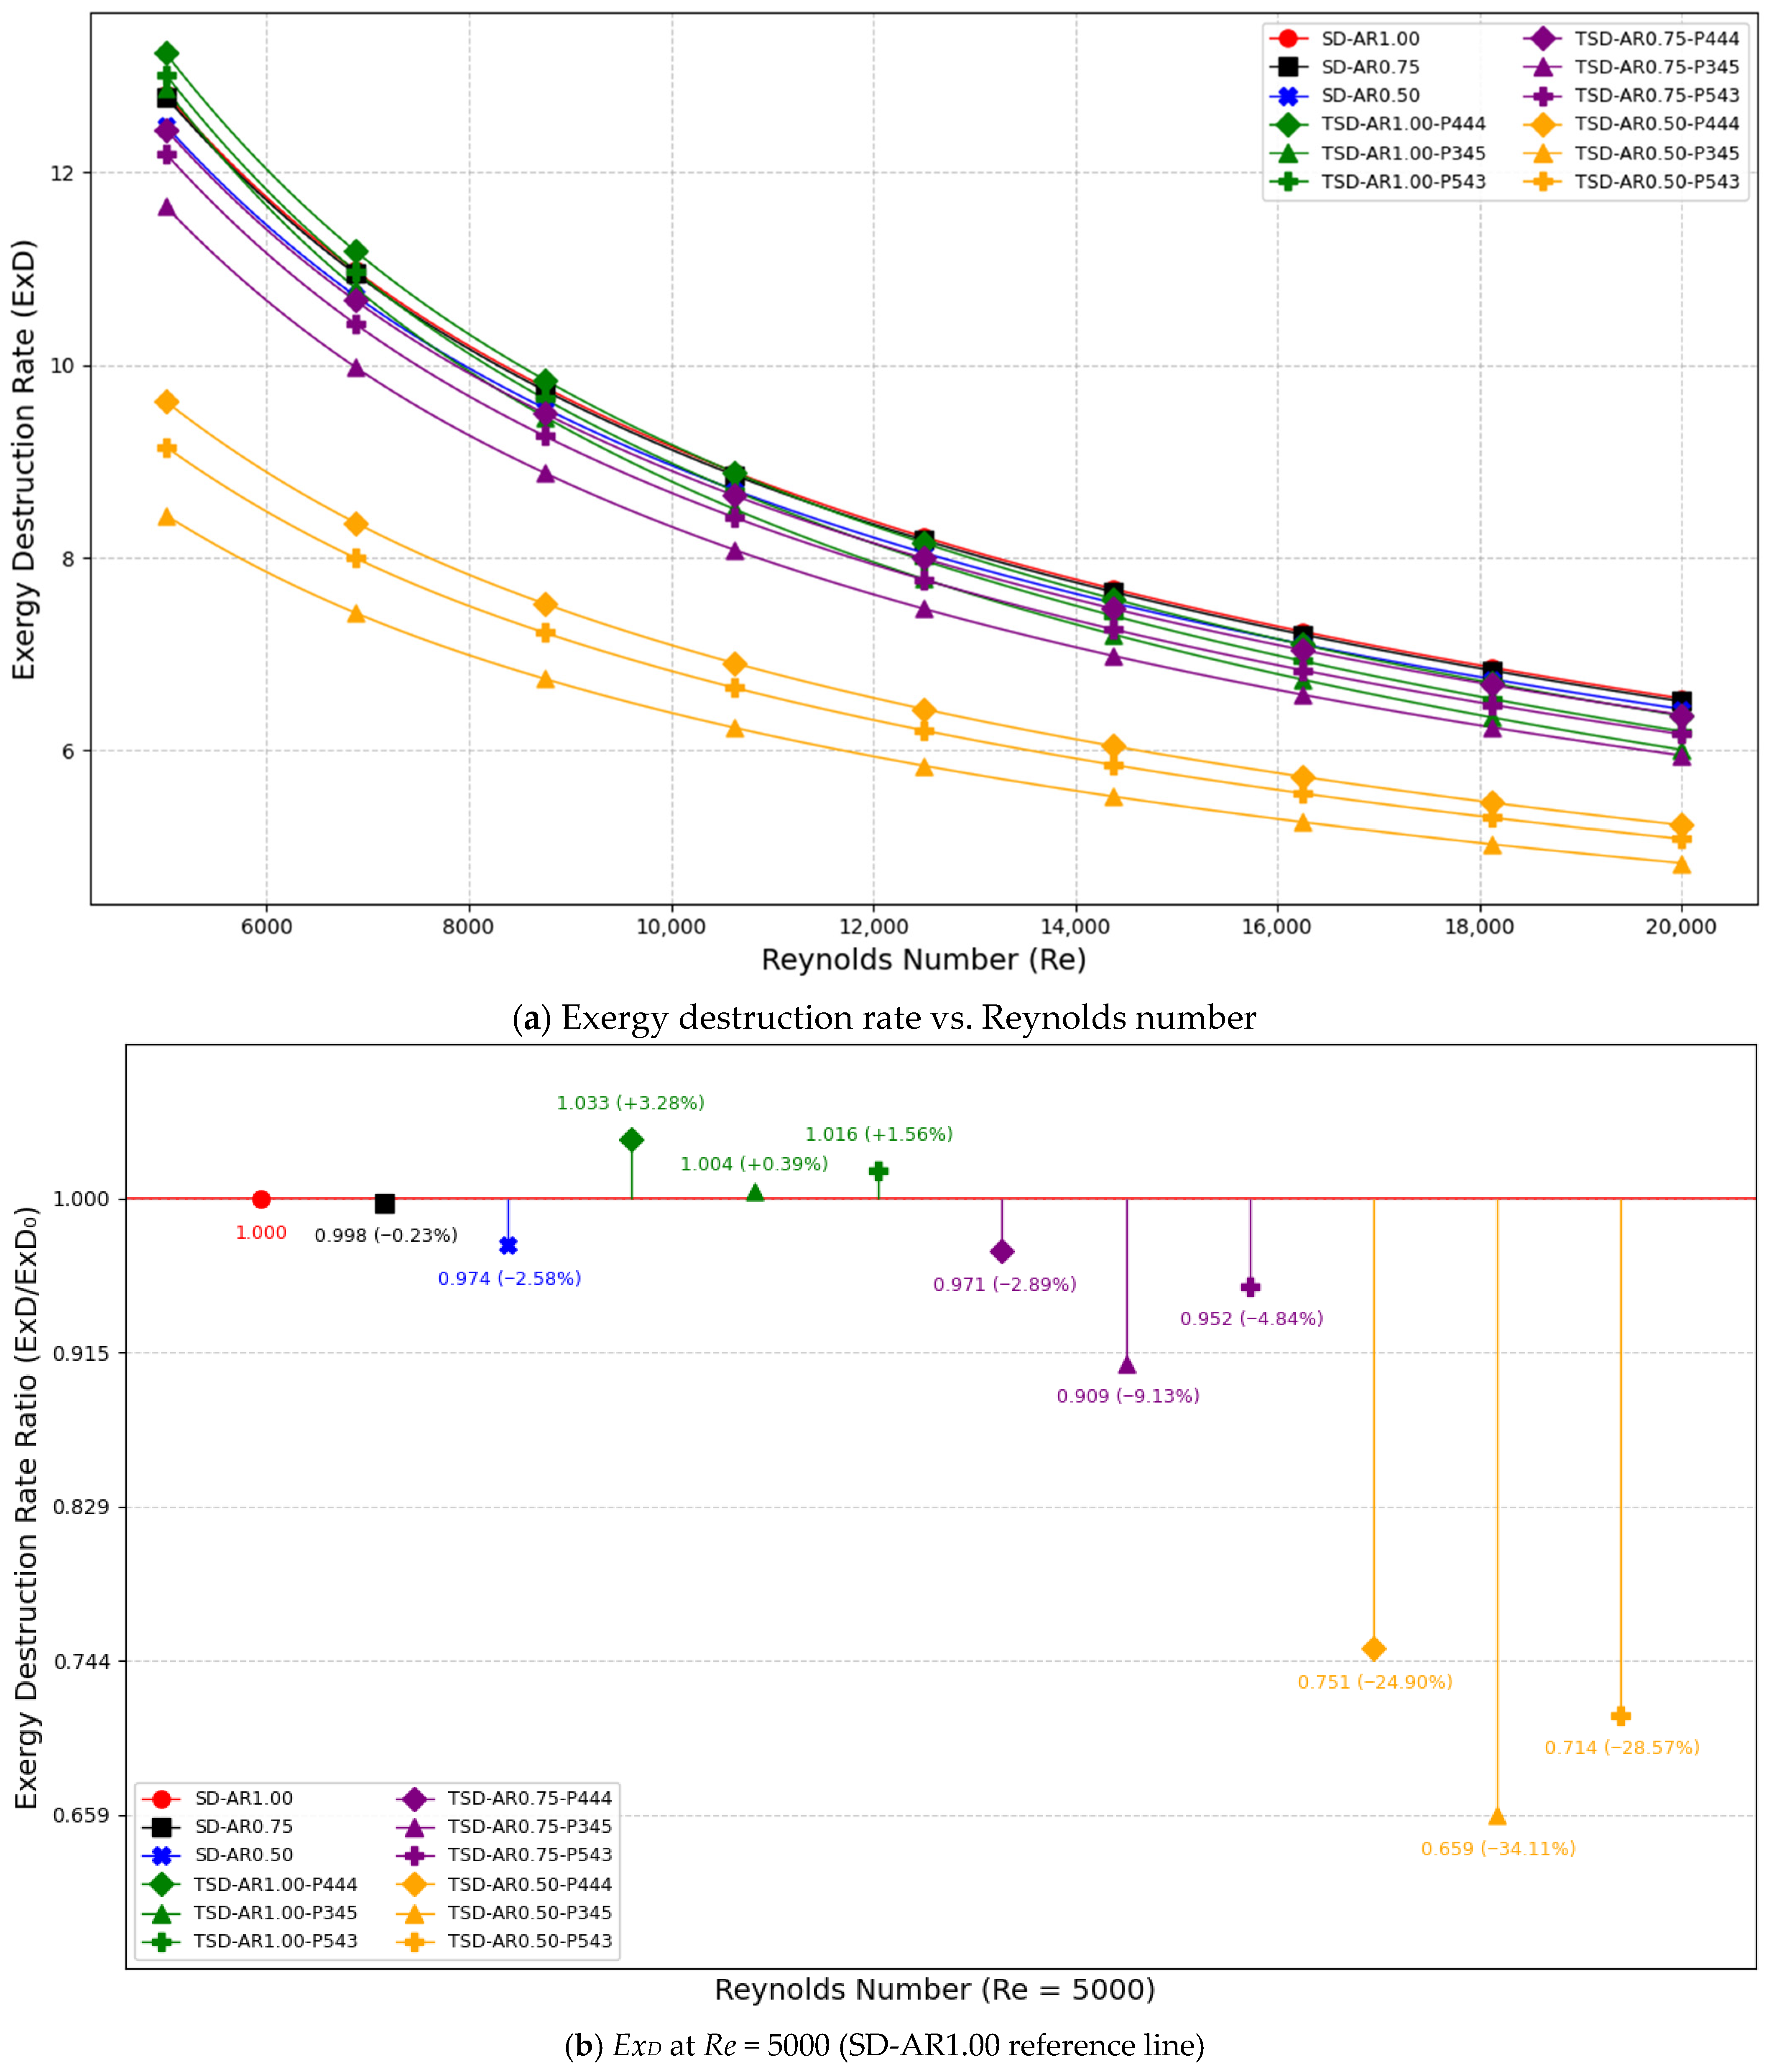
Second-law quantities show a different but physically consistent pattern. The entropy generation due to heat transfer, Sht, decreases with Reynolds number because stronger convection reduces the thermal resistance and lowers the irreversibility associated with heat transfer (Figure 16). For the baseline SD-AR1.00, Sht drops from 0.043 at Re = 5000 to 0.020 at Re = 20,000 (about −53%). In contrast, entropy generation due to friction, Sf, increases sharply with Reynolds number because viscous dissipation rises with higher flow rate and pressure drop (Figure 17 and Figure 18). For SD-AR1.00, Sf increases from 4.09 × 10⁻⁵ to 1.4986 × 10⁻³ (about 37 times). As a result, the Bejan number (Be) decreases with Reynolds number (Figure 19), showing that frictional irreversibility becomes more important at higher Reynolds numbers. For SD-AR1.00, Be decreases from 0.999 at Re = 5000 to 0.9303 at Re = 20,000; among all cases at Re = 20,000, Be spans 0.8698–0.9303, confirming the shift toward stronger friction contribution in the high-Re regime. The exergy destruction rate, ExD, decreases with Reynolds number for all cases (Figure 20), indicating that the total irreversibility measured in exergy terms becomes smaller as the flow moves to higher Reynolds numbers in this setup. For the baseline SD-AR1.00, ExD decreases from 12.81 W at Re = 5000 to 6.54 W at Re = 20,000 (about −49%). Across all cases, ExD ranges from 8.44 to 13.23 W at Re = 5000 and 4.84–6.54 W at Re = 20,000, with the lowest values consistently achieved by AR0.50 cases, especially TSD-AR0.50-P345.

4.2. First-Law Thermo-Hydraulic Performance

4.2.1. Heat Transfer and Pressure Loss (Nu, f)

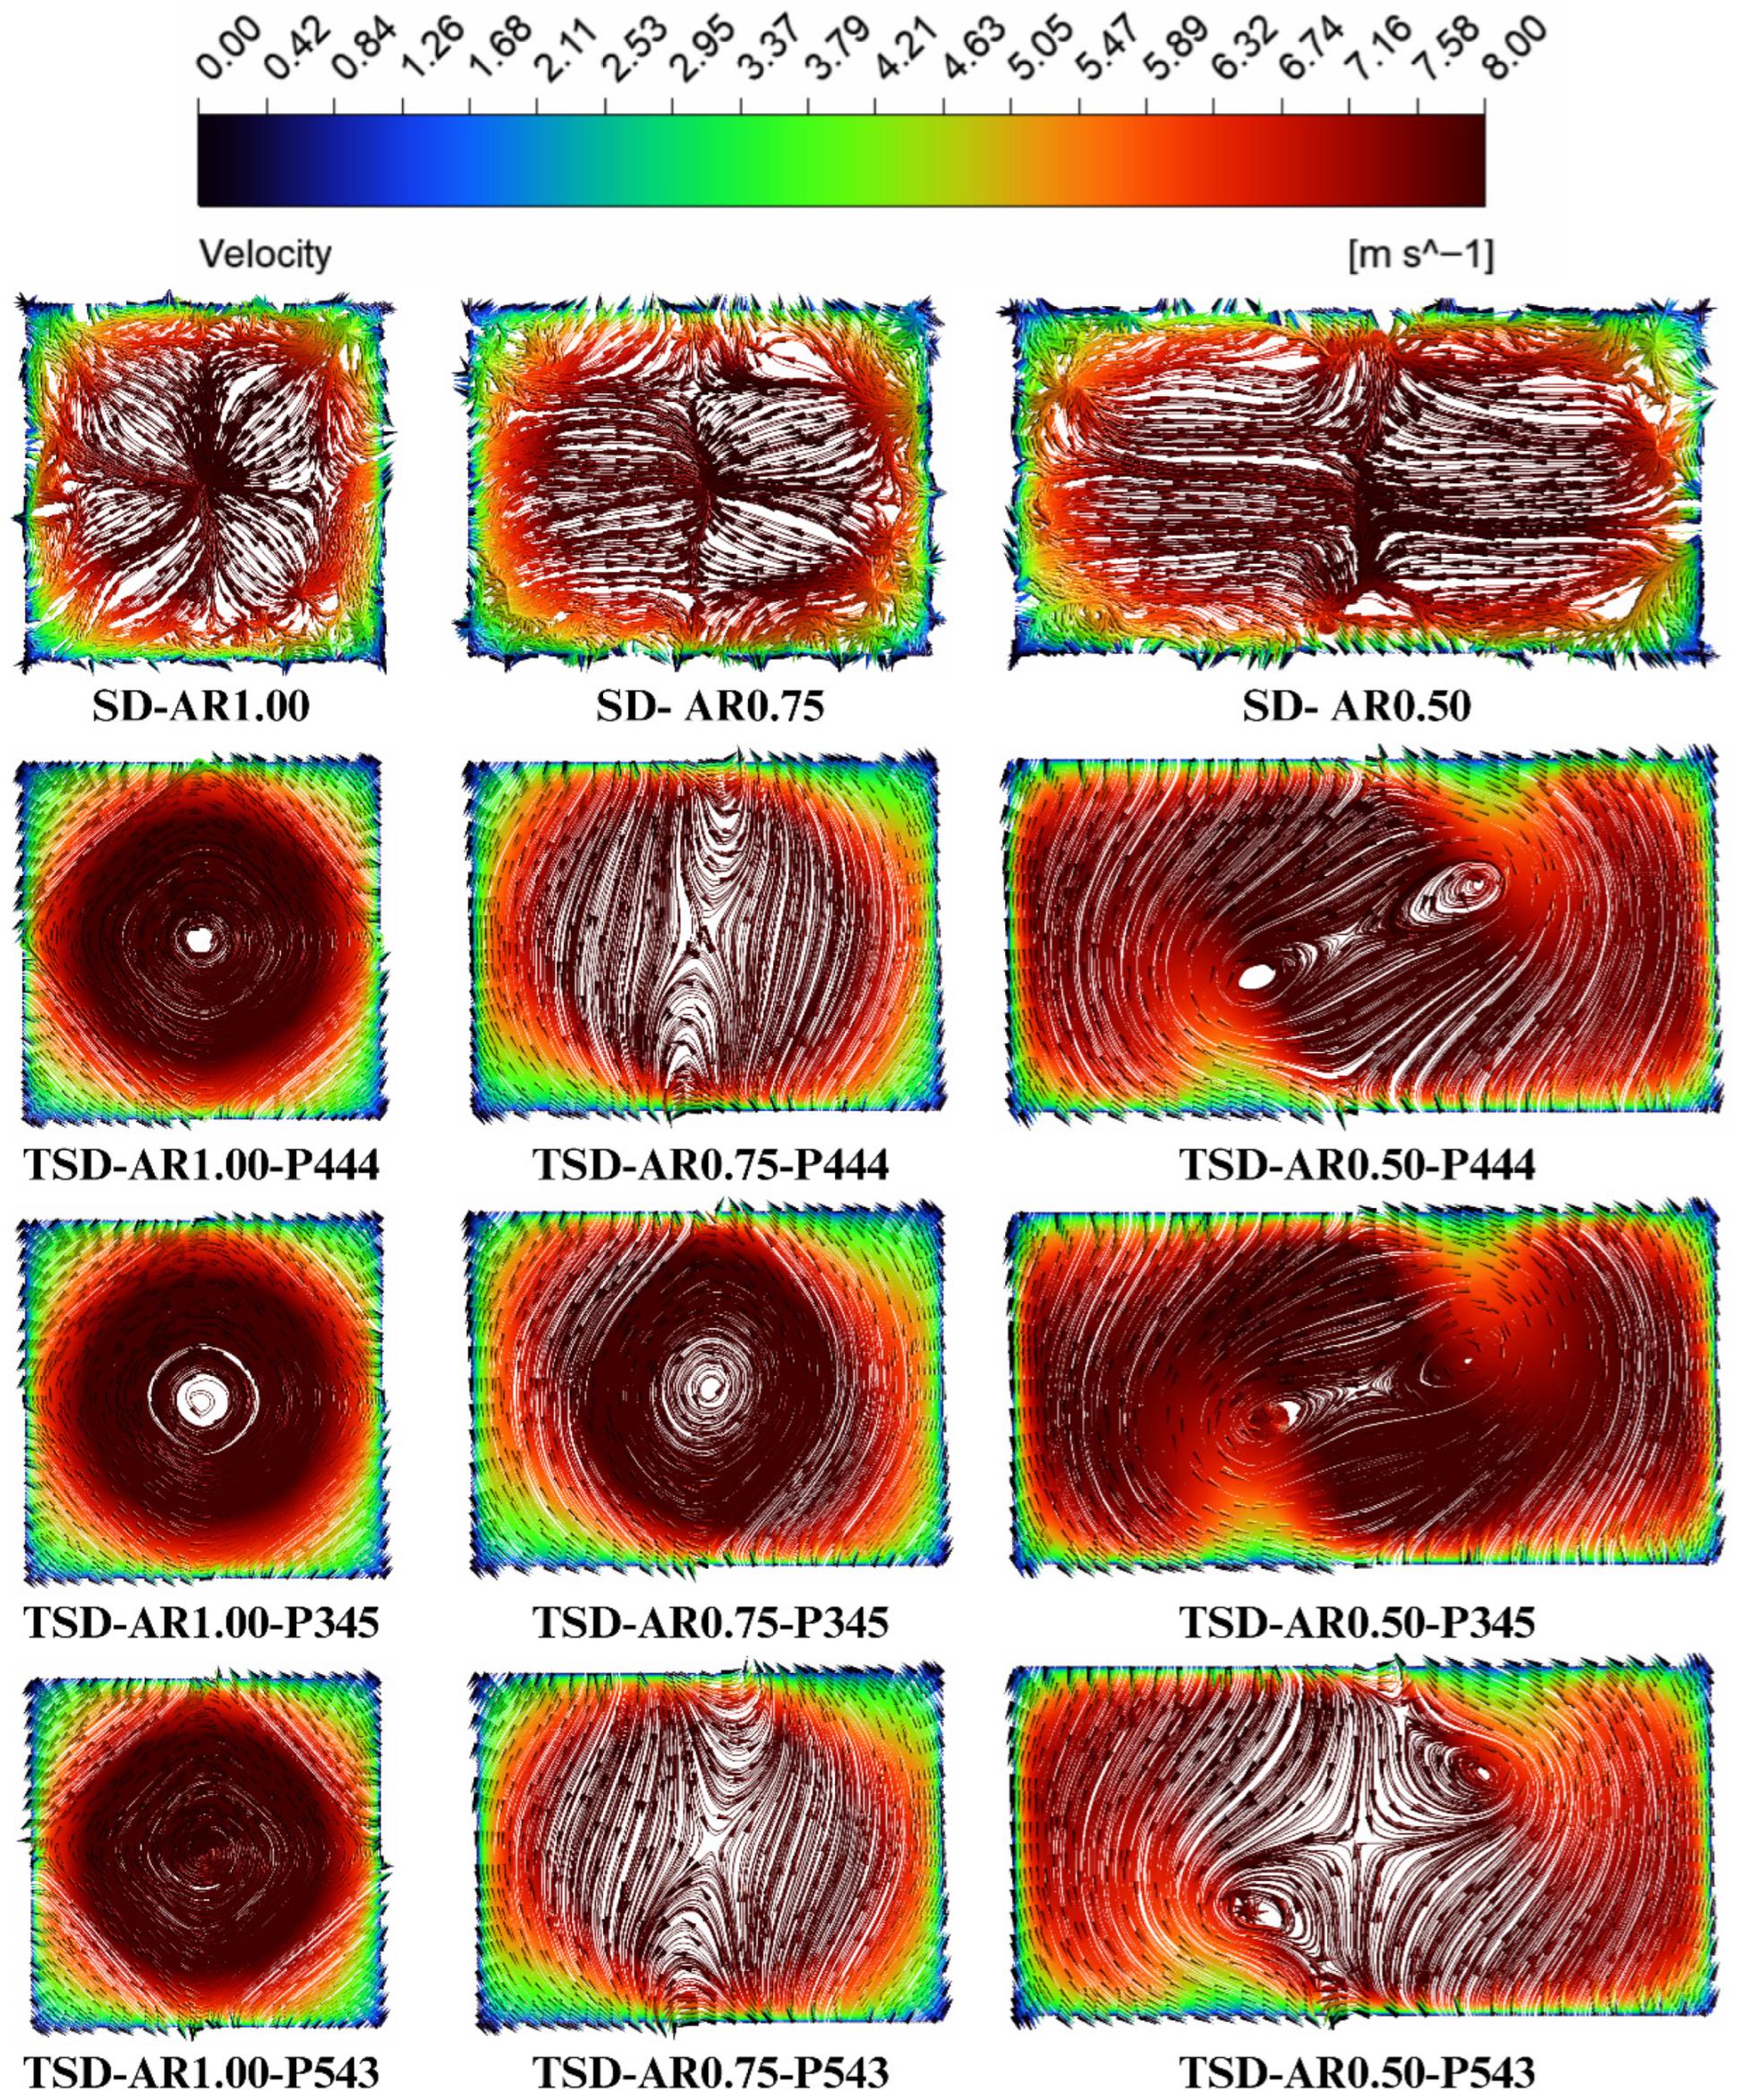
Figure 7 shows the Nusselt number variation with Reynolds number. For the baseline SD-AR1.00, Nu increases from 26.39 at Re = 5000 to 61.86 at Re = 20,000. This is the expected behavior of forced convection: a higher Reynolds number strengthens mixing and raises the heat-transfer coefficient. When twisting is applied (TSD cases), the heat-transfer response depends strongly on the aspect ratio. For the square duct (AR1.00), the twisted configurations give slightly lower Nu than the baseline at Re = 5000 (Nu = 25.39–26.07 versus 26.39). However, at high Reynolds number, twisting becomes clearly beneficial: at Re = 20,000, Nu rises to 65.37–69.61, which is higher than the baseline value of 61.86. This indicates that, in the square duct, the swirl created by twisting becomes more effective as the flow becomes stronger and more turbulent. For AR0.75, twisting improves Nu already at low Reynolds numbers. At Re = 5000, Nu increases to 26.93–28.72, and at Re = 20,000, it reaches 65.37–70.4. The strongest rectangularity (AR0.50) produces the largest gains. At Re = 5000, Nu increases markedly to 34.60–39.39, and at Re = 20,000, it reaches 81.13–88.62. Within each aspect ratio group, the increasing pitch sequence (P345) gives the highest Nu, while the uniform pitch (P444) gives the lowest Nu, showing that a tighter pitch near the inlet can strengthen early swirl and promote stronger overall convection. Figure 8 shows the friction factor variation. For the baseline SD-AR1.00, f decreases from 0.0750 at Re = 5000 to 0.0378 at Re = 20,000, following the usual trend for turbulent internal flow correlations. Twisting increases pressure loss in all cases because the flow is forced into a swirling and longer path, and the near-wall shear becomes stronger. At Re = 5000, the twisted square cases show a modest increase (f = 0.078–0.0791), while AR0.75 increases to 0.0829–0.0882, and AR0.50 increases further to 0.0967–0.1009. At Re = 20,000, f values for twisted cases become closer to each other, typically 0.0503–0.0531, but they remain significantly higher than the baseline value of 0.0378. Overall, the first-law results show a clear trade-off: stronger rectangularity and the P345 pitch pattern enhance heat transfer the most, but they also increase friction losses. This behavior is also consistent with the contour plots. In the straight ducts, the wall–fluid temperature field remains smooth along the length, which suggests that the near-wall thermal layer is disturbed mainly by the natural turbulence of the main flow (Figure 11). After twisting is introduced, the flow is forced to rotate and move across the cross-section. This secondary motion repeatedly brings cooler core fluid toward the hot wall and sweeps warmer near-wall fluid back into the core. As a result, the thermal boundary layer is broken and re-formed many times along the duct, which supports the higher Nusselt numbers in the twisted cases. The cross-sectional temperature contours at x/L = 0.8 (Figure 13) show this effect more clearly: the cold core is no longer centered, and the temperature field becomes more distorted and spreads toward the wall. This indicates stronger cross-stream transport, which increases the local temperature gradient near the wall and therefore raises Nu. The same mechanism also explains the pressure-loss penalty. The streamlines and vectors (Figure 15) show stronger swirl and near-wall motion in the twisted ducts, especially when AR is reduced. This increases near-wall shear and makes the flow path effectively longer, so the friction factor rises. The TKE contours (Figure 14) further support this view by showing stronger mixing activity near the wall for the twisted cases, which helps heat transfer but also increases viscous losses.

4.2.2. Nusselt Number Ratio and Friction Factor Ratio (Nu/Nu0, f/f0)

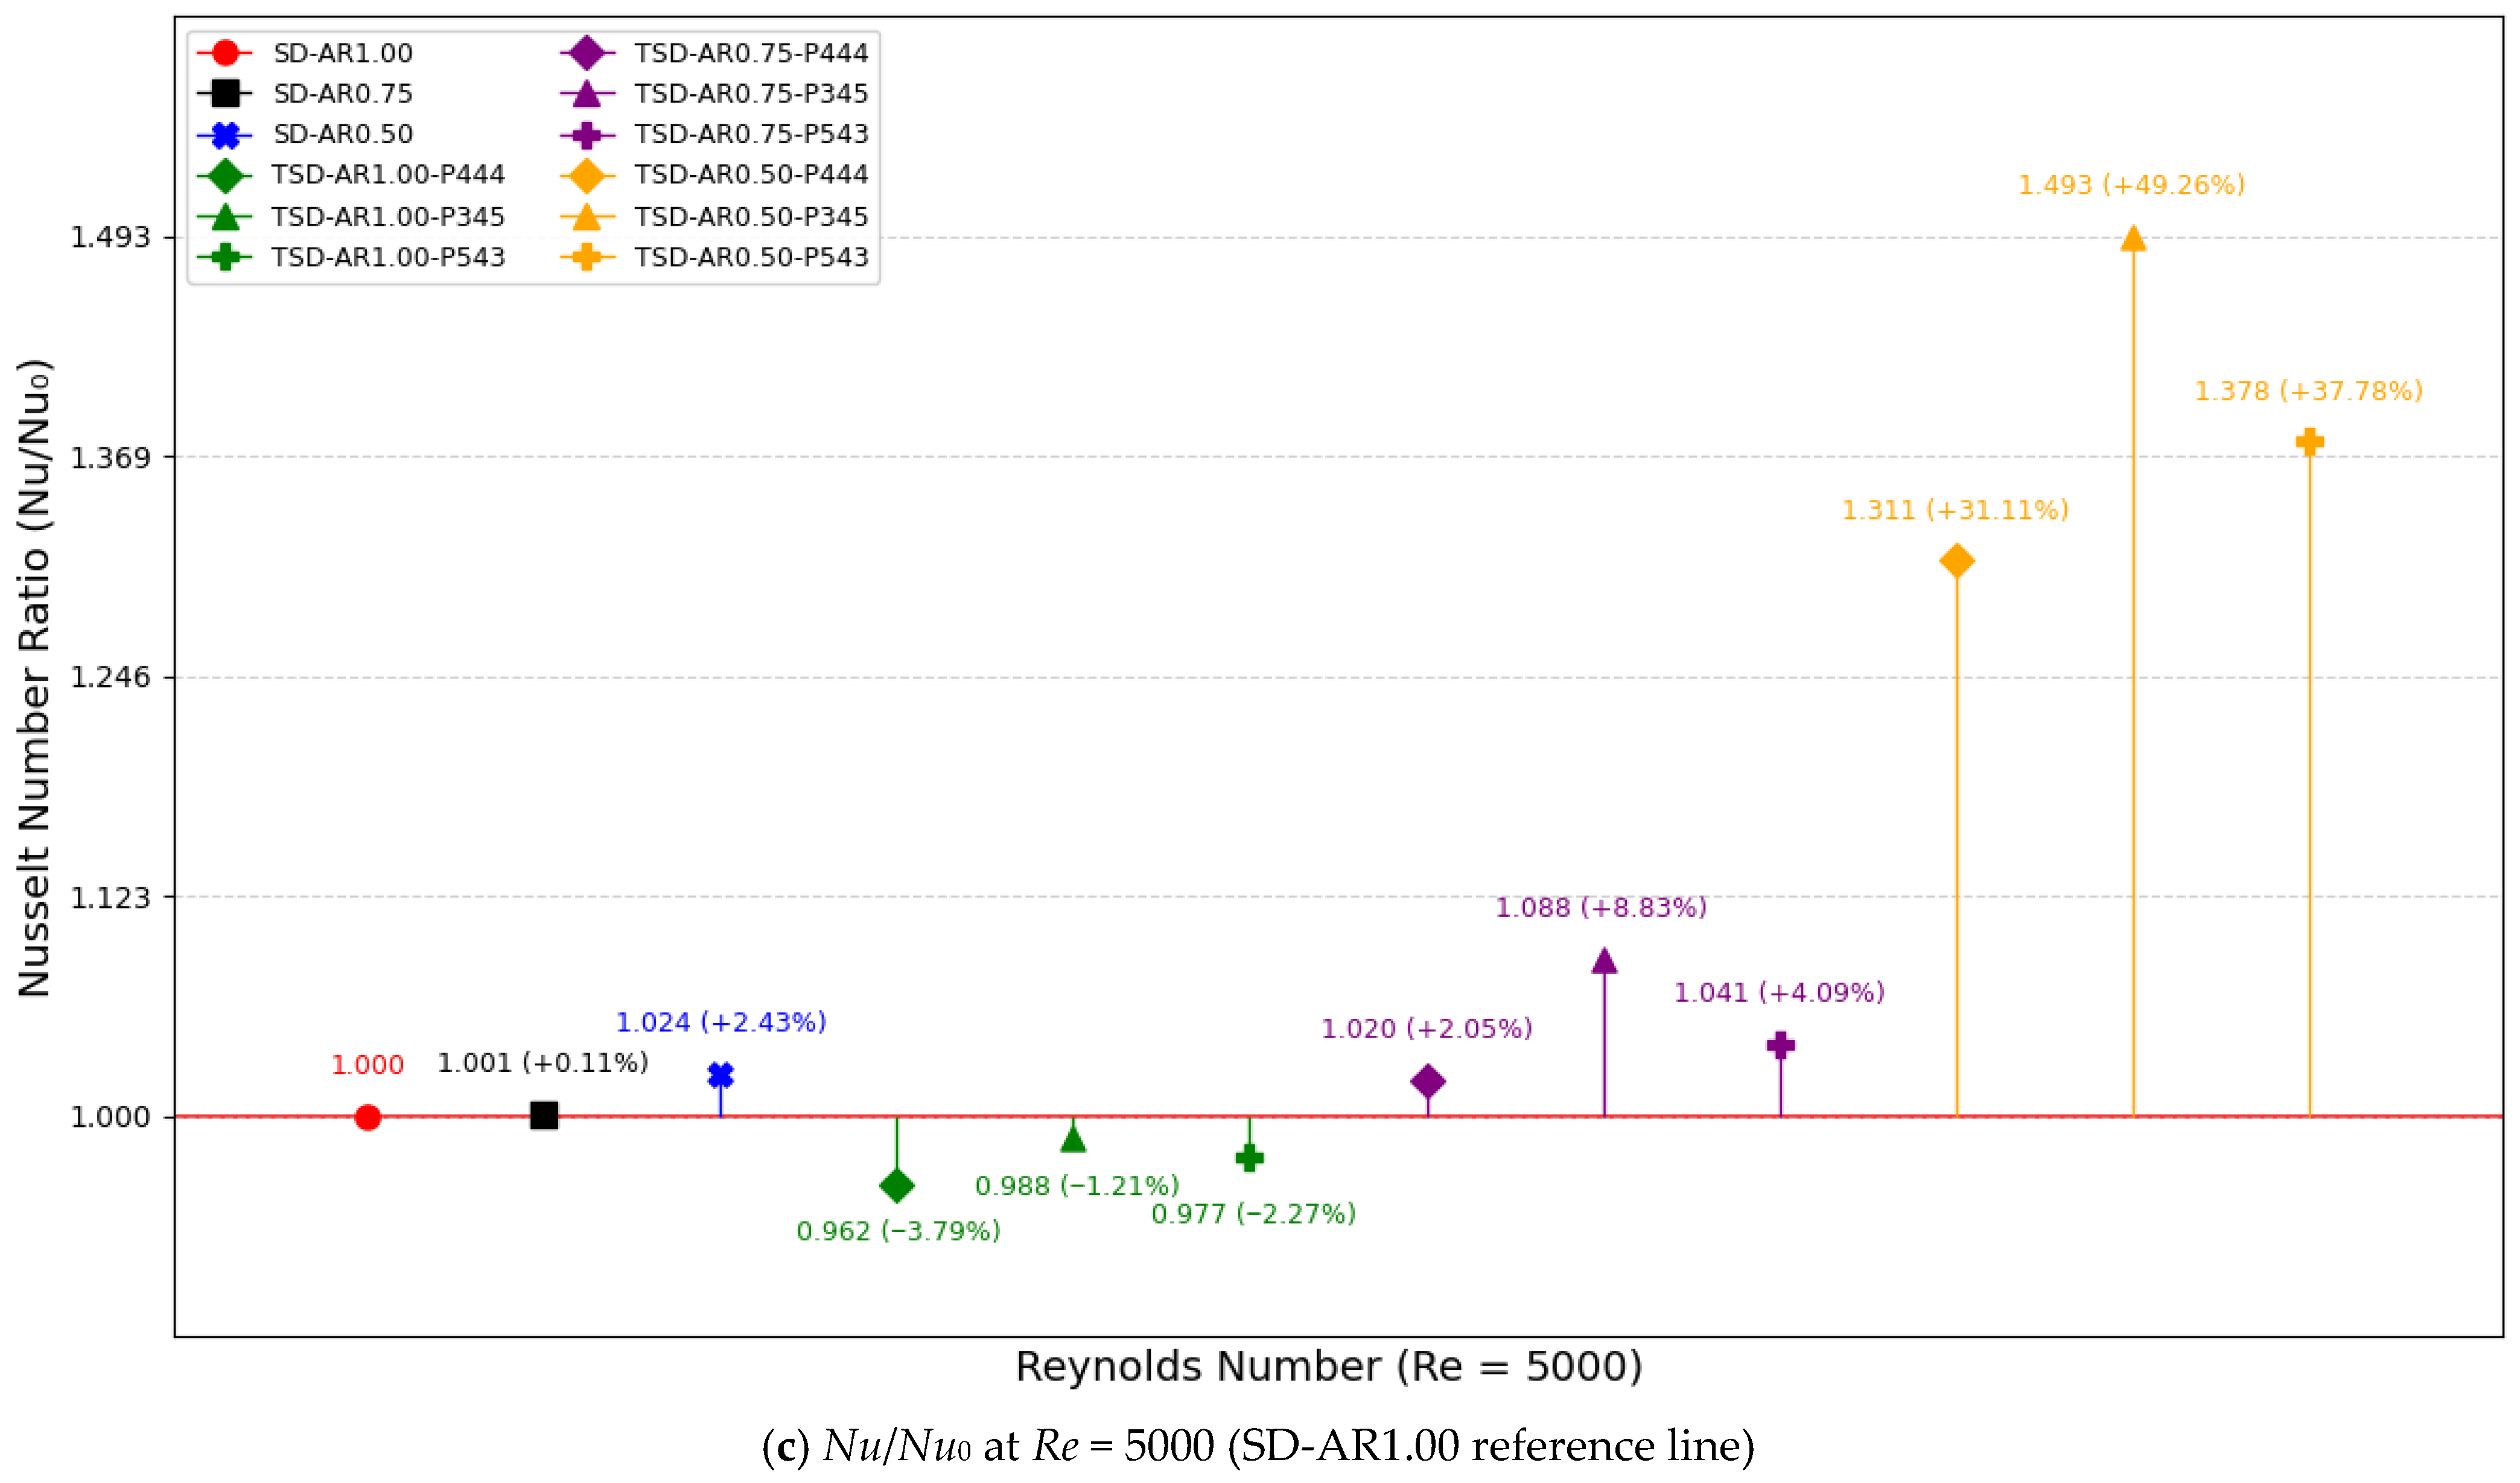
To compare all cases on a consistent basis, Figure 7b,c and Figure 8b,c present Nu/Nu0 and f/f0, where the single global baseline is SD-AR1.00. This representation separates the “gain” (Nu/Nu0) from the “cost” (f/f0) at the same Reynolds number. At Re = 5000, Nu/Nu0 spans 0.962–1.493 across all cases. The lowest value occurs in TSD-AR1.00-P444 (Nu/Nu0 = 0.962), confirming that twisting the square duct can slightly reduce heat transfer at low Reynolds number. The highest value occurs in TSD-AR0.50-P345 (Nu/Nu0 = 1.493, about +49.3%). At Re = 20,000, Nu/Nu0 spans 1.0–1.433, and the best case remains TSD-AR0.50-P345 with Nu/Nu0 = 1.433 (about +43.3%). These results show that AR0.50 consistently yields the strongest heat-transfer enhancement over the whole Reynolds number range. The friction-factor ratio shows the matching penalty. At Re = 5000, f/f0 spans 1.0–1.345, and the highest value again occurs in TSD-AR0.50-P345 (f/f0 = 1.345, about +34.5%). At Re = 20,000, f/f0 spans 1.0–1.405, with TSD-AR0.50-P345 still having the largest penalty (f/f0 = 1.405, about +40.5%). Importantly, the straight rectangular ducts (SD-AR0.75 and SD-AR0.50) stay close to the baseline: for example, SD-AR0.50 has Nu/Nu0 = 1.024 at Re = 5000 and 1.021 at Re = 20,000, indicating that most of the enhancement in this work comes from twisting and pitch control, not from the straight aspect ratio alone.

4.2.3. Thermal Performance Factor (TPF)

The thermal performance factor combines the heat-transfer gain and the pressure-loss penalty under the commonly used cube-root weighting for friction. Figure 9 shows that the ranking is stable and clearly favors the AR0.50 twisted ducts, especially the increasing pitch design. The best overall first-law performance is obtained by TSD-AR0.50-P345. Its TPF decreases mildly with Reynolds number but remains well above unity throughout the range: TPF = 1.352 at Re = 5000 and TPF = 1.279 at Re = 20,000. This means that, even after accounting for the higher friction loss, the net thermo-hydraulic benefit remains strong. The other AR0.50 designs also stay above unity, with TSD-AR0.50-P543 giving TPF = 1.259 → 1.211 and TSD-AR0.50-P444 giving TPF = 1.205 → 1.176 from Re = 5000 to 20,000. For AR0.75, only the increasing pitch case provides a consistent net benefit, with TSD-AR0.75-P345 yielding TPF = 1.031 → 1.027. The other AR0.75 patterns remain close to unity and can fall below it (for example, TSD-AR0.75-P444 reaches TPF = 0.957 at Re = 20,000). For the square duct (AR1.00), the performance is the most sensitive to Reynolds number: TSD-AR1.00-P345 transitions from below unity at low Reynolds number (TPF = 0.971 at Re = 5000) to slightly above unity at moderate-to-high Reynolds number (TPF = 1.002 at Re = 12,500 and 1.019 at Re = 20,000). This suggests that, in the square duct, the swirl-induced mixing must be sufficiently strong (higher Re) before it can outweigh the pressure-loss increase. Overall, the first-law results confirm that strong rectangularity (AR0.50) and a mild axial pitch increase (P345) provide the most reliable thermo-hydraulic advantage within the tested matrix, while square-duct twisting offers only limited benefit and mainly at higher Reynolds numbers.

4.3. Second-Law Thermodynamic Performance

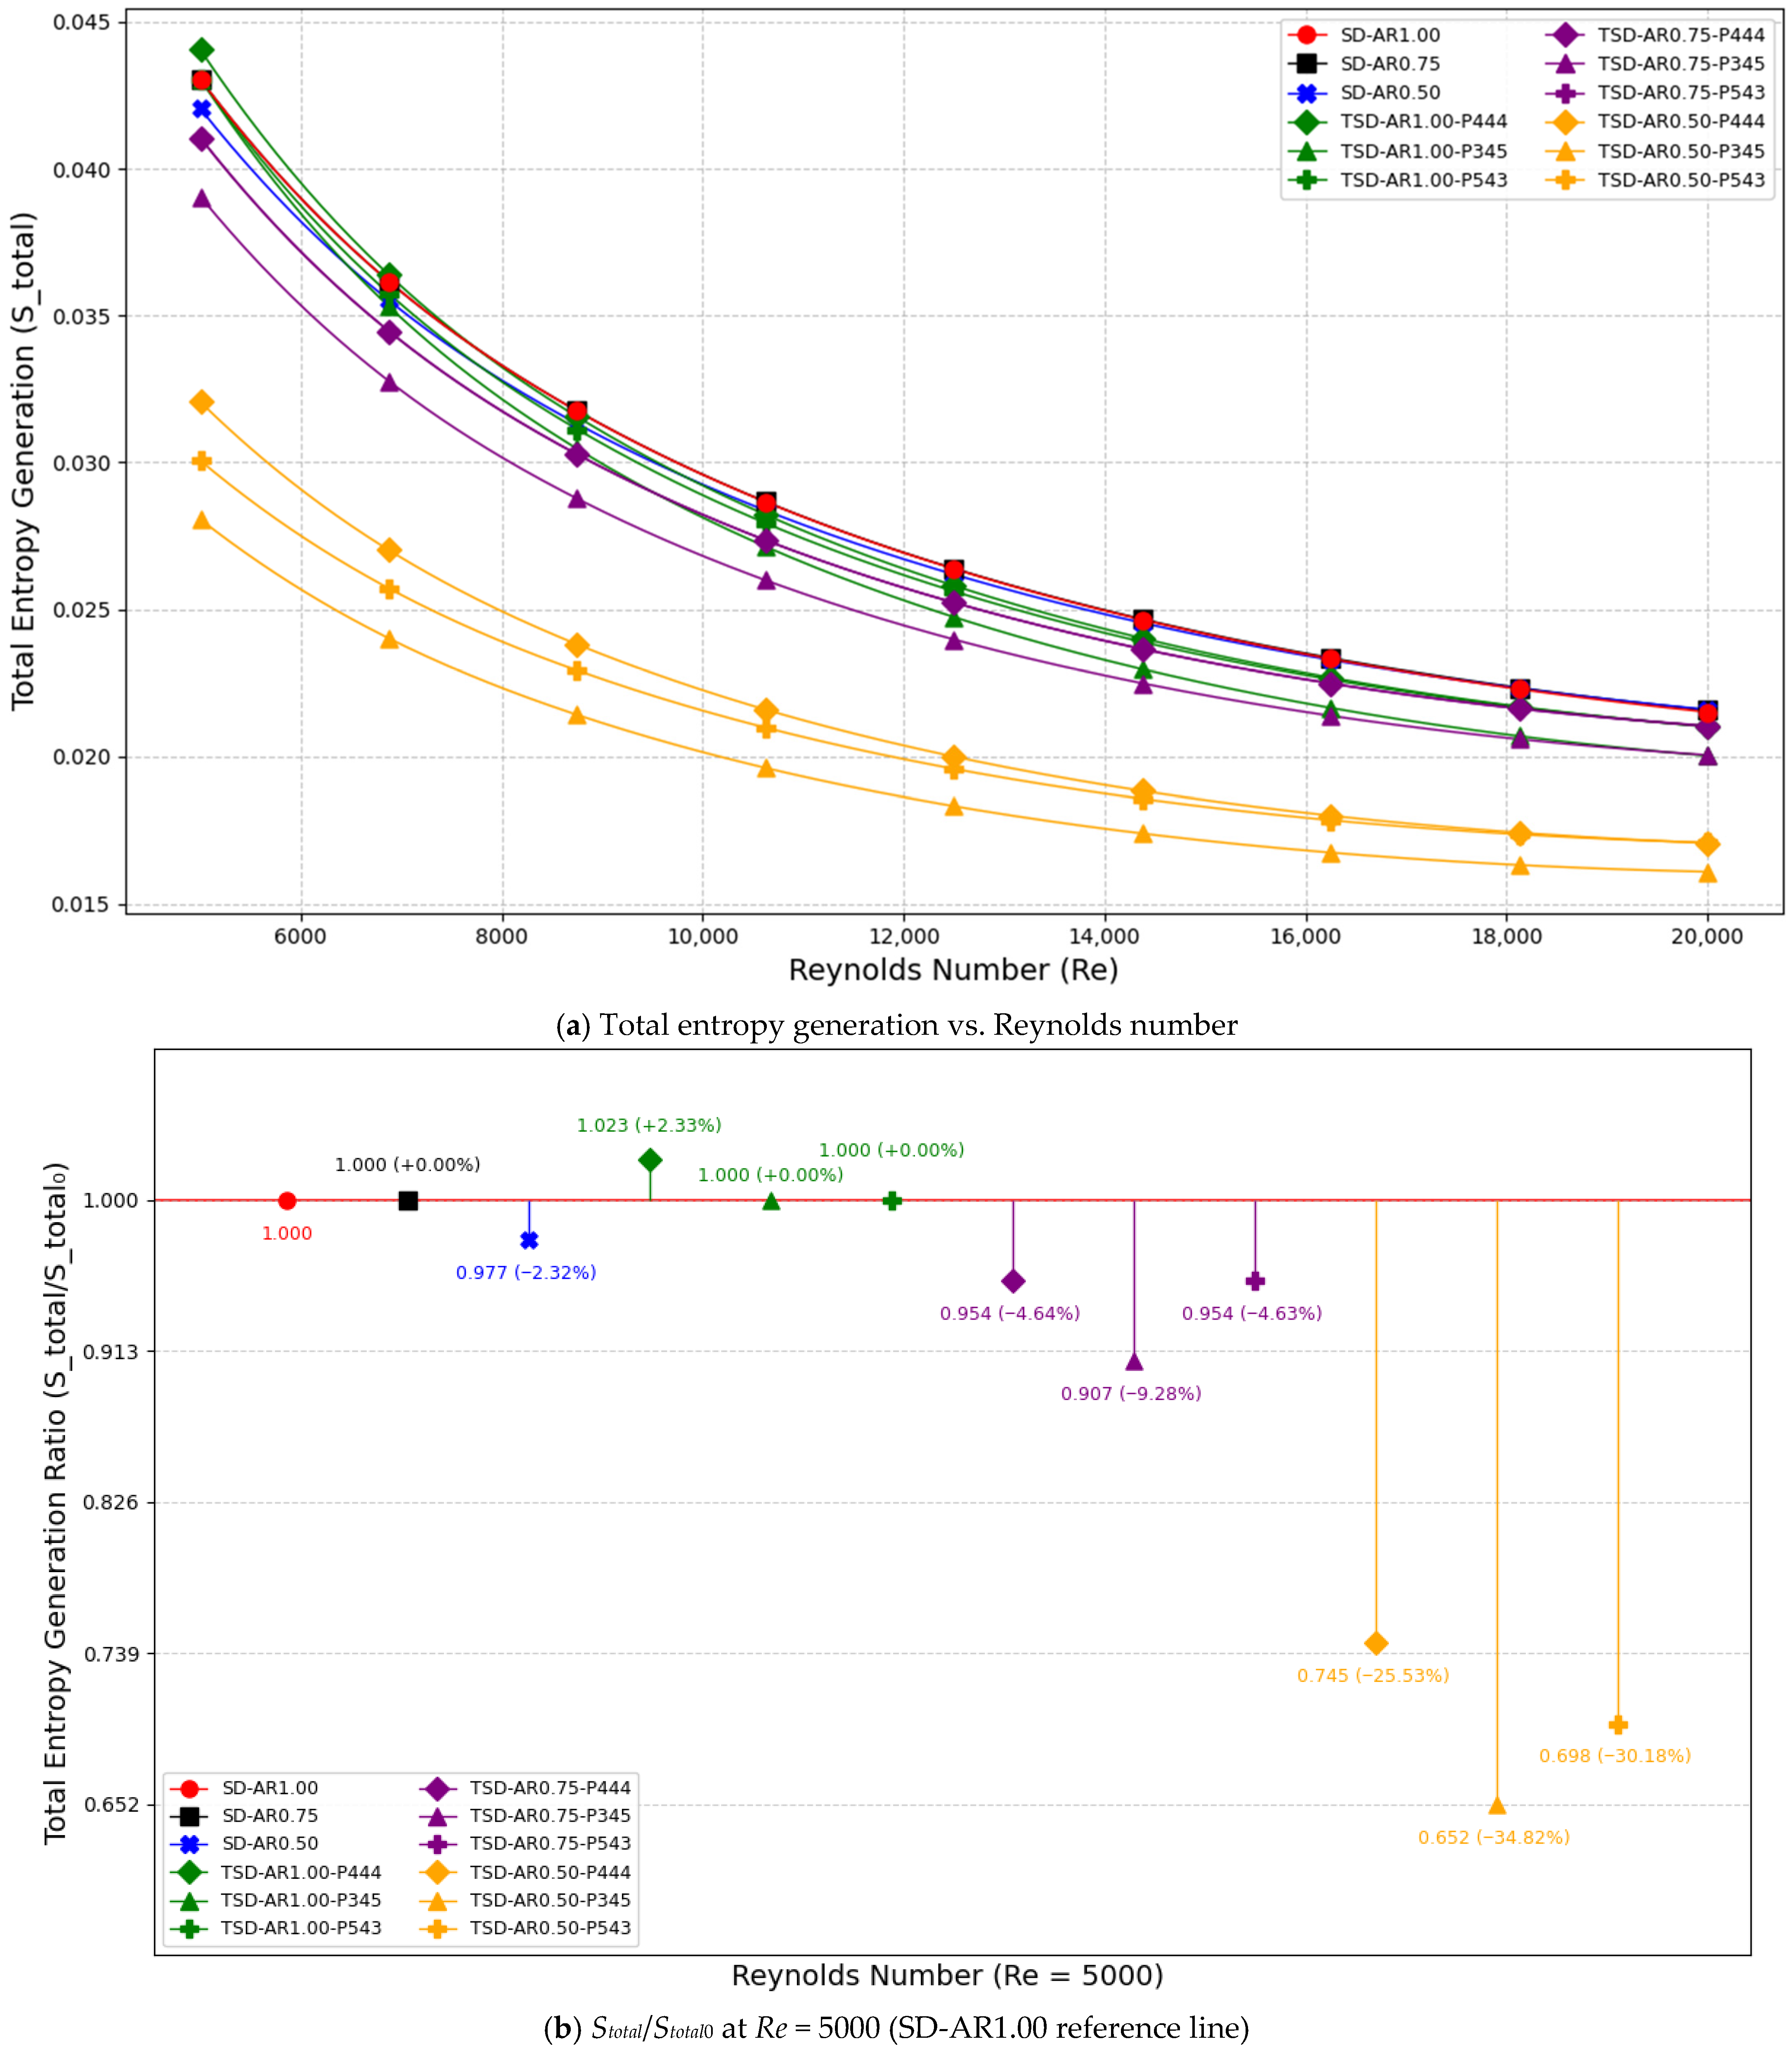
4.3.1. Entropy Generation Analysis (Sht, Sf, Stotal)

Figure 16, Figure 17 and Figure 18 present the entropy generation terms separated into heat-transfer irreversibility (Sht) and frictional irreversibility (Sf), together with the total entropy generation (Stotal = Sht + Sf). A clear and physically consistent trend appears across all cases. First, Sht decreases with Reynolds number for every duct. For the baseline SD-AR1.00, Sht drops from 0.043 at Re = 5000 to 0.020 at Re = 20,000. This reduction indicates that a higher Reynolds number strengthens convection, so the heat-transfer process becomes “less irreversible” in the heat-transfer part. Second, Sf increases strongly with Reynolds number for all cases. For SD-AR1.00, Sf increases from 4.09 × 10⁻⁵ at Re = 5000 to 1.4986 × 10⁻³ at Re = 20,000. This increase is expected because viscous dissipation rises rapidly when the flow rate and pressure loss grow at higher Reynolds numbers. Because Sht decreases while Sf increases, Stotal decreases with Reynolds number, but the rate of decrease becomes weaker at high Reynolds numbers, where friction starts to contribute more. For SD-AR1.00, Stotal changes from 0.043041 (≈ 0.043 + 4.09 × 10⁻⁵) at Re = 5000 to 0.021499 (≈0.020 + 0.0014986) at Re = 20,000. Across the studied matrix, the lowest Stotal is consistently found in the strongest rectangular twisted case, especially the increasing pitch design. For TSD-AR0.50-P345, Sht is the lowest among all cases (0.028 → 0.014 from Re = 5000 to 20,000), while Sf is the highest (5.45 × 10⁻⁵ → 2.0949 × 10⁻³). Even with this higher friction contribution, the total remains the smallest because the reduction in Sht is large. Specifically, Stotal for TSD-AR0.50-P345 decreases from 0.0280545 at Re = 5000 to 0.0160949 at Re = 20,000. Relative to the baseline SD-AR1.00, this corresponds to about 34.8% lower Stotal at Re = 5000 and 25.1% lower at Re = 20,000. At a mid-range point (Re = 12,500), Stotal is 0.026368 for SD-AR1.00 and 0.018317 for TSD-AR0.50-P345, which is about 30.5% lower.

4.3.2. Bejan Number Analysis (Be)

At low Reynolds number, Be is very close to unity for all cases (see Figure 19), because Sf is extremely small compared with Sht. For example, the baseline SD-AR1.00 has Be = 0.999 at Re = 5000. Even the high-friction design TSD-AR0.50-P345 still has Be = 0.9981 at Re = 5000. This confirms that, in the low-Re part of the present range, total entropy generation is controlled mainly by heat transfer, not by friction. As the Reynolds number increases, Be decreases for all cases, because Sf grows rapidly. For SD-AR1.00, Be drops to 0.9303 at Re = 20,000. For the strongest enhancement case, TSD-AR0.50-P345, Be decreases further to 0.8698 at Re = 20,000. This lower Be does not mean worse performance by itself; it mainly means that friction becomes a larger share of the total irreversibility in high-Re flow, especially for designs that generate stronger swirl and higher-pressure loss. Therefore, Be should be read together with Stotal: in this study, some cases show lower Be at high Reynolds number yet still deliver lower total entropy generation. The flow contours help explain this behavior. At x/L = 0.8, the twisted cases—especially AR0.50—show stronger secondary motion and higher near-wall mixing (Figure 14 and Figure 15), which naturally increases the role of friction-related effects and supports the reduction in Be at high Reynolds number. At the same time, the temperature contours (Figure 11 and Figure 13) indicate improved mixing between the core and near-wall regions, which helps reduce heat-transfer irreversibility. This is why some designs can show a lower Be while still providing a lower Stotal and ExD overall.

4.3.3. Exergy Destruction Analysis (ExD)

Figure 20 presents the exergy destruction rate, ExD, which provides a direct measure of irreversibility from the viewpoint of useful energy potential. A consistent trend is observed for all geometries: ExD decreases with Reynolds number over the present range. For the baseline SD-AR1.00, ExD decreases from 12.81 W at Re = 5000 to 6.54 W at Re = 20,000 (about a 49% reduction). The same decreasing trend holds for twisted ducts, and the best-performing cases also show the lowest ExD at both ends. TSD-AR0.50-P345 yields ExD = 8.44 W at Re = 5000 and 4.84 W at Re = 20,000, which corresponds to about 34.1% and 26% lower than the baseline, respectively. At Re = 12,500, ExD is 8.21 W for SD-AR1.00 and 5.84 W for TSD-AR0.50-P345, again showing a clear reduction. When viewed together, Stotal and ExD tell the same story: the strongest rectangular twisted duct with an increasing pitch (AR0.50, P345) produces the lowest overall irreversibility, even though it increases frictional losses. This supports the idea that, for the present geometry set, a design that intensifies near-wall mixing can reduce heat-transfer irreversibility enough to improve both entropy-based and exergy-based measures.

4.4. Parametric Effects of Physical Models

In this study, the aspect ratio (AR) and the pitch pattern are the two main design knobs. They control how strong the swirl becomes, how well the near-wall layer is disturbed, and how much pressure loss is added. Therefore, they directly affect both heat duty (through Nu) and pumping requirement (through f), which are the two key limits in compact air-side heat exchangers and duct heat-transfer devices.

4.4.1. Effect of Aspect Ratio (AR = 1.00, 0.75, 0.50)

To isolate the role of AR, it is helpful to first look at the straight ducts (SD). Changing AR alone causes only small differences. For example, at Re = 5000, Nu changes from 26.39 (SD-AR1.00) to 27.03 (SD-AR0.50), while f changes from 0.075 to 0.0763. At Re = 20,000, Nu changes from 61.86 to 63.18, and f from 0.0378 to 0.0399. This shows that straight rectangularity by itself is not the main source of enhancement in the present work. The AR effect becomes strong when twisting is introduced (TSD cases). Using the same pitch pattern (P345) as a representative comparison, Nu increases clearly as AR decreases. At Re = 5000, Nu is 26.07 for TSD-AR1.00-P345, 28.72 for TSD-AR0.75-P345, and 39.39 for TSD-AR0.50-P345. At Re = 20,000, the same ordering remains: 69.61, 70.40, and 88.62, respectively. The corresponding ratios relative to the global baseline SD-AR1.00 confirm this trend: at Re = 5000, Nu/Nu0 = 0.988 → 1.088 → 1.493, as AR decreases from 1.00 to 0.50; at Re = 20,000, Nu/Nu0 = 1.125 → 1.138 → 1.433. This improvement comes with higher pressure loss. For P345 at Re = 5000, f increases from 0.0791 (AR1.00) to 0.0882 (AR0.75) and 0.1009 (AR0.50), giving f/f0 = 1.055 → 1.176 → 1.345. At Re = 20,000, f becomes 0.0509–0.0531 for these twisted cases, still higher than the baseline 0.0378, and the largest penalty remains for AR0.50 (f/f0 = 1.405). In short, lower AR strengthens heat transfer much more than it increases friction, which is why AR0.50 yields the strongest net first-law performance in this study. This net effect is reflected directly in TPF. At Re = 5000, TPF rises from 0.971 (TSD-AR1.00-P345) to 1.031 (TSD-AR0.75-P345) and reaches 1.352 (TSD-AR0.50-P345). At Re = 20,000, the same ranking holds: 1.019, 1.027, and 1.279. This means that AR reduction is a primary driver for achieving a strong thermo-hydraulic benefit under the same Dh. The reason is linked to how the twisted flow interacts with the duct shape. When AR is reduced, the cross-section becomes more “wide and flat,” so the rotating flow is pushed closer to the walls over a larger part of the perimeter. Therefore, the secondary motion disturbs the near-wall region more strongly and over a wider area. This helps to thin the thermal boundary layer and to keep the wall-adjacent fluid better mixed. In the contours, AR0.50 shows a stronger distortion of the temperature field (Figure 13) and more intense secondary-flow structures (Figure 15) than AR1.00, which supports the larger Nu gains. To quantify this trend, the area-weighted average vorticity magnitude at x/L = 0.8 was evaluated for the P345 cases. The values are 935.97, 983.22, and 1092.10 s−1 for AR = 1.00, 0.75, and 0.50, respectively, confirming that the AR = 0.50 case produces the strongest secondary-flow intensity. At the same time, because more of the flow is driven close to the wall, the wall shear increases, which explains why the friction penalty also grows as AR decreases.

4.4.2. Effect of Pitch Pattern (P444 vs. P345 vs. P543)

Within each AR group, the pitch pattern changes how swirl is distributed along the duct. The results show a consistent ranking for heat transfer: P345 gives the highest Nu, P543 is intermediate, and P444 is the lowest. For the square duct (AR1.00), the differences are modest at low Reynolds numbers. At Re = 5000, Nu changes only from 25.39 (P444) to 26.07 (P345), and all three twisted cases remain close to the baseline. At Re = 20,000, the pitch effect becomes clearer: Nu increases from 65.37 (P444) to 69.61 (P345), while P543 gives 67.28. The friction differences among pitch patterns are relatively small compared with the heat-transfer differences; for AR1.00 at Re = 20,000, f is 0.0503–0.0509. For AR0.50, the pitch pattern becomes much more influential. At Re = 5000, Nu increases from 34.6 (P444) to 39.39 (P345), with P543 at 36.36. At Re = 20,000, Nu increases from 81.13 (P444) to 88.62 (P345), with P543 at 83.71. Importantly, the added friction from selecting P345 instead of P444 is small at high Reynolds number (for AR0.50 at Re = 20,000, f increases only from 0.0524 to 0.0531). As a result, P345 produces the best TPF in every AR group. For example, at Re = 5000 and 20,000, TPF for AR0.50 is 1.205 → 1.176 (P444), 1.259 → 1.211 (P543), and 1.352 → 1.279 (P345). A simple physical interpretation is that P345 places the tightest pitch near the inlet, which promotes strong early swirl and near-wall mixing where the thermal boundary layer is developing. The larger pitch downstream then avoids an unnecessary pressure penalty. In contrast, P543 delays the strongest twist to the outlet, which reduces the benefit in the early part of the heated section, while P444 provides a steady but less optimized swirl level along the duct. The mechanism of pitch grading is mainly an “early mixing” effect. With P345, the tighter pitch near the inlet generates a stronger swirl at the start of the heated section, where the thermal boundary layer is still developing and is easier to disturb. This early disturbance prevents the near-wall temperature layer from becoming too stable, so the downstream section starts from better mixed conditions. Later, the larger pitch reduces extra resistance while keeping some rotation in the flow. This pattern is consistent with Figure 11, where the wall–fluid temperature field shows more frequent alternation along the duct for P345, and with Figure 12, where the low-temperature region penetrates further downstream. In contrast, P543 delays the strongest twist, so the early part of the duct receives weaker mixing, and P444 provides a steady but less targeted level of swirl.

4.4.3. Interaction Between AR and Pitch Pattern

The pitch effect is not the same for every aspect ratio; it becomes much stronger as AR decreases. This interaction is important because it explains why the “best” pitch choice is most valuable in the more rectangular ducts. A clear example appears at Re = 5000. For AR1.00, changing pitch from P444 to P345 increases Nu only from 25.39 to 26.07 (a small gain). For AR0.50, the same change increases Nu from 34.6 to 39.39 (a much larger gain). The same pattern is seen in TPF: for AR1.00 at Re = 5000, TPF improves only from 0.95 (P444) to 0.971 (P345) and remains below unity, while for AR0.50, it improves from 1.205 to 1.352 and stays strongly above unity. This interaction suggests that rectangularity amplifies the usefulness of pitch grading. In AR0.50 ducts, the flow is more constrained, and the twist-induced secondary motion can more effectively disturb the near-wall regions over a larger fraction of the perimeter. Therefore, distributing the twist intensity along the duct (especially with P345) produces a clear performance gain. In contrast, in the square duct at low Reynolds number, the twist may add pressure loss without providing enough extra mixing to raise Nu above the baseline; only at higher Reynolds number does the swirl become strong enough for the benefit to appear (for example, TSD-AR1.00-P345 reaches TPF = 1.019 at Re = 20,000). Overall, the parametric results show that AR is the main lever for large enhancement, while pitch grading (especially P345) is a strong secondary lever that becomes most effective when combined with strong rectangularity (AR0.50). This is why the pitch effect becomes much clearer at low AR. In AR0.50 ducts, the flow is more constrained, and the twist-driven motion reaches the wall region more easily. As a result, changing the pitch pattern changes the strength and the timing of near-wall mixing in a more visible way. This is reflected in the contours: for AR1.00, the differences among pitch patterns are subtle, while for AR0.50, the temperature field (Figure 11, Figure 12 and Figure 13) and the flow structures (Figure 14 and Figure 15) change more noticeably, matching the stronger separation in Nu and TPF.

4.5. Integrated Assessment and Optimal Configuration

This section combines the first-law and second-law results to answer one practical question: which duct should be selected if we want higher heat transfer? However, we also want to control pressure loss and avoid wasting useful energy (irreversibility). All comparisons are made at the same Reynolds number using SD-AR1.00 as the single global baseline (Nu0, f0, Stotal0, ExD0). Therefore, the “best” case here is the one that keeps TPF > 1.0 (useful heat-transfer gain under cube-root pumping penalty) while also keeping Stotal/Stotal0 < 1.0 and ExD/ExD0 < 1.0 (lower irreversibility) over a wide Re range.

4.5.1. Overall Ranking Using Combined First- and Second-Law Metrics

Across the full range (Re = 5000–20,000), the overall ranking is dominated by the strong rectangularity group (AR = 0.50). TSD-AR0.50-P345 is the most consistent top performer in both laws. It gives the highest TPF at every Reynolds number, while also giving the lowest exergy destruction rate (ExD) and the lowest total entropy generation (Stotal) among all tested cases. Using the same point values shown in the plots, TSD-AR0.50-P345 yields TPF = 1.352 at Re = 5000, 1.303 at Re = 12,500, and 1.279 at Re = 20,000. At the same three Reynolds numbers, its exergy destruction drops from ExD = 8.44 to 4.84, while the baseline drops from 12.81 to 6.54. This corresponds to an ExD reduction of about 34.1% (Re = 5000), 28.9% (Re = 12,500), and 26% (Re = 20,000) compared to SD-AR1.00. The same “dual benefit” appears in total entropy generation: Stotal/Stotal0 ≈ 0.652 at Re = 5000, 0.695 at Re = 12,500, and 0.749 at Re = 20,000 (about 35% → 25% lower than the baseline as Re increases). These trends mean that the AR0.50-P345 duct is not only transferring more heat under a fair pumping-power weight (TPF), but it is also converting less of the available energy into losses (lower Stotal and ExD). The next best designs are still in the AR0.50 family. TSD-AR0.50-P543 and TSD-AR0.50-P444 both keep TPF > 1.0 across the full Re range, and both keep ExD/ExD0 < 1 and Stotal/Stotal0 < 1.0 as well. However, they remain below P345 in integrated strength. For example, at Re = 5000 their TPF values are 1.259 (P543) and 1.205 (P444), compared with 1.352 (P345), while at Re = 20,000 they are 1.211 (P543) and 1.176 (P444), compared with 1.279 (P345). This ordering is physically reasonable: P345 places the tightest twist (300 mm) near the inlet, where the thermal boundary layer is most responsive, then gradually relaxes the pitch downstream, which helps retain heat-transfer gains without letting the pressure penalty grow as strongly as a uniformly tight twist would. A “middle-ground” option is TSD-AR0.75-P345. It is the only AR0.75 twisted case that stays slightly above unity in TPF throughout the range (TPF ≈ 1.031 at Re = 5000 and 1.027 at Re = 20,000). It also maintains ExD/ExD0 ≈ 0.909–0.91 and Stotal/Stotal0 ≈ 0.907–0.932, so it improves second-law metrics clearly. However, its first-law advantage is modest because the friction increase is relatively large compared with the Nu gain (for example, at Re = 5000: Nu/Nu0 = 1.088 but f/f0 = 1.176), so it ranks below all AR0.50 twisted cases. Finally, most twisted cases with AR = 1.00 and the non-P345 cases with AR = 0.75 are not attractive in the combined sense, because their TPF stays below 1.0 over most (or all) of the Re range (for example, TSD-AR1.00-P444: TPF ≈ 0.95–0.96). Some of these cases can show small second-law improvements at high Re, but the combined thermo-hydraulic “cost vs. gain” is not favorable when judged by TPF together with ExD and Stotal.

4.5.2. Recommended Design and Practical Guidance

Based on the integrated evidence, the recommended optimal configuration in this work is TSD-AR0.50-P345. The contour plots provide simple physical support for this selection. The high-/low-temperature visualization (Figure 12) shows that TSD-AR0.50-P345 maintains a longer low-temperature penetration length along the test section than the other cases, which is consistent with its strong heat-transfer performance. The cross-sectional views (Figure 13, Figure 14 and Figure 15) also show strong but organized secondary motion and mixing in AR0.50, which helps suppress thermal irreversibility while keeping the overall benefit high. In short, the contours match the combined ranking from TPF, Stotal, and ExD. It is the only case that simultaneously provides: (i) the highest thermal performance factor at every Re, (ii) the lowest exergy destruction rate, and (iii) the lowest total entropy generation among all cases, while keeping these advantages consistent from Re = 5000 to 20,000. In practical terms, this case is the best choice when the goal is to upgrade a duct for compact heat-exchanger duty where both pumping power and useful-energy losses matter, not only the Nusselt number. For engineering selection, two simple rules are helpful. If the priority is maximum heat-transfer enhancement with strong overall benefit, choose AR0.50-P345 (for example, Nu/Nu0 ≈ 1.493 at Re = 5000 and 1.433 at Re = 20,000, with TPF = 1.352 → 1.279). If the priority is a safer pressure-loss level while still keeping a net benefit, then the alternatives AR0.50-P543 or AR0.50-P444 are reasonable compromises, since they still maintain TPF > 1.0 and keep ExD/ExD0 < 1.0 and Stotal/Stotal0 < 1.0 across the full range, but with a weaker overall gain than P345. If manufacturing or space constraints prevent using AR0.50, then AR0.75-P345 is the best “moderate-rectangularity” option, because it remains slightly beneficial by TPF while still giving clear second-law improvements. In summary, the integrated assessment shows that rectangularity (lower AR) is the main driver that enables the twist to create useful secondary motion without losing the balance, and the increasing pitch pattern (P345) is the best way to distribute that effect along the duct so that the early section boosts heat transfer strongly while the downstream section avoids excessive additional loss.

4.6. Comparison with Other Studies

Table 3 compares the present twisted square duct (TSD, AR = 0.50) with earlier studies at the same Reynolds number (Re = 5000). In this work, the three TSD cases provide Nu/Nu0 = 1.37–1.49, with the best result from TSD-AR0.50-P345 (1.49). This best case is about 4.9% higher than the experimental value reported by Promthaisong et al. [21] (1.42) and matches the result of Bhadouriya et al. [22] (1.49), but it is about 6.9% lower than the higher enhancement reported by Bhadouriya et al. [23] (1.6). Overall, the present study achieves a competitive heat-transfer improvement at Re = 5000, reaching the level of a strong reference case [22] while exceeding one experimental benchmark [21].

4.7. Correlations

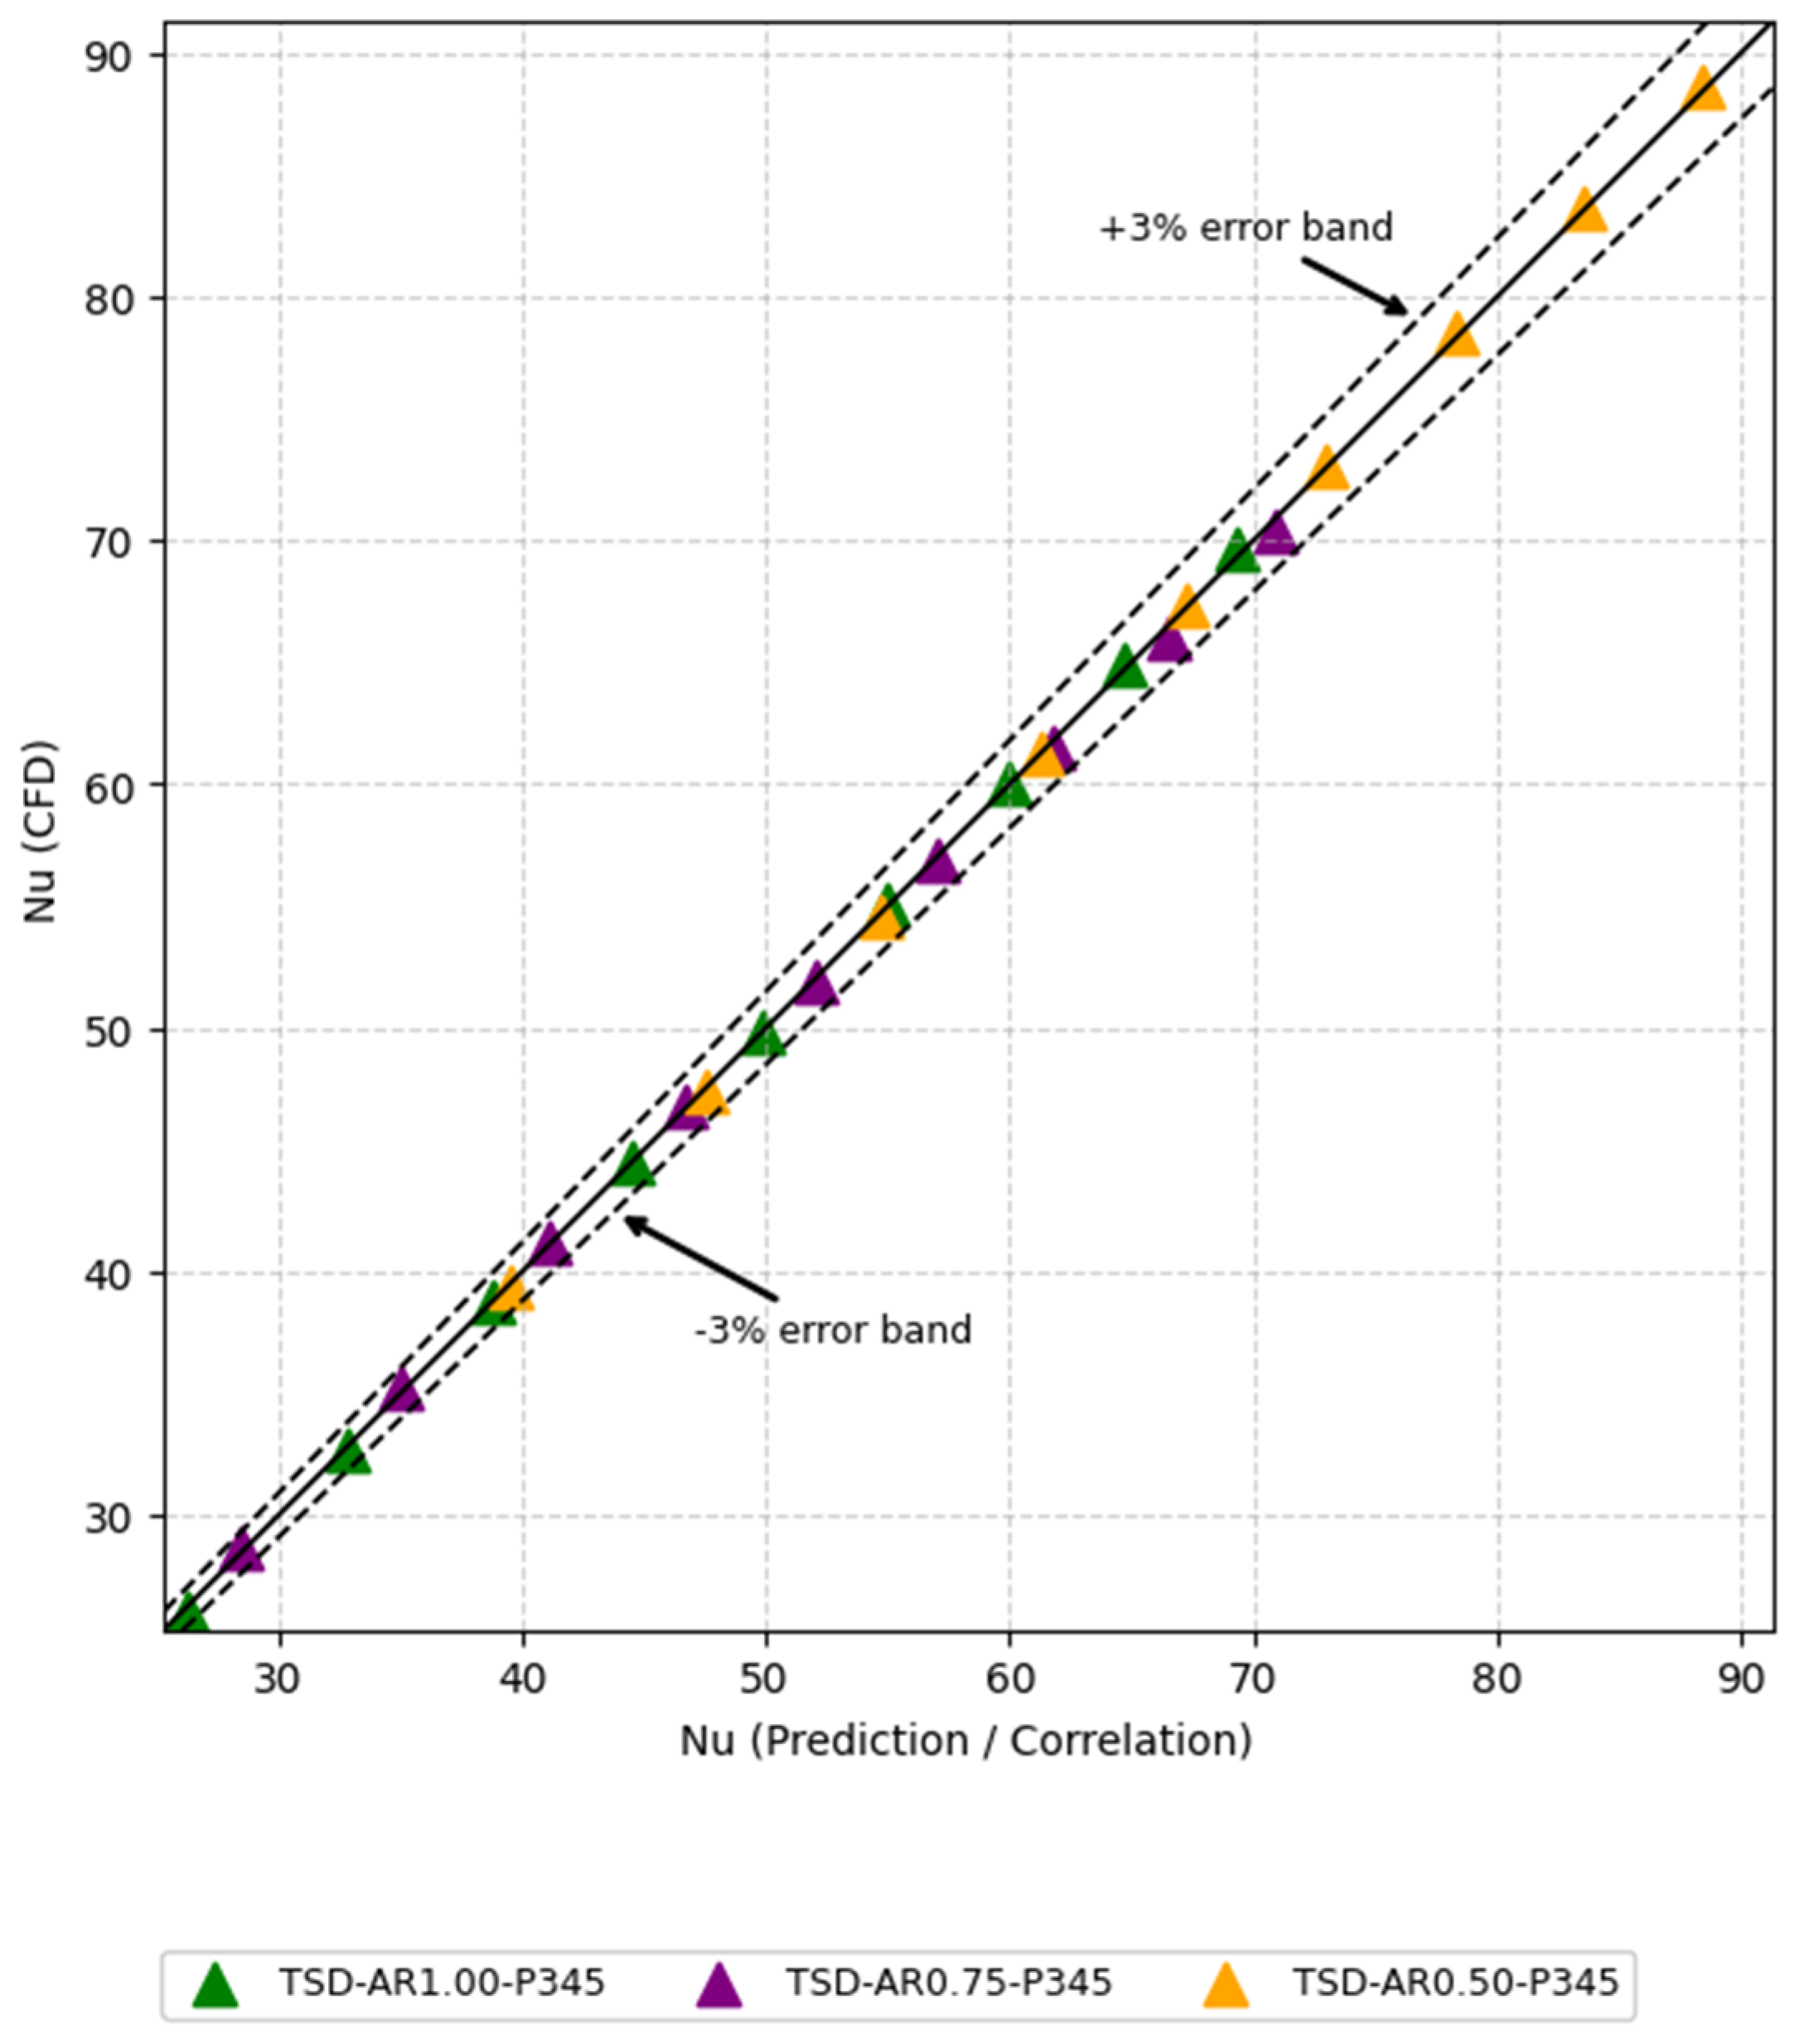
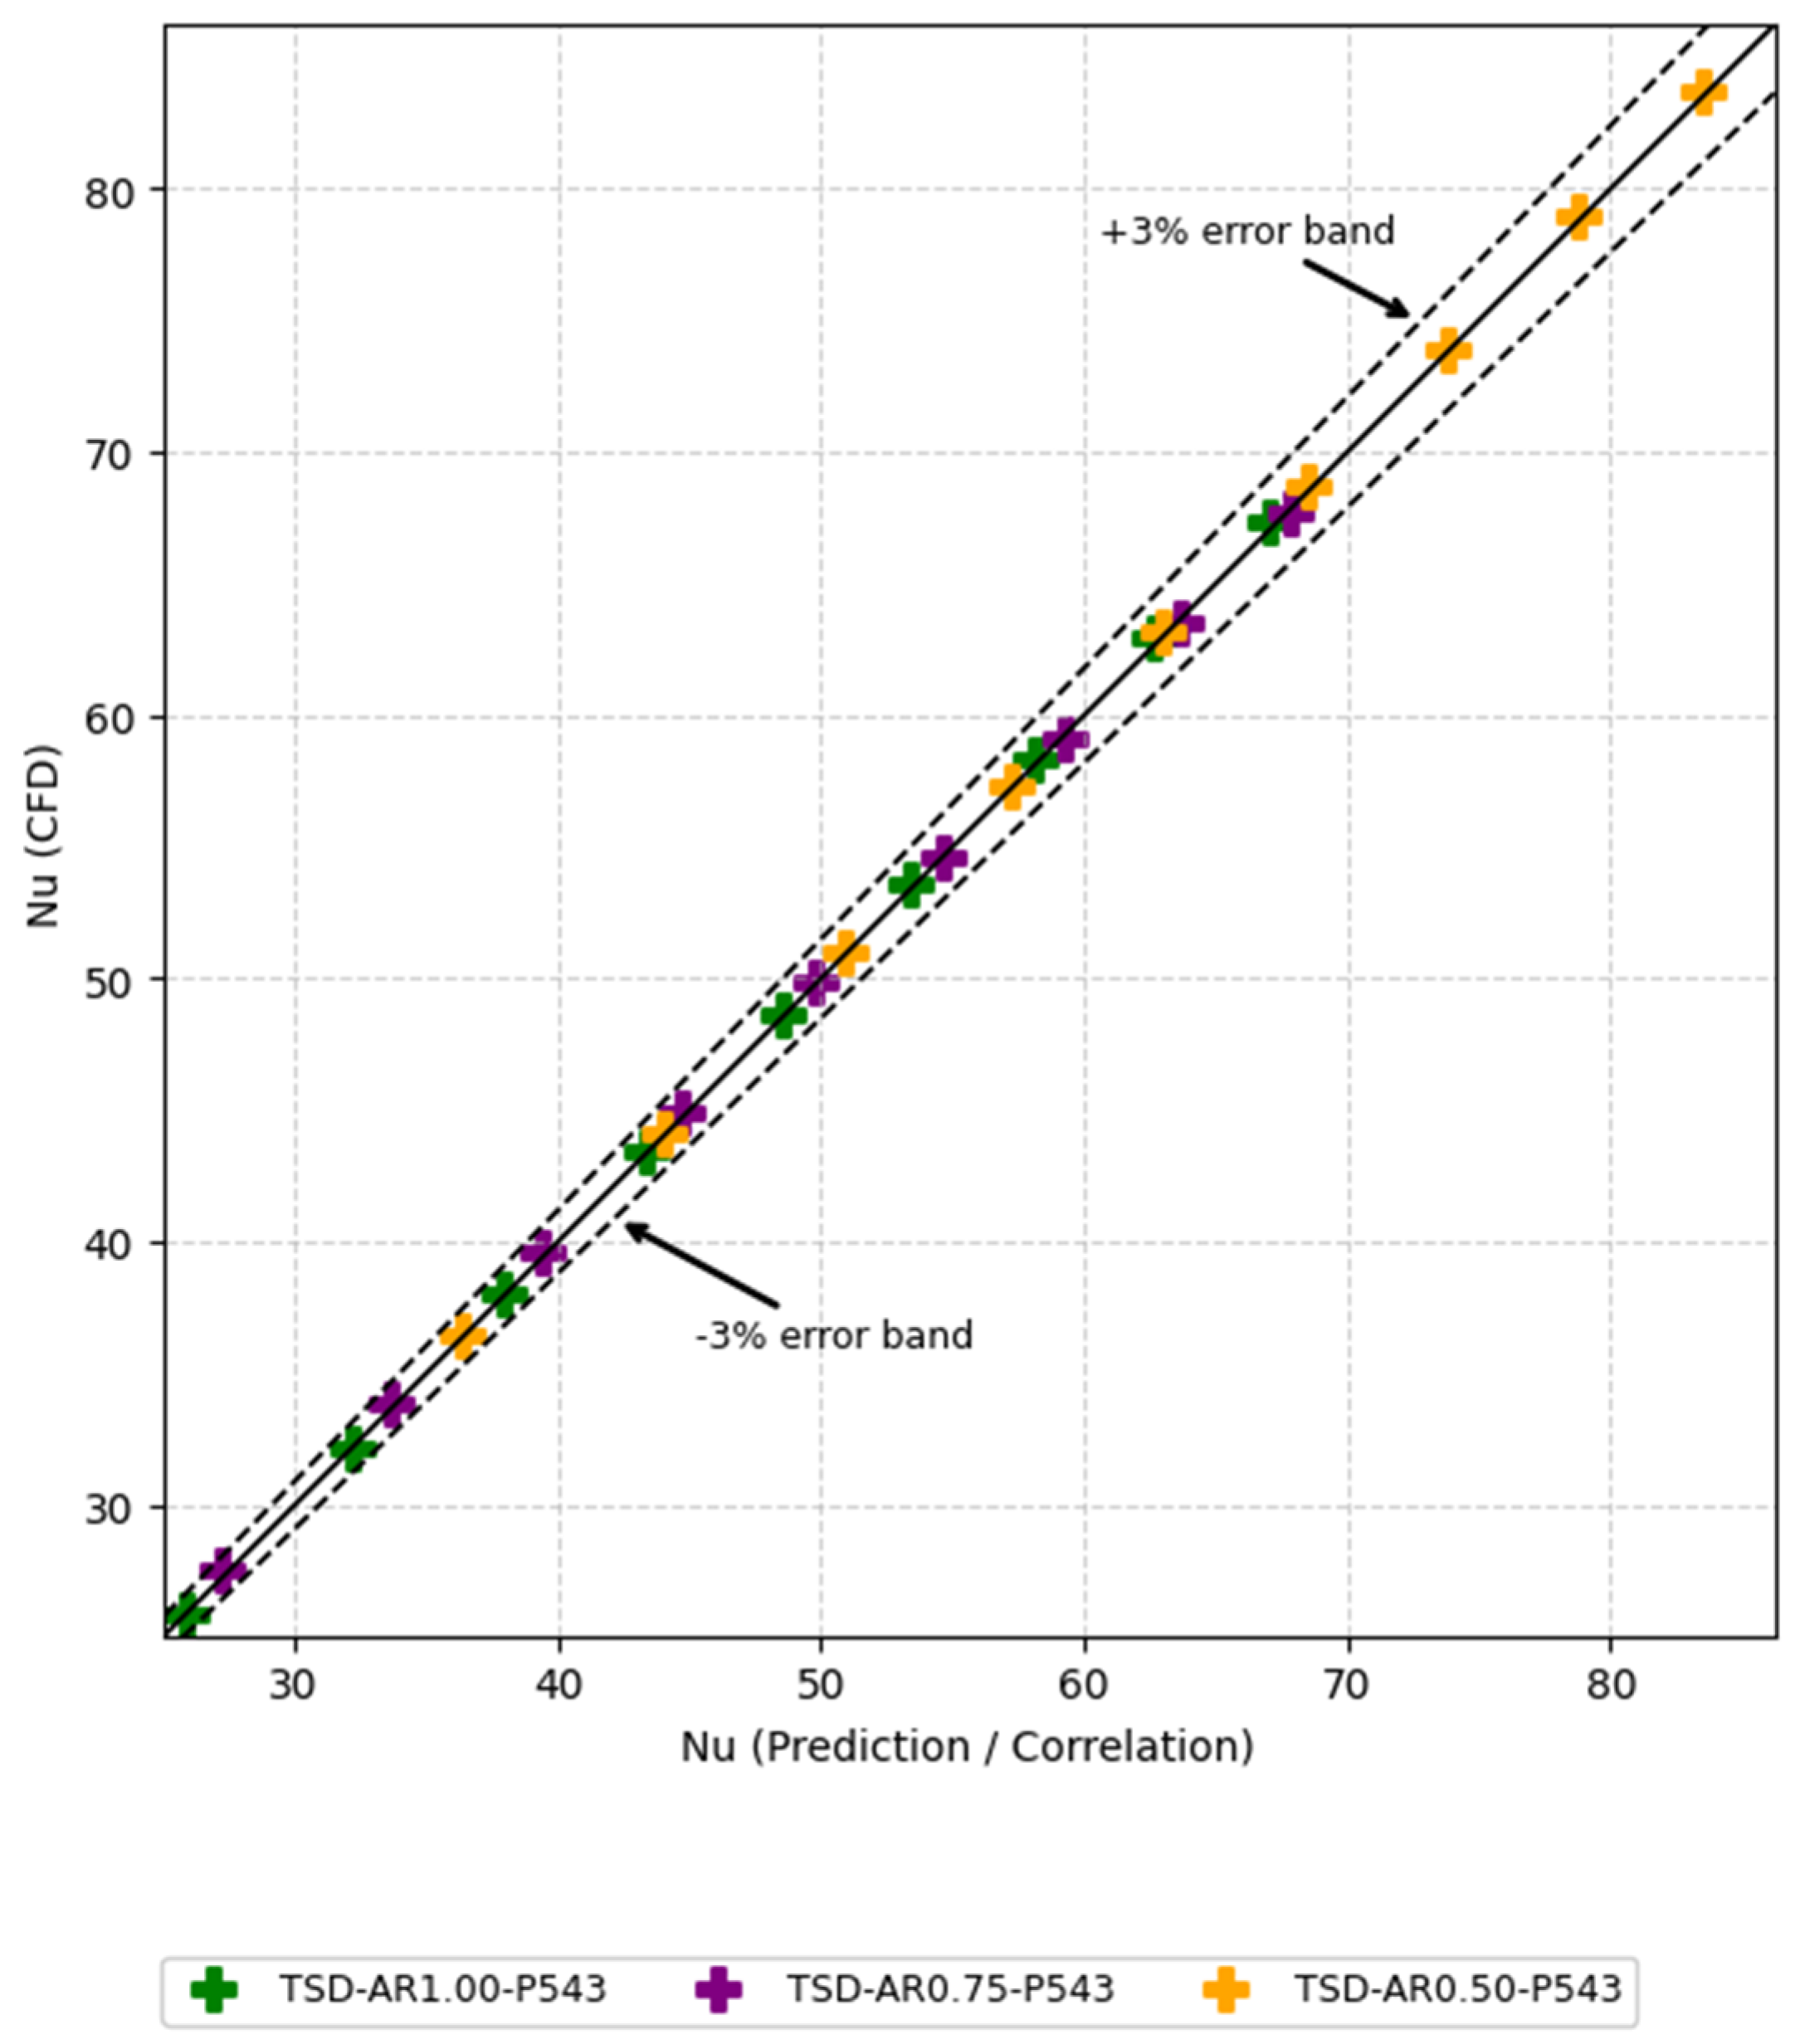
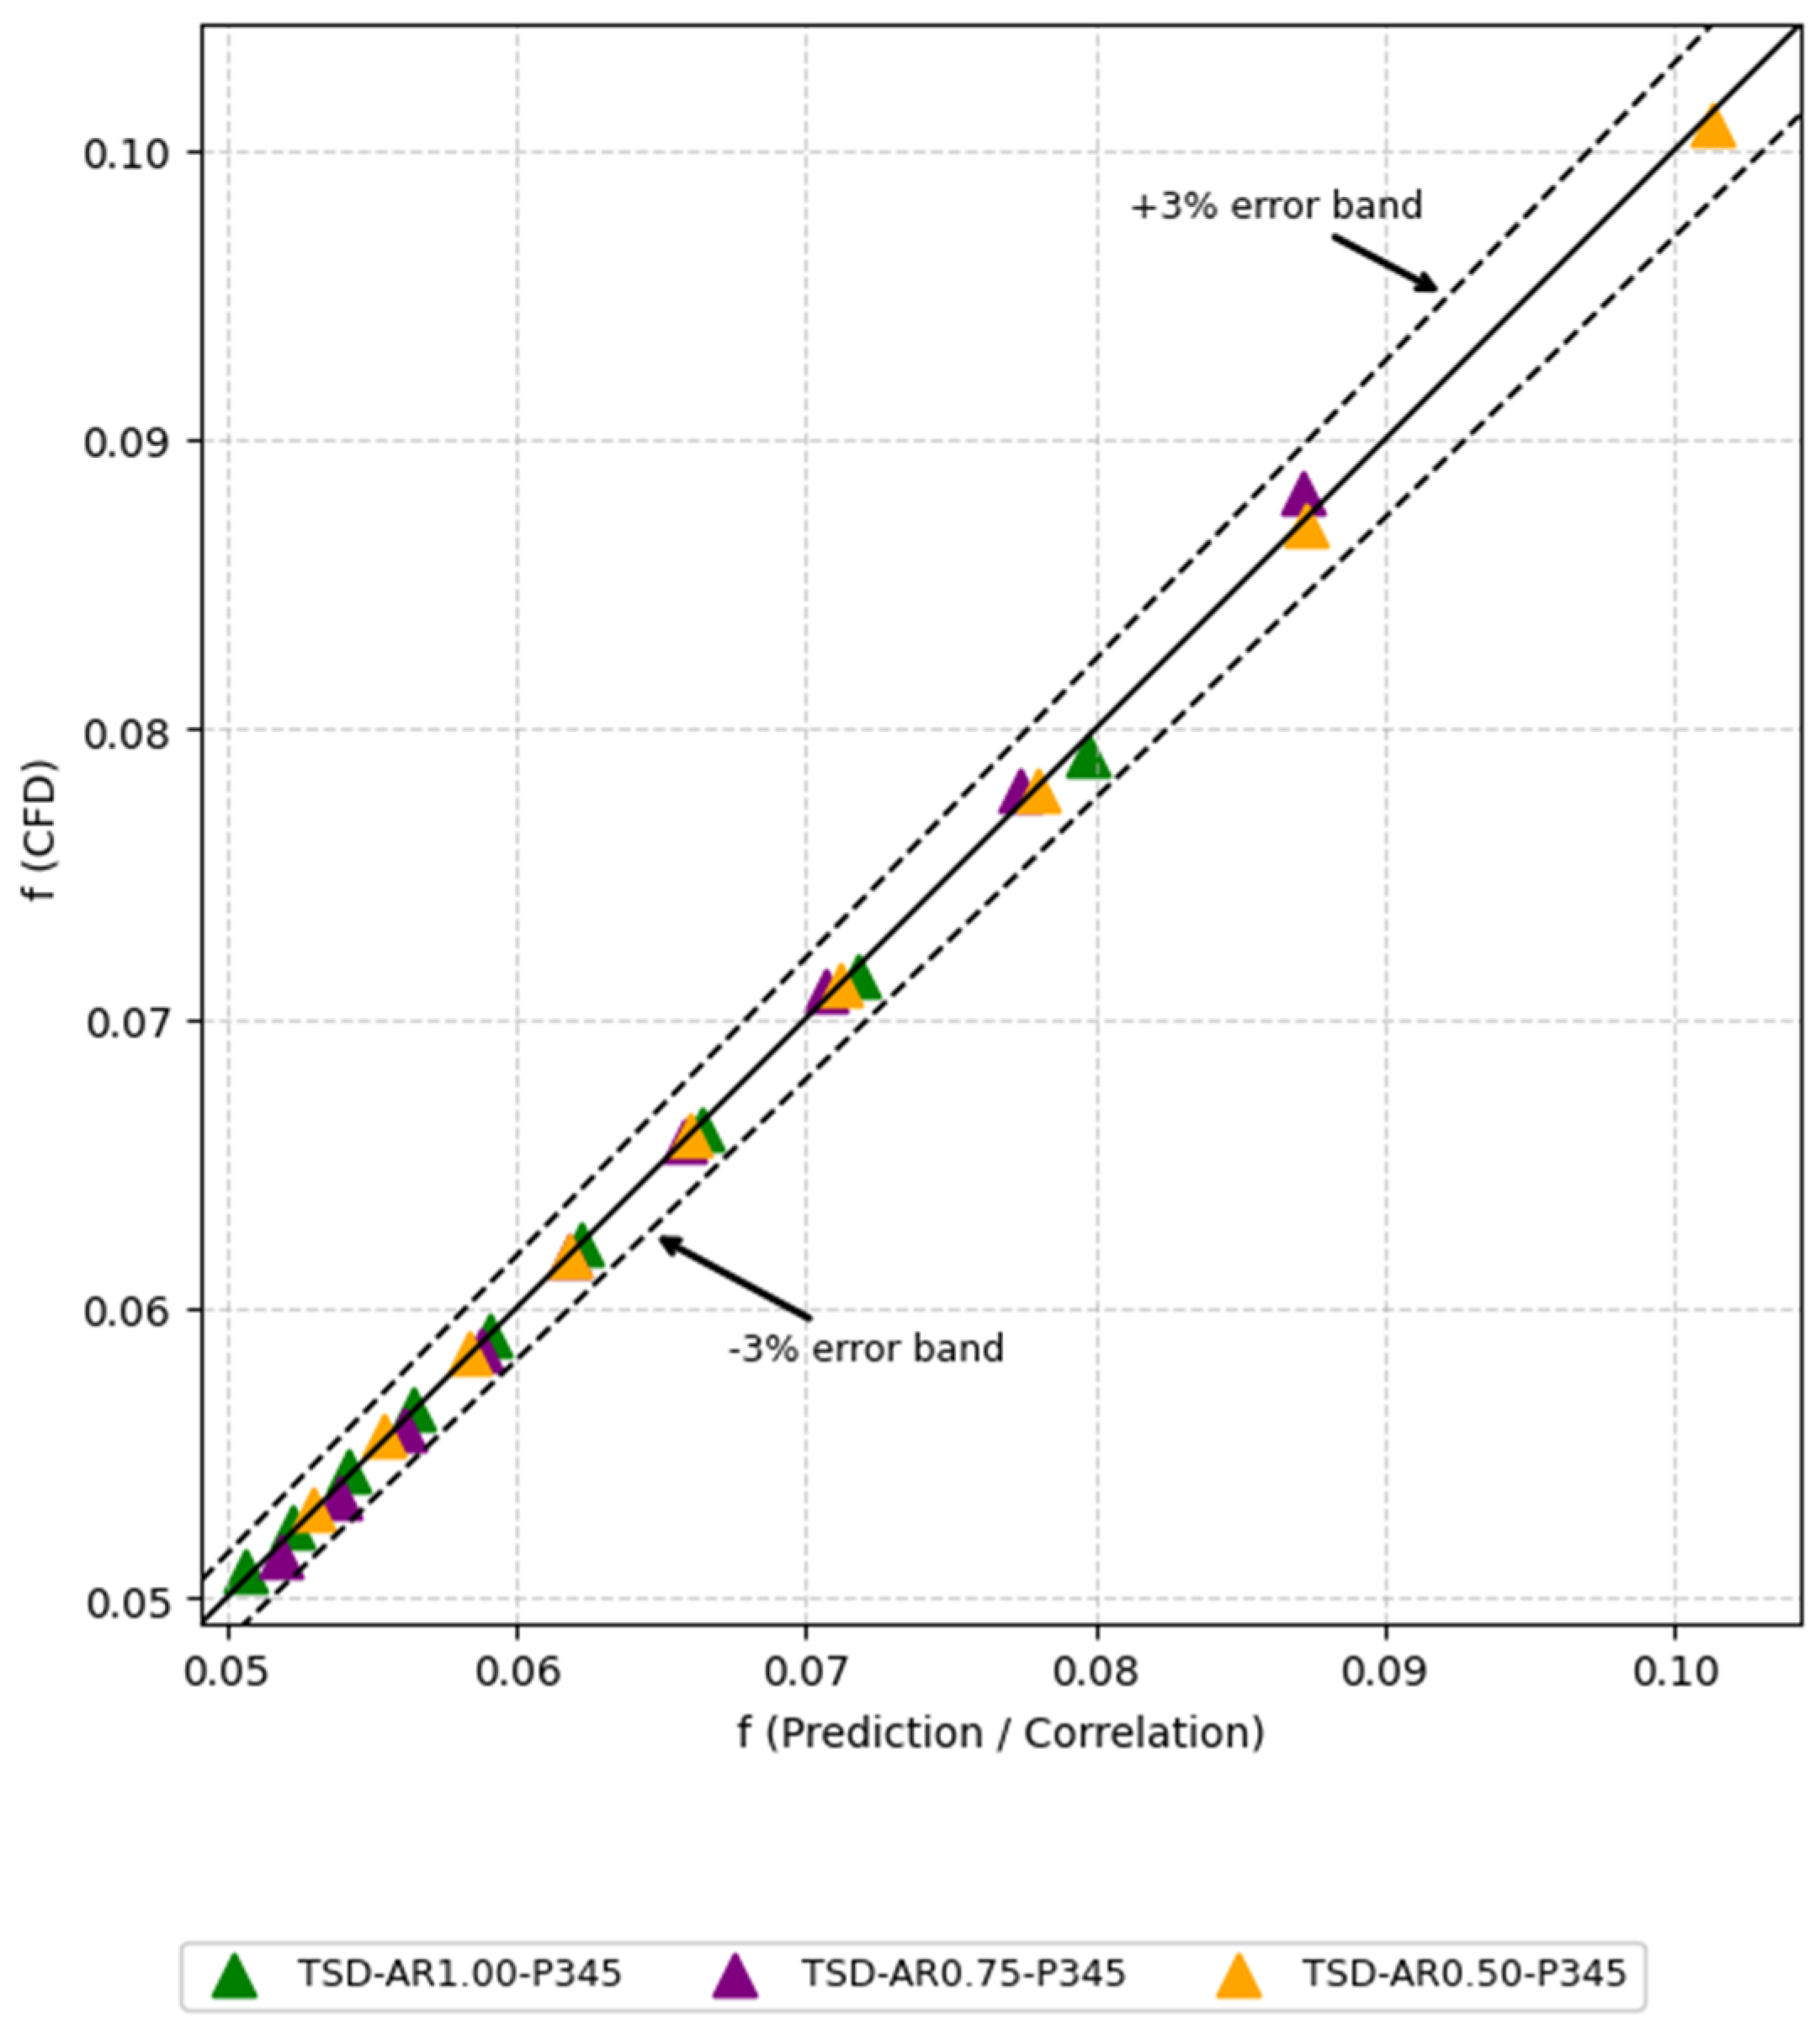
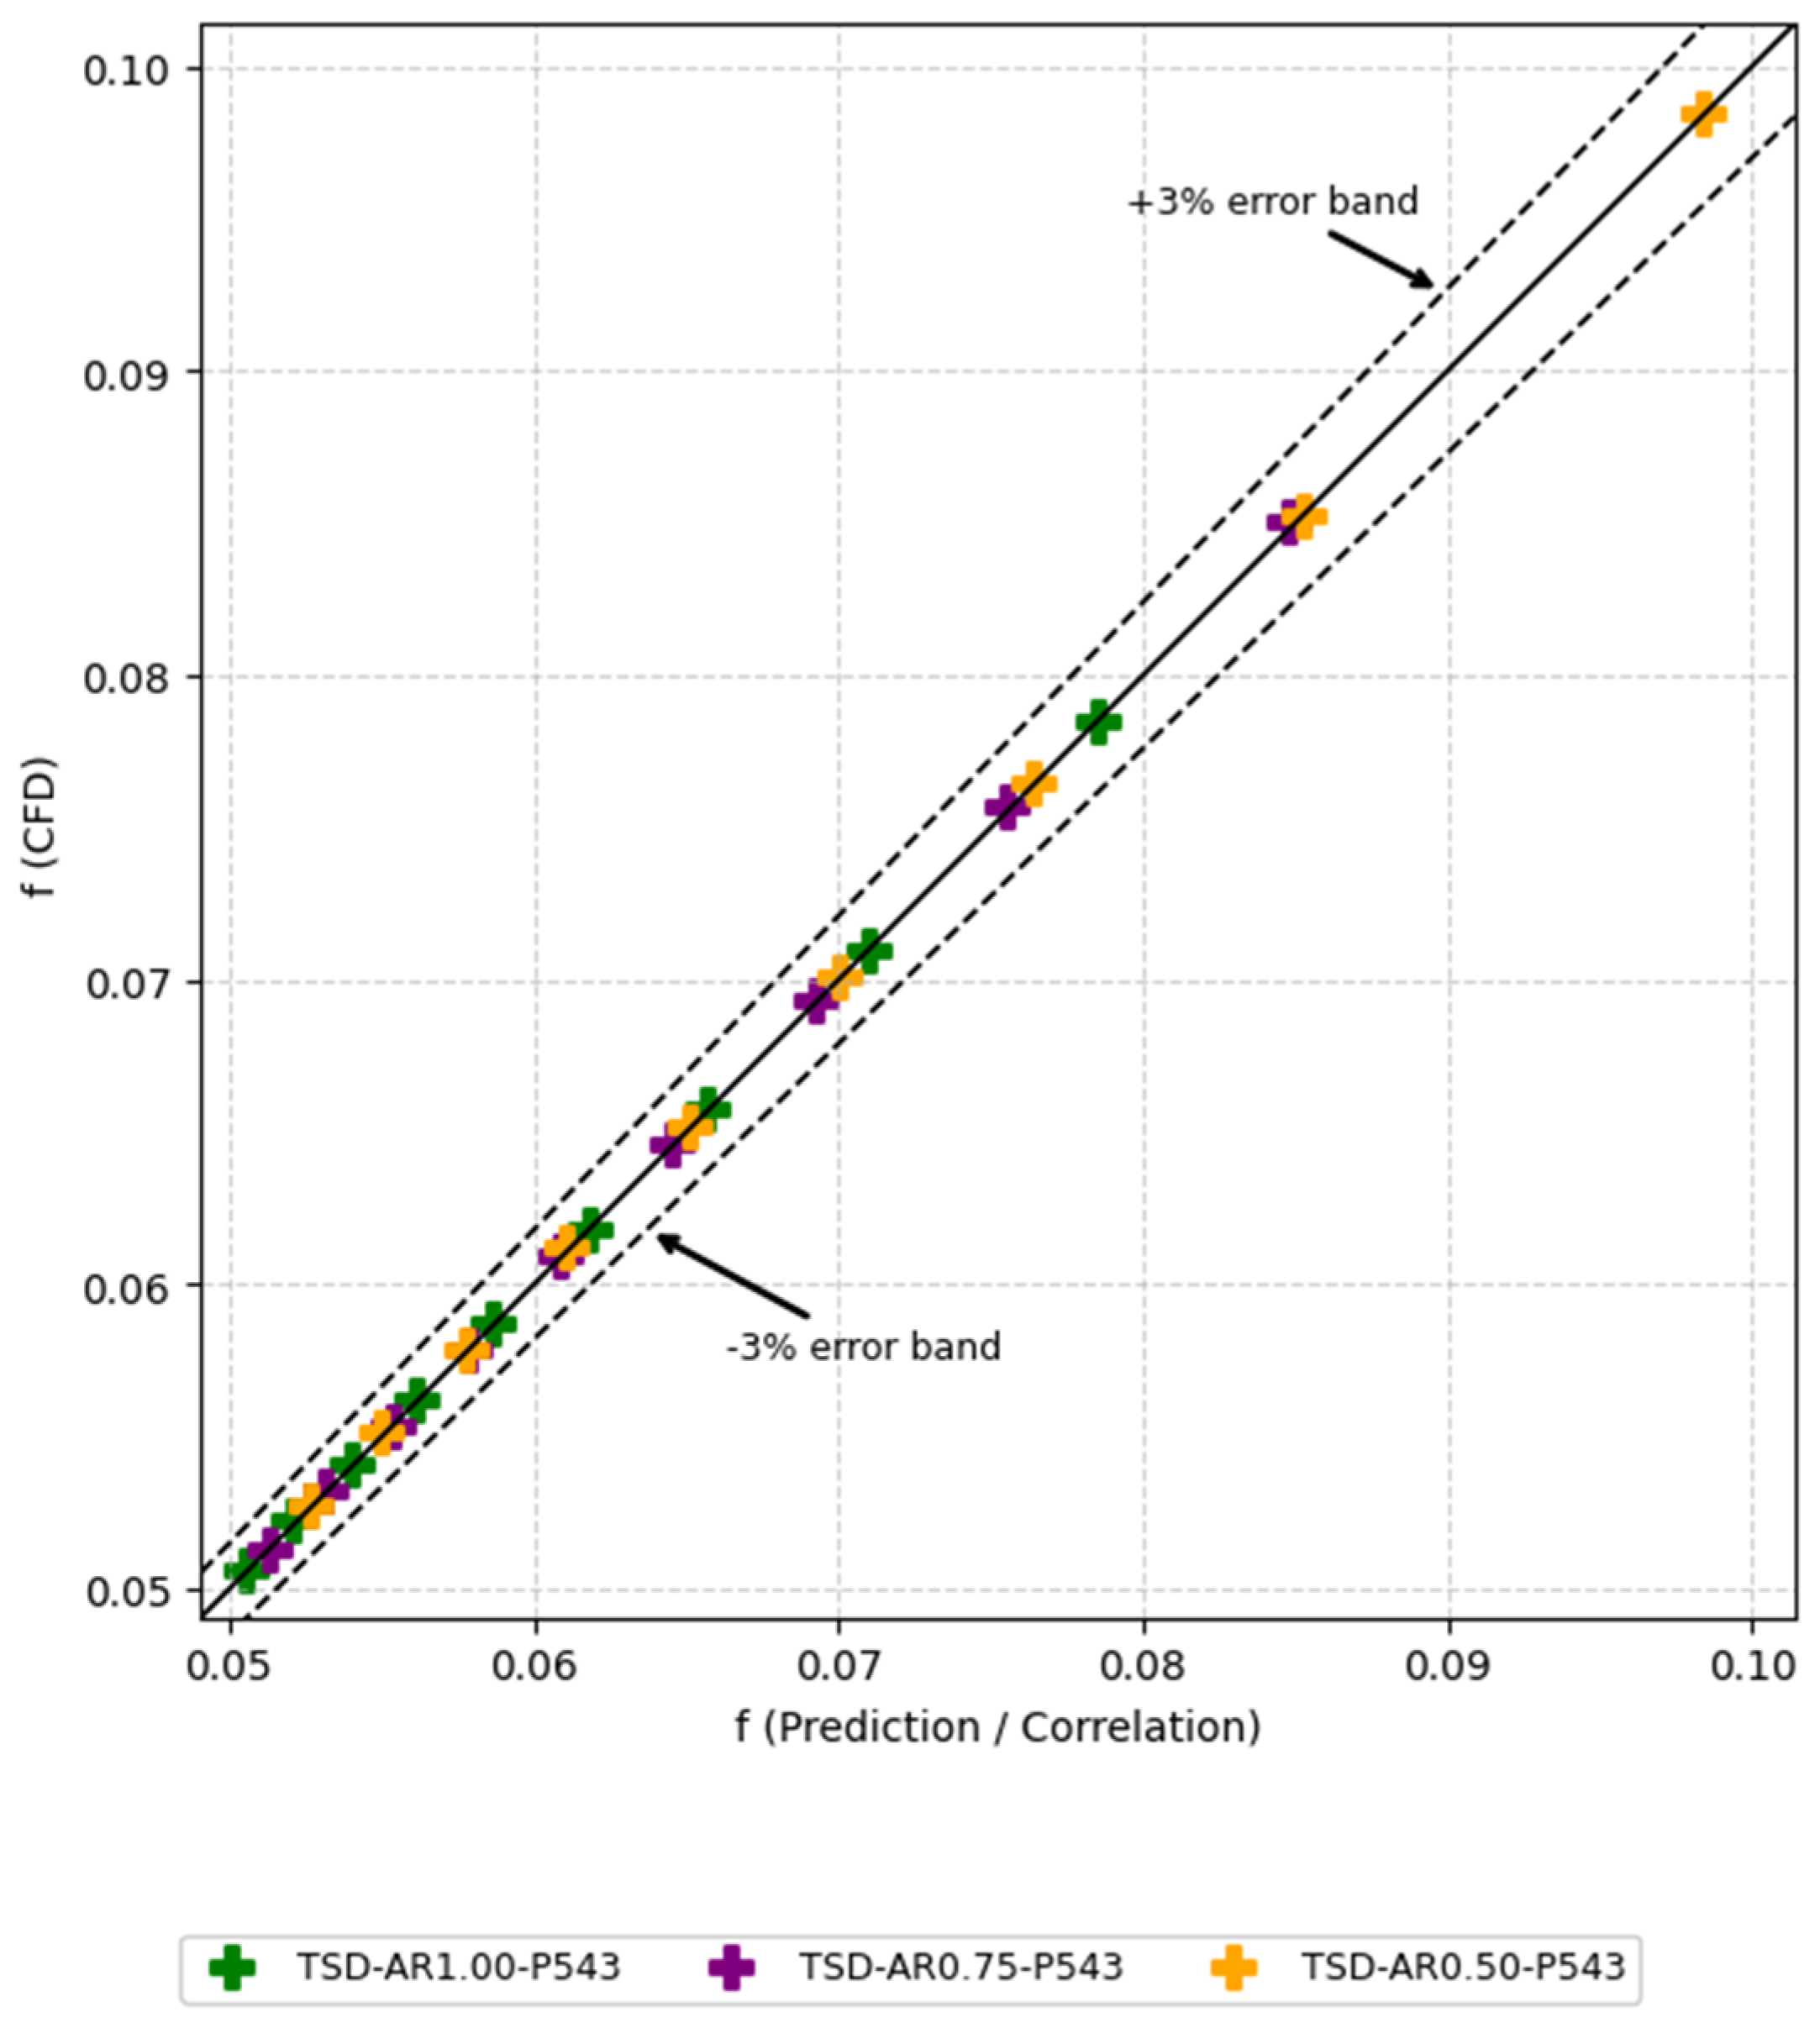
To provide compact predictive tools for the gradient-pitch twisted square duct, empirical correlations were developed for the Nusselt number (Nu) and the friction factor (f). Only the gradient-pitch configurations P345 and P543 were included, while the straight ducts (SD) and the constant-pitch case (P444) were excluded to keep the correlations consistent with the main focus of this work. The Reynolds-number range is 5000 ≤ Re ≤ 20,000, and the geometric range is 0.50 ≤ AR ≤ 1.00. The correlation database contains nine Reynolds numbers in this range. In the present dataset preparation, the intermediate Reynolds points were generated using a power-law interpolation between the values at Re = 5000 and Re = 20,000 for each case. The correlations were obtained by ordinary least squares regression in logarithmic space, using the variable X = 1/AR to represent the duct aspect-ratio effect in a simple and stable form. Separate correlations were fitted for P345 and P543 because the pitch sequence changes the flow development and cannot be represented accurately by a single unified set of constants. These correlations are valid only within the present dataset and should not be extrapolated to higher Reynolds numbers, other pitch sequences, or different twist geometries without additional validation. Parity plots show close agreement between the database and the correlations. Overall gradient-pitch cases, the mean absolute percentage error is ~0.257% for Nu and ~0.198% for f, and the maximum absolute deviations are ~1.086% for Nu and ~1.151% for f, which remain within the ±3% error band used in the parity plots (Figure 21, Figure 22, Figure 23 and Figure 24).
Nu correlation for P345
N u 345 = 0.027 R e ( 0.818 0.119 X ) e x p ( 0.644 X + 0.259 X 2 )
Nu correlation for P543
N u 543 = 0.043 R e ( 0.774 0.087 X ) e x p ( 0.265 X + 0.274 X 2 )
f correlation for P345
f 345 = 0.282 R e ( 0.186 0.140 X ) e x p ( 1.566 X 0.043 X 2 )
f correlation for P543
f 543 = 0.298 R e ( 0.185 0.133 X ) e x p ( 1.382 X 0.008 X 2 )

5. Conclusions

This study numerically investigated turbulent flow and heat transfer in straight square ducts (SD) and twisted square ducts (TSD) with constant pitch (P444) and gradient pitch (P345 and P543) for 5000 ≤ Re ≤ 20,000 and 0.50 ≤ AR ≤ 1.00. The main findings can be summarized as follows.
Nusselt number (Nu) and friction factor (f): For all configurations, Nu increases with Reynolds number. The twisted ducts generally provide higher Nu than the straight ducts, but this enhancement is accompanied by an increase in the friction factor. The strongest heat-transfer enhancement is obtained at the lowest aspect ratio, especially for TSD-AR0.50-P345, where Nu increases by 49.3% at Re = 5000 and 43.2% at Re = 20,000 compared with the baseline SD-AR1.00. The corresponding friction penalties are 34.5% and 40.5%, respectively.
Thermal performance factor (TPF): When heat-transfer gain and pumping-power penalty are combined, most twisted cases remain beneficial (TPF > 1.0), particularly at lower AR. The best overall thermal performance is again achieved by TSD-AR0.50-P345, with TPF = 1.352 at Re = 5000 and TPF = 1.279 at Re = 20,000, indicating a consistently favorable trade-off across the studied Reynolds range.
Total entropy generation: The total entropy generation shows a clear sensitivity to the geometry. In this dataset, reducing AR and applying the gradient pitch can reduce the overall irreversibility relative to the baseline. For TSD-AR0.50-P345, the total entropy generation decreases by 34.8% at Re = 5000 and 25.1% at Re = 20,000 compared with SD-AR1.00, suggesting that the improvement is not only energetic (first law) but also thermodynamically meaningful (second law).
Optimization outcome: Considering the results together (high Nu, acceptable f, high TPF, and low total entropy generation), the best overall design within the tested domain is TSD-AR0.50-P345. This case provides the highest Nu and TPF while also yielding one of the lowest total entropy generation levels, making it the most balanced option for practical use under the current operating range.
Effect of the parameters studied: (i) Aspect ratio (AR) is the dominant geometric parameter: lowering AR from 1.00 to 0.50 strengthens secondary flow and mixing, which improves heat transfer but also increases pressure loss. (ii) Pitch strategy influences performance even when the same three pitch values are used: the P345 sequence generally produces slightly higher Nu than P543 (about 6–8% for AR = 0.50 at the two Reynolds endpoints), with a similar or slightly higher f, resulting in a higher TPF for P345 within this dataset.
Two extensions are recommended. First, the present numerical trends should be validated by experimental measurements to confirm heat-transfer enhancement and pressure-drop penalties under controlled conditions. Second, the same geometries should be studied using laminar and transitional CFD regimes (with appropriate models and boundary conditions) to assess whether the gradient-pitch concept remains beneficial when the flow physics is dominated by viscous effects rather than turbulence.

Author Contributions

Conceptualization, P.S., S.L., A.P. and S.E.-a.; Methodology, P.S., S.L., A.P. and V.C.; Software, P.S. and S.L.; Validation, P.S. and S.L.; Formal analysis, P.S., S.L., A.P., N.M., T.S.W., M.H., P.N. and S.C.; Investigation, P.S., S.L., A.P., V.C., S.C. and S.E.-a.; Writing—original draft, P.S., S.L. and A.P.; Writing—review & editing, T.S.W., V.C. and S.E.-a.; Supervision, N.M., M.H., P.N., V.C. and S.E.-a.; Funding acquisition, V.C. All authors have read and agreed to the published version of the manuscript.

Funding

The authors gratefully acknowledge financial support provided by Thailand Science Research and Innovation (TSRI) and King Mongkut’s Institute of Technology, Ladkrabang (Grant no. RE-KRIS/FF65/44).

Institutional Review Board Statement

Not applicable.

Informed Consent Statement

Not applicable.

Data Availability Statement

The raw data supporting the conclusions of this article will be made available by the authors on request.

Acknowledgments

The authors gratefully acknowledge financial support provided by Thailand Science Research and Innovation (TSRI) and King Mongkut’s Institute of Technology, Ladkrabang.

Conflicts of Interest

The authors declare no competing interests.

Nomenclature

Ainternal surface area of the test tube [m2]
BeBejan number [−]
cpspecific heat of fluid [J/kg·K]
Dinner diameter of tube [m]
ffriction factor [−]
haverage convection coefficient [W/m2·K]
kfluid thermal conductivity [W/m·K]
Ltest tube length [m]
LxWinglet streamwise length measured on the tape [mm]
HyWinglet height measured normal to the tape edge/midline [mm]
LrDimensionless winglet length, Lr = Lx/W [−]
Hr Dimensionless winglet height, Hr = Hy/W [−]
m ˙ rate of mass airflow [kg/s]
NuNusselt number [−]
Nsentropy generation number [−]
ΔPpressure differential [Pa]
PrPrandtl number [−]
q′heat flux per tube length [W/m]
Qrate of transferring heat [W]
ReReynolds number [−]
S ˙ g rate of entropy generation [W/m3·K1]
Ttemperature [K]
Uaverage fluid velocity [m/s]
V ˙ rate of volume airflow [m3/s]
Wtape width [m]
Greek letters
μdynamic viscosity [Ns/m−2]
σkturbulent Prandtl numbers for k, dimensionless
σεturbulent Prandtl numbers for ε, dimensionless
εturbulent dissipation rate [m2 s−3]
ρfluid density [kg/m−3]
ηExexergy efficiency
νkinematic viscosity [m2 s−1]
Subscripts
0plain/smooth tube
ssurface
mmean
aair
convconvection
i, j, kdirections of the coordinate system
Superscripts
average
Abbreviations
SDStraight duct (untwisted); baseline.
TSDTwisted duct.
ARAspect ratio, AR = a/b.
P444Pitch 400–400–400 mm in three segments (inlet → outlet).
P345Pitch 300–400–500 mm in three segments (inlet → outlet).
P543Pitch 500–400–300 mm in three segments (inlet → outlet).
SD-ARx.xxStraight duct with aspect ratio AR = x.xx.
TSD-ARx.xx-PabcTwisted duct with aspect ratio AR = x.xx and pitch code Pabc (three segments from inlet → outlet).

References

  1. Gupta, A.; Uniyal, M. Review of heat transfer augmentation through different passive intensifier methods. IOSR J. Mech. Civ. Eng. 2012, 1, 14e21. [Google Scholar] [CrossRef]
  2. Yang, S.; Zhang, L.; Xu, H. Experimental study on convective heat transfer and flow resistance characteristics of water flow in twisted elliptical tubes. Appl. Therm. Eng. 2011, 31, 2981–2991. [Google Scholar] [CrossRef]
  3. Chang, K.S.; Choi, J.S.; Kim, J.S. Laminar fluid flow in a twisted elliptic tube. KSME J. 1988, 2, 44–51. [Google Scholar] [CrossRef]
  4. Arasteh, H.; Rahbari, A.; Mashayekhi, R.; Keshmiri, A.; Mahani, R.B.; Talebizadehsardari, P. Effect of pitch distance of rotational twisted tape on the heat transfer and fluid flow characteristics. Int. J. Therm. Sci. 2021, 170, 106966. [Google Scholar] [CrossRef]
  5. Mashoofi, N.; Pourahmad, S.; Pesteei, S.M. Study the effect of axially perforated twisted tapes on the thermal performance enhancement factor of a double tube heat exchanger. Case Stud. Therm. Eng. 2017, 10, 161–168. [Google Scholar] [CrossRef]
  6. Harish, H.; Manjunath, K. Heat and fluid flow behaviors in a laminar tube flow with circular protruded twisted tape inserts. Case Stud. Therm. Eng. 2022, 32, 101880. [Google Scholar] [CrossRef]
  7. Saysroy, A.; Eiamsa-ard, S. Enhancing convective heat transfer in laminar and turbulent flow regions using multi-channel twisted tape inserts. Int. J. Therm. Sci. 2017, 121, 55–74. [Google Scholar] [CrossRef]
  8. Natarajan, A.; Venkatesh, R.; Gobinath, S.; Devakumar, L.; Gopalakrishnan, K. CFD simulation of heat transfer enhancement in circular tube with twisted tape insert by using nanofluids. In Materials Today: Proceedings; Elsevier Ltd.: Amsterdam, The Netherlands, 2020; Volume 21, pp. 572–577. [Google Scholar]
  9. Nakhchi, M.E.; Esfahani, J.A. Numerical investigation of rectangular-cut twisted tape insert on performance improvement of heat exchangers. Int. J. Therm. Sci. 2019, 138, 75–83. [Google Scholar] [CrossRef]
  10. Nakhchi, M.E.; Esfahani, J.A. Performance intensification of turbulent flow through heat exchanger tube using double V-cut twisted tape inserts. Chem. Eng. Process.-Process Intensif. 2019, 141, 107533. [Google Scholar] [CrossRef]
  11. Abed, A.M.; Majdi, H.S.; Hussein, Z.; Fadhil, D.; Abdulkadhim, A. Numerical analysis of flow and heat transfer enhancement in a horizontal pipe with P-TT and V-Cut twisted tape. Case Stud. Therm. Eng. 2018, 12, 749–758. [Google Scholar] [CrossRef]
  12. Dandoutiya, B.K.; Kumar, A. W-cut twisted tape’s effect on the thermal performance of a double pipe heat exchanger: A numerical study. Case Stud. Therm. Eng. 2022, 34, 102031. [Google Scholar] [CrossRef]
  13. He, Y.; Liu, L.; Li, P.; Ma, L. Experimental study on heat transfer enhancement characteristics of tube with cross hollow twisted tape inserts. Appl. Therm. Eng. 2018, 131, 743–749. [Google Scholar] [CrossRef]
  14. Paneliya, S.; Khanna, S.; Patel, U.; Prajapati, P.; Mukhopadhyay, I. Systematic investigation on fluid flow and heat transfer characteristic of a tube equipped with variable pitch twisted tape. Int. J. Thermofluids 2020, 1, 100005. [Google Scholar] [CrossRef]
  15. Eiamsa-ard, S.; Changcharoen, W. Flow structure and heat transfer in a square duct fitted with dual/quadruple twisted-tapes: Influence of tape configuration. J. Mech. Sci. Technol. 2015, 29, 3501–3518. [Google Scholar] [CrossRef]
  16. Chang, S.W.; Wu, P.S.; Liu, J.H. Aerothermal performance of square duct enhanced by twisted tape with inclined ribs and slots. Int. J. Heat Mass Transf. 2021, 177, 121547. [Google Scholar] [CrossRef]
  17. Patil, S.V.; Babu, P.V.V. Heat transfer and pressure drop studies through a square duct fitted with increasing and decreasing order of twisted tape. Heat Transf. Eng. 2014, 35, 1380–1387. [Google Scholar] [CrossRef]
  18. Saha, S.K.; Mallick, D.N. Heat transfer and pressure drop characteristics of laminar flow in rectangular and square plain ducts and ducts with twisted-tape inserts. J. Heat Transf. 2005, 127, 966–977. [Google Scholar] [CrossRef]
  19. Patil, S.V.; Vijaybabu, P.V. Heat transfer enhancement through a square duct fitted with twisted tape inserts. Heat Mass Transf. 2012, 48, 1803–1811. [Google Scholar] [CrossRef]
  20. Khoshvaght-Aliabadi, M.; Khaligh, S.F.; Tavassoli, Z. An investigation of heat transfer in heat exchange devices with spirally-coiled twisted-ducts using nanofluid. Appl. Therm. Eng. 2018, 143, 358–375. [Google Scholar] [CrossRef]
  21. Promthaisong, P.; Chuwattanakul, V.; Eiamsa-ard, S. 3D numerical analysis of thermal-hydraulic behaviors of turbulent flow inside twisted square ducts. Thermophys. Aeromech. 2020, 27, 345–357. [Google Scholar] [CrossRef]
  22. Bhadouriya, R.; Agrawal, A.; Prabhu, S.V. Experimental and numerical study of fluid flow and heat transfer in a twisted square duct. Int. J. Heat Mass Transf. 2015, 82, 143–158. [Google Scholar] [CrossRef]
  23. Bhadouriya, R.; Agrawal, A.; Prabhu, S.V. Experimental and numerical study of fluid flow and heat transfer in an annulus of inner twisted square duct and outer circular pipe. Int. J. Therm. Sci. 2015, 94, 96–109. [Google Scholar] [CrossRef]
  24. Promvonge, P.; Sripattanapipat, S.; Suchatawat, M.; Nakhchi, M.E.; Skullong, S. Effect of louver-perforated V-type baffles on thermal effectiveness and entropy in round tube. Int. J. Therm. Sci. 2025, 214, 109939. [Google Scholar] [CrossRef]
  25. Promvonge, P.; Thianpong, C.; Jayranaiwachira, N.; Nakhchi, M.E.; Skullong, S. Effect of trapezoidal louvered winglets on increased heat transfer and exergy in tubular heat exchanger. Int. J. Therm. Sci. 2024, 204, 109214. [Google Scholar] [CrossRef]
  26. Alsharifi, T.; Aljibori, H.S.S.; Mahdi, J.M. Design optimization and performance evaluation of a photovoltaic/thermal collector with porous twisted tape inserts: A comprehensive energy and exergy analysis. Int. Commun. Heat Mass Transf. 2024, 159, 108104. [Google Scholar] [CrossRef]
  27. Elmasry, Y.; Chaturvedi, R.; Ali, A.; Mamun, K.; Hadrawi, S.K.; Smaisim, G.F. Numerical analysis and RSM modeling of the effect of using a V-cut twisted tape turbulator in the absorber tube of a photovoltaic/thermal system on the energy and exergy performances of the system. Eng. Anal. Bound. Elem. 2023, 155, 340–350. [Google Scholar] [CrossRef]
  28. Kalateh, M.R.; Kianifar, A.; Sardarabadi, M. Energy, exergy, and entropy generation analyses of a water-based photovoltaic thermal system equipped with clockwise counter-clockwise twisted tapes: An indoor experimental study. Appl. Therm. Eng. 2022, 215, 118906. [Google Scholar] [CrossRef]
  29. Jayranaiwachira, N.; Promvonge, P.; Tongyote, P.; Skullong, S.; Nakhchi, M.E. Analysis of exergy and heat transfer in a tube fitted with flapped V-baffles. Case Stud. Therm. Eng. 2024, 59, 104483. [Google Scholar] [CrossRef]
  30. Eiamsa-ard, S.; Kiatkittipong, K. Heat transfer enhancement by multiple twisted tape inserts and TiO2/water nanofluid. Appl. Therm. Eng. 2014, 70, 896–924. [Google Scholar] [CrossRef]
  31. Bucak, H.; Yilmaz, F. Heat transfer augmentation using periodically spherical dimple-protrusion patterned walls of twisted tape. Int. J. Therm. Sci. 2022, 171, 107211. [Google Scholar] [CrossRef]
  32. Kaood, A.; Fadodun, O.G. Numerical investigation of turbulent entropy production rate in conical tubes fitted with a twisted-tape insert. Int. Commun. Heat Mass Transf. 2022, 139, 106520. [Google Scholar] [CrossRef]
  33. Gnielinski, V. New equations for heat transfer in turbulent pipe and channel flows. Int. Chem. Eng. 1976, 16, 359–368. [Google Scholar]
  34. Promvonge, P.; Skullong, S.; Kwankaomeng, S.; Thiangpong, C. Heat transfer in square duct fitted diagonally with angle-finned tape-Part 1: Experimental study. Inter. Com. Heat Mass Transf. 2012, 39, 617–624. [Google Scholar] [CrossRef]
  35. Flionenko, G.K. Hydraulic resistance in pipes. Teploenergetika 1954, 1, 40–44. (In Russian) [Google Scholar]
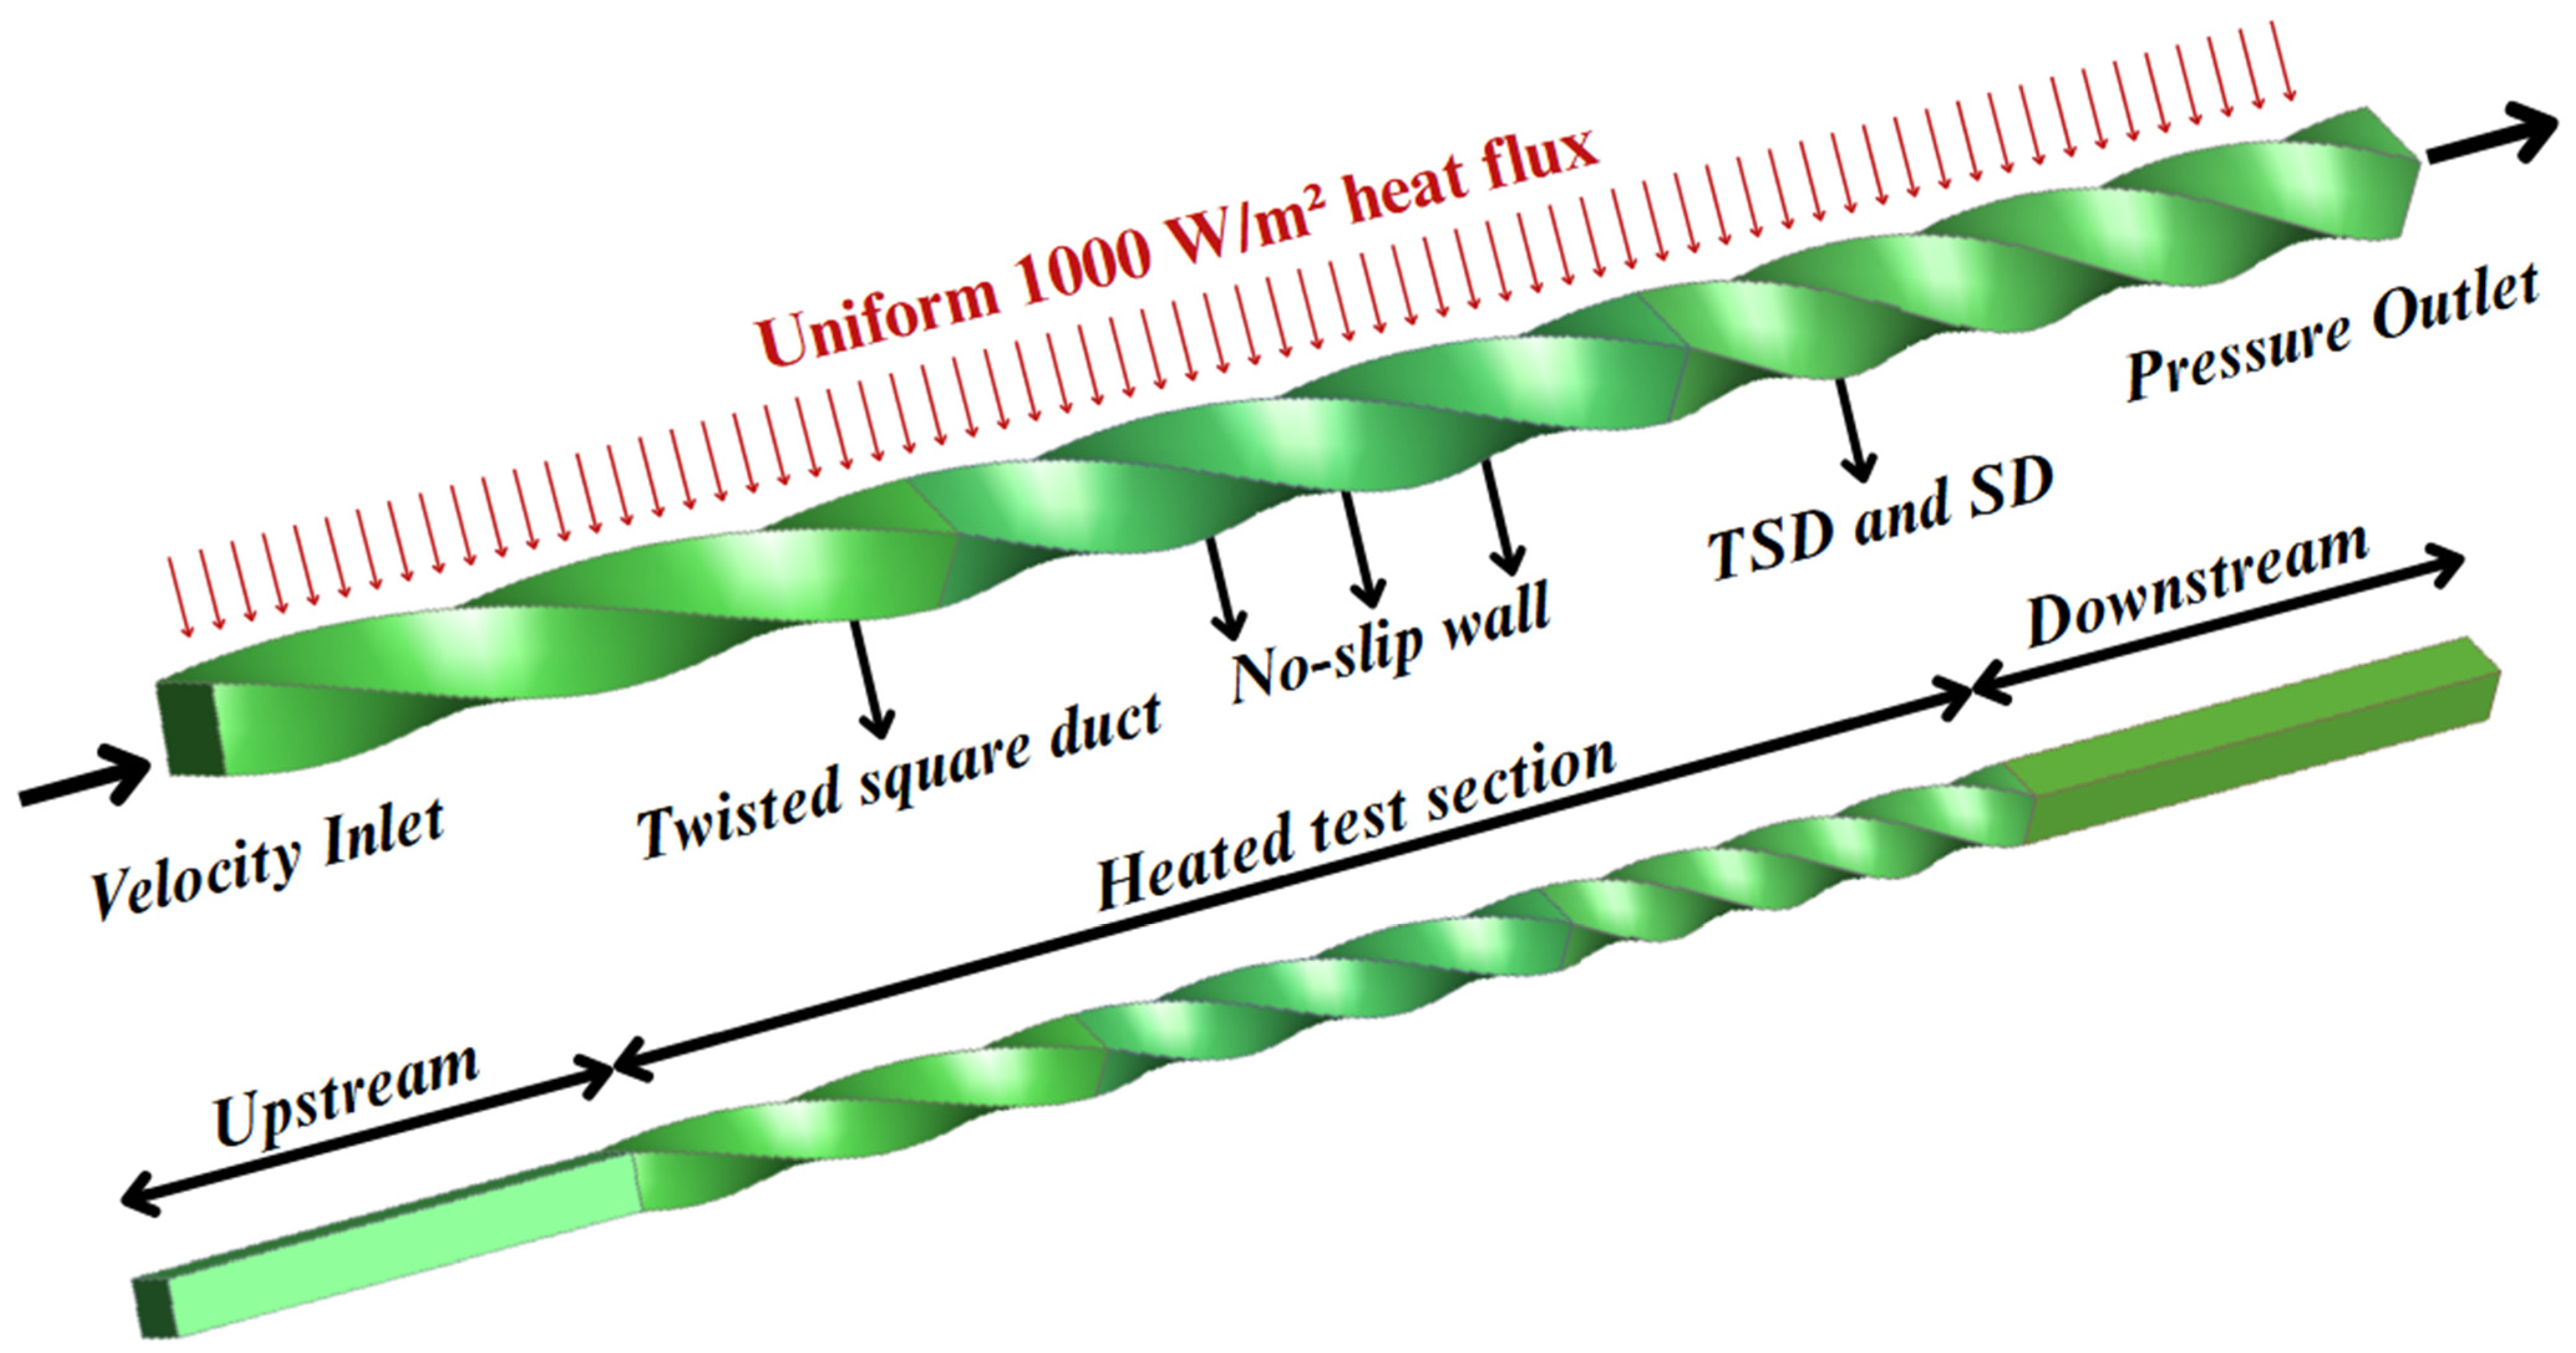
Figure 1. Physical model with boundary conditions.
Eng 07 00166 g001
Figure 2. Axial twist pitch distributions for the uniform and gradient twisted ducts.
Eng 07 00166 g002
Figure 3. Cross-sectional geometries for AR1.00, AR0.75, and AR0.50.
Eng 07 00166 g003
Figure 4. Representative computational mesh of a twisted duct.
Eng 07 00166 g004
Figure 5. Grid independence study: Nu and f vs. number of elements.
Eng 07 00166 g005
Figure 6. Validation of numerical results for the plain tube: (a) Nusselt number, and (b) friction factor [33,34,35].
Eng 07 00166 g006aEng 07 00166 g006b
Figure 7. Effect of the gradient-pitch twisted square ducts with variable aspect ratios on Nusselt number.
Eng 07 00166 g007aEng 07 00166 g007b
Figure 8. Effect of the gradient-pitch twisted square ducts with variable aspect ratios on the friction factor.
Eng 07 00166 g008aEng 07 00166 g008b
Figure 9. Effect of the gradient-pitch twisted square ducts with variable aspect ratios on thermal performance factor (TPF).
Eng 07 00166 g009
Figure 10. Wall fluid temperature contours for full test section.
Eng 07 00166 g010
Figure 11. Wall fluid temperature contours for enlarged outlet region.
Eng 07 00166 g011
Figure 12. High- and low-temperature regions over the full test section (wall–fluid temperature contours), highlighting the temperature penetration length.
Eng 07 00166 g012
Figure 13. Cross-sectional temperature contours at x/L = 0.8.
Eng 07 00166 g013
Figure 14. Cross-sectional turbulent kinetic energy (TKE) contours at x/L = 0.8.
Eng 07 00166 g014
Figure 15. Streamlines (velocity vectors) at x/L = 0.8.
Eng 07 00166 g015
Figure 16. Effect of the gradient-pitch twisted square ducts with variable aspect ratios on entropy generation due to heat transfer (Sht).
Eng 07 00166 g016
Figure 17. Effect of the gradient-pitch twisted square ducts with variable aspect ratios on entropy generation due to heat transfer (Sf).
Eng 07 00166 g017
Figure 18. Effect of the gradient-pitch twisted square ducts with variable aspect ratios on total entropy generation (Stotal).
Eng 07 00166 g018
Figure 19. Effect of the gradient-pitch twisted square ducts with variable aspect ratios on Bejan number (Be).
Eng 07 00166 g019
Figure 20. Effect of the gradient-pitch twisted square ducts with variable aspect ratios on exergy destruction rate (ExD).
Eng 07 00166 g020
Figure 21. Empirical correlations for the Nusselt number, GTSD. (P345 parity plot).
Eng 07 00166 g021
Figure 22. Empirical correlations for the Nusselt number, GTSD. (P543 parity plot).
Eng 07 00166 g022
Figure 23. Empirical correlations for the friction factors, GTSD. (P345 parity plot).
Eng 07 00166 g023
Figure 24. Empirical correlations for the friction factors, GTSD. (P543 parity plot).
Eng 07 00166 g024
Table 1. Detailed information.
CaseDescriptionAR = a/bPitch Code
SD-AR1.00Straight square duct, a = 30 mm, b = 30 mm (1:1); no twist, baseline.1.00-
SD-AR0.75Straight square duct, a = 26.25 mm, b = 35 mm (3:4); no twist, baseline.0.75-
SD-AR0.50Straight square duct, a = 22.5 mm, b = 45 mm (1:2); no twist, baseline.0.50-
TSD-AR1.00-P444Twisted square duct, a = 30 mm, b = 30 mm (1:1); P444: pitch 400–400–400 mm in three segments.1.00P444
TSD-AR1.00-P345Twisted square duct, a = 30 mm, b = 30 mm (1:1); P345: pitch 300–400–500 mm from inlet to outlet.1.00P345
TSD-AR1.00-P543Twisted square duct, a = 30 mm, b = 30 mm (1:1); P543: pitch 500–400–300 mm from inlet to outlet.1.00P543
TSD-AR0.75-P444Twisted rectangular duct, a = 26.25 mm, b = 35 mm (3:4); P444: pitch 400–400–400 mm in three segments.0.75P444
TSD-AR0.75-P345Twisted rectangular duct, a = 26.25 mm, b = 35 mm (3:4); P345: pitch 300–400–500 mm from inlet to outlet.0.75P345
TSD-AR0.75-P543Twisted rectangular duct, a = 26.25 mm, b = 35 mm (3:4); P543: pitch 500–400–300 mm from inlet to outlet.0.75P543
TSD-AR0.50-P444Twisted rectangular duct, a = 22.5 mm, b = 45 mm (1:2); P444: pitch 400–400–400 mm in three segments.0.50P444
TSD-AR0.50-P345Twisted rectangular duct, a = 22.5 mm, b = 45 mm (1:2); P345: pitch 300–400–500 mm from inlet to outlet.0.50P345
TSD-AR0.50-P543Twisted rectangular duct, a = 22.5 mm, b = 45 mm (1:2); P543: pitch 500–400–300 mm from inlet to outlet.0.50P543
Table 2. Grid-independence results for the TSD-AR0.50-P345 configuration at Re = 20,000.
Mesh DesignationNumber of Elements (Millions)Nu% Nu (vs. G4)(f)% f (vs. G4)
G11.282.801.31%0.05261.74%
G21.583.500.48%0.05200.58%
G3 (Selected)1.883.820.10%0.05180.19%
G42.183.90-0.0517-
Table 3. Comparison of the current study’s findings with those of previous work.
InvestigatorStudyNu/Nu0Re
Promthaisong et al. [21] TR = 6Experimental1.425000
Bhadouriya et al. [22] H = 16.5Experimental and Numerical1.495000
Bhadouriya et al. [23] H = 11.5Experimental and Numerical1.605000
Present study, TSD-AR0.50-P444Numerical1.375000
Present study, TSD-AR0.50-P345Numerical1.495000
Present study, TSD-AR0.50-P543Numerical1.415000
Disclaimer/Publisher’s Note: The statements, opinions and data contained in all publications are solely those of the individual author(s) and contributor(s) and not of MDPI and/or the editor(s). MDPI and/or the editor(s) disclaim responsibility for any injury to people or property resulting from any ideas, methods, instructions or products referred to in the content.