1. Introduction
Hydrogen is increasingly regarded as a key energy carrier for the decarbonization of end-use applications that cannot be readily electrified. In addition to partially replacing fossil fuels in specific sectors, hydrogen plays an important role in long-duration energy storage and serves as a feedstock for the production of hydrogen-based electrofuels [
1,
2]. The progressive expansion of hydrogen deployment imposes growing requirements on infrastructure and supporting technologies. In particular, the scaling of hydrogen value chains requires the parallel development of efficient storage and delivery solutions, with gas compression constituting a critical enabling process [
3,
4].
The efficiency of compression systems has a direct impact on the overall cost of hydrogen storage and distribution [
5]. A broad range of hydrogen compression technologies is currently deployed or under consideration for applications involving high-pressure storage, transportation, and refueling [
6,
7,
8]. Within hydrogen refueling station architectures, compression represents a core subsystem and a major contributor to both capital and operational expenditures. This has driven sustained research and development efforts aimed at improving compressor performance and evaluating alternative compression concepts [
9,
10].
Conventional mechanical hydrogen compression is predominantly based on positive-displacement technologies, particularly reciprocating piston and diaphragm compressors, owing to their capability to achieve high outlet pressures and their established industrial maturity [
11,
12,
13]. At the same time, mechanical compression is inherently associated with wear of moving components, sealing challenges, vibration, and elevated maintenance requirements. These limitations become increasingly significant under high-pressure operation and frequent cycling conditions [
14,
15,
16].
Diaphragm compressors mitigate the risks of gas contamination and leakage by physically isolating the process gas from lubricated components. Nevertheless, they remain subject to operational constraints and component-level limitations that restrict their applicability under demanding hydrogen service conditions [
17,
18,
19]. As a result, alternative hydrogen compression technologies, including electrochemical, metal hydride, and centrifugal compressors, are being actively investigated. While these approaches offer specific functional advantages, they also exhibit distinct technical and operational limitations that currently constrain their broader deployment [
20,
21,
22,
23,
24].
In hydrogen mobility and refueling infrastructures, high-pressure storage necessitates efficient intermediate and booster compression stages, prompting the evaluation of alternative compressor concepts, including liquid piston systems [
25,
26,
27]. Liquid piston compressors have therefore attracted increasing attention for hydrogen refueling station applications. Despite their potential advantages, the mechanisms of energy transfer and dissipation in these systems remain insufficiently characterized. Recent studies indicate that heat transfer efficiency exerts a dominant influence on the overall energy performance of liquid piston compressors, highlighting the importance of thermal management strategies. Related studies on liquid piston-based energy storage systems likewise emphasize that near-isothermal operation and effective heat exchange are key factors influencing compression efficiency [
28,
29,
30,
31,
32]. These findings suggest that structural and design parameters governing heat transfer pathways, particularly within the compression chamber, require systematic investigation.
Within this framework, liquid piston hydrogen compressors represent a viable option for high-pressure applications, as the liquid piston can function as an effective thermal buffer. This behavior enables compression processes approaching near-isothermal conditions while simultaneously reducing mechanical friction and leakage losses associated with conventional sliding seals [
33,
34,
35].
Heat transfer studies of liquid piston compression indicate that the achievement of near-isothermal performance is strongly governed by the intensity of heat exchange during the compression stroke and by thermal pathways through the compression chamber boundaries [
36]. CFD-based design analyses have further shown that the geometry of a liquid-piston compression chamber can significantly affect flow structure, heat transfer, and compression efficiency [
37]. In gas compression systems, a significant efficiency penalty originates from compression-induced temperature rise when heat removal is insufficient during the compression process. This limitation has motivated the development of near-isothermal compression concepts based on enhanced heat transfer mechanisms [
38].
Approaching isothermal conditions during gas compression is known to yield substantial efficiency gains and to reduce overall energy consumption, which is particularly relevant given the significant contribution of compression processes to industrial energy use [
39]. However, isothermal compression is not achieved inherently and requires effective thermal management throughout the compression stroke [
40]. Previous studies demonstrate that near-isothermal behavior can be promoted by enhancing heat transfer through increased heat exchange surface area, optimized compression speed, and improved thermal interaction between the gas and the chamber boundaries. Parametric analyses further indicate that wall temperature and chamber geometry exert a critical influence on the feasibility of near-isothermal compression, underscoring the importance of structural design parameters governing heat transfer within the compression chamber [
41].
Previous numerical investigations by the authors, based on coupled CFD and heat transfer modeling, revealed pronounced temperature non-uniformity during a single compression stroke and demonstrated the sensitivity of thermal behavior to operating parameters such as stroke duration and initial pressure, as well as to compression chamber geometry scaling [
42]. While previous studies and the broader literature have established that wall temperature, compression speed, and chamber geometry influence the feasibility of near-isothermal compression, the role of compression chamber wall thickness has not been systematically analyzed for hydrogen compression in liquid piston systems, despite its direct relevance to heat dissipation, structural integrity, and long-term system reliability.
In this work, a numerical investigation is conducted to quantify the influence of compression chamber wall thickness on wall heating, heat transfer, and temperature evolution during hydrogen compression in a liquid piston system. A coupled CFD and heat transfer model is applied to simulate a single compression stroke over a range of initial pressures, compression stroke durations, and chamber wall thicknesses relevant to high-pressure hydrogen compression applications. Particular attention is given to the transient thermal response of the chamber walls and to the distribution of thermal energy between the gas, working liquid, and solid domains. The contribution of the study lies in the design-oriented parametric analysis of chamber wall thickness and in the resulting interpretation of its effect on wall thermal loading and transient thermal energy redistribution during compression. The paper is organized as follows:
Section 2 describes the numerical model and simulation conditions,
Section 3 analyzes the thermal behavior of the compression chamber walls,
Section 4 examines the influence of wall thickness on thermal energy distribution, and
Section 5 presents the main conclusions.
2. Model Description and Simulation Conditions for the Hydraulic Compression Process
Hydrogen compression is inherently accompanied by heat generation resulting from mechanical work input and the associated temperature rise in the gas, particularly under conditions of high compression ratios and short stroke durations. Elevated gas temperatures adversely affect the overall energy efficiency of the compression process, as additional work is required to reach a target pressure when the process deviates from near-isothermal behavior.
In parallel, increased gas temperature intensifies thermal loads on compressor components, thereby imposing higher demands on cooling capacity and thermal management strategies [
42]. Consequently, thermal effects represent not only an efficiency-related consideration but also a critical engineering constraint influencing system design, operational stability, and total cost of ownership.
From a safety and reliability perspective, excessive temperatures may induce unfavorable thermal gradients, promote material fatigue, and accelerate the degradation of high-pressure components [
43]. Comparable thermal challenges are widely recognized across hydrogen infrastructure applications, including fast filling and high-pressure storage, where temperature evolution must be accurately predicted and controlled to limit thermal stresses and ensure compliance with operational and safety constraints [
44].
Hydrogen compression was simulated numerically using COMSOL Multiphysics® 6.0, employing the CFD and Heat Transfer modules to resolve coupled fluid flow and heat transfer in the hydrogen gas, the working liquid piston, and the chamber walls. The model was implemented in a two-dimensional axisymmetric configuration, consistent with the geometric and physical symmetry of the compression chamber.
The numerical model used in this study is based on a previously published model of hydrogen compression in a liquid piston chamber [
37]. The same COMSOL Multiphysics-based framework, two-dimensional axisymmetric formulation, coupled CFD and heat transfer treatment, and deforming mesh approach were adopted. The transient simulations were performed using a fixed time step of 0.01 s, consistent with the earlier model, where this value was selected as a practical balance between numerical accuracy and computational efficiency. The computational mesh included local refinement in the contact regions between hydrogen, oil, and the chamber wall to improve the resolution of the thermal field in the interfacial zones. Heat transfer between the gas, liquid, and solid domains was resolved through the coupled multiphysics formulation at the corresponding material interfaces, while turbulence and interfacial mixing were neglected. The present study focuses on the influence of chamber wall thickness on hydrogen compression efficiency and builds on the numerical model described in [
37].
The computational domain was defined as a closed cylindrical compression chamber with a height of 145 mm and an inner diameter of 100 mm, corresponding to an initial gas volume of 1.14 L determined by the chamber geometry. The chamber walls were modeled as a structural-steel solid domain with wall thicknesses of 2.5, 5.0, and 10.0 mm. The upper region of the computational domain was occupied by hydrogen gas, while the lower region was filled with oil forming the liquid piston.
The simulation did not consider the removal of gas or working liquid after completion of the compression stroke. Therefore, the upper part of the chamber was not equipped with a valve and was modeled as a closed boundary. This geometric configuration enabled simplified analysis of thermal behavior in the upper chamber housing.
During compression, the upward motion of the liquid piston reduced the gas volume, resulting in a corresponding increase in gas pressure and temperature.
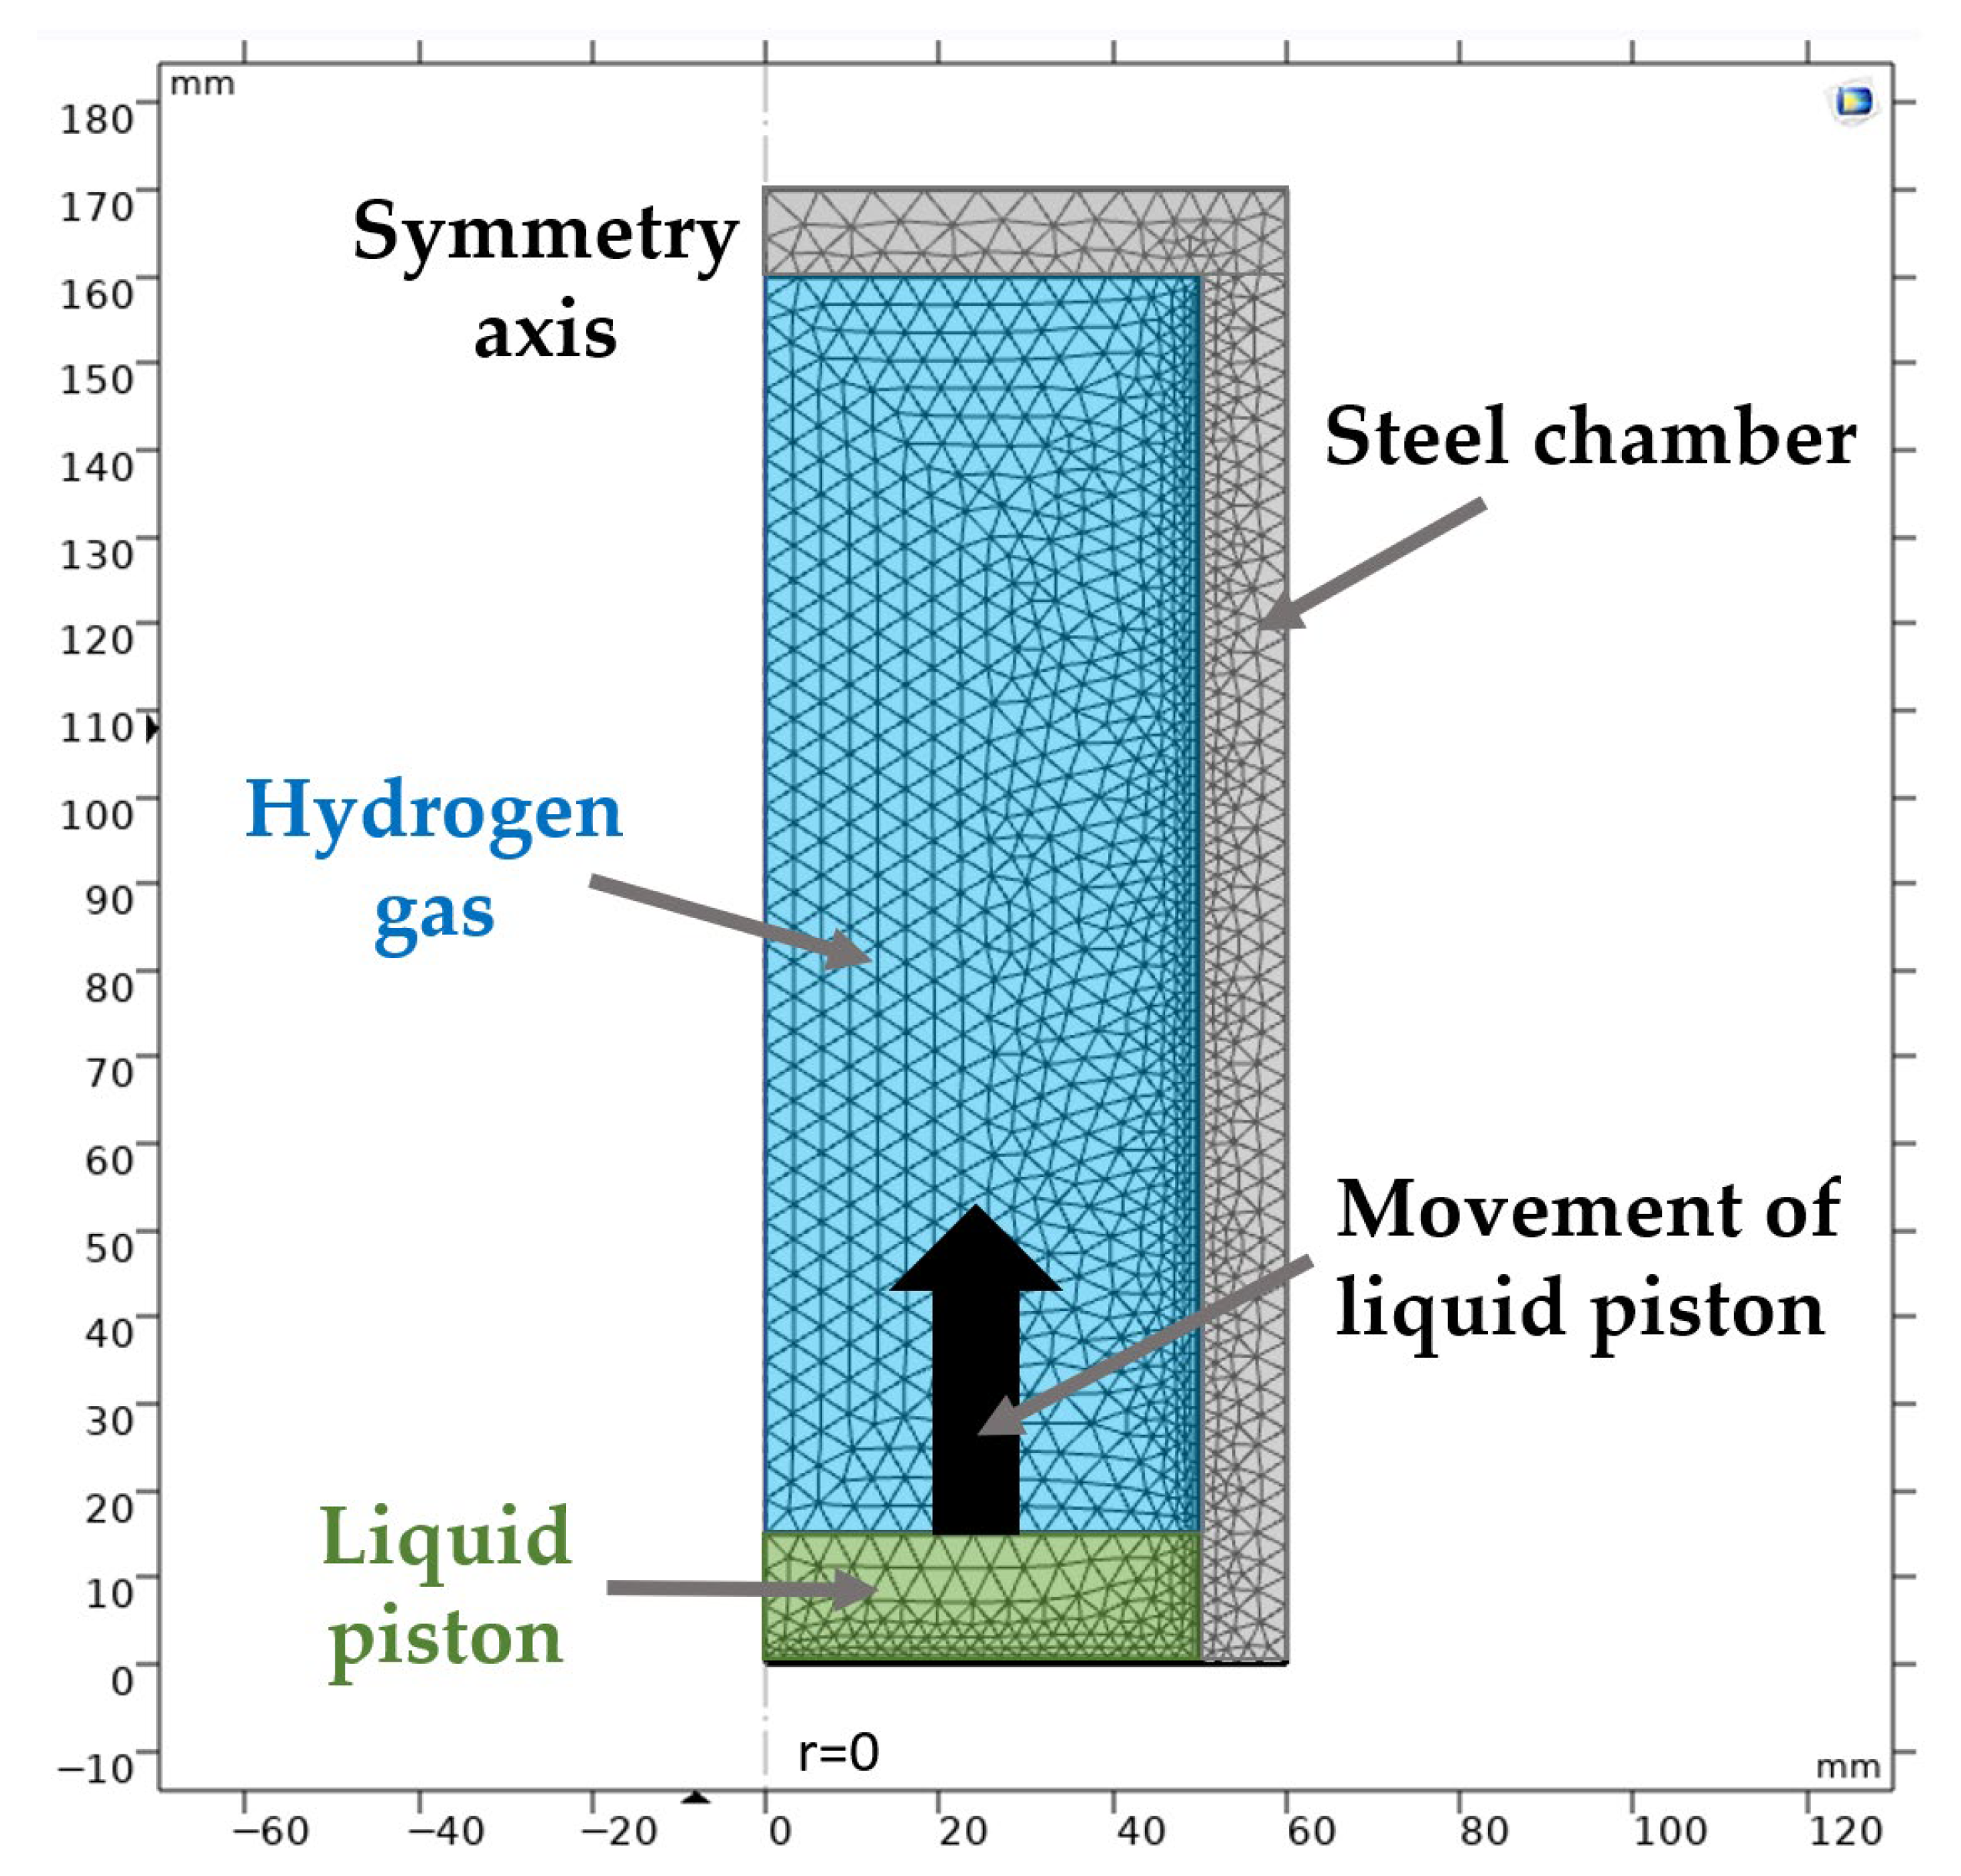
Figure 1 presents a schematic representation of the axisymmetric computational domains used in the model, including the hydrogen region, the liquid piston, and the chamber wall. The computational mesh itself was constructed with local refinement in the interfacial regions, as described for the previously published numerical model in [
37].
Initial gas pressures were set to 3.0, 10.0, 15.0, and 20.0 MPa. A uniform initial temperature of 300 K was imposed for the hydrogen gas, the liquid piston, and the chamber walls. Heat exchange between the outer surface of the chamber and the surrounding air was described using a constant heat transfer coefficient of 30.0 W·m−2·K−1. Gas compression was performed at a constant piston velocity, reducing the gas volume from to with a fixed compression ratio of . The analysis was restricted to a single compression stroke and resolved the transient thermodynamic and thermal response associated with gas volume reduction.
Heat transfer was modeled via thermal conduction within the gas, liquid, and chamber walls, combined with convective heat transfer at the external surface of the chamber. The gas and liquid domains were treated as separated by a moving interface associated with the prescribed liquid piston motion. Turbulence effects and interfacial mixing at the gas–liquid interface were neglected as a simplifying assumption adopted for the present single-stroke parametric analysis. A deforming mesh approach was employed to capture the transient change in gas volume during compression without dynamic remeshing. The reported results should therefore be interpreted within the assumptions of the adopted single-stroke, non-mixing numerical model.
The analysis was restricted to a single compression stroke, with emphasis placed on the transient thermal response of the system. Thermal accumulation effects over successive compression cycles were not considered.
During a compression cycle, a portion of the thermal energy generated by gas compression is transferred to the liquid piston and the chamber walls. In a first-order approximation, the compression process is often treated as adiabatic, with heat losses subtracted at the end of the cycle. In the present model, however, heat exchange between the gas and the chamber walls is explicitly accounted for, resulting in partial transfer of thermal energy from the gas to the solid domain during compression. The magnitude of heat loss is governed by the thermal boundary conditions at the external wall surfaces as well as by the compression speed.
For the hydrogen compression application considered in this study, structural steel was selected as the material of the compression chamber to represent a construction commonly used in high-pressure compression systems. The thermophysical parameters used in the present simulations are summarized in
Table 1 and described in detail in
Appendix A.
Using the numerical model described above, the processes occurring during a single compression stroke were simulated for stroke durations ranging from 0.5 to 20.0 s. In each simulation case, the liquid piston moved at a constant velocity; therefore, different stroke durations correspond to different constant compression speeds.
Figure 2,
Figure 3 and
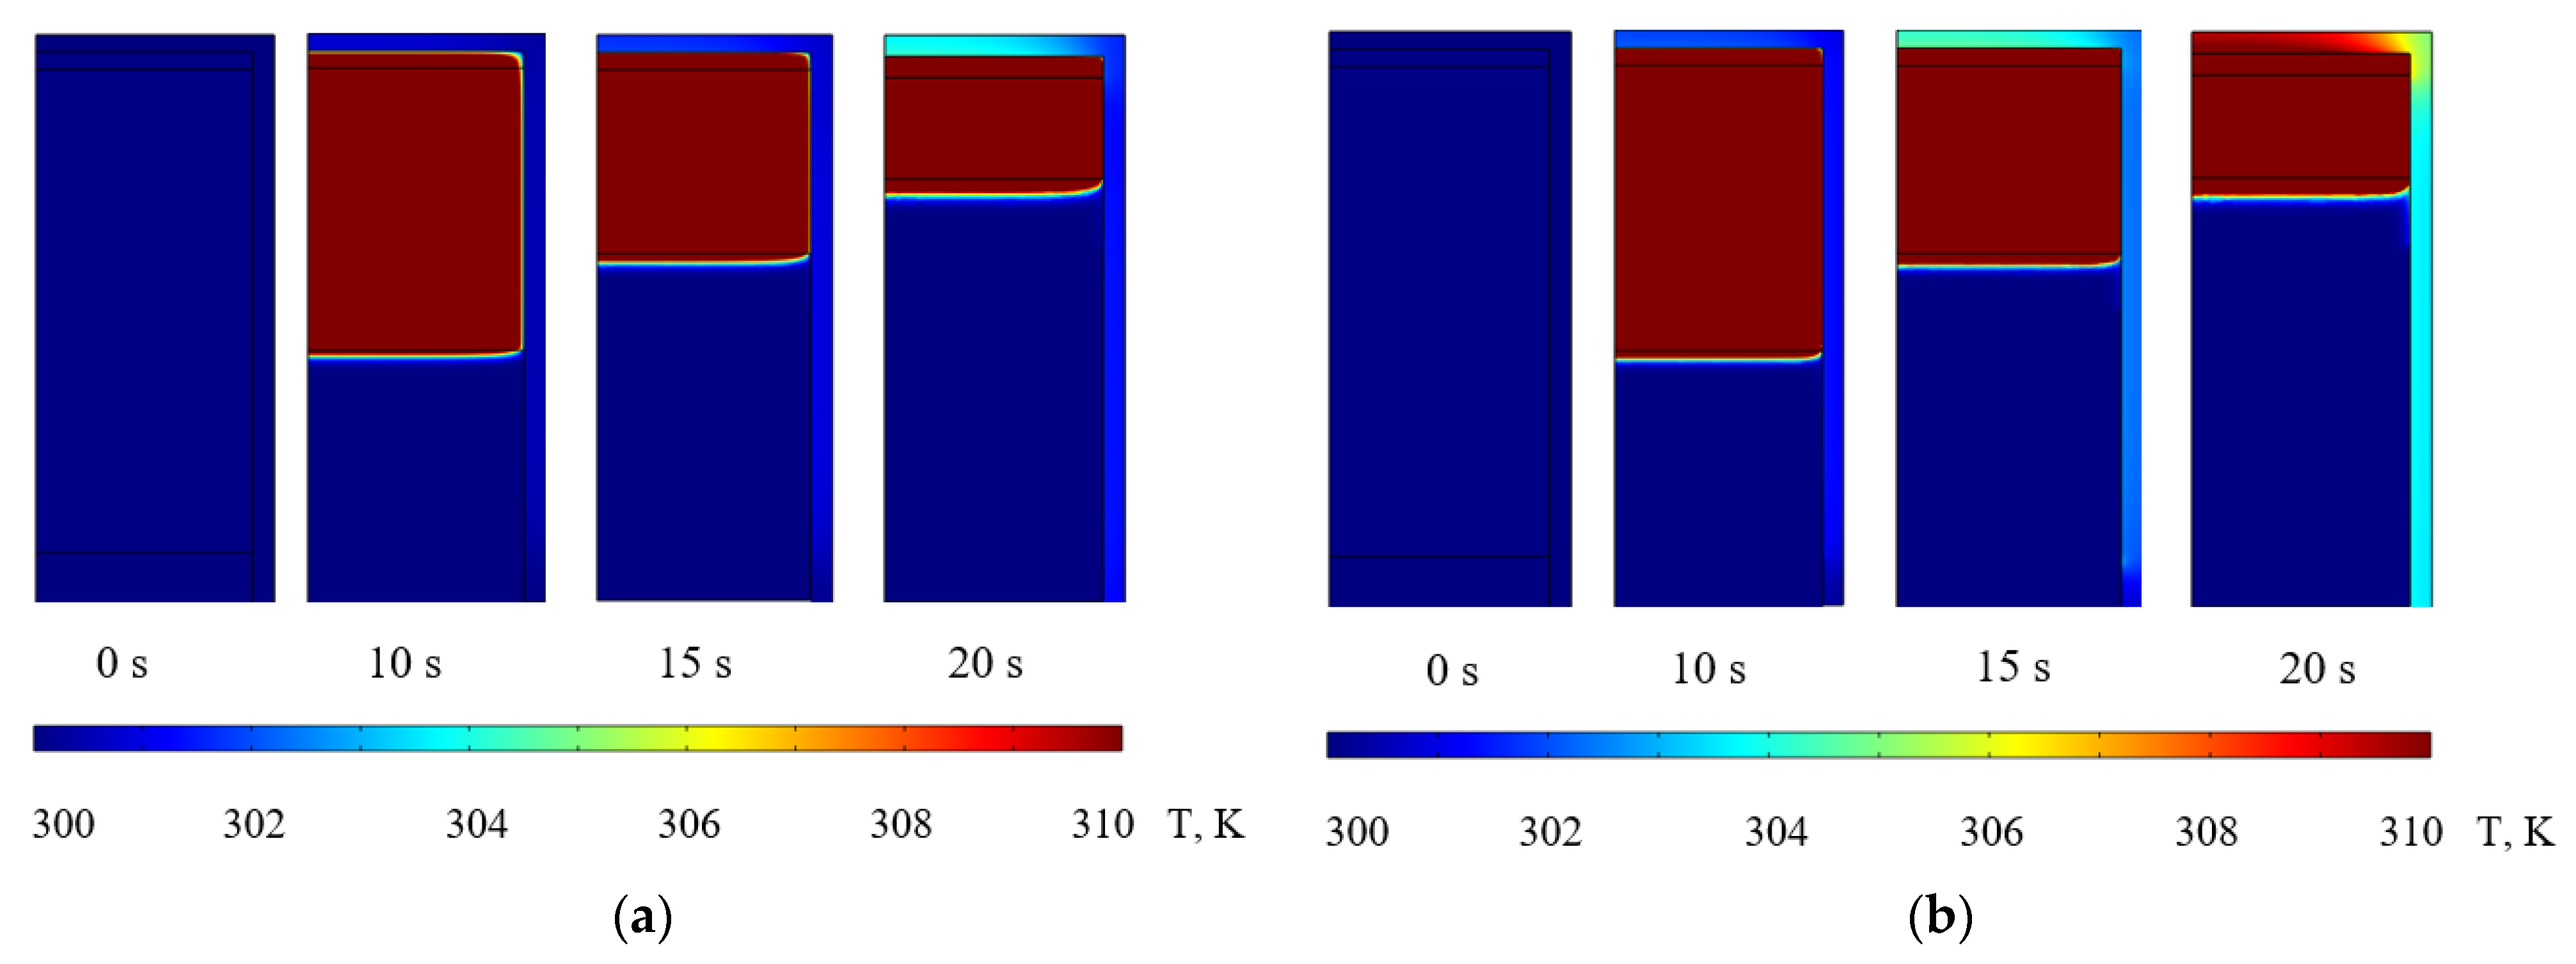
Figure 4 present the temporal evolution of the temperature distribution in the compression chamber wall during a single compression stroke. Representative temperature fields are shown at selected time instants (0, 10, 15, and 20 s) for two initial gas pressures, (a) 3.0 MPa and (b) 20.0 MPa, and for chamber wall thicknesses of 2.5, 5.0, and 10.0 mm.
Figure 2 is presented using a temperature scale from 300 K to 320 K, whereas
Figure 3 and
Figure 4 are shown using a temperature scale from 300 K to 310 K to facilitate comparison of wall heating dynamics during compression.
Figure 2,
Figure 3 and
Figure 4 show that the chamber wall is heated non-uniformly during a single compression stroke. The highest temperature is observed in the upper part of the wall, near the hydrogen region, while the wall area closer to the liquid piston remains cooler. This is because the upper wall is directly exposed to the compressed gas, which undergoes the strongest temperature rise during compression.
Comparison of
Figure 2,
Figure 3 and
Figure 4 also shows that increasing wall thickness reduces the temperature rise in the chamber wall during compression. This effect is most clearly seen in the upper part of the wall, where the maximum temperature becomes lower as the wall thickness increases. In addition, thicker walls exhibit a smoother temperature distribution because of their higher thermal inertia.
Under the investigated conditions, the temperature rise in the compression chamber walls remains moderate during a single compression stroke, with the maximum temperatures occurring near the end of compression. This behavior can be attributed to the combined effects of transient heat transfer from the compressed gas and the thermal inertia of the chamber material, which promotes gradual heat absorption and redistribution within the solid domain. As a result, the chamber walls act primarily as a thermal buffer rather than as a dominant sink for compression-generated heat, while part of the thermal energy is also transferred to the working liquid.
In addition, the interaction between the gas and the liquid piston contributes to hydrogen cooling during compression. As the liquid progressively fills the chamber, the gas temperature becomes increasingly influenced by the temperature of the working liquid, promoting conditions closer to near-isothermal compression. This effect is particularly important at higher pressures, where efficient heat removal is essential for limiting temperature rise and maintaining thermodynamic efficiency.
The spatial temperature fields also show that the upper region of the compression chamber wall is subjected to the highest thermal loading during the compression stroke. This observation highlights the importance of chamber geometry and cooling surface distribution for thermal performance. From a design perspective, increasing the effective heat-transfer area in the upper part of the chamber may improve heat removal, for example, by increasing exposure to external air or by introducing additional liquid cooling. Such measures may contribute to improved thermal stability and operational robustness of the compression system.
3. Modeling of Thermal Behavior of Compression Chamber Walls
Based on the numerical model described above, the thermal response of the compression chamber during a single compression cycle was evaluated for three wall thicknesses: 2.5, 5.0, and 10.0 mm. Increasing wall thickness leads to a proportional increase in the volume and mass of the chamber material, resulting in a substantial increase in the thermal capacity of the chamber wall (
Table 2). This increase in thermal capacity directly contributes to the reduced wall temperature rise observed for thicker walls.
From
Figure 5 and
Figure 6, Δ
T increases monotonically with compression time, exhibiting a pronounced rise at short times followed by a gradual transition toward a slower rate of increase. This trend is consistent with transient heat transfer from the compressed gas to the solid wall, where the thermal response becomes progressively constrained by the thermal inertia of the chamber and by heat conduction through the wall thickness.
A strong dependence on wall thickness is observed across the entire pressure range. Thinner walls exhibit a larger temperature rise under identical operating conditions. At 3.0 MPa and a 20 s stroke duration, ΔT reaches approximately 3.1 K for a 2.5 mm wall, compared to ~1.5 K and ~0.7 K for 5.0 mm and 10.0 mm walls, respectively. This separation increases at higher pressures: at 20.0 MPa and 20 s, ΔT rises to ~9.6 K (2.5 mm), ~4.8 K (5.0 mm), and ~2.2 K (10.0 mm). The observed reduction in ΔT with increasing wall thickness is attributed to the increased wall mass and heat capacity, which lowers the temperature rise for a given amount of absorbed heat.
Initial pressure also significantly affects the magnitude of wall heating. For a fixed wall thickness and compression time, higher initial pressure leads to larger ΔT. This behavior is consistent with increased compression work and higher gas temperatures, which enhance the driving temperature difference for heat transfer to the chamber walls. The results therefore indicate that wall thermal loading is governed by a coupled effect of operating conditions (stroke duration and pressure level) and structural parameters (wall thickness), with wall thickness acting primarily through the thermal inertia of the solid domain.
From a design perspective, these trends indicate that increasing wall thickness reduces the per-stroke wall temperature rise and mitigates thermal gradients within the chamber structure. However, the total heat absorbed by the wall during a compression stroke does not necessarily decrease proportionally, as a thicker wall can accommodate a larger amount of thermal energy with a smaller temperature increase. Consequently, evaluation of wall thickness should account for both wall temperature evolution and associated heat transfer, particularly under continuous operation where cycle-to-cycle thermal accumulation may become significant.
This study numerically investigated the influence of compression chamber wall thickness on transient heat transfer and wall temperature evolution during hydrogen compression in a liquid piston system. A coupled fluid flow and heat transfer model was applied to simulate a single compression stroke over a range of initial pressures, compression times, and wall thicknesses relevant to high-pressure hydrogen compression applications.
The results demonstrate that wall temperature rise increases monotonically with both compression stroke duration and initial compression pressure. Increasing wall thickness significantly reduces the per-stroke wall temperature rise due to the higher thermal inertia of the chamber walls. Thinner walls exhibit larger temperature increases under identical operating conditions, whereas thicker walls limit temperature rise despite their larger mass and thermal capacity.
4. Influence of Wall Thickness on Thermal Energy Distribution in the Compression Chamber
The amount of heat transferred from the compressed gas to the compression chamber walls during a single compression cycle can be estimated using a simplified energy balance. In the present analysis, the thermal energy accumulated in the chamber walls is evaluated based on the wall temperature increase obtained from the numerical model. The corresponding heat uptake is expressed as:
where
is the mass of the compression chamber wall [
],
is the specific heat capacity of the wall material [
], and Δ
T is the domain-averaged increase in wall temperature during compression [
]. This formulation enables direct comparison of thermal loading across different wall thicknesses and operating pressures.
Figure 7 and
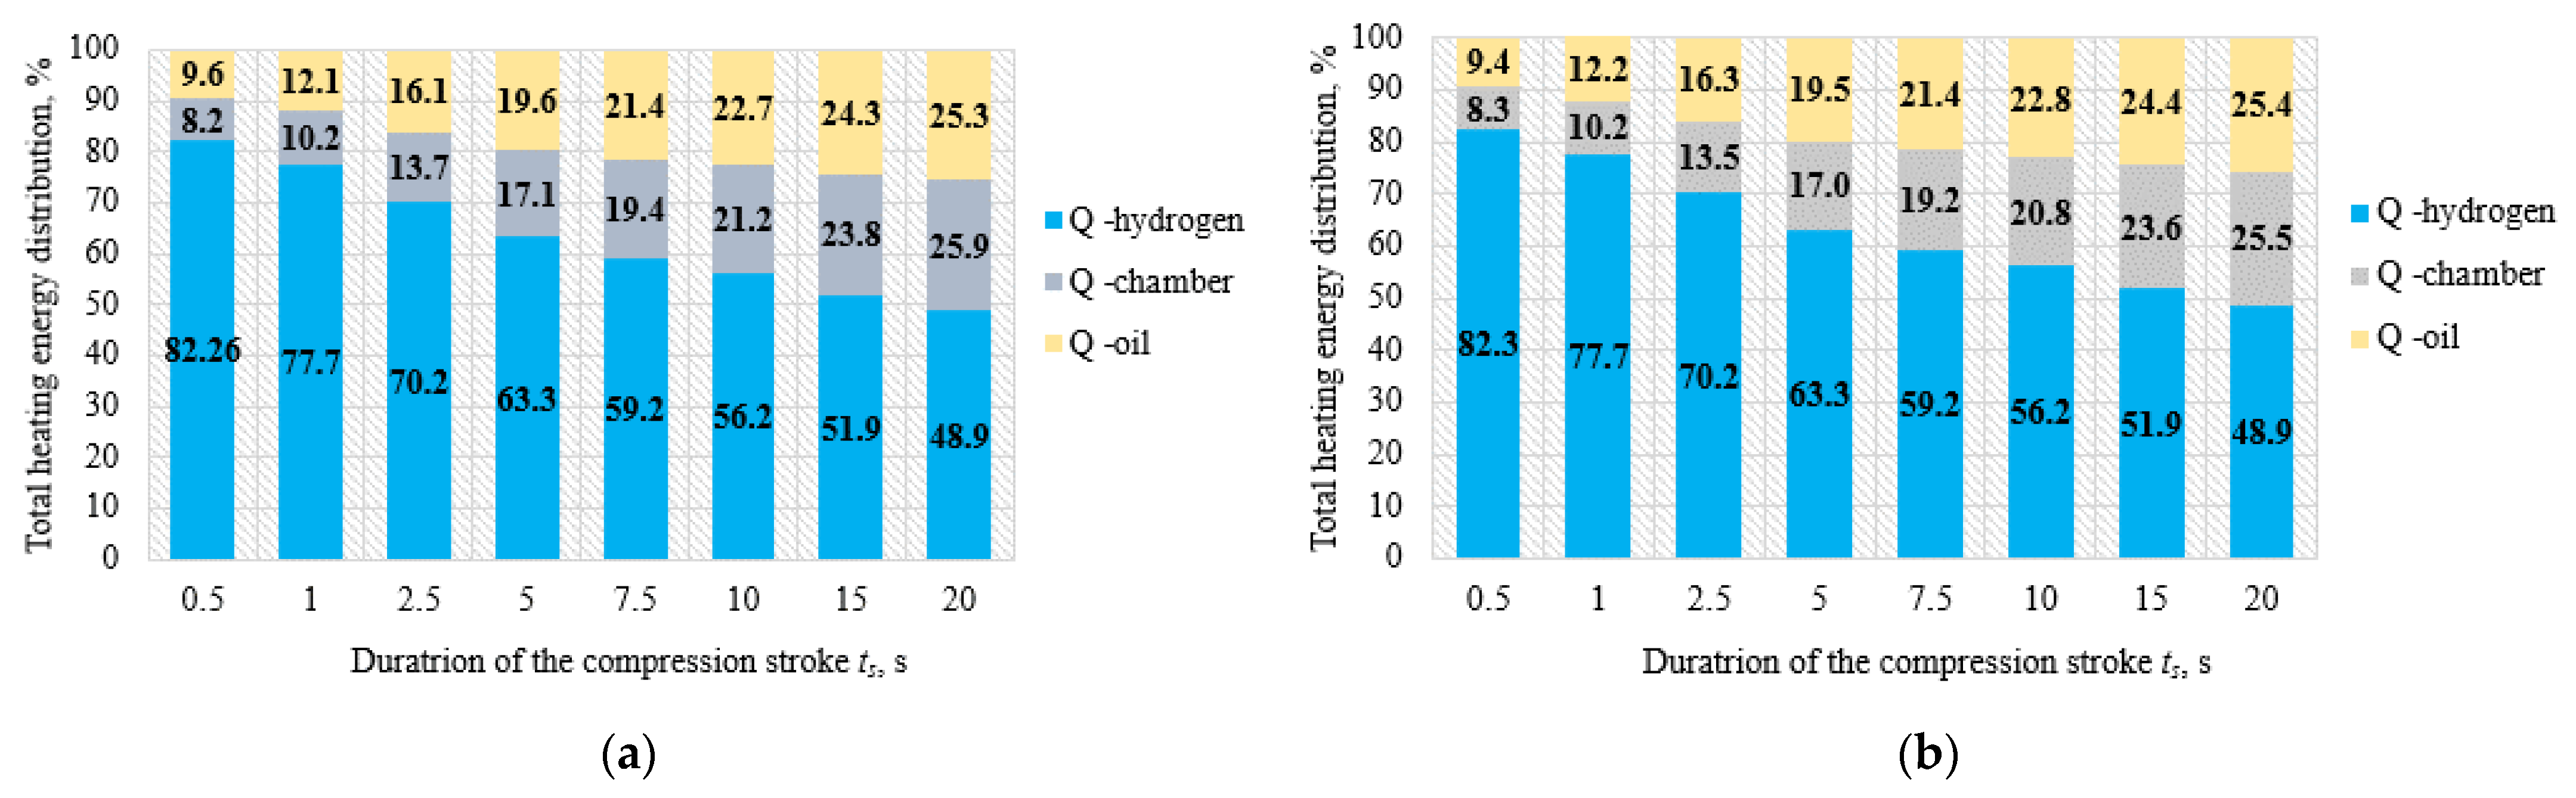
Figure 8 illustrate the distribution of thermal energy accumulated in the compressed hydrogen, the working liquid, and the compression chamber wall during a single compression stroke for different stroke durations and wall thicknesses. In all investigated cases, the dominant fraction of thermal energy remains stored in the compressed hydrogen, particularly at higher initial pressures. This indicates that, on the time scale of a single compression stroke, the process retains a predominantly gas-dominated thermal character despite ongoing heat transfer to the surrounding wall and liquid domains.
With increasing compression stroke duration, the fraction of thermal energy accumulated in the compression chamber wall increases, while the fraction retained in the gas decreases. However, increasing wall thickness does not result in a proportional increase in wall energy fraction during a single compression stroke. Although thicker walls have a higher thermal capacity, the amount of energy transferred to the solid domain remains limited by the available heat-transfer time. Consequently, thicker walls show a lower temperature rise without a corresponding increase in the fraction of thermal energy accumulated in the wall.
To clarify the trends shown in
Figure 7 and
Figure 8, the numerical values of the wall energy fraction were added in
Appendix B. These data confirm that the proportion of thermal energy accumulated in the chamber wall increases with stroke duration for all investigated cases, whereas this fraction decreases with increasing initial gas pressure. This behavior indicates that, although the chamber wall absorbs more heat during longer compression strokes, a larger share of the total thermal energy remains stored in the compressed hydrogen at higher initial pressures.
Comparison of the low- and high-pressure cases further shows that a larger fraction of thermal energy remains in the gas throughout the compression stroke under higher initial pressure conditions. This behavior highlights the increasing difficulty of heat removal at elevated pressures and underscores the importance of both structural design parameters and compression time in controlling thermal energy redistribution during hydrogen compression.
At short stroke durations, the compression process is too rapid for substantial heat transfer from hydrogen to the chamber wall, and most of the thermal energy therefore remains stored in the gas. As the stroke duration increases, the time available for gas–wall and gas–liquid heat exchange also increases, which enhances heat transfer to both the chamber wall and the working liquid. Increasing wall thickness increases the thermal mass of the solid domain and reduces the wall temperature rise, but it does not automatically lead to a proportional increase in wall energy uptake during a single stroke because heat transfer remains limited by the available compression time.
In the present analysis, the thermal energy accumulated in the chamber wall was evaluated using a lumped integral estimate based on the domain-averaged wall temperature rise. Therefore,
Figure 7 and
Figure 8 represent the overall thermal energy accumulated in the entire chamber wall rather than its local spatial distribution within different wall regions.
Overall, the analysis of thermal energy distribution shows that, for all investigated cases, the dominant fraction of thermal energy remains stored in the compressed hydrogen during a single compression stroke. With increasing compression time, the fraction of energy transferred to the chamber wall and the working liquid increases; however, the amount of energy absorbed by the solid domain during a single stroke remains limited by the available heat-transfer time. As a result, increasing wall thickness does not lead to a proportional increase in the fraction of energy accumulated in the chamber wall but primarily reduces the wall temperature rise.
5. Conclusions
The numerical model developed within the adopted assumptions enables investigation of thermal energy distribution during hydraulic hydrogen compression in the gas phase, the working liquid, and the compression chamber walls.
This study presents numerical results on thermal energy distribution during hydraulic compression of hydrogen in a closed chamber at a compression ratio of and initial pressures of 3.0, 10.0, 15.0, and 20.0 MPa for chamber wall thicknesses of 2.5, 5.0, and 10.0 mm.
The simulation results demonstrate that increasing chamber wall thickness reduces the temperature rise in the chamber walls during a single compression stroke because of the higher thermal inertia of the solid material. Under the investigated conditions, chamber wall thickness therefore influences the transient thermal response of the compression chamber and the thermal loading of the solid wall. The effect of wall thickness was most pronounced for the slowest compression case and became less noticeable with increasing initial pressure. At the same time, lower wall thickness may enhance cooling of the compressed hydrogen, thereby promoting conditions closer to quasi-isothermal compression under the considered single-stroke conditions.
The present analysis was restricted to a single compression stroke under idealized external cooling conditions. Future work should address multi-cycle operation, cumulative thermal effects, and the influence of working fluid properties and cooling strategies. The findings provide design-relevant insight into the role of structural parameters in controlling thermal behavior and support the thermal and structural optimization of liquid piston hydrogen compressors for high-pressure applications.




 ,
,