1. Introduction
In the modern world, underground infrastructure is developing ever more rapidly and encompasses new, previously unexplored areas of knowledge [
1,
2,
3]. The problems of underground structure construction are becoming increasingly relevant. The key objective of constructing buried structures in conditions of high urban development density is to minimize surface deformation. Achievement of this goal is made possible by reducing the impact of the construction process on the surrounding environment through a comprehensive consideration of various factors: stiffness and strength characteristics of soils, features of soil mass structure, technological aspects of construction work execution, and other parameters [
4,
5,
6]. Existing scientific works on the impact of subway tunnel construction by tunnel boring machines with active face pressure are characterized by significant limitations. Such works are often oriented toward solving specific problems in certain geological conditions without ensuring the universality of methodology application in alternative conditions, or they consider soil mass a homogeneous isotropic medium, which prevents achieving the necessary accuracy in predicting the operating parameters of boring equipment.
Investigation of the stability of stratified soil masses during tunnel construction using shield tunneling machines with active face support pressure will enable the development of a method that most accurately describes the possible change in the impact of construction work for calculating the required compensating pressure value on the face in order to reduce the influence of construction on the surrounding mass. The aim of this research is to develop a method for calculating the stability coefficient of the rock mass, capable of adjusting the face support pressure required for face stability depending on changes in the mass structure at the tunnel face. The development of a new method will make it possible to reduce the impact of tunnel construction on the surrounding stratified soil mass through accurate prediction of the technological parameters of the shield tunneling machine, as well as to reduce the probability of emergency situations, which in turn will decrease the cost of constructing metro tunnel sections and increase the productivity of the tunnel construction process.
Currently, the equation proposed by R.B. Peck (1969) is used to predict surface settlement
s [
7]:
where
smax is the maximum surface settlement;
i is a parameter dependent on the tunnel depth (
z);
y is the distance from the tunnel axis to the point where settlement is calculated.
The Peck method is mainly applied for settlement prediction during construction in soft soils at shallow depths, where ground volume losses can be significant.
However, the indicated relationships do not allow an accurate description of the change in the profile of the settlement trough of a stratified mass. More modern equations account for the mutual influence of two tunnels, one of which was proposed by S. Wang et al. (2023) [
8]:
where
S′
max is the modified maximum of the surface settlement curve,
x is the horizontal distance between the calculation point and the origin,
l′ is the horizontal distance between the maximum position and the origin,
i′ is the modified settlement trough width,
f(m,n) is the modified expression of the maximum value, and
w(m,n) is the modified expression of the maximum position.
The shape of the failure zone in the soil mass has been investigated by numerous authors in a three-dimensional formulation [
9,
10,
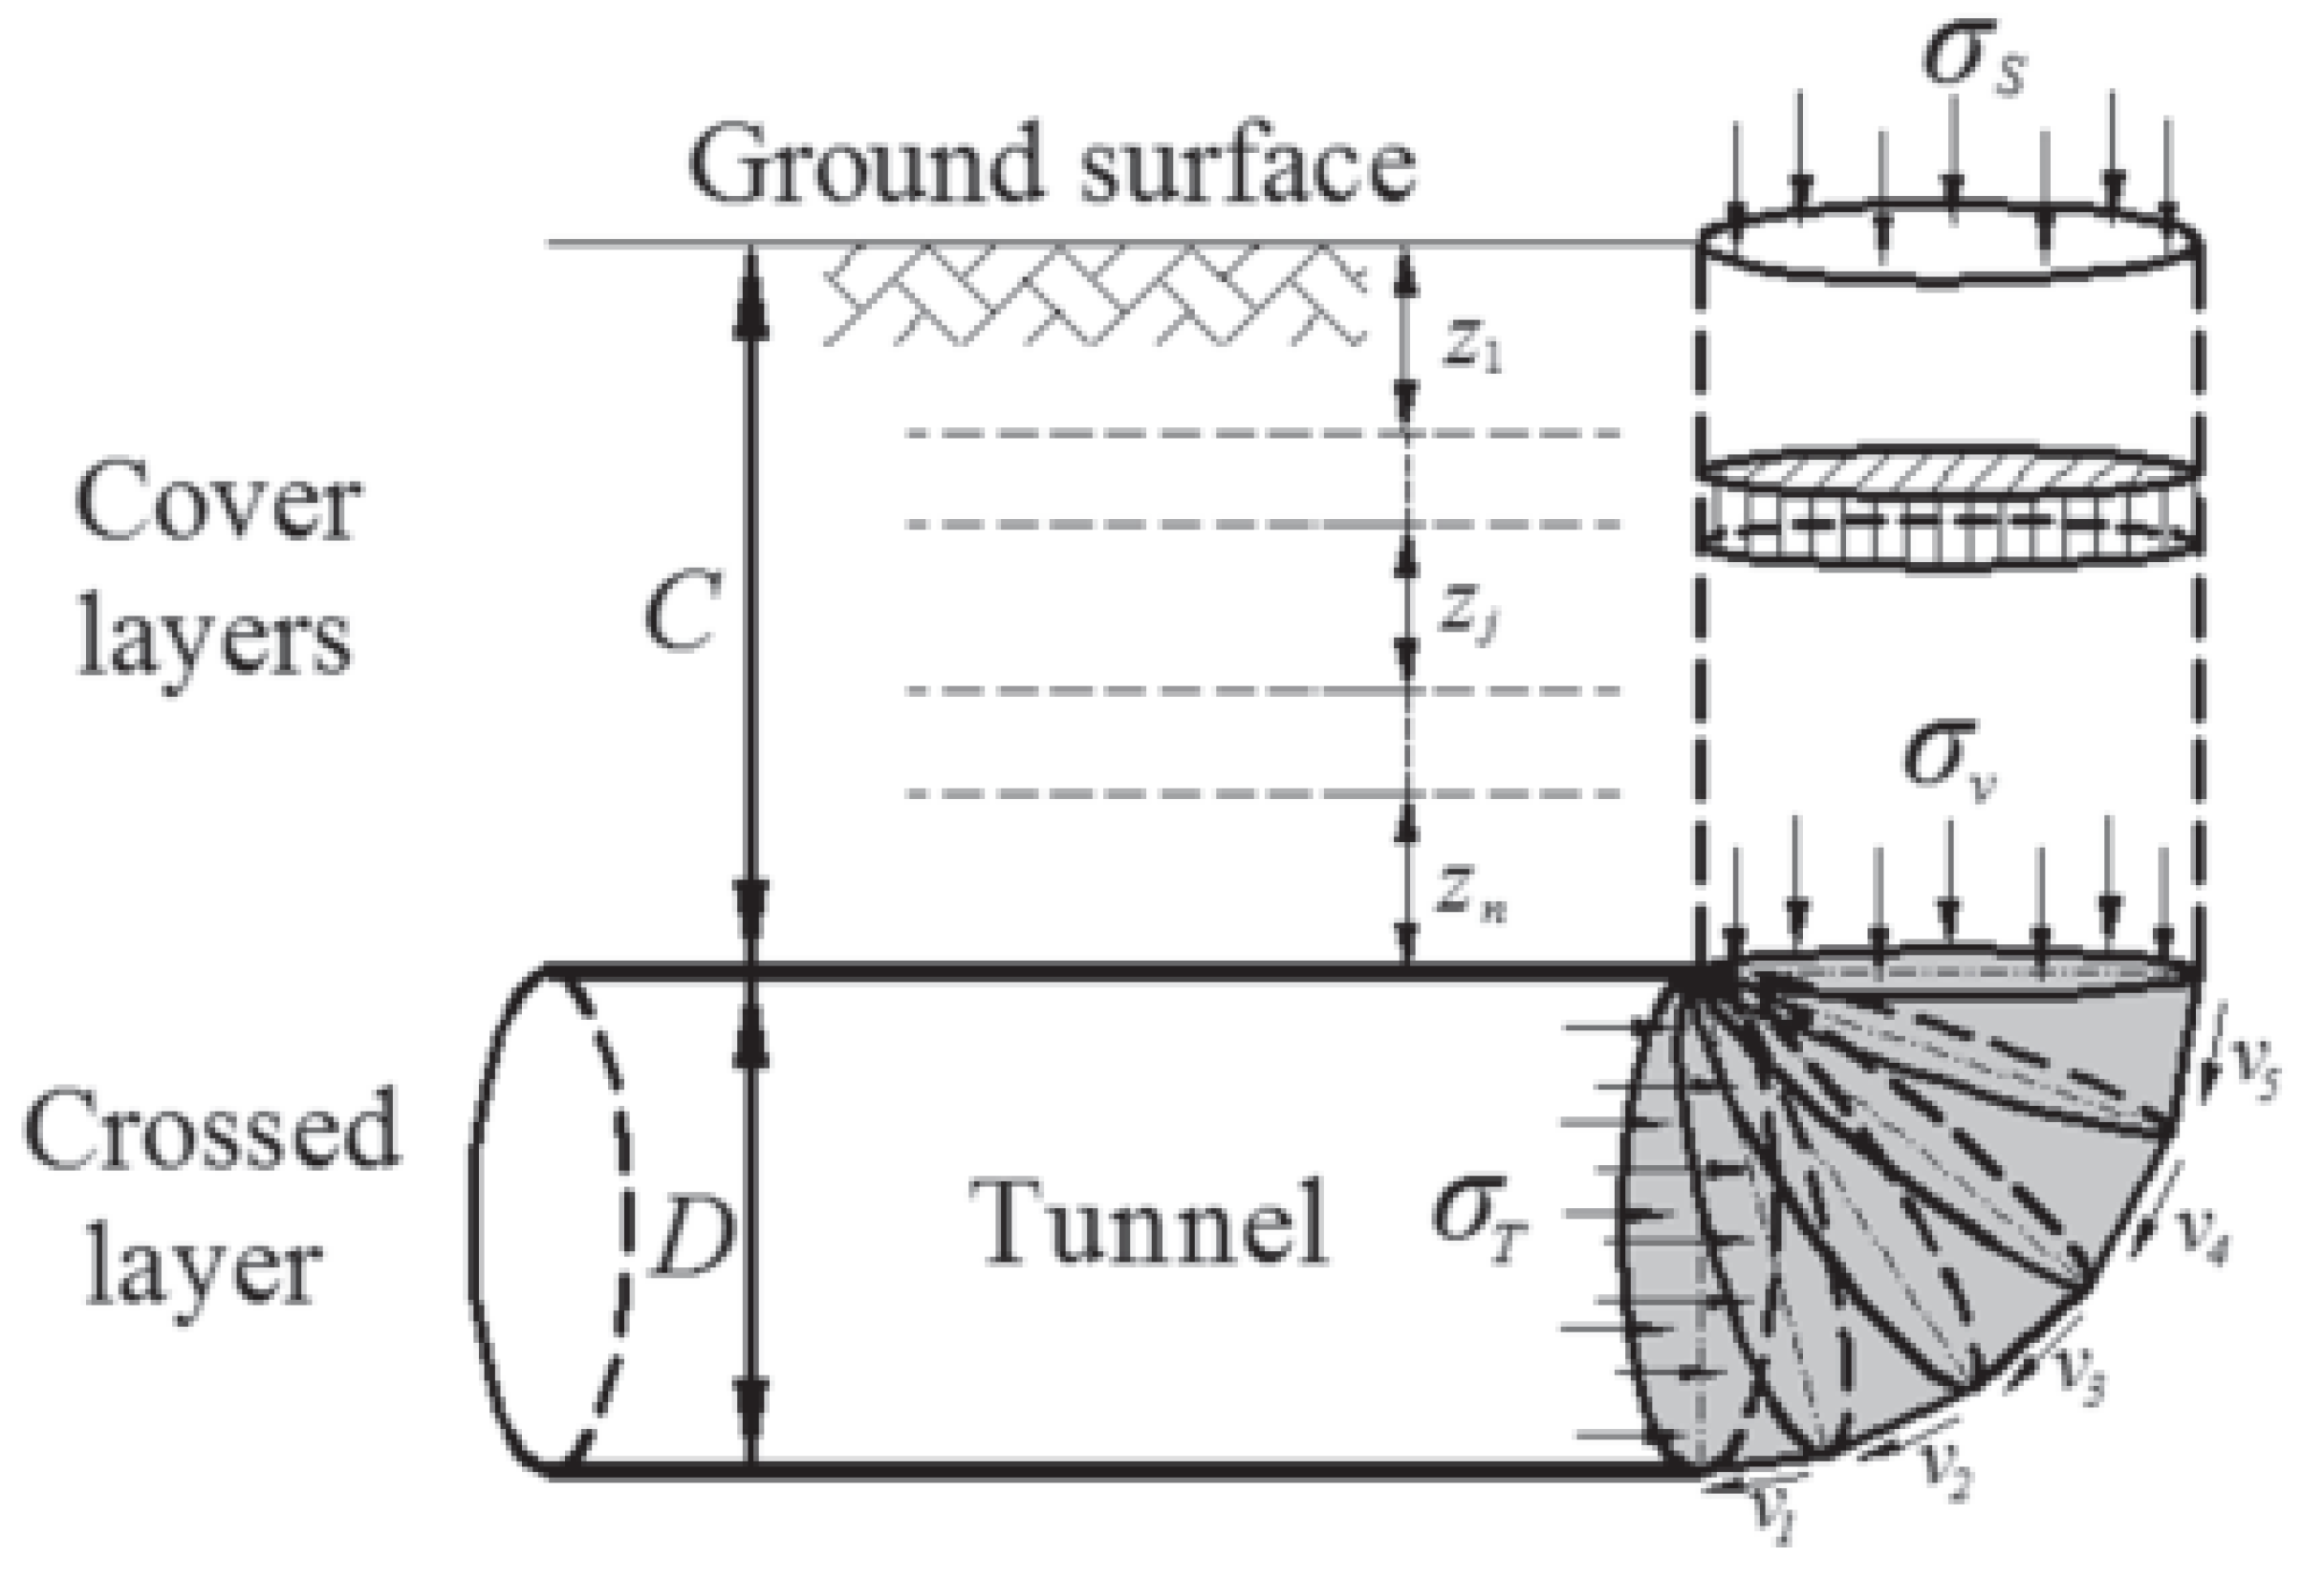
11]. Understanding these studies is essential for substantiating the selection of the numerical model dimensions and boundary conditions, as well as for interpreting the zone of construction influence. However, for engineering practice, the key parameters remain those of the transverse surface settlement trough profile, which are used in the present study as the primary monitored criteria. By investigating this criterion, it is possible to assess the impact of construction on underground utilities and underground structures above the tunnel. When analyzing face stability in stratified soils, researcher Li. P. established that the ratio of the depth of burial to the tunnel diameter has a direct relationship with the size of this zone in the soil mass. The ground displacement zone configuration developed by Li. P. is characterized by a surface having the shape of a tube rising to the surface with a diameter corresponding to the tunnel diameter (
Figure 1) [
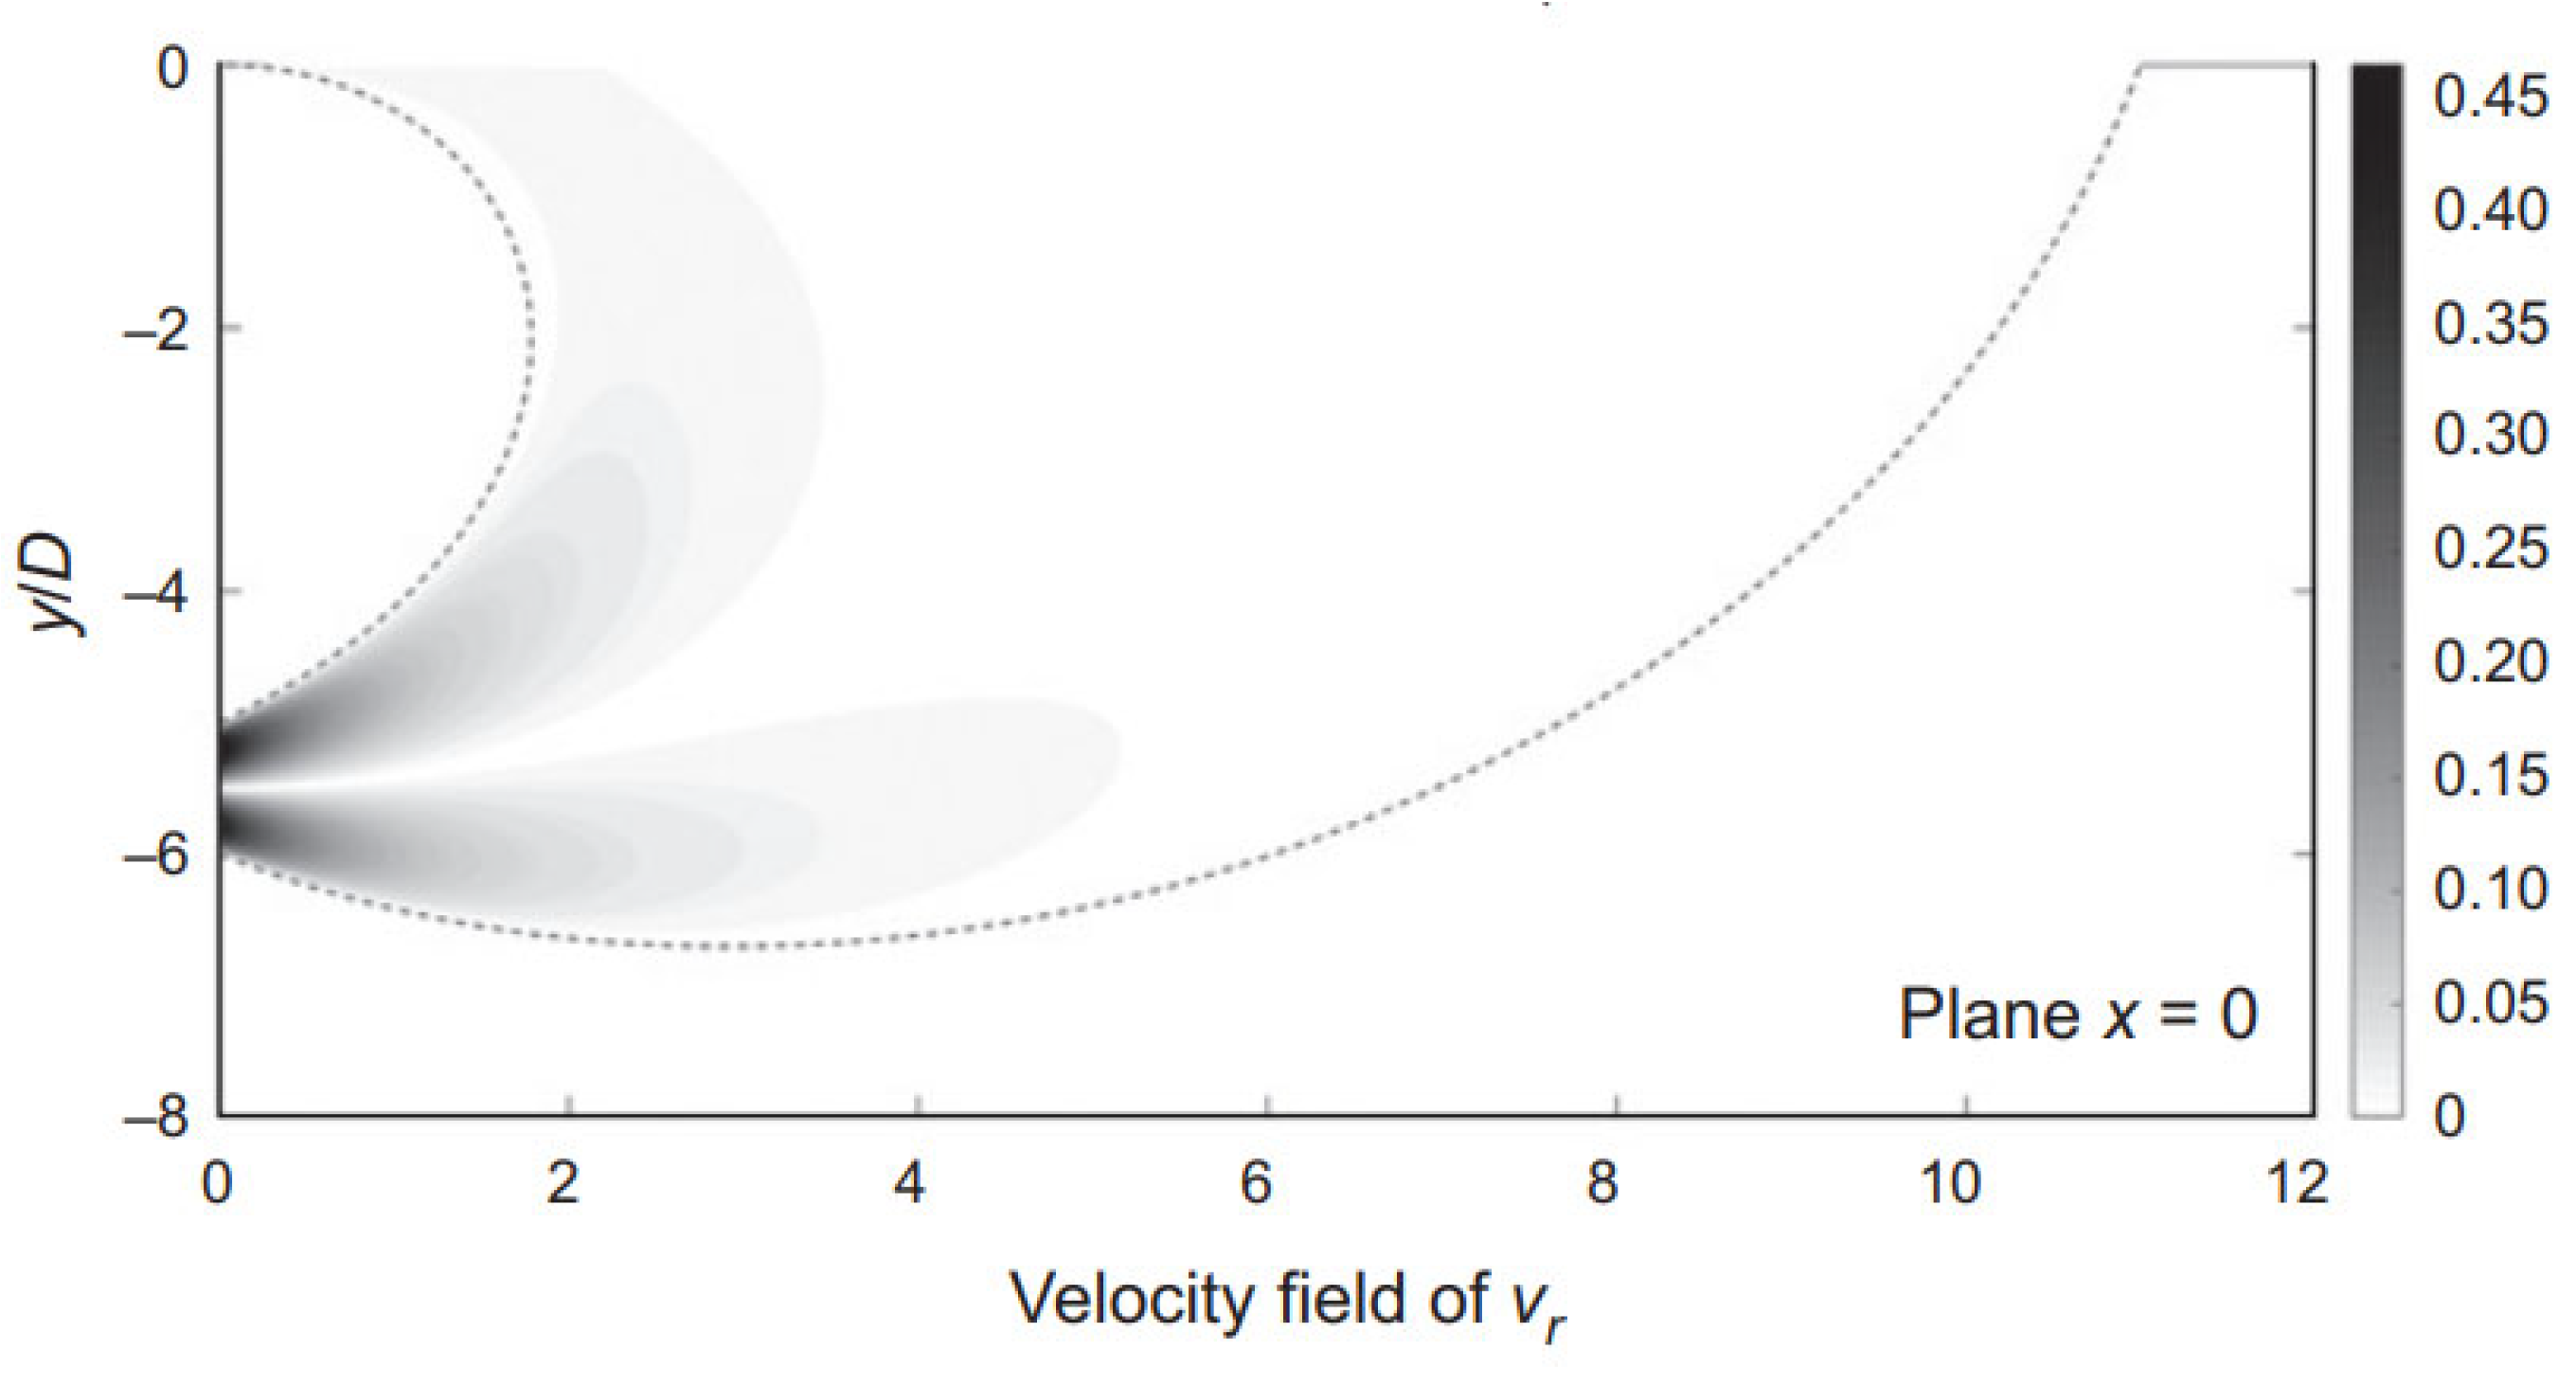
12]. Zhang F. developed the surface of the zone in the form of an inverted cone (
Figure 2) [
13,
14].
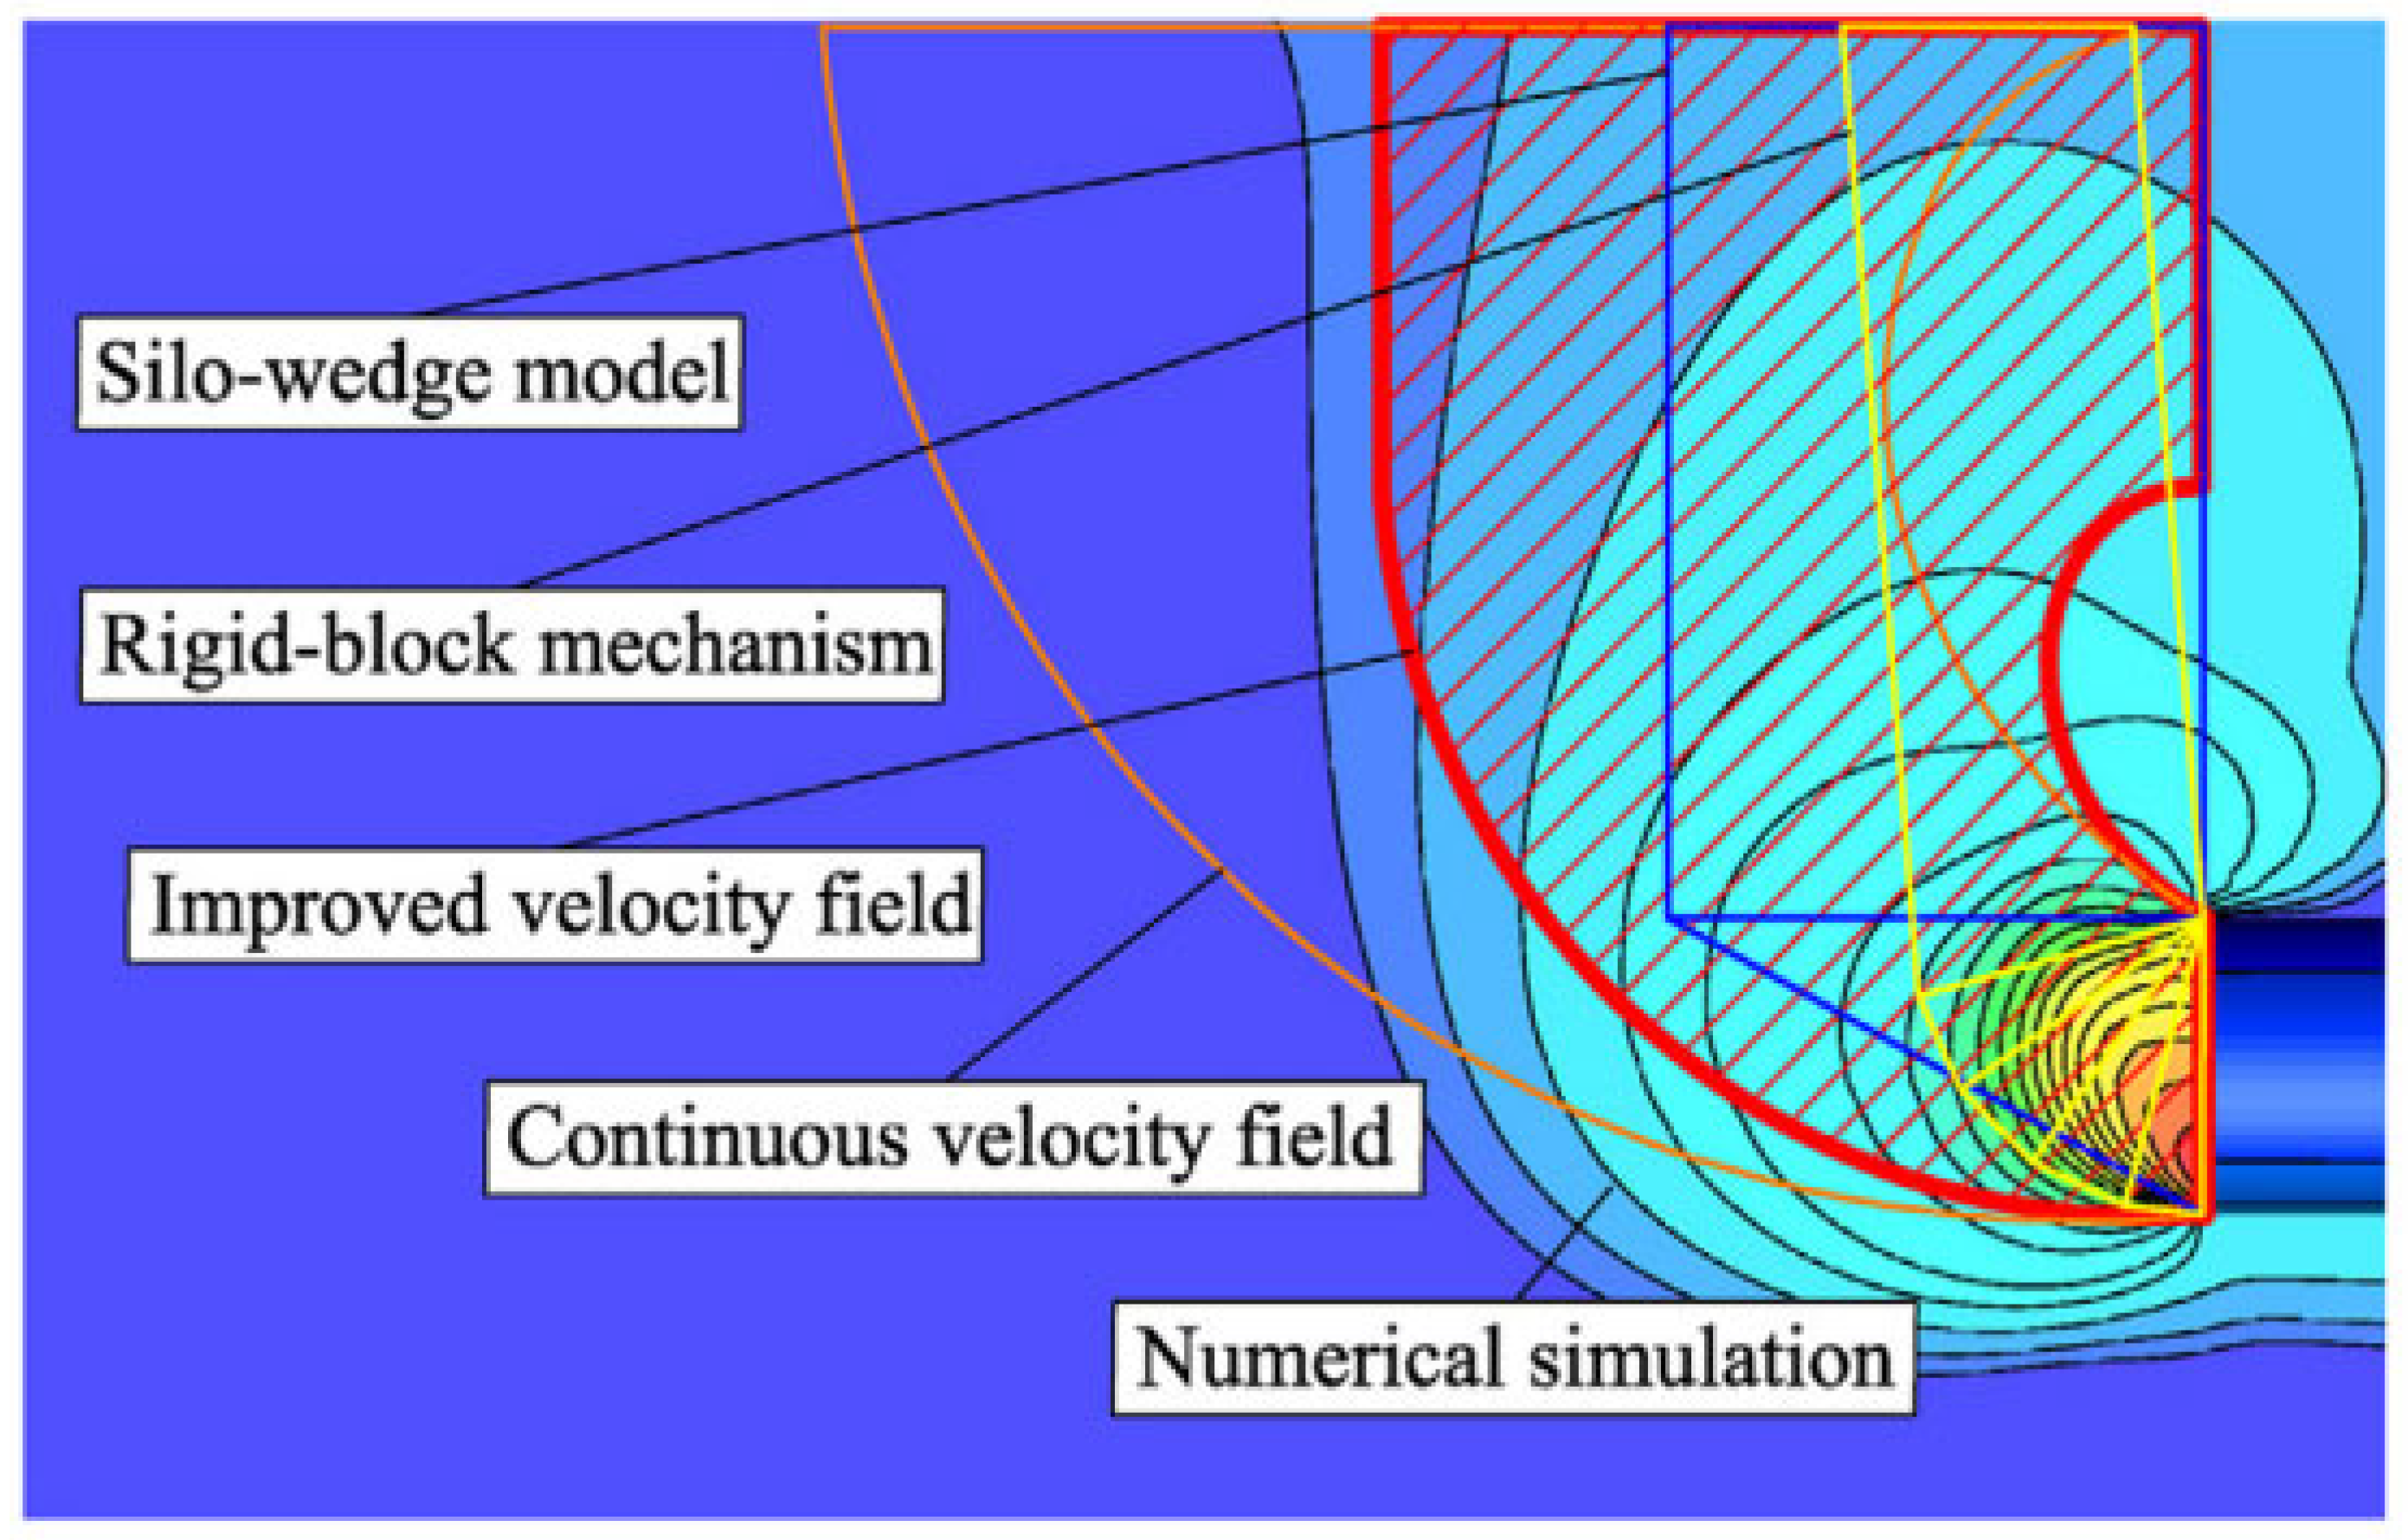
Zhang C.’s research focuses on assessing the stability of tunnel faces in clayey soils whose shear strength increases linearly with depth. According to his findings, the failure-zone surface in the soil mass can be described as an inverted cone with an expanding base at the tunnel invert, transitioning into a cylindrical surface rising to the ground surface (
Figure 3). Zhang C. also derived analytical expressions defining this geometry. The applicability of his method is limited to shallowly buried, horseshoe-shaped tunnels [
15].
The studies reviewed to date have focused on investigating the short-term changes in the deformed state of the soil mass. Unlike the studies presented above, the current research focuses on investigating the influence of the layered mass structure at the tunnel face on the final (steady-state) ground deformation values, determined upon completion of the construction process simulation under drained conditions. It should be noted that the analysis was performed without modeling consolidation processes, and the obtained results characterize the deformed state of the soil mass under the assumption of fully drained soil conditions. The shortcomings of existing methods for predicting the deformed state of a layered soil mass within the influence zone of tunnel-boring machines with active face loading underscore and define the necessity of exploring this chosen direction. The studies reviewed above are devoted to determining the three-dimensional shape of the failure zone in the soil mass and the limit face support pressure. In the present work, the subject of investigation is not the shape of the failure zone in three-dimensional space, but rather the influence of the layered mass structure on the surface settlement trough parameters, which are traditionally evaluated from the transverse profile (2D cross-section) perpendicular to the tunnel axis within the zone of steady-state deformations. This approach is justified by the fact that practical control of the construction impact on existing buildings and infrastructure is carried out precisely based on the transverse settlement profile parameters. The subsequent three-dimensional modeling was performed to accurately reproduce the step-by-step advancement of the tunnel face and to obtain reliable deformation values in the zone where they have stabilized, rather than to analyze the three-dimensional shape of the failure zone.
2. Materials and Methods
To date, various research and modeling methods exist. One of them is the physical modeling method, examined by numerous researchers [
16,
17]. There are also numerical methods, the most common of which are the discrete element method and the finite element method. For example, Wang J. and Hu X., in their studies, investigated the limiting-state zone of a mass composed of granular soils using numerical discrete modeling [
10,
18,
19]. Despite this, the most widely used modeling approach is numerical finite element modeling [
20,
21,
22]. For example, using this method, many researchers investigated the influence of tunnel depth of burial on the shape and size of the zone of ultimate state of the mass [
23,
24,
25]. For the numerical finite element modeling of the posed geomechanical problem, a software product was selected from the extensive range of similar solutions available, characterized by maximum capabilities in the field of modeling soil masses with the application of various material behavior models [
26,
27,
28]. For modeling the tunnel under construction using a shield tunneling machine with face support pressure, the software package Plaxis 3D v21 was used. Parameters of the numerical finite-element models in this study are divided into two main categories: geological and technological.
Geological criteria include physical and mechanical characteristics of the soil and structural features of the mass [
29,
30]. Studies are often limited by assumptions of medium homogeneity; however, soils can differ greatly in their physical–mechanical properties, structure, and hydrogeological characteristics [
31]. Technological criteria include face pressure from the soil surcharge—a nonuniformly distributed vertical load equal to 220 kN/m
2, increasing by 14 kN/m
2 per meter of surcharge column height. Grout pressure refers to a non-uniform load over a height equal to 200 kN/m
2, increasing by 20 kN/m
2 per meter of the soil-pressure balance column height. Grout pressure is applied to the seventh lining ring from the tunnel face. The jacking pressure of the shield on the end of the last installed lining ring is a uniformly distributed load of 640 kN/m
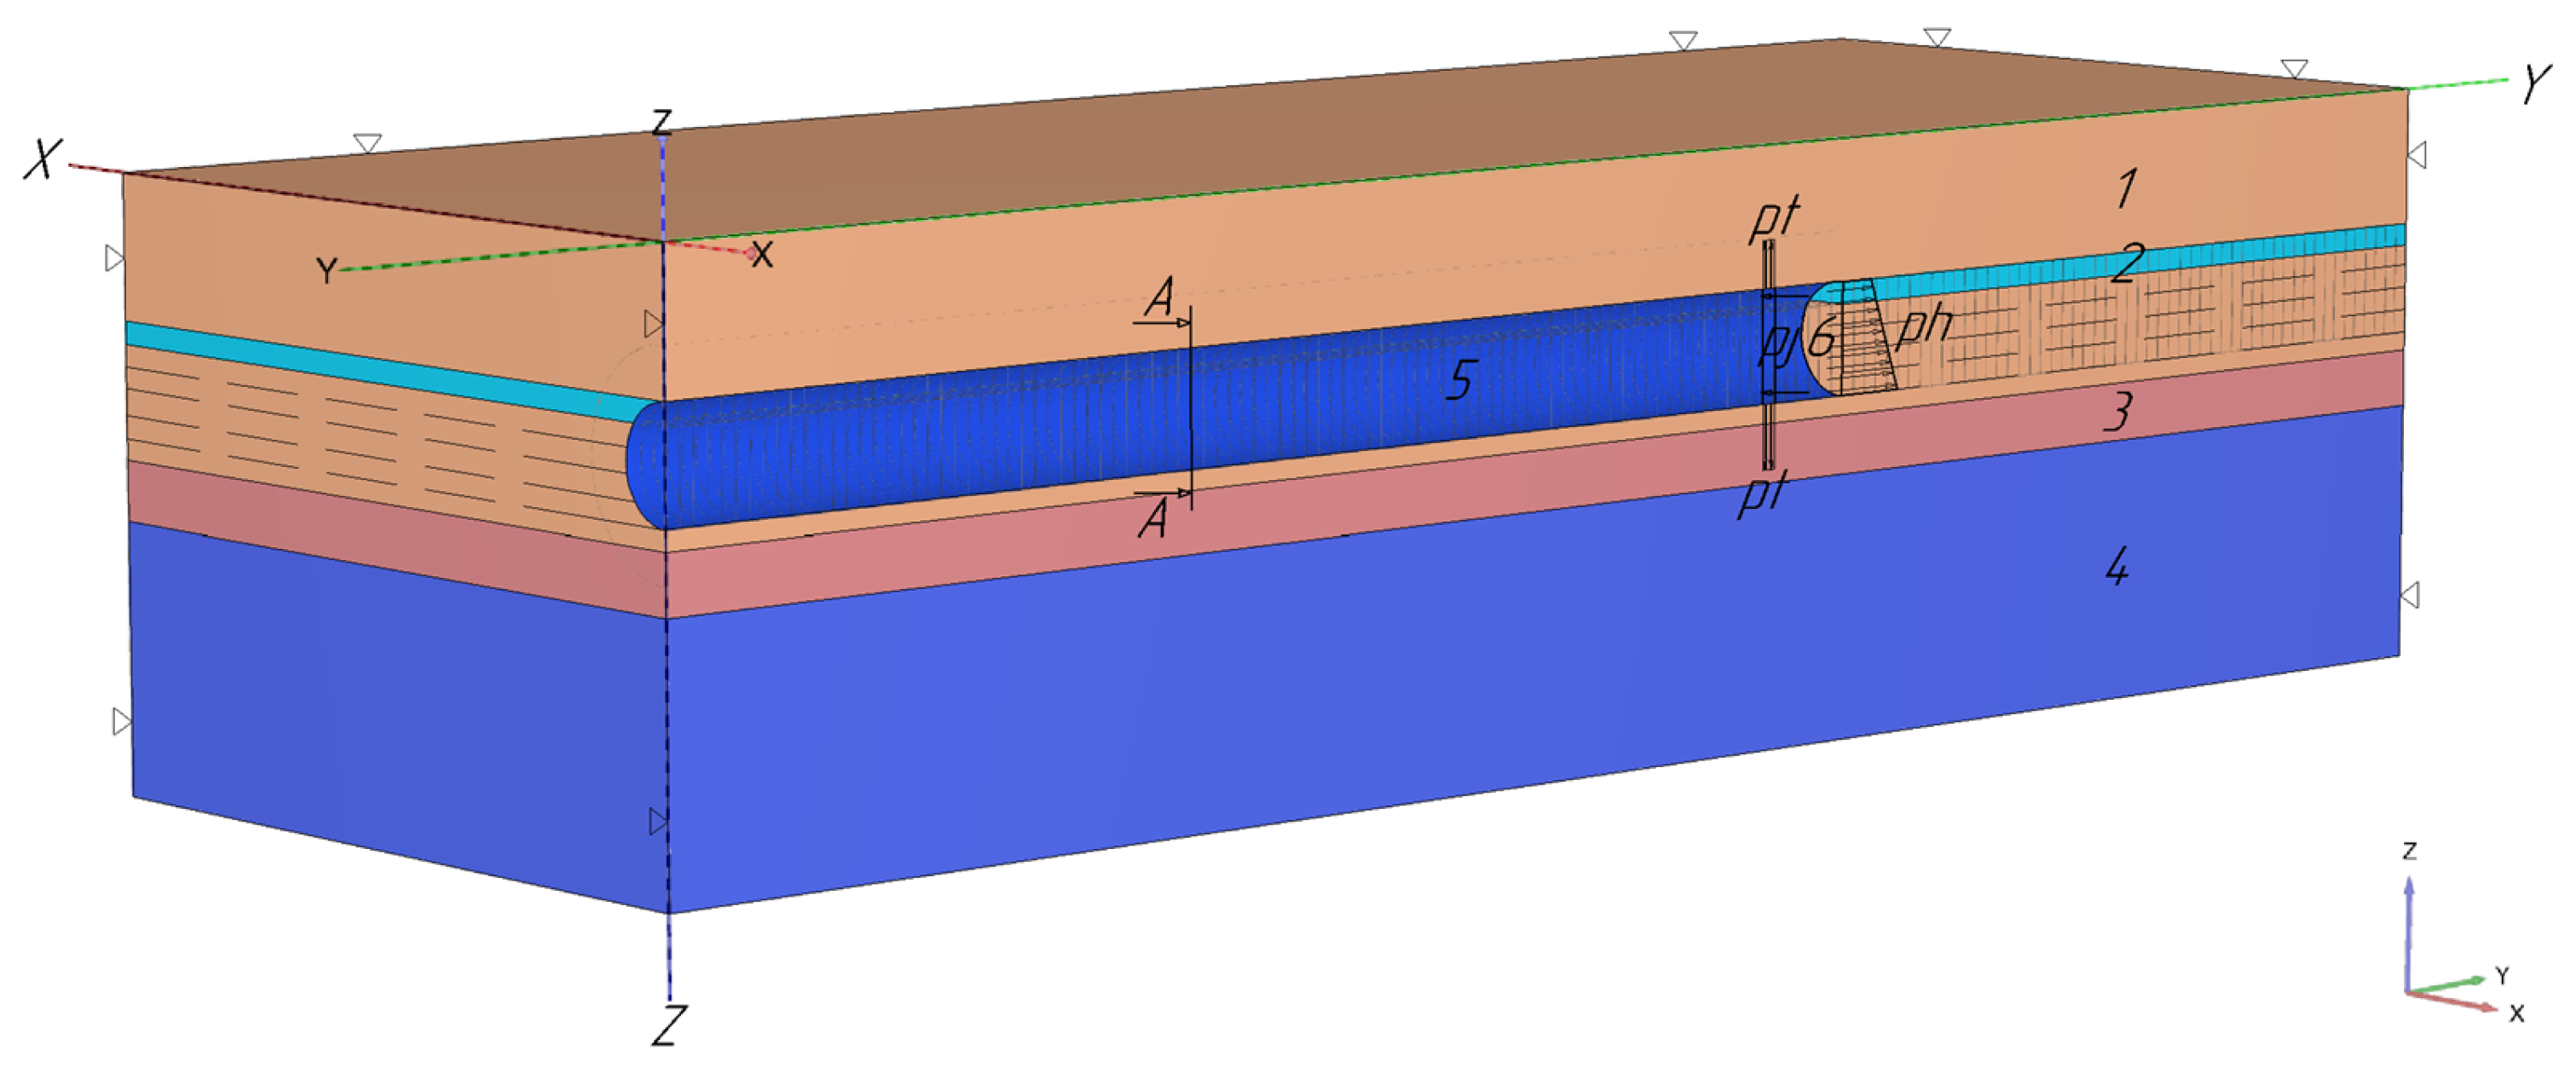
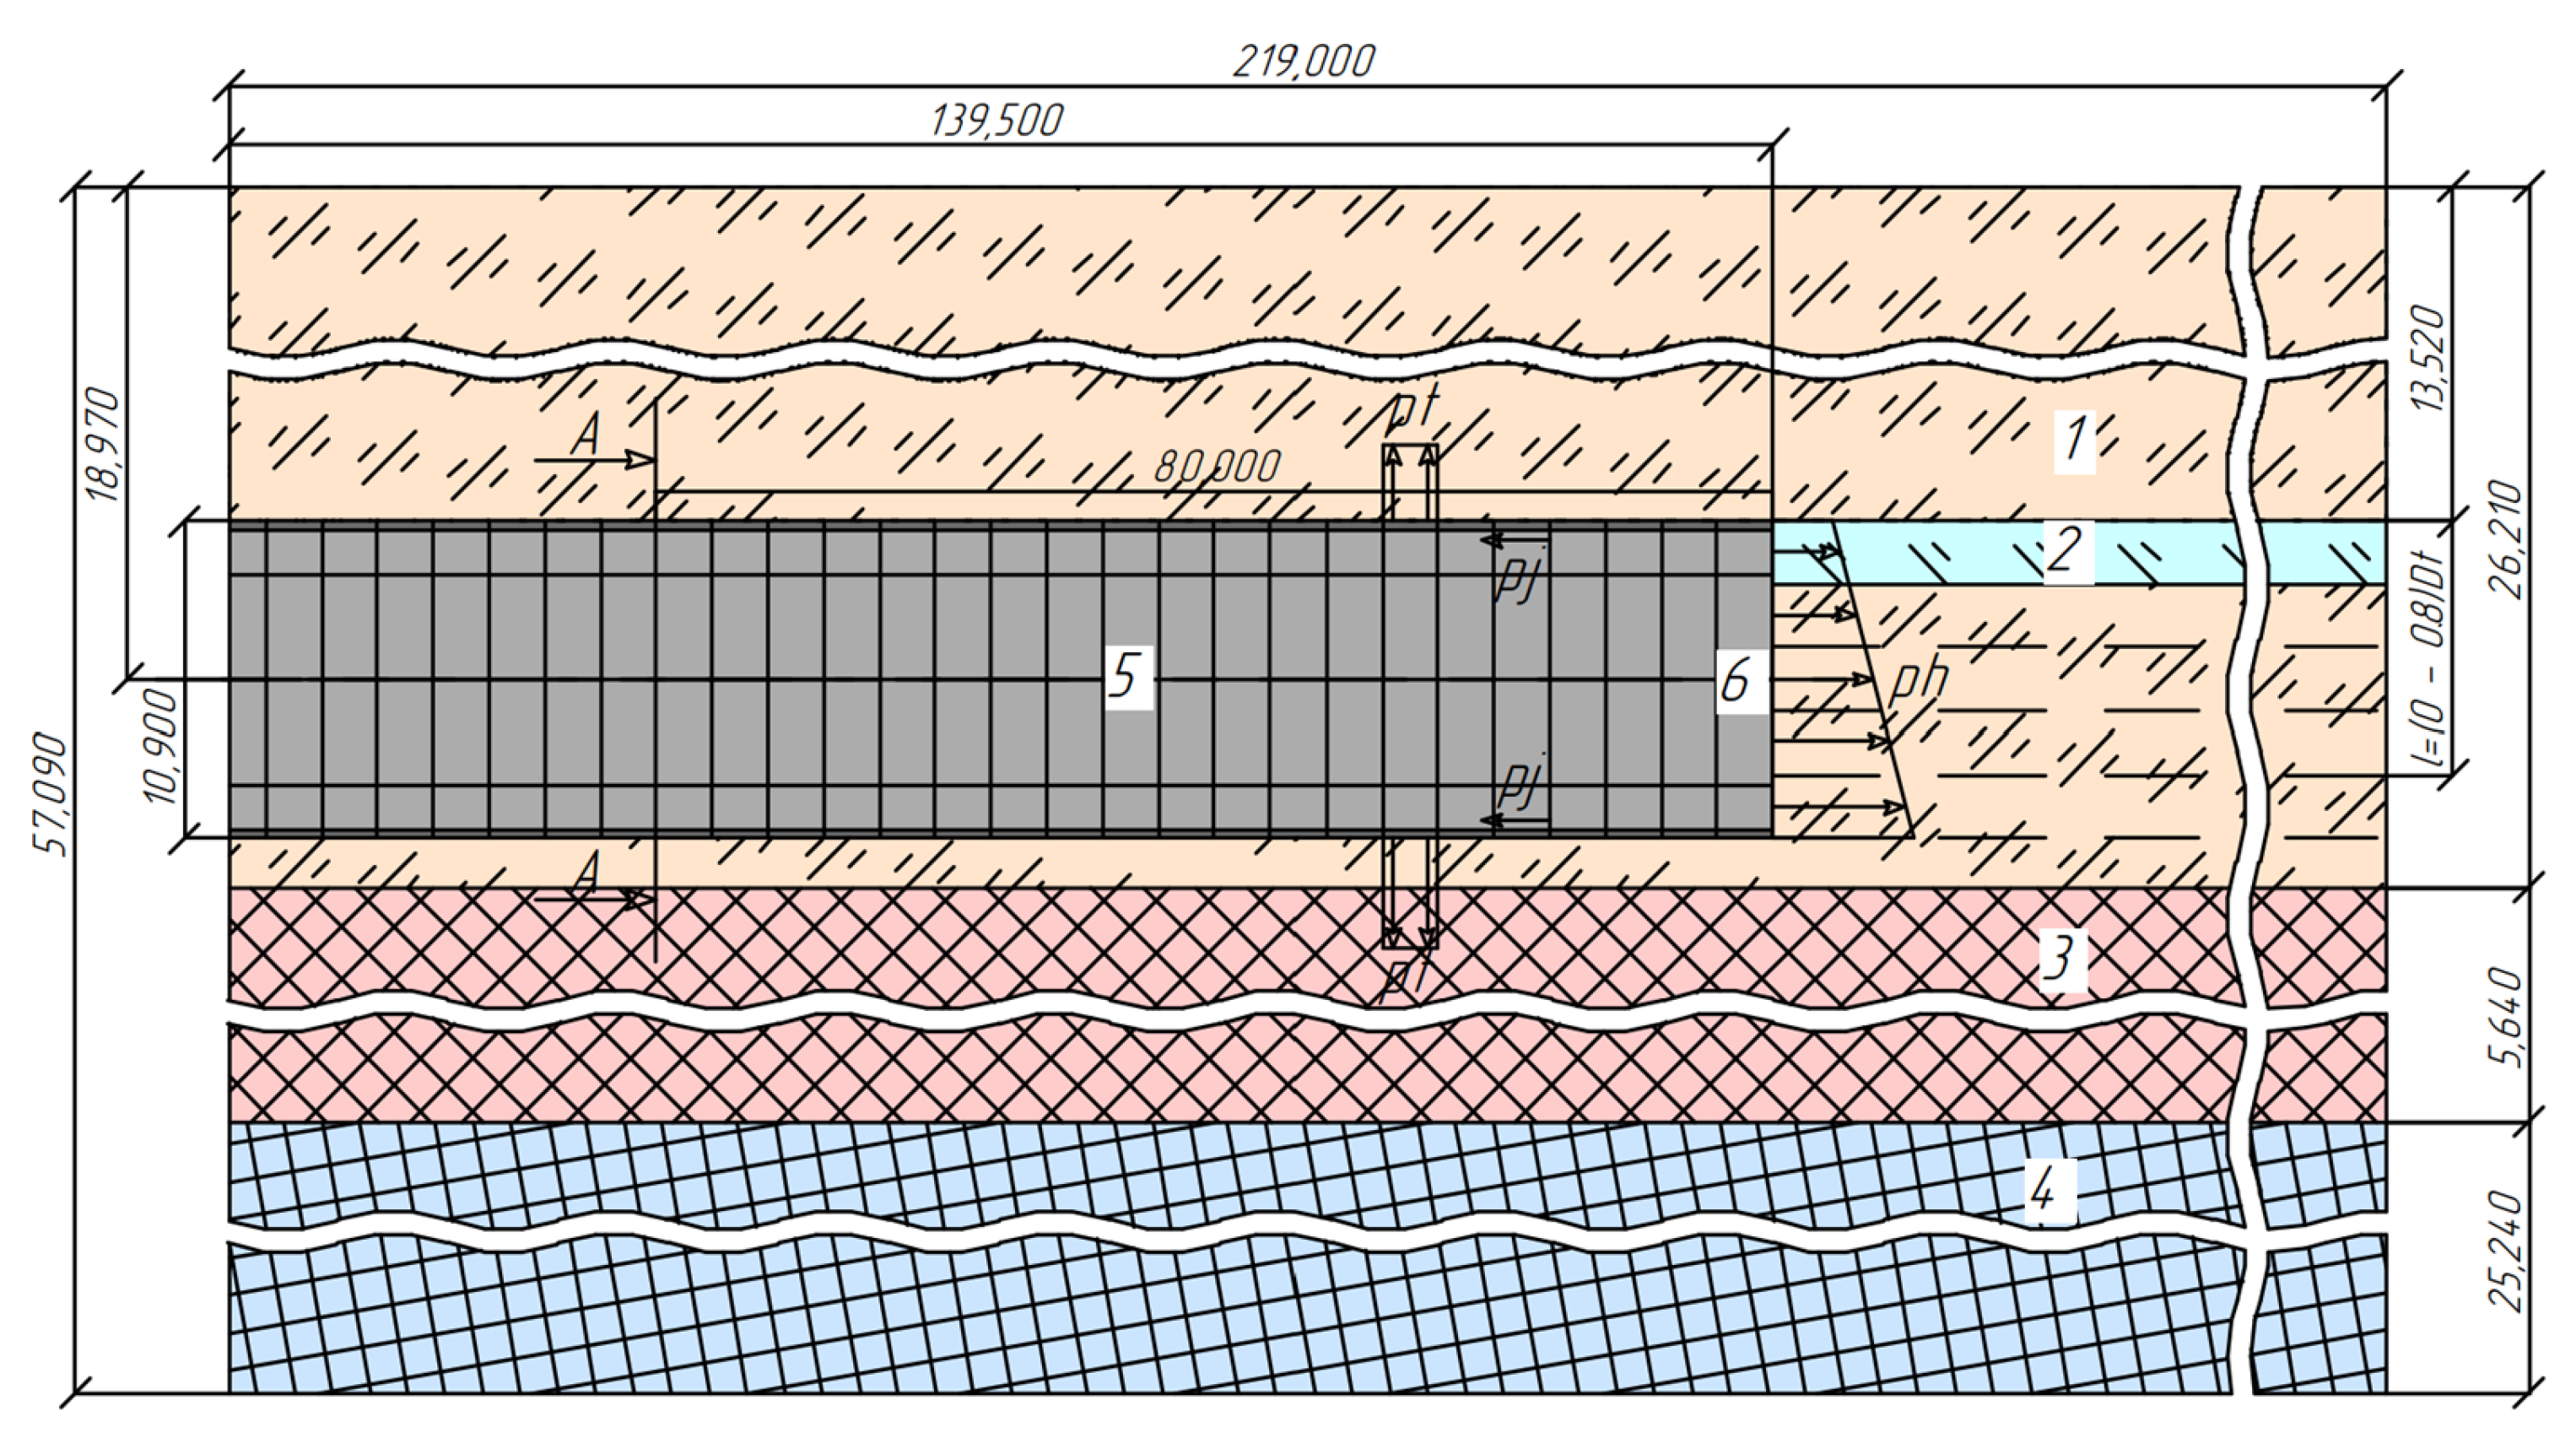
2. The tunnel lining parameters are as follows: diameter, 10.9 m; invert crown clearance; thickness, 0.45 m; width, 1.5 m; material, B30 class concrete. The installation of a lining ring is performed in the course of one step. The tunnel depth from the ground surface to the tunnel crown is 13.5 m. The first modeling step is the undisturbed soil mass. Subsequently, modeling steps are performed with sequential tunnel advancement in increments equal to the width of the lining ring (1.5 m); at the second step, soil excavation is modeled to a depth of 1 step and face support pressure is applied (ph); at the 6th modeling step, jack pressure is applied to the 5th lining ring (pj); at the 8th modeling step, grouting pressure is applied to the soil behind the lining of the 7th tunnel ring (pt). After step 8, in all subsequent steps, the tunnel advances in increments of 1.5 m until the tunnel has advanced a distance of 139.5 m. Each modeling step is performed until the system reaches an equilibrium state. Based on analysis of the possible ranges of the above parameters, a series of finite element models was constructed (
Figure 4). Model boundary conditions: the top surface is free to move in all three directions; lateral surfaces are fixed in the directions normal to them; the bottom plane is fixed in the vertical direction; at layer interfaces, stresses and strains are transferred continuously. Models are built in a three-dimensional setup, symmetric with respect to the vertical plane passing through the tunnel axis. A free meshing approach was adopted for the finite element mesh generation, with element sizes limited to 0.5 m. This mesh discretization enabled a reduction in computation time while minimizing the influence of mesh quality on the solution accuracy. The model dimensions are 80 m along the X axis, 219 m along the Y axis, and 57 m along the Z axis. The model comprises three main soil layers: a host layer that is 26.21 m thick (1), and dense, more competent layers that are 5.64 m (3) and 25.24 m (4) thick (
Figure 4 and
Figure 5).
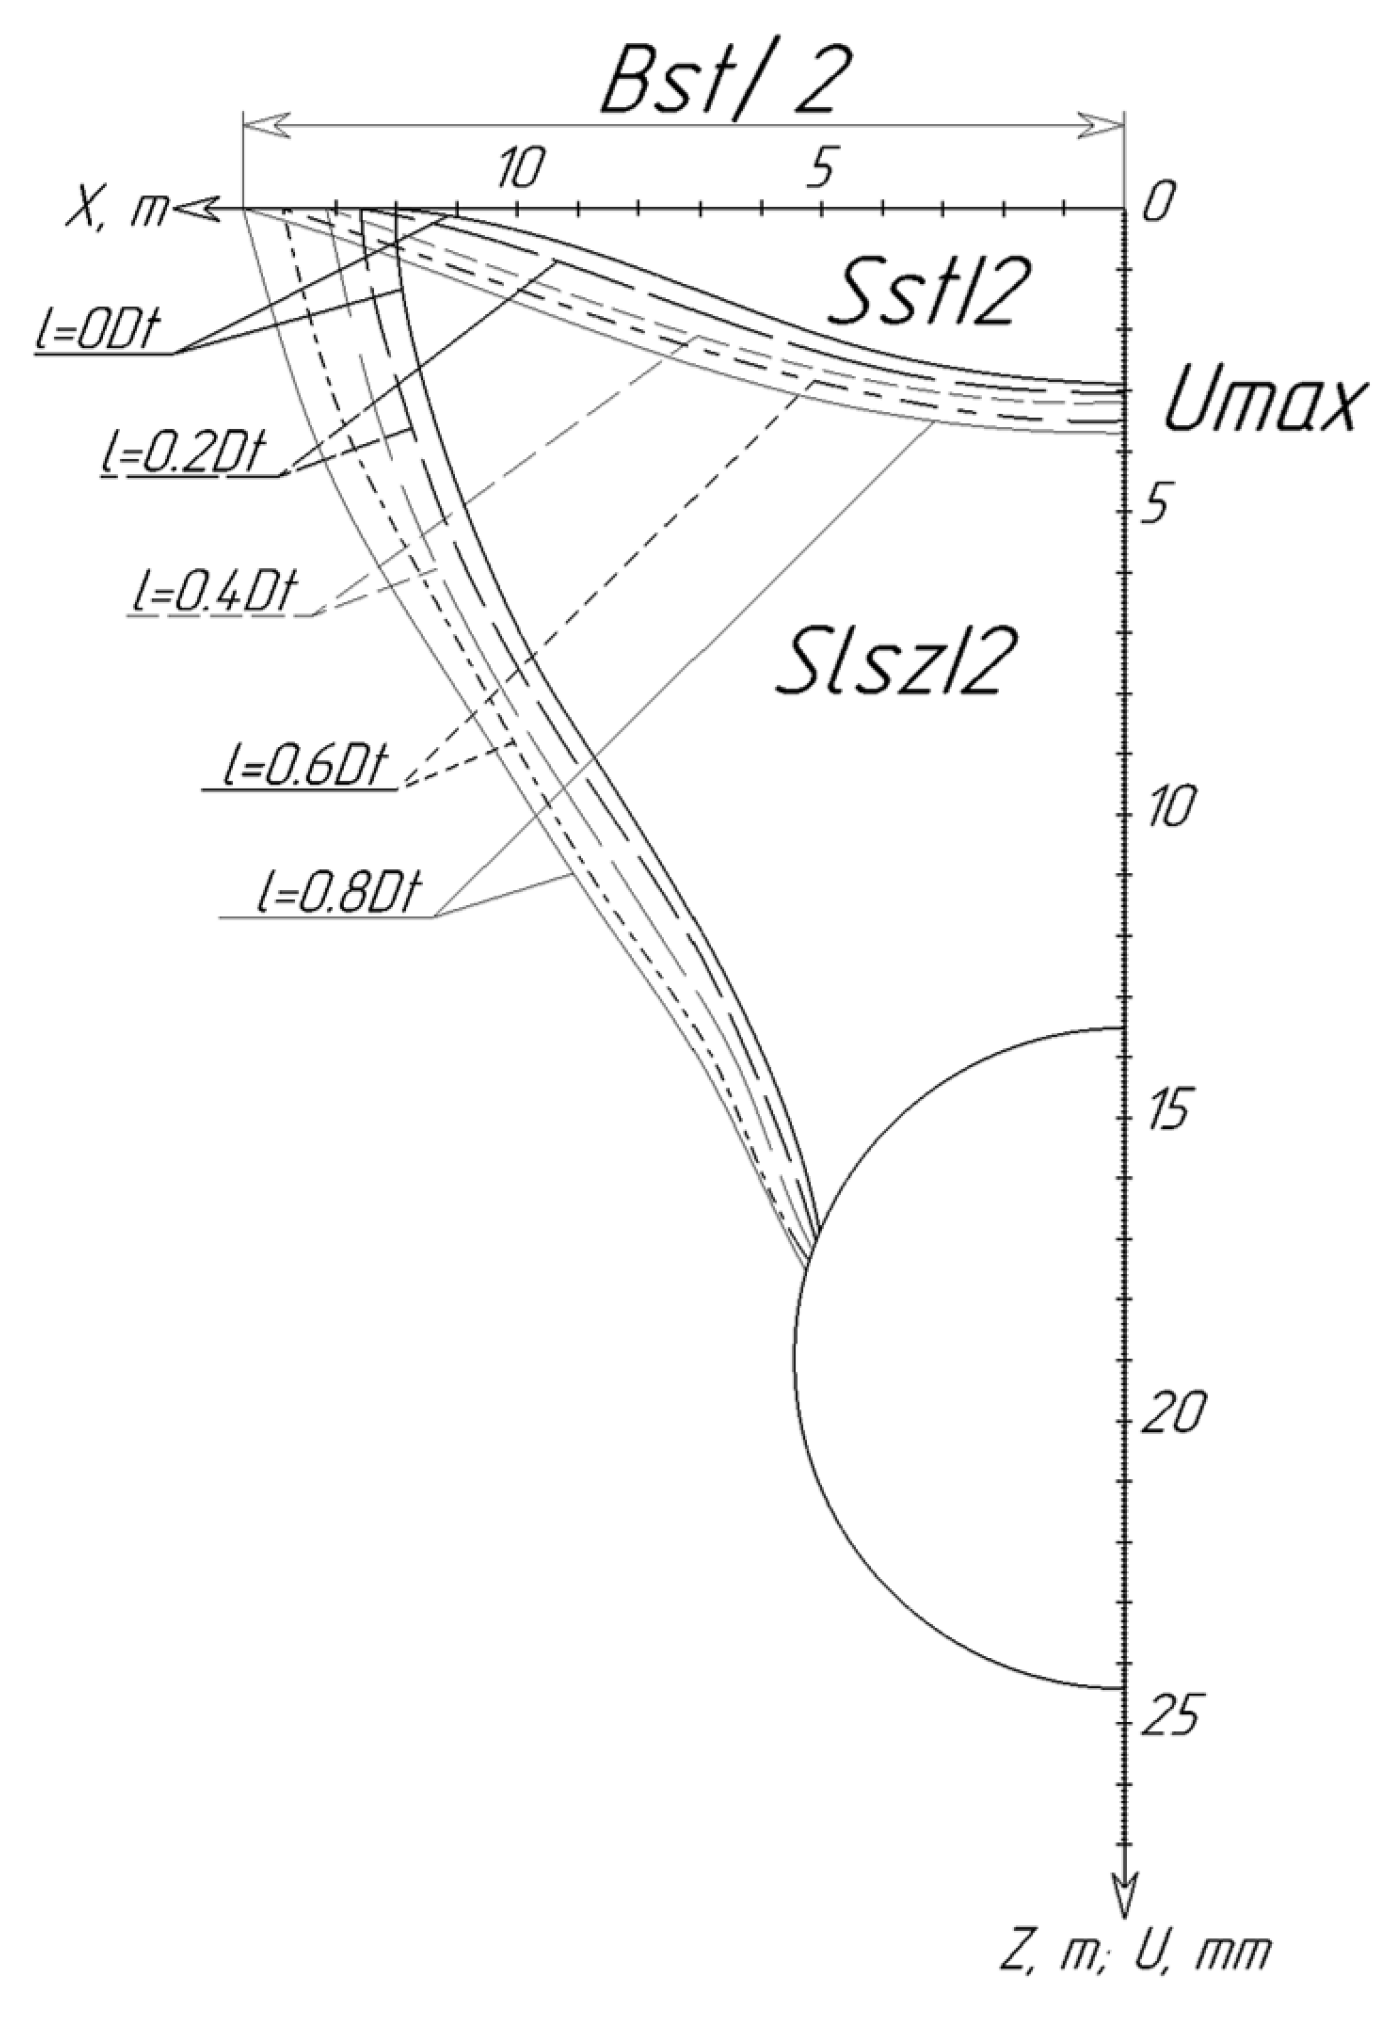
To accurately analyze the influence of the soil-mass structure at the face of the advancing tunnel on ground deformations, it is necessary to construct a model in which all parameters except one remain unchanged. This approach allows an assessment of the variation in results when each parameter is varied independently. The model includes two main soil layers that bear the face support pressure load: the first is the host layer, which has constant stiffness and strength properties; the second is the variable layer, for which the stiffness and strength characteristics, as well as the position relative to the tunnel axis, are varied. While keeping the variable layer’s thickness and the modeling’s technological conditions constant, vertical displacement of this layer leads to changes in the deformed state of the soil mass under construction loading. However, it is also important to account for the significant effect of the variable layer’s thickness on the mass’s deformed state at the tunnel face. For a comprehensive assessment of how the face-mass structure affects the deformed state, the variable layer’s thickness is taken as 2.18 m, 2.89 m, and 3.60 m, corresponding to 0.20Dₜ, 0.265Dₜ, and 0.33Dₜ (where Dₜ is the tunnel diameter). Modeling is carried out for five configurations of the variable soil layer’s position (
Figure 5). For various thicknesses of the variable layer, the layer positions (l) were set as follows:
For a variable-layer thickness of 0.20 Dₜ, the layer lies at depths l = 0 Dₜ (at the tunnel crown), 0.20 Dₜ, 0.40 Dₜ (at the tunnel invert), 0.60 Dₜ, and 0.80 Dₜ (in the tunnel invert) measured from the crown;
For a thickness of 0.265 Dₜ, the layer lies at depths l = 0 Dₜ (at the crown), 0.12 Dₜ, 0.37 Dₜ (at the invert), 0.62 Dₜ, and 0.74 Dₜ (in the invert) from the crown;
For a thickness of 0.33 Dₜ, the layer lies at depths l = 0 Dₜ (at the crown), 0.08 Dₜ, 0.33 Dₜ (at the invert), 0.58 Dₜ, and 0.67 Dₜ (in the invert) from the crown.
For the considered conditions of tunnel construction (sands, sandy silts, and silts) in the Plaxis 3D software package, the hardening soil small-strain nonlinear soil elasticity model was selected, in which an additional hyperbolic relationship between stresses and strains at small strains (γ < 10
−3) was established. The simulation was performed under drained conditions, which implies instantaneous dissipation of excess pore water pressure. This approach is justified for the soil types considered (sands, sandy silts), which are characterized by high permeability, whereby the consolidation process occurs nearly simultaneously with construction. For soils with low permeability (clays, water-saturated silty clays), a fully coupled analysis accounting for consolidation is required, which lies beyond the scope of the present study and may constitute a subject for future research. To exclude the influence on the modeling results of the numerous mechanical characteristics of the variable layer that differ from those of the host layer, the main ones were selected for variation and assessments of their impact: Eoed—oedometric stiffness modulus; E50—secant stiffness modulus for primary loading at 50% of shear strength; Eur—unloading/reloading stiffness modulus; φ—soil internal friction angle; C—soil cohesion. The host-layer physico-mechanical parameters were adopted from international experience in tunnel construction using shield tunneling machines and other analogous technologies [
30]. The optimal selection of the stiffness and strength property ranges of the soil mass is crucial, as these may vary significantly [
32,
33,
34]. For each characteristic of the variable soil layer, the following absolute and relative ranges were established with respect to the parameters of the host layer (
Table 1):
Soil stiffness modules (Eoed, E50, Eur): from 0.07 to 1.93 of the base value, in increments of 0.475·(Eoed, E50, Eur);
Internal friction angle φ: from 0.65 to 1.35 of φ, in increments of 0.175·φ;
Cohesion C: from 0 to 2·C, in increments of 0.5·C.
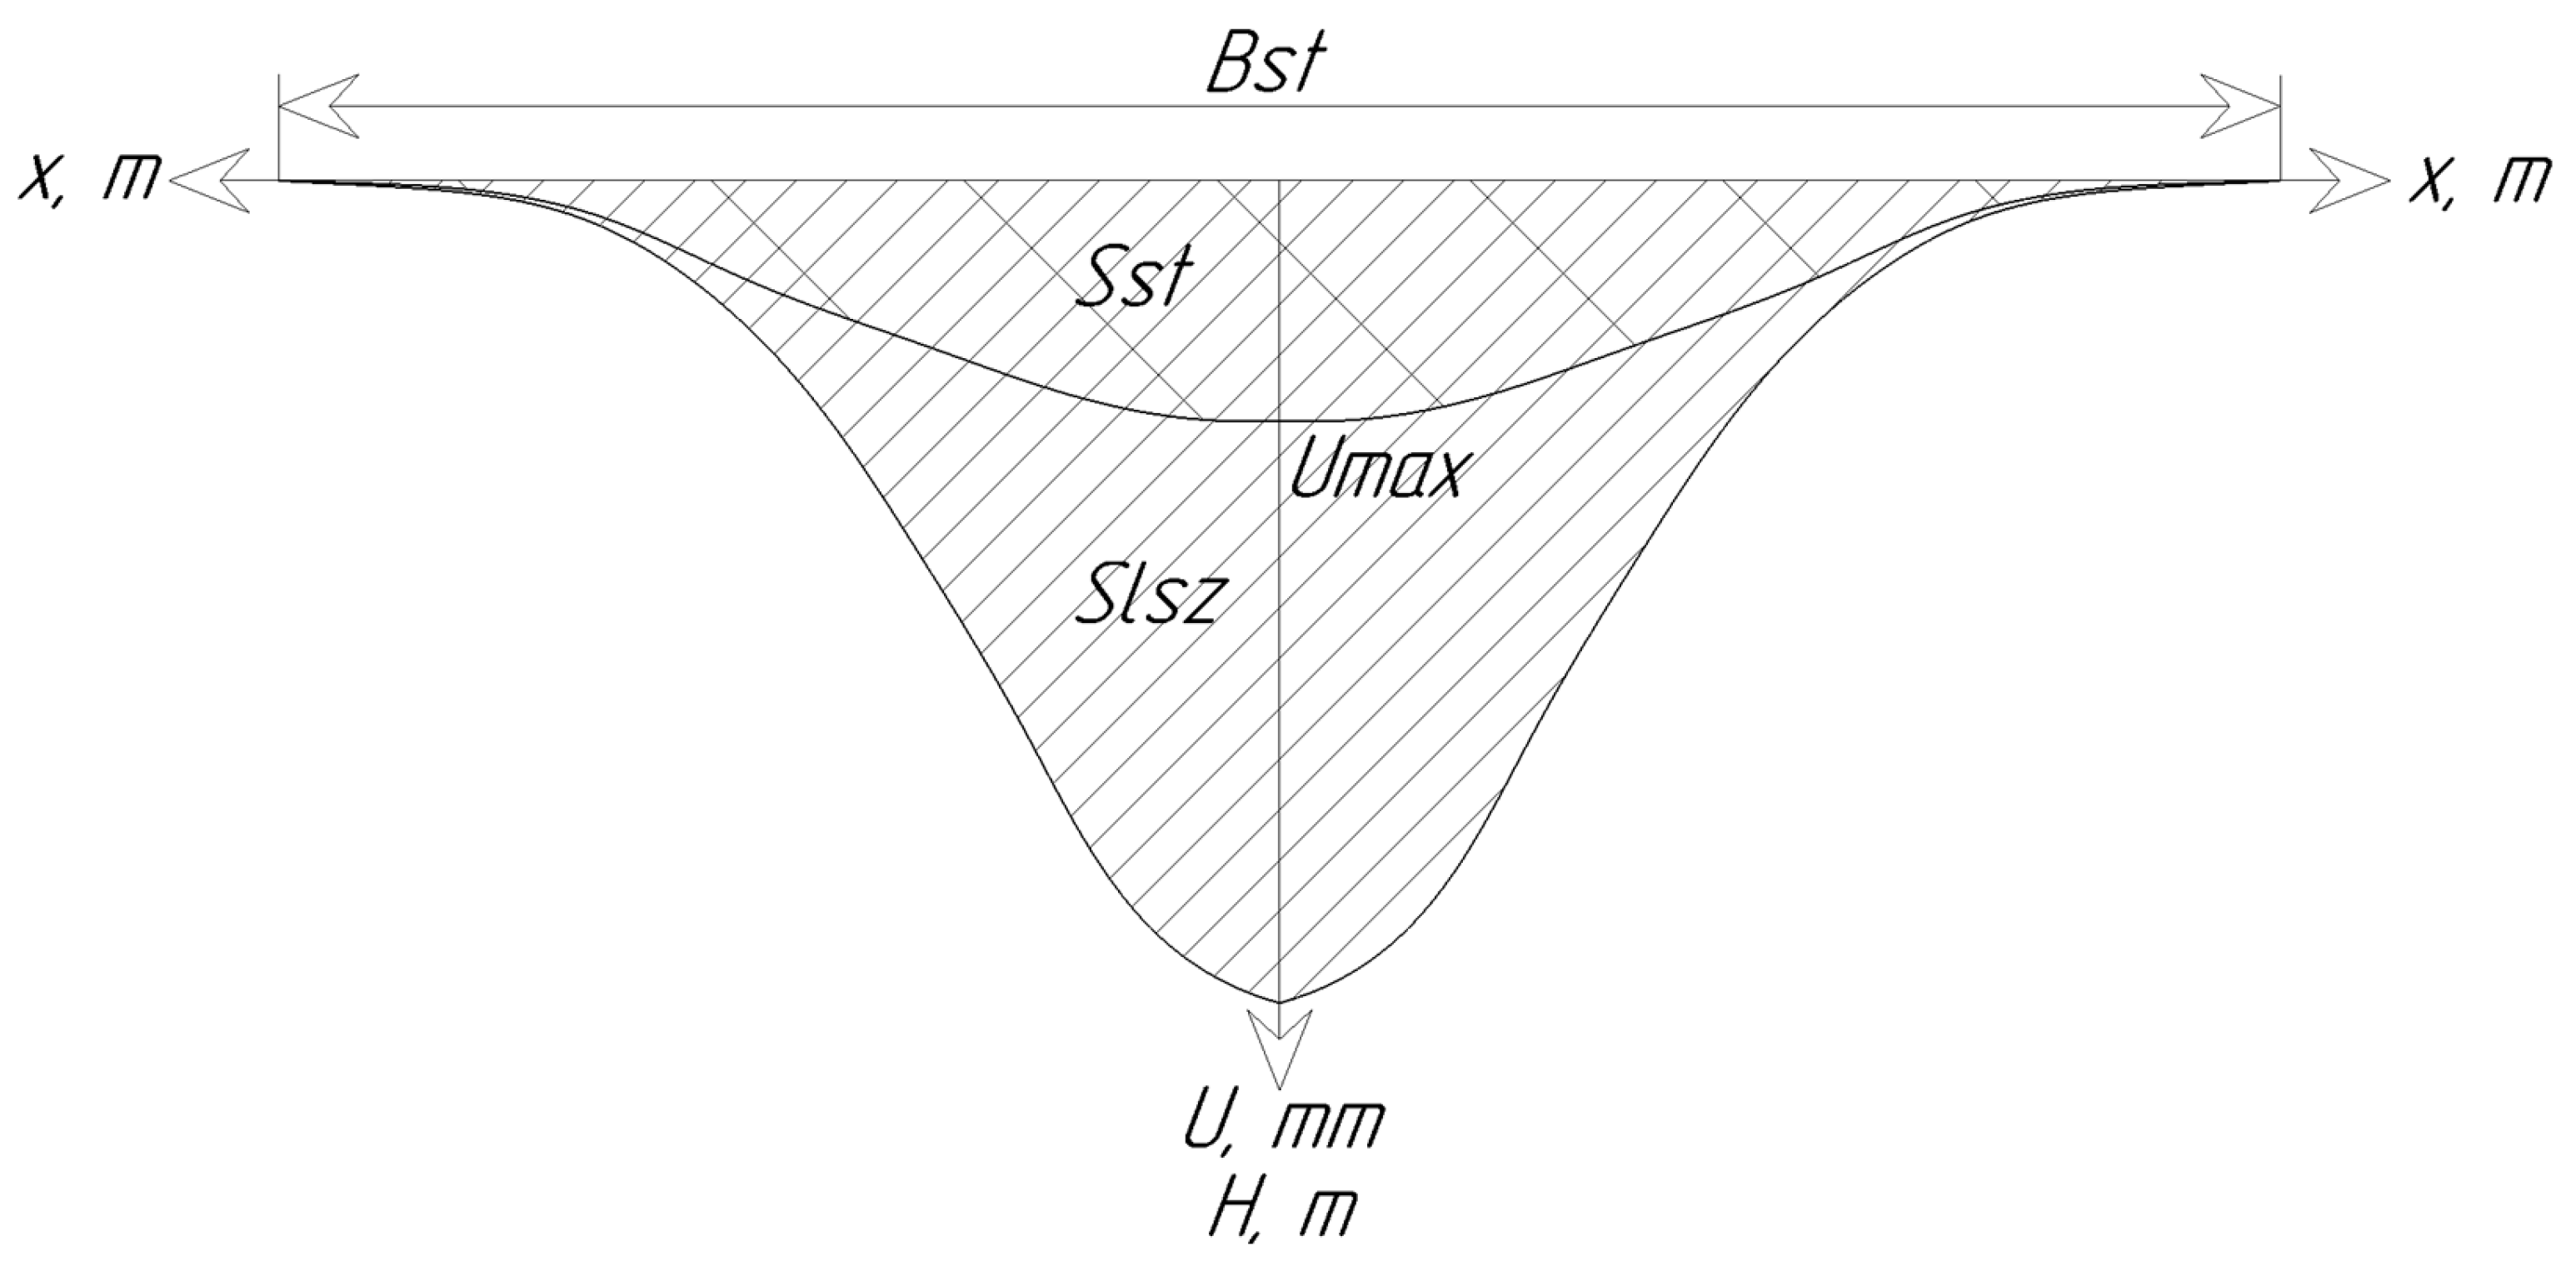
Thus, 225 numerical finite element models were constructed, with 5 positions of the variable layer × 3 thicknesses of the variable layer × 3 variable mechanical characteristics (E, C, φ) with 5 variation steps. The limitation of the investigated methodology is the absence of a direct consideration of the influence of various groundwater conditions on the problem result due to the excessively high number of finite element models required for construction. For the current investigation, the well-known influence of groundwater on tunnel face stability is taken into account. The main monitored criteria are as follows: the area of the surface settlement trough
Sst, the area of the zone of negative vertical deformations
Slsz, the width of the settlement trough
Bst, and the maximum value of vertical settlements
Umax (
Figure 6).
For each model set, a comparative simulation was performed with identical physico-mechanical properties for the variable and host soil layers. The absence of differences in the monitored parameters between these models indicates the correctness of the methodology and the reliability of comparing different series of computational schemes. Only the single varied parameter influences the simulation result of each model series.
3. Results
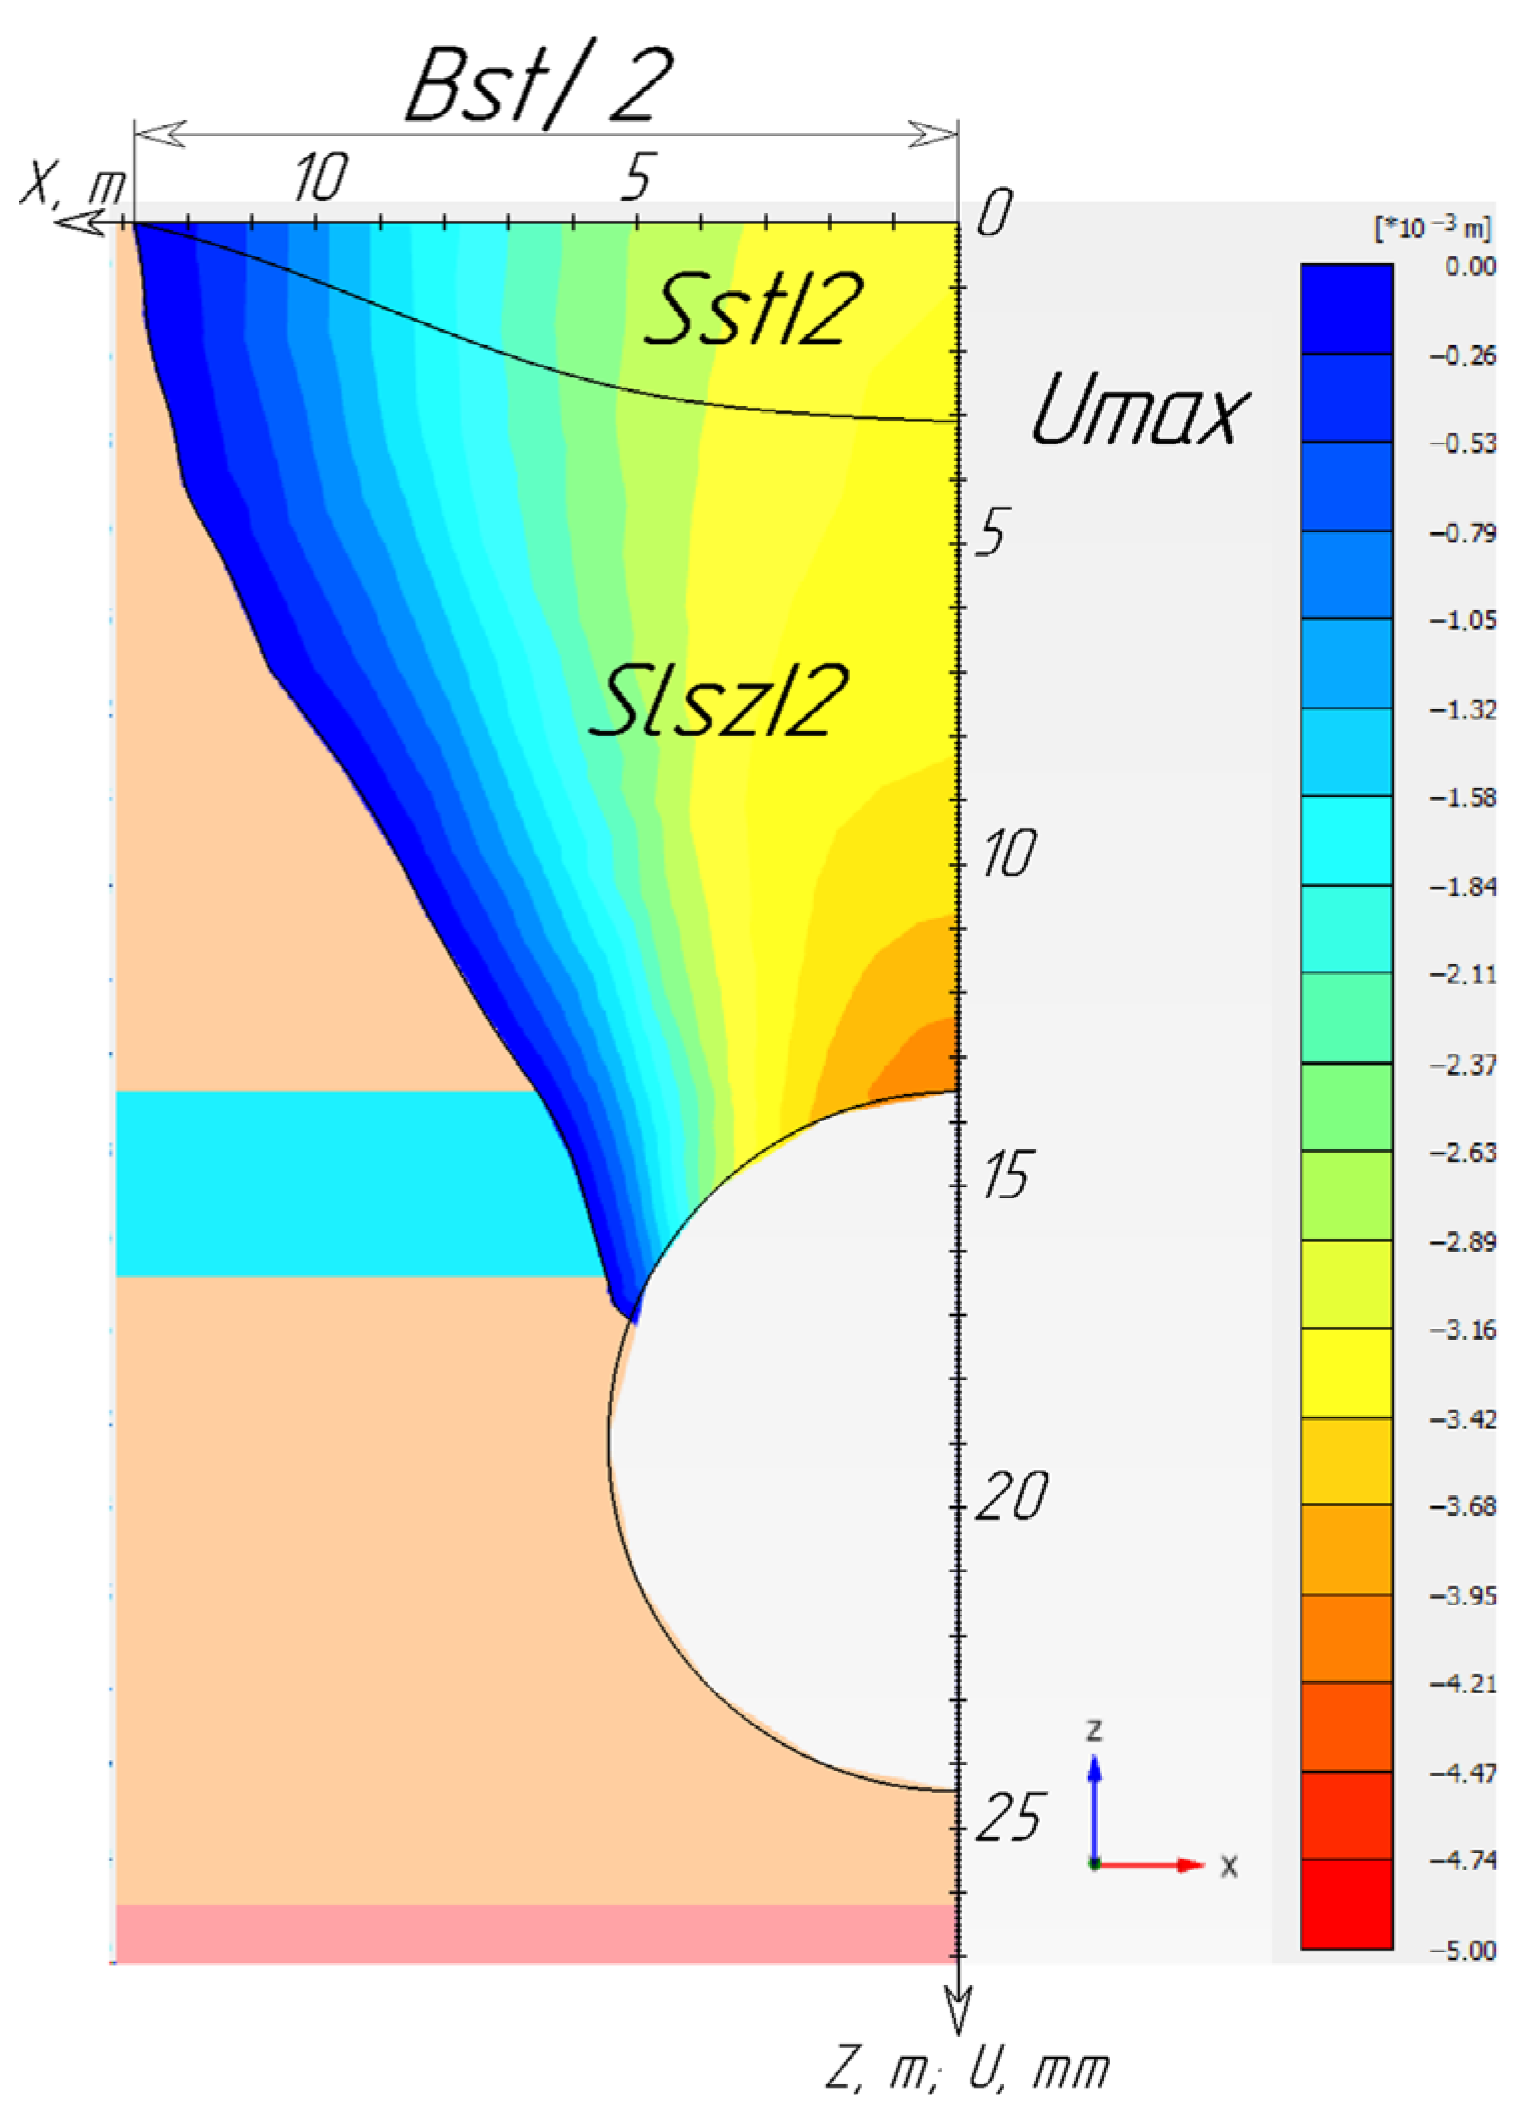
From the simulation results of each model, a vertical section of the soil mass was constructed with a plot of the vertical deformation distribution over the zone of steady-state deformations, at a distance of more than 80 m from the tunnel face, for subsequent analysis (
Figure 7). The considered section at a distance of 80 m from the tunnel face was investigated because deformations had ceased their development in all 225 models at this point.
Measurement was then performed for the criteria describing the shape of the settlement trough and the area of the zone of negative vertical deformations of the mass:
Sst,
Slsz,
Bst, and
Umax (
Figure 8).
A summary and systematization of multiple results are carried out by constructing analytical relationships [
35,
36,
37]. For processing, the results are loaded into the Origin 2024 software package for constructing analytical relationships (
Figure 9,
Figure 10 and
Figure 11). Next, by overlaying an analytical surface onto the experimental graph, a surface graph of the change in value of the selected criterion is constructed (highlighted in blue in
Figure 9,
Figure 10 and
Figure 11), which describes the shape of the experimental graph with sufficient accuracy. The analytical relationship is accepted for describing the graph if the accuracy of its description is not lower than 98%. The accuracy parameters in Origin 2024 are calculated automatically and are not subject to adjustment after calculation, which indicates the accuracy of selecting the analytical relationship for describing the experimental graph. In the analytical relationships below, the following notations will be used:
z—the value of the required criterion (Sst, Slsz, Bst, Umax);
x—the distance from the tunnel crown to the crown of the variable layer, l;
y—the ratio of the varied physico-mechanical parameter of the variable layer to that of the host layer (Ev/Eh, φv/φh, cv/ch) depending on the model series.
All other parameters are determined empirically by the software suite.
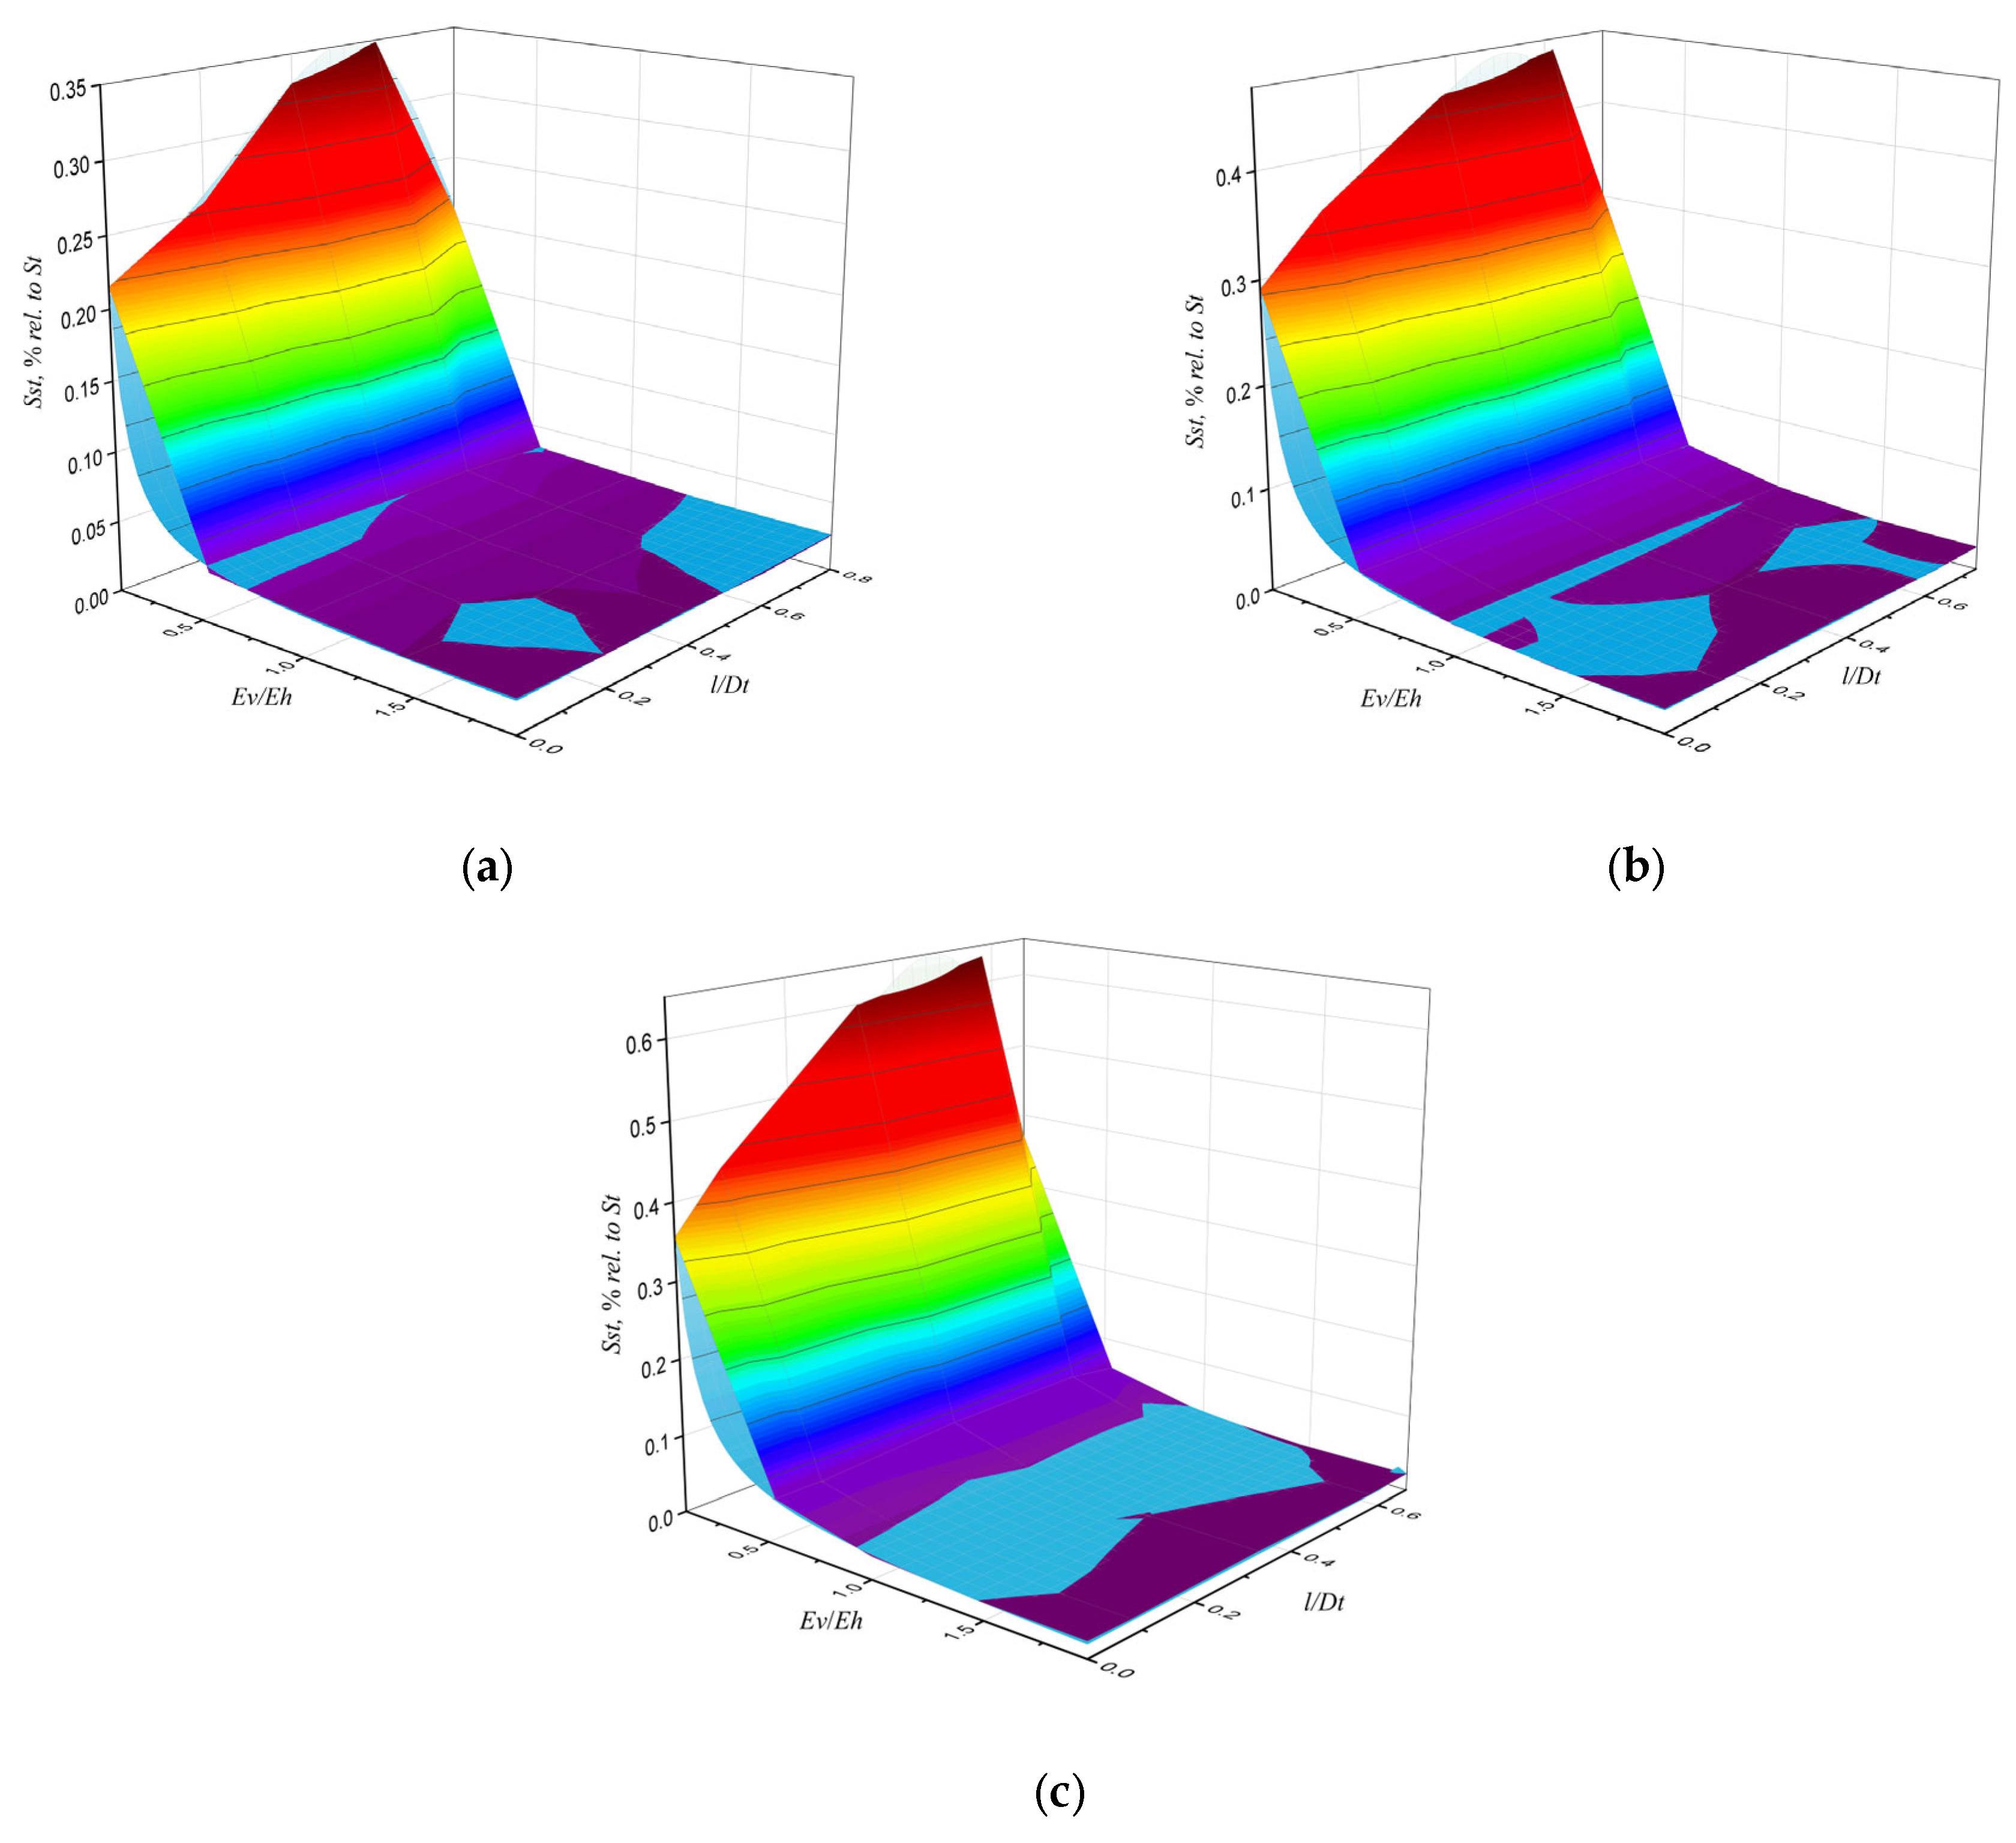
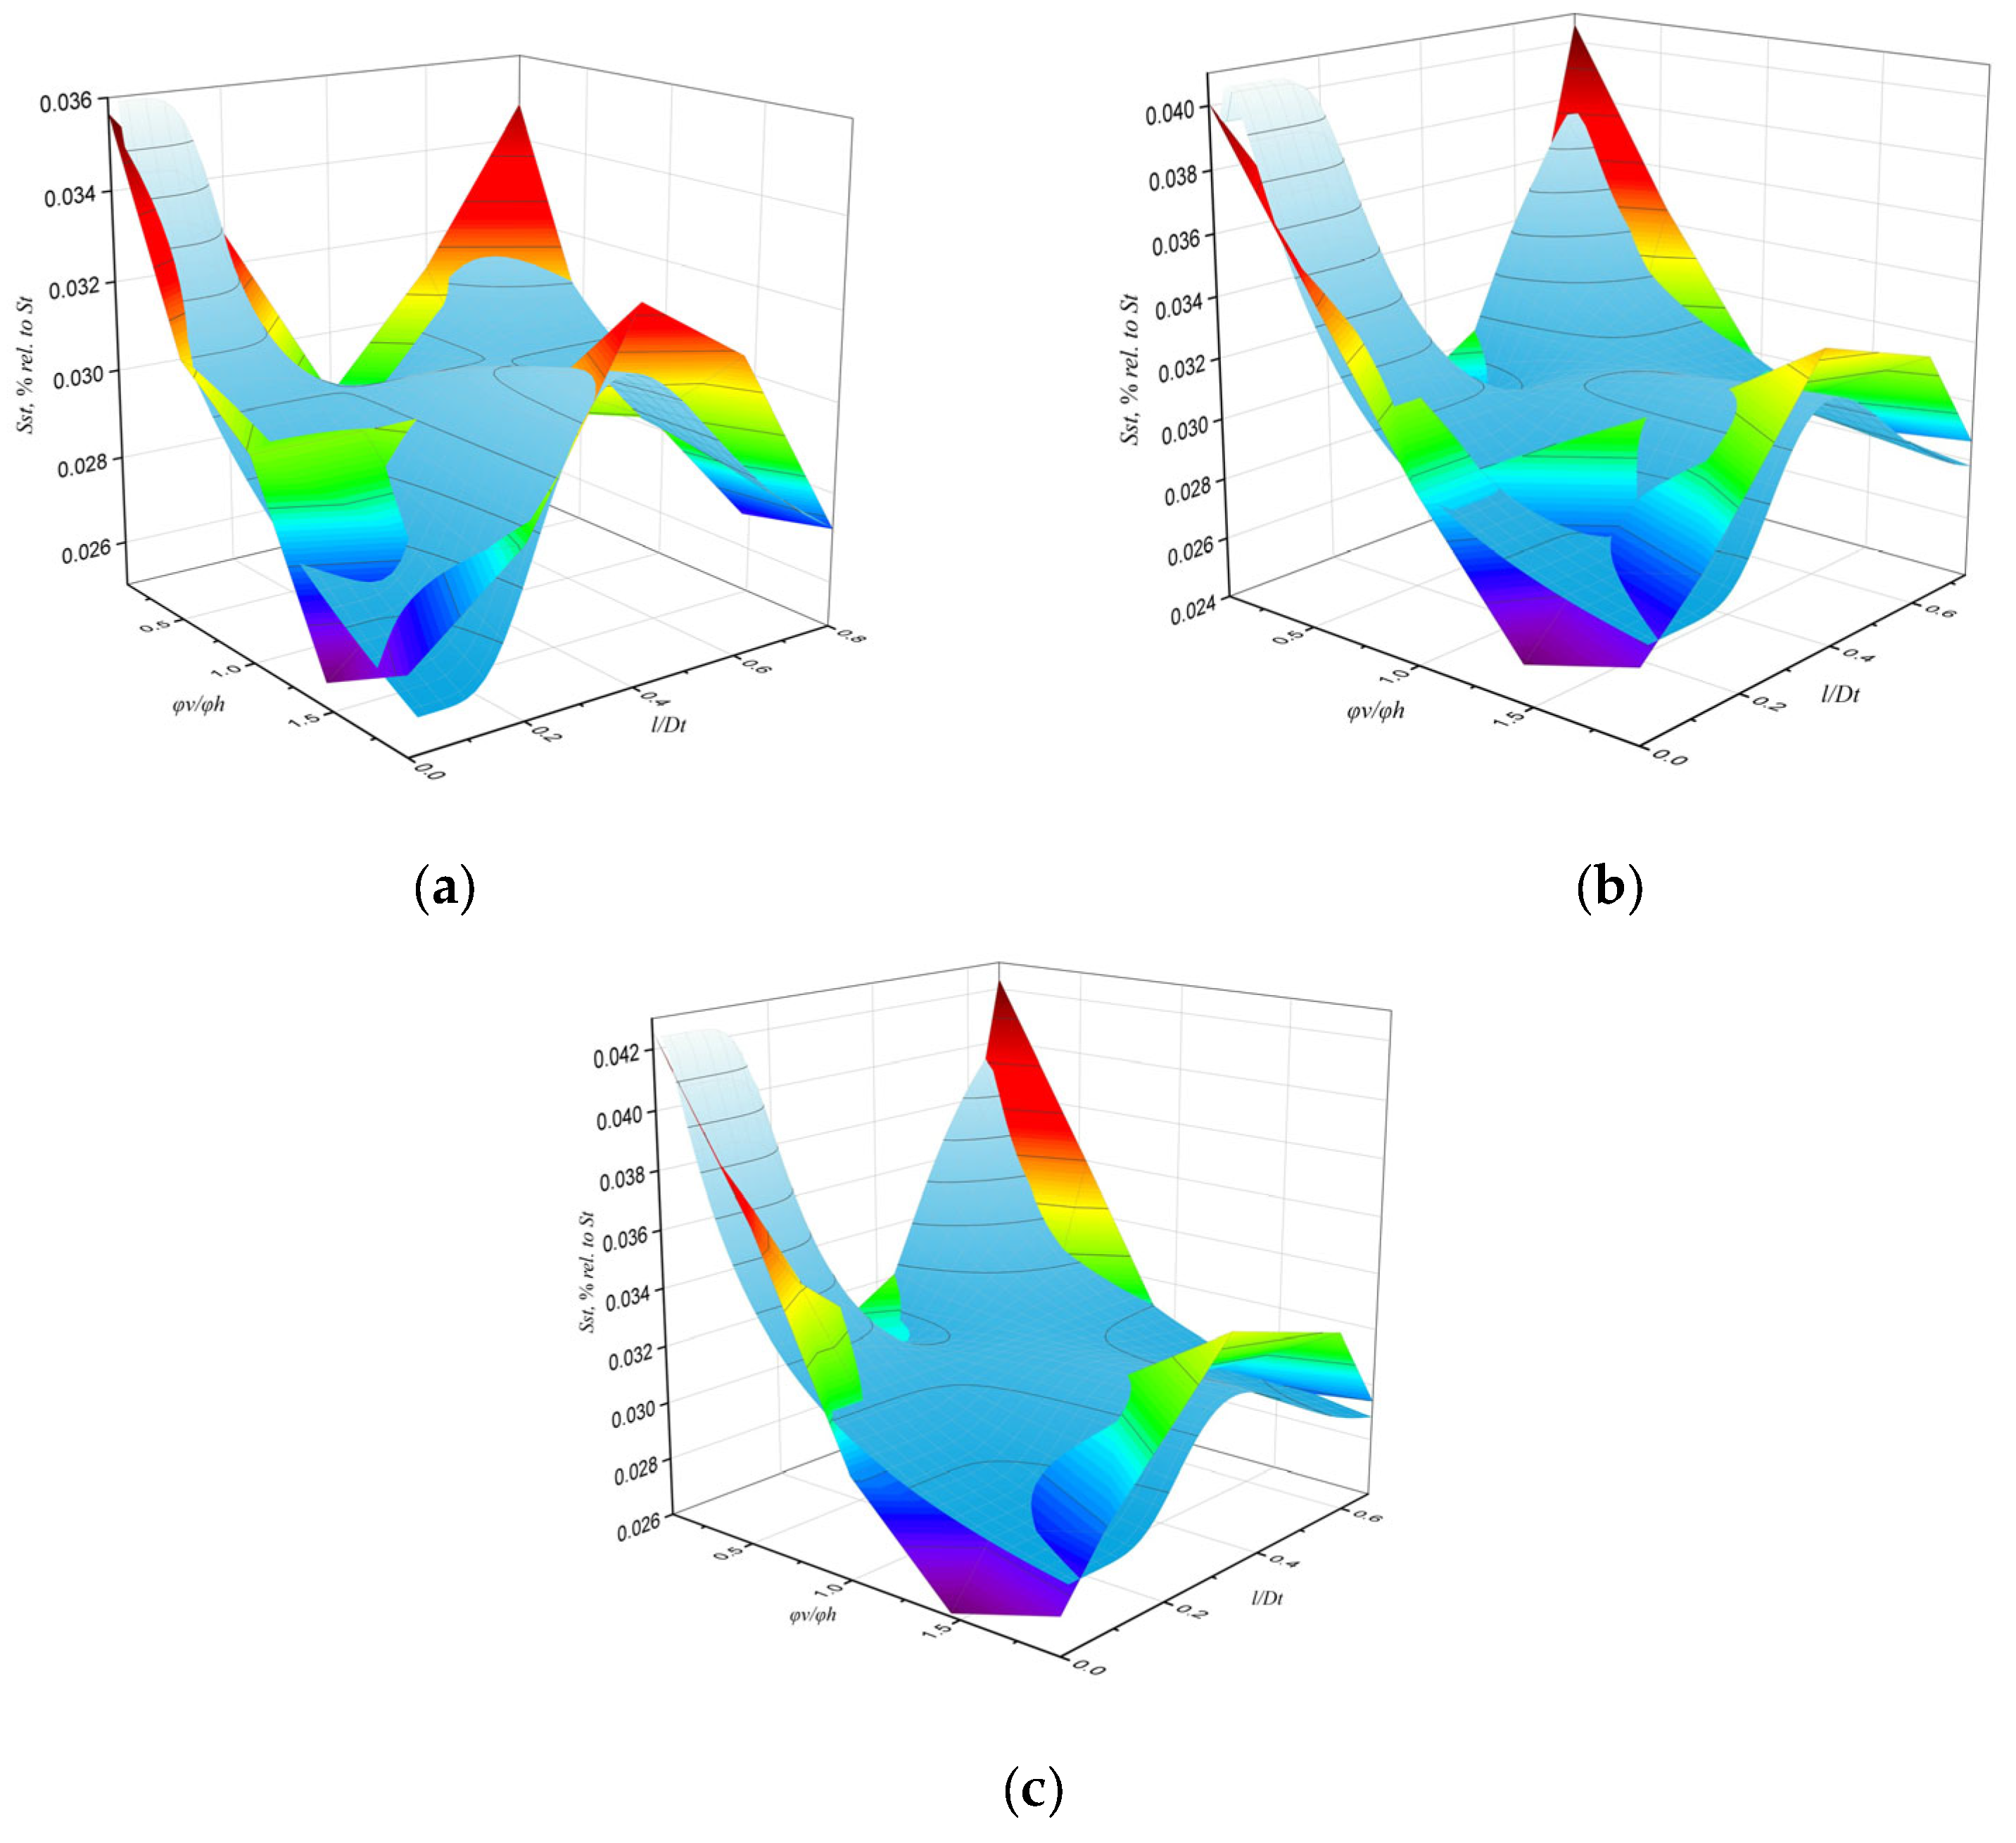
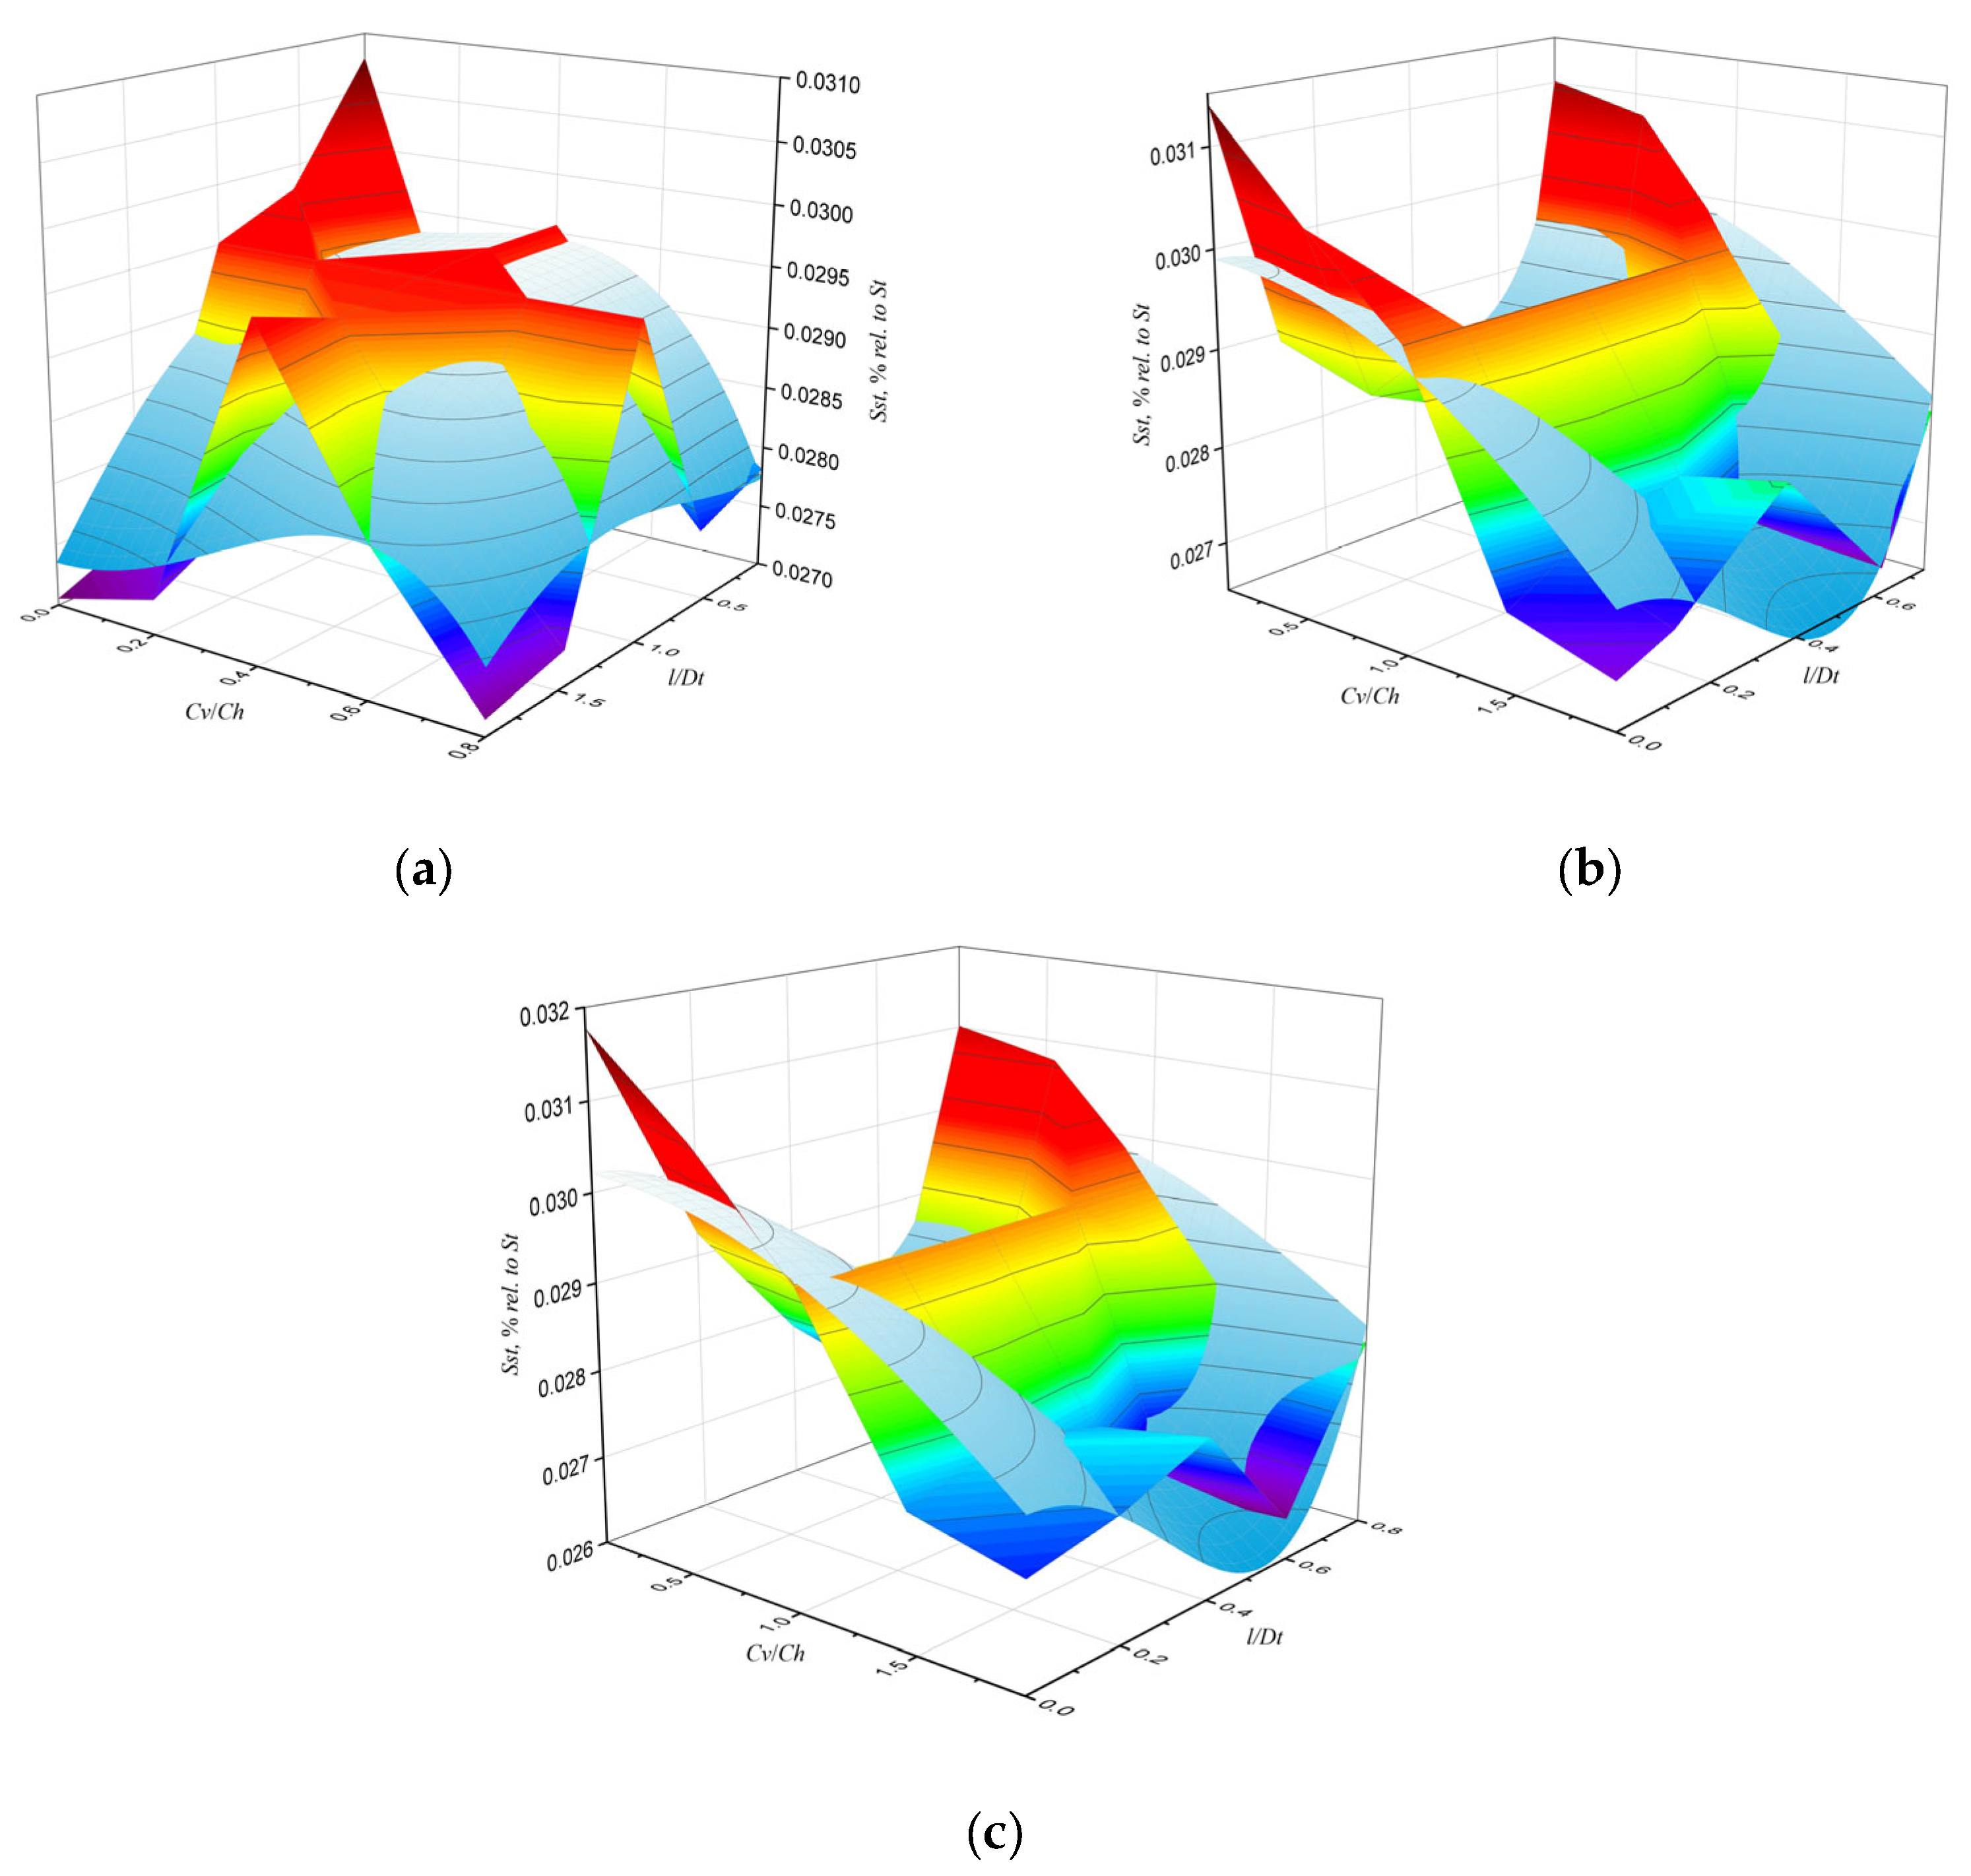
For example,
Figure 9,
Figure 10 and
Figure 11 and
Table 2,
Table 3 and
Table 4 present the results of constructing relationships for the settlement trough area criterion
Sst as a function of the soil mass structure at the tunnel face, at varied values of soil mechanical properties and variable layer thickness.
Figure 9.
Graphs of the dependence of the settlement trough area Sst on the soil mass structure at the tunnel face when varying the ratio of the stiffness modulus E values of the mass layers for variable layer thicknesses equal to (a) 0.2D; (b) 0.265D; (c) 0.33D.
Figure 9.
Graphs of the dependence of the settlement trough area Sst on the soil mass structure at the tunnel face when varying the ratio of the stiffness modulus E values of the mass layers for variable layer thicknesses equal to (a) 0.2D; (b) 0.265D; (c) 0.33D.
Table 2.
Analytical relationship of the settlement trough area Sst to the soil mass structure at the tunnel face when varying the ratio of the stiffness modulus E values of the mass layers for variable layer thicknesses and the values of its parameters.
Table 2.
Analytical relationship of the settlement trough area Sst to the soil mass structure at the tunnel face when varying the ratio of the stiffness modulus E values of the mass layers for variable layer thicknesses and the values of its parameters.
| Graph Number | Figure 9a | Figure 9b | Figure 9c |
|---|
| Model | RationalTaylor |
| Equation | |
| z0 | 1282.57141 | 4.22268 | 1.60923 |
| A01 | 1270.95399 | 1.32791 | −0.0991 |
| B01 | −1505.97942 | −4.77121 | −1.78706 |
| B02 | 367.5025 | 0.62475 | −0.24461 |
| C02 | −368.08566 | −2.19971 | −0.09776 |
| A1 | 94,176.34588 | 199.83218 | 51.50834 |
| A2 | −3649.54408 | −16.08278 | −4.99238 |
| B1 | −10,722.59703 | −17.86059 | −7.16629 |
| B2 | 10,637.22191 | 23.28961 | 8.83981 |
| C2 | −53,722.00064 | −214.56587 | −63.16927 |
| Reduced Chi-Sqr | 4.05233 × 10⁻⁶ | 1.03222 × 10⁻⁶ | 1.20433 × 10⁻⁵ |
| R-Square (COD) | 1 | 1 | 0.99999 |
| Adj. R-Square | 0.99999 | 1 | 0.99998 |
Figure 10.
Graphs of the dependence of the settlement trough area Sst on the soil mass structure at the tunnel face when varying the ratio of the internal friction angle φ values of the mass layers for variable layer thicknesses equal to (a) 0.2D; (b) 0.265D; (c) 0.33D.
Figure 10.
Graphs of the dependence of the settlement trough area Sst on the soil mass structure at the tunnel face when varying the ratio of the internal friction angle φ values of the mass layers for variable layer thicknesses equal to (a) 0.2D; (b) 0.265D; (c) 0.33D.
Table 3.
Analytical relationship of the settlement trough area Sst to the soil mass structure at the tunnel face when varying the ratio of the internal friction angle φ values of the mass layers for variable layer thicknesses and the values of its parameters.
Table 3.
Analytical relationship of the settlement trough area Sst to the soil mass structure at the tunnel face when varying the ratio of the internal friction angle φ values of the mass layers for variable layer thicknesses and the values of its parameters.
| Graph Number | Figure 10a | Figure 10b | Figure 10c |
|---|
| Model | LogNormal2D |
| Equation | |
| z0 | −0.07967 | 0.02523 | 0.02611 |
| B | 0.11719 | 0.01539 | 0.01626 |
| C | 0.01049 | 0.11929 | 0.07 |
| D | 11.33875 | 1.3272 | 1.63407 |
| E | 0.15777 | 0.00745 | 0.00605 |
| F | 0.3774 | 0.38626 | 0.34174 |
| G | 0.45143 | 0.34649 | 0.36464 |
| H | −0.16888 | −0.02131 | −0.01891 |
| Reduced Chi-Sqr | 1.53273 × 10⁻⁶ | 2.61996 × 10⁻⁶ | 3.22168 × 10⁻⁶ |
| R-Square (COD) | 1 | 1 | 0.99999 |
Figure 11.
Graphs of the dependence of the settlement trough area Sst on the soil mass structure at the tunnel face when varying the ratio of cohesion C values of the mass layers for variable layer thicknesses equal to (a) 0.2D; (b) 0.265D; (c) 0.33D.
Figure 11.
Graphs of the dependence of the settlement trough area Sst on the soil mass structure at the tunnel face when varying the ratio of cohesion C values of the mass layers for variable layer thicknesses equal to (a) 0.2D; (b) 0.265D; (c) 0.33D.
Table 4.
Analytical relationship of the settlement trough area Sst to the soil mass structure at the tunnel face when varying the ratio of cohesion C values of the mass layers for variable layer thicknesses and the values of its parameters.
Table 4.
Analytical relationship of the settlement trough area Sst to the soil mass structure at the tunnel face when varying the ratio of cohesion C values of the mass layers for variable layer thicknesses and the values of its parameters.
| Graph Number | Figure 11a | Figure 11b | Figure 11c |
|---|
| Model | Cosine |
| Equation | |
| z0 | −0.01185 | 0.1486 | 0.13606 |
| A1 | −0.00219 | 7.5063 × 10⁻⁴ | 8.62588 × 10⁻⁴ |
| A2 | −4.19 × 10⁻⁴ | −2.15047 × 10⁻⁴ | −1.99231 × 10⁻⁴ |
| B1 | 0.05572 | −0.16811 | −0.15214 |
| B2 | −0.01614 | 0.04767 | 0.0445 |
| C1 | 0.00416 | 0.0012 | 0.00114 |
| Reduced Chi-Sqr | 7.90399 × 10⁻⁷ | 1.0261 × 10⁻⁶ | 1.08889 × 10⁻⁶ |
| R-Square (COD) | 1 | 1 | 1 |
| Adj. R-Square | 1 | 1 | 1 |
Similarly, graphs were constructed and analyzed for the other criteria: Slsz, Bst and Umax.
Each model series constructed—including results from 75 numerical finite-element models—is described by a single analytical relationship with at least 98% accuracy, except for the dependence of
Bst on the tunnel-face soil-mass structure when varying the cohesion ratio C of the layers (
Table 5). Although this particular model series can be represented by three different analytical relationships, each achieving at least 98% accuracy, it lacks a unified form due to the markedly different behavior of the monitored criterion’s values.
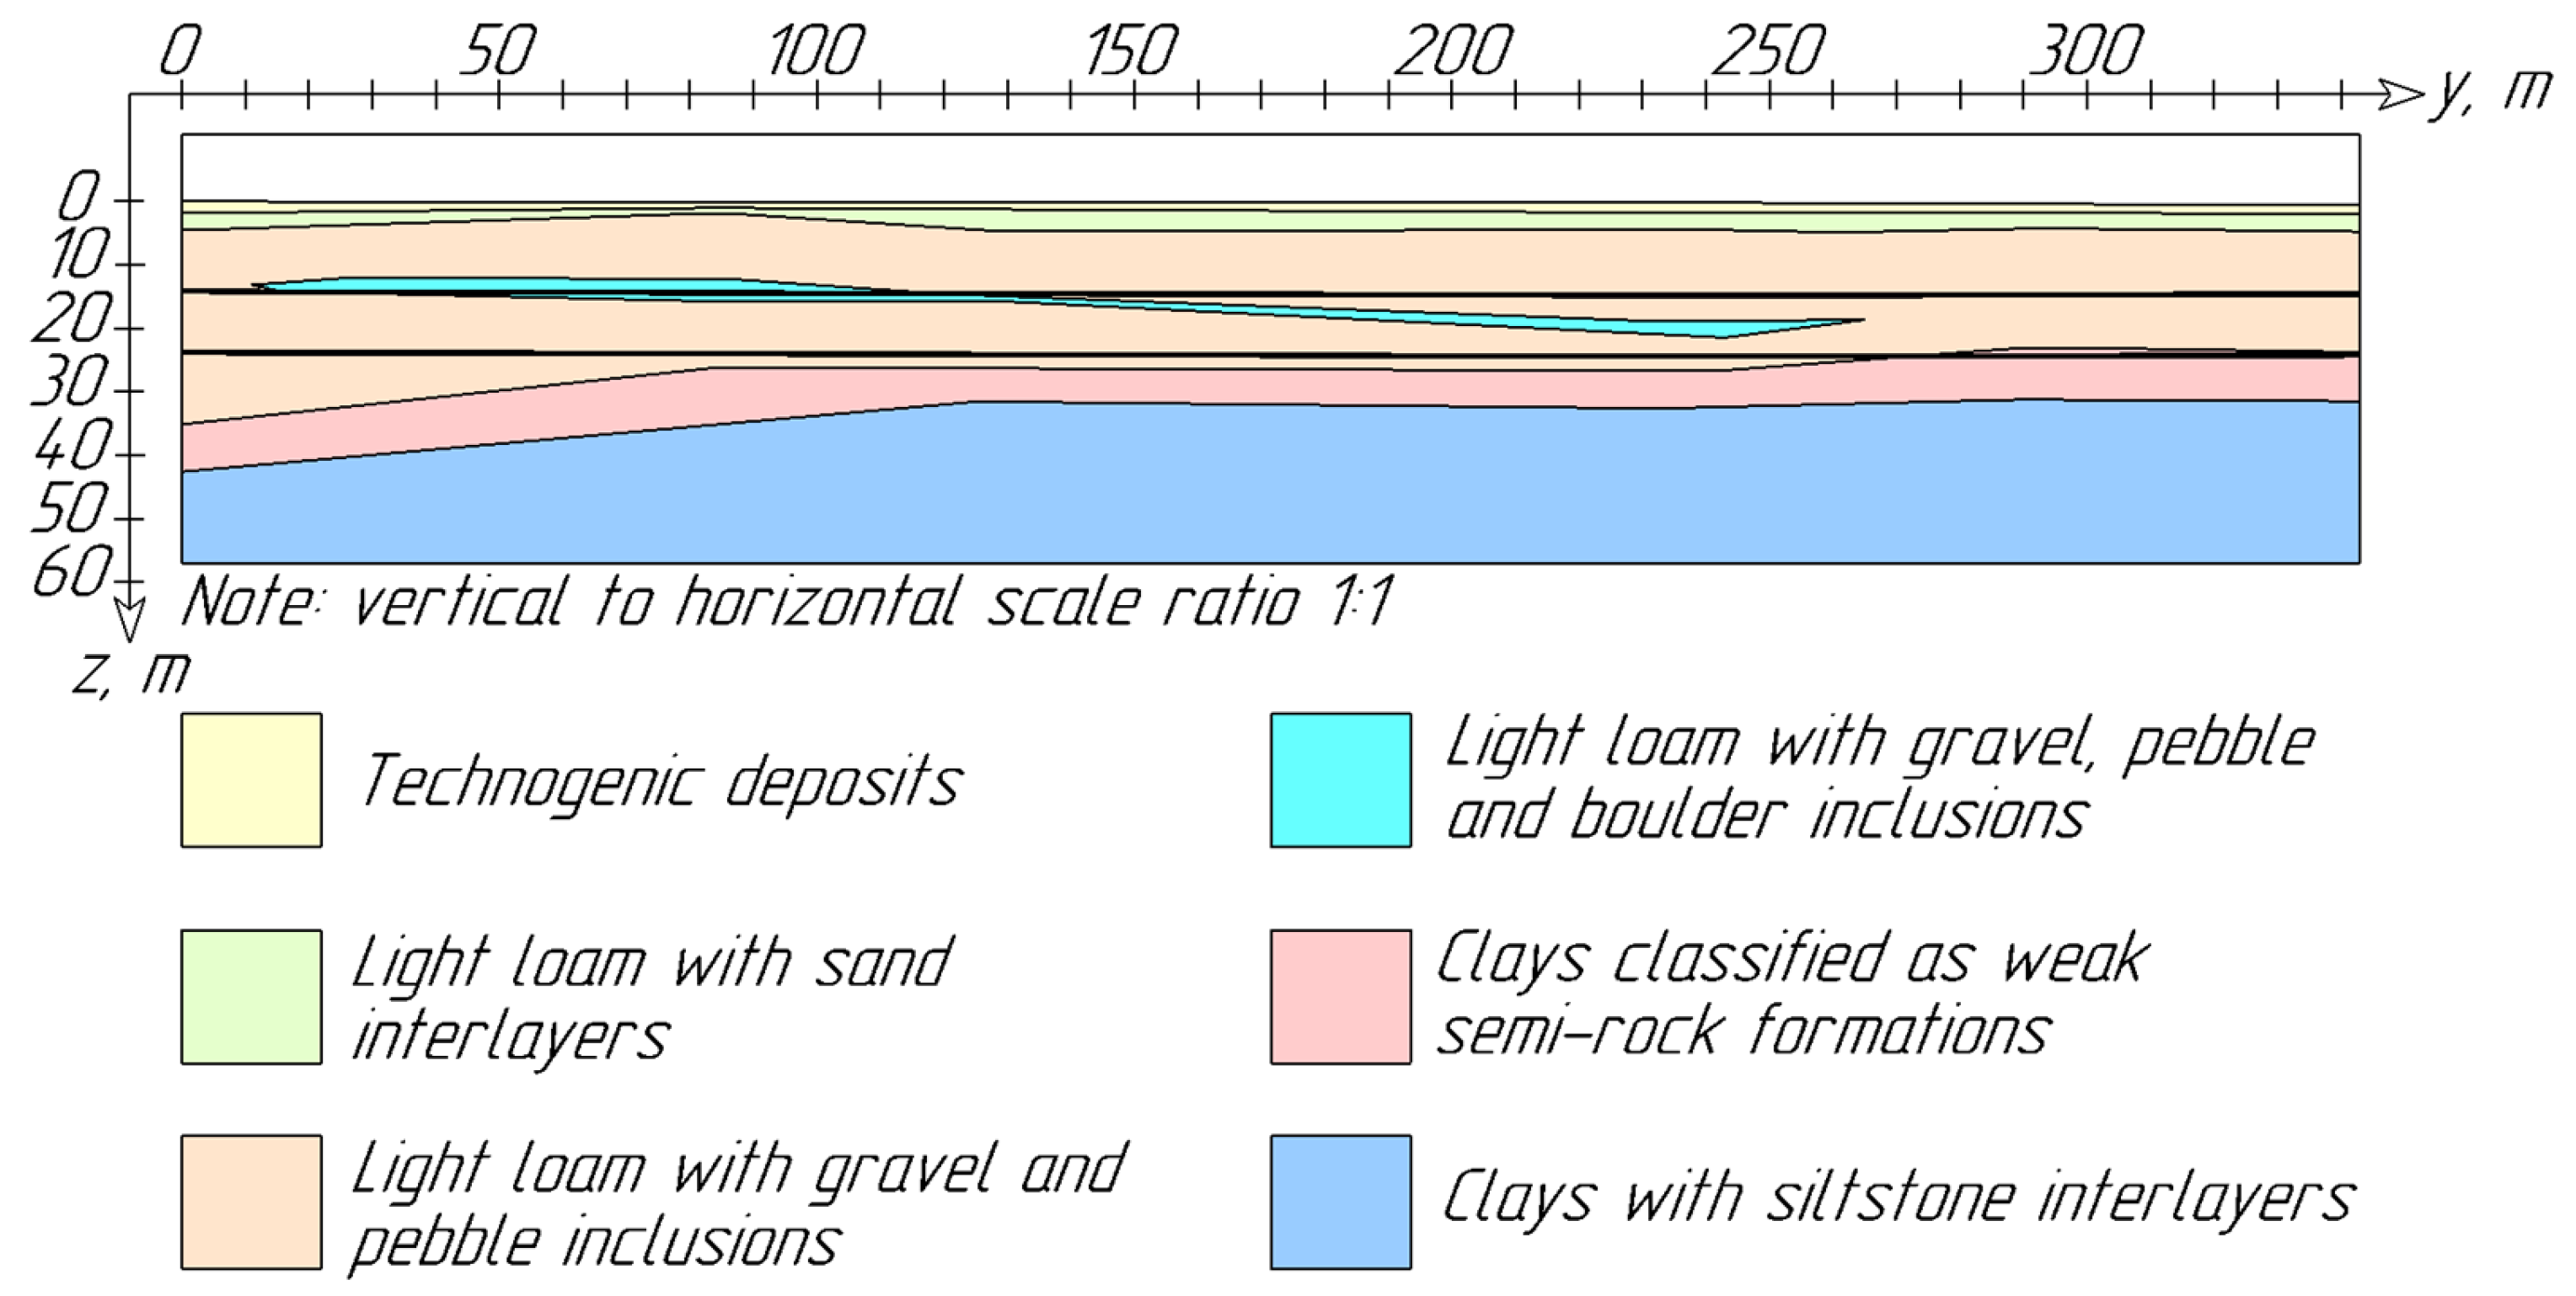
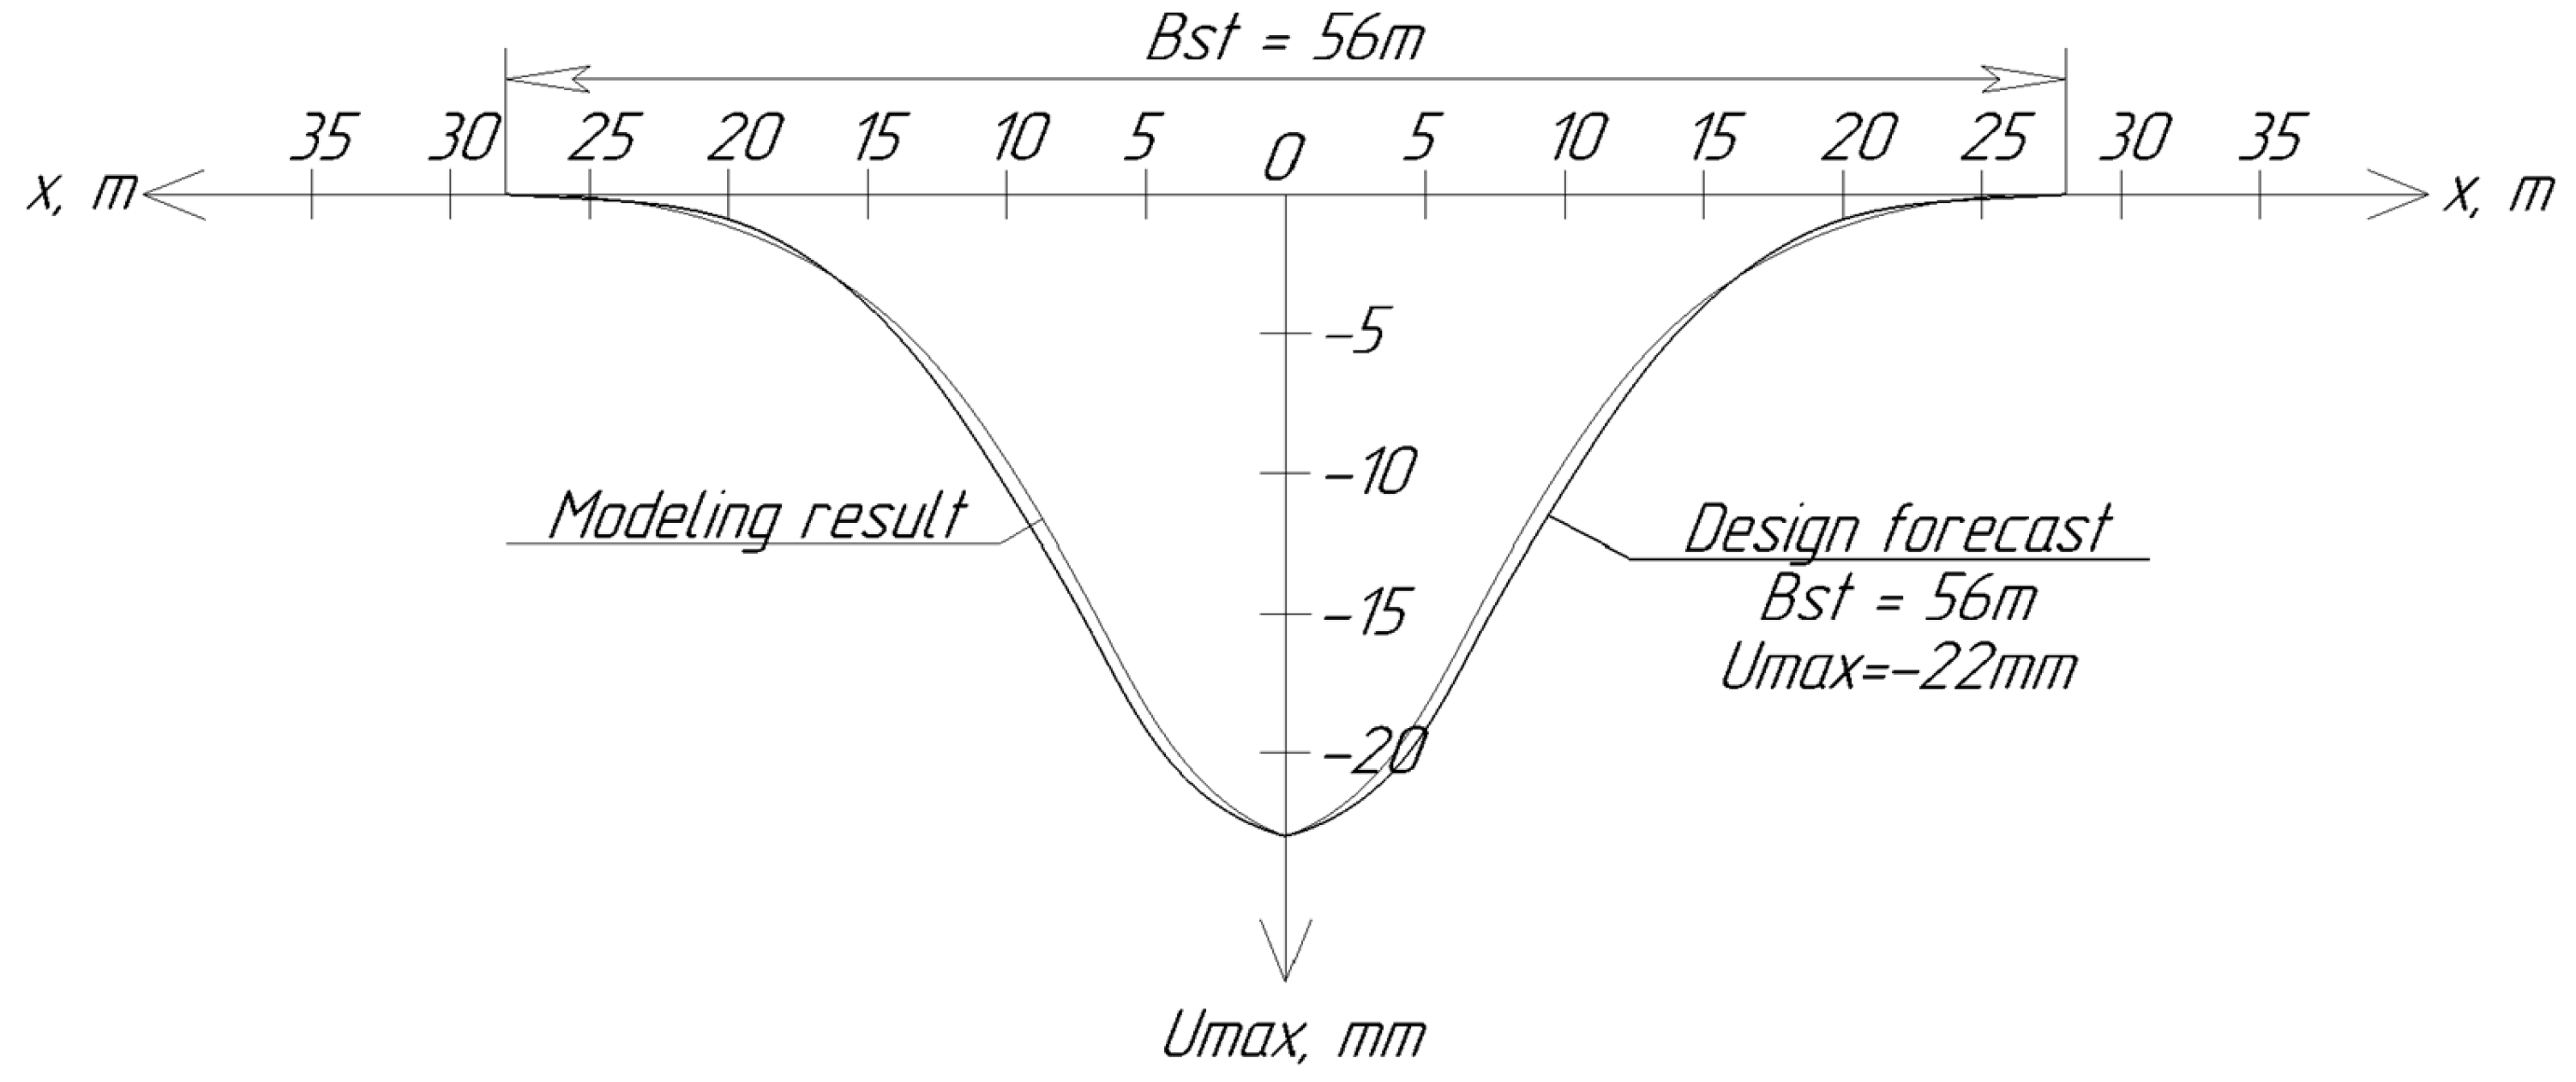
Verification of the investigated results was carried out using monitoring data from the construction of running tunnels of the Saint Petersburg Metro, due to the correspondence of soil property ranges and the presence of cases where a single running tunnel intersects layered soil masses of different structures along the tunnel route (
Figure 12).
Three-dimensional finite element modeling for verification was performed using actual values of the soil stiffness and strength parameters. The transferred values in the verification model lie within the investigated range. The soil behavior model in the verification model was adopted as hardening soil small-strain with parameter values identical to those in the theoretical model. The model geometry is as close as possible to the investigated cases in terms of the position and thickness of the soil layer at the tunnel face. The differences in tunnel depth, tunnel diameter, face support pressure, grouting pressure, and jack pressure do not exceed 5% of the theoretical values. The comparison result for ground surface settlement troughs is shown in
Figure 13.
To assess the agreement between the theoretical results and the actual settlement trough curve, convergence calculations were performed according to the criteria given in
Table 6The verification performed confirms the internal consistency of the developed methodology and the reproducibility of results when modeling actual geological conditions. Full-scale validation, involving comparison with field monitoring data of surface settlements, constitutes a necessary step for confirming the practical applicability of the method and is planned as part of the continuation of this research.
Table 7 presents the maximum ranges of variation in the selected criteria values when varying the parameters of the variable layer.
For the subsequent calculation of the soil mass stability coefficient, a scoring system was developed to assess the influence of the variable layer parameters at the tunnel face on mass stability (
Table 8). To determine the score values, the ranges of criterion values most sensitive to the influence of the variable layer parameters were selected, as highlighted in
Table 7. A stable state of the mass in this study is defined as the state in which the maximum surface settlement does not exceed the permissible limit, which in this case is 24 mm.
If the ratio of soil mechanical characteristics or the thickness and position of the layer at the tunnel face does not coincide with the tabulated values, the score must be calculated using interpolation. The design formula for the soil mass stability coefficient is as follows:
The obtained coefficient can be used in the relationships applied for calculating tunnel face stability, as well as for calculating the face support pressure required to maintain face stability, starting from basic ones such as the following:
where
PF is the required face support pressure at the tunnel face;
PE is the soil pressure;
PW is the hydrostatic water pressure.
4. Discussion
This study has developed a method capable of accurately predicting the influence of tunnel construction—carried out by a shield tunneling complex with active face loading—on the surrounding layered soil mass. The analytical method consists of 15 analytical relationships that describe, with an accuracy of at least 98%, the variation in the selected criteria: the area of the ground surface settlement trough
Sst, area of the zone of negative vertical deformations
Slsz, width of the settlement trough
Bst, and maximum vertical settlement
Umax (
Table 1,
Table 2,
Table 3 and
Table 4). The relationships are derived from the results of 225 three-dimensional numerical finite element models (
Figure 4 and
Figure 5). The resulting relationships characterize how the soil mass structure ahead of the tunnel face affects the deformed state of the layered soil mass under constant construction parameters. To illustrate the application of an analytical relationship, the study presents plots of each criterion versus the face-mass structure (
Figure 9,
Figure 10 and
Figure 11). The results indicate that the greatest influence on a stratified mass (
Sst,
Slsz,
Bst,
Umax) from the tunnel under construction occurs when a layer with mechanical characteristics differing from those of the host mass is present at the tunnel face at a height between the tunnel center and its invert. This study has shown that the thickness of the layer at the tunnel face is one of the most important parameters for predicting the deformed state of the soil mass. The largest differences in the values of all criteria were obtained for the maximum layer thickness among those considered, 0.33D
t (
Table 7). The mass exhibits the highest sensitivity to changes in the deformed state when the stiffness difference between the host and variable layers reaches 22.84% (
Table 7). Although the ratio between the cohesions of the soil layers had the widest range, from 0 to 2, its absolute values corresponded to soils with low cohesion (up to 30 kPa). Based on the results of this study, a practical implementation of the developed analytical method is proposed: a score-based criterion has been introduced to account for the influence of the soil mass structure at the tunnel face on mass stability (
Kv). An option for incorporating this coefficient into existing relationships has been proposed.