Article

FE-Simulation and Experimental Characterisation of Environmental Effects on the Diffusion and Mechanical Performance of Hyperelastic Adhesive Joints

1
Fraunhofer Institute for Manufacturing Technology and Advanced Materials IFAM, 28359 Bremen, Germany
2
Faculty 04: Production Engineering, University of Bremen, 28359 Bremen, Germany
*
Author to whom correspondence should be addressed.
Eng 2023, 4(3), 2122-2140; https://doi.org/10.3390/eng4030121
Submission received: 2 July 2023 / Revised: 1 August 2023 / Accepted: 9 August 2023 / Published: 11 August 2023
(This article belongs to the Special Issue REPER Recent Materials Engineering Performances)

Abstract

:
In operational applications, hyperelastic adhesive joints are exposed to environmental conditions (moisture and temperature) that affect their mechanical performance. The understanding of how the environment can influence the joint durability through both static and cyclic loading is a key aspect to ensure safety and avoid over-dimensioning. The current work presents an investigation of the effect of environment conditions on the diffusion and mechanical performance of two different hyperelastic adhesive joints (a polyurethane and a silicon-modified polymer). To assess the process of moisture mass diffusion, pure adhesive samples were weighted for 387 days when subjected to outdoor weathering conditions. An FEA-diffusion procedure method was demonstrated by (i) predicting the saturation concentration at steady conditions of 40 °C/15% r.h. (40/15) and 40 °C/60% r.h. (40/60), and (ii) predicting the experienced mass change due to outdoor weathering. The reversibility of the effect of conditioning at 40 °C/60% r.h. on the mechanical properties of the adhesives was assessed via quasi-static and fatigue tensile shear testing. The results support the conclusion that conditioning with the surrogate climate of 40 °C/60% r.h. does not cause irreversible damage, as any potential decrease in shear modulus, tensile shear strength and fatigue life due to 40/60 conditioning can be reversed by re-drying at 40/15.

1. Introduction

The polymeric structure of adhesives allows water to diffuse into the adhesive joint [1]. The water (or moisture) can change the physical properties of the adhesive, e.g., stiffness, volume, viscoelasticity and plasticity [2,3], affecting the strength and durability of the joint. However, the process of water diffusion (i.e., moisture transport) can lead to reversible (e.g., plasticisation) or irreversible (e.g., network degradation) mechanical changes as described by Possart and Brede [4].
The irreversible chemical degradation through reactions break up the polymeric network. These reactions often require oxygen, which can also diffuse into the polymer. Sometimes chlorine is also involved, which can come from salty environments or the chemical process of adhesive production. Additives that react with the radicals produced by these processes can reduce chemical degradation. The chemical degradation is not reversible [5]. On the other hand, some plasticisation (or swelling) effects are thermally reversible, i.e., properties returning to pre-diffusion state, upon re-drying.
Several studies have shown that accelerated ageing at elevated temperatures and humidities can provide information about the environmental resistance of different adhesive systems, but does not readily correlate with ageing under natural conditions [6,7].
Taking into account the requirements from the various fields of application, the demonstration (or validation) of resistance against environmental conditions must typically be provided for a temperature/humidity range of −55 °C or −40 °C to 50 °C or 70 °C with 60% to 85% relative humidity (r.h.). For instance, the DIN 6701-3 [8] lists the test conditions of −35 °C, +23 °C/50% r.h. and +70 °C/85% r.h. However, these climatic conditions are not representative of the operational stress found for adhesive joints. Experiments show that the described approach often works but is not sufficient in every case and in most cases leads to over dimensioning or even to the joints failing prematurely [9].
Moreover, Wulf et al. [9] have shown by FEA-simulation on a typical adhesive joint for a panel bonding that a conditioning period of approx. 1000 h at a climate condition of 40 °C/60 r.H. (referenced as 40/60) produces a stationary moisture state, which is similar to that established in operation (for a mid-European weather climate) inside the adhesive joint over time (after 1–2 years of operation). The conditions of 40/60 were defined as a surrogate climate for accelerated ageing. However, the substitute climate of 40/60 has not been yet verified via direct experimental measurements.
The state of the art in the dimensioning of bonded joints under the influence of moisture is summarised in [10]. In this work, water diffusion takes place into the adhesive and into the interface between the adhesive and the substrate. The degradation of the interface and the consideration of moisture in the static and dynamic stress design are modelled with the cohesive zone approach and a continuum mechanical approach. Diffusion models for moisture diffusion in adhesives are described, e.g., in [5,11,12]. It is possible to see that the change in mechanical properties due to water penetration occurs in only a few hours. Therefore, the possible slow degradation of the polymer must be distinguished from the probably reversible rapid change of the mechanical properties due to water penetration.
In this context, to properly understand (and predict) the durability of hyperelastic adhesive joint it is necessary to carry out the following processes: (i) develop a proper water diffusion model, which is capable of predicting the long-term water content within the adhesive layer, and (ii) assess whether the water diffusion leads to reversible (or irreversible) changes in the mechanical behaviour of the joint.
The current work presents an investigation of the effect of environment conditions on the diffusion and mechanical performance of two different hyperelastic adhesives (a polyurethane and a silicon-modified polymer). To assess the process of moisture mass diffusion, pure adhesive samples were weighted for 387 days when subjected to outdoor weathering conditions and compared to diffusion analysis FE-model able to predict the experienced mass change. A second focus of investigation was the determination of the reversibility of ageing at 40 °C/60% r.h, by comparing the mechanical performance of adhesively bonded joints in terms of static shear strength, shear modulus and fatigue strength between (a) samples after 40/60 ageing without re-drying, (b) samples after 40/60 ageing followed by re-drying, and (c) samples at RT (23 °C/50% r.h) without ageing.

2. Materials and Methods

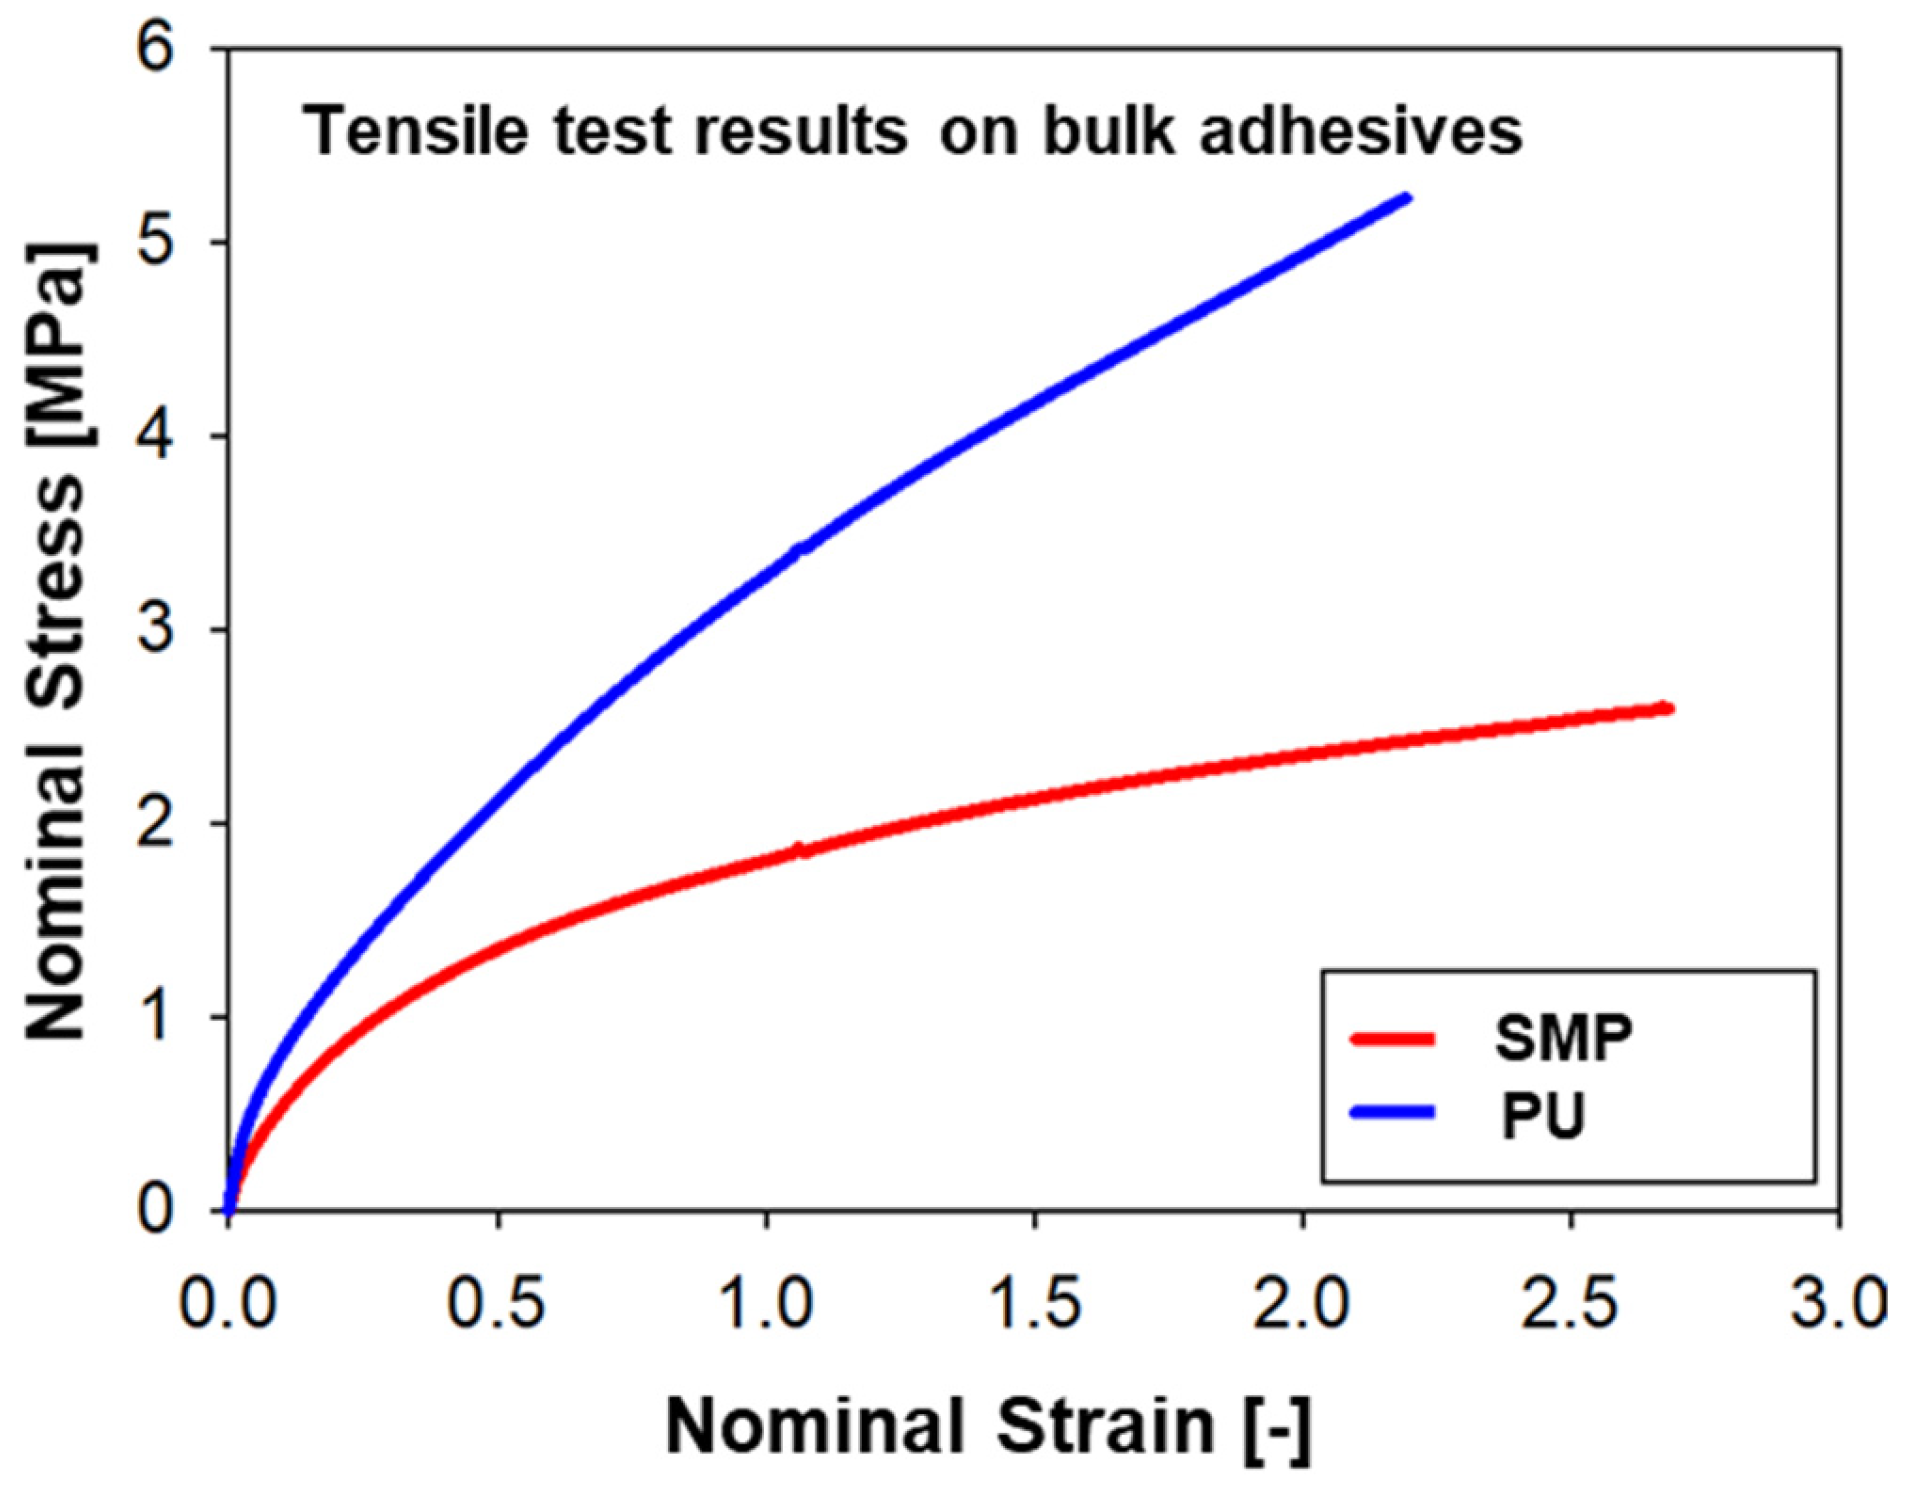
2.1. Adhesives and Substrates

Two types of moisture-curing hyperelastic adhesive systems are frequently used in rail vehicle construction [13]:
  • Polyurethane adhesives (PUs);
  • Silane modified polymers (SMPs).
The polyurethanes consist of isocyanate-terminated polymers [14]. This cure takes place when the adhesive is exposed to the water particles present in the environment. During the reaction, some of the isocyanate groups are converted into amino groups with the release of CO2, which react with the remaining isocyanates to form urea. The one-component SMPs consist of silane-terminated polyether that are blocked by a cross-linker [15]. Curing takes place under the influence of water from the environment via poly-condensation. In the process, an alcohol is split off from the cross-linker. After curing, both adhesive systems are elastomers with rubber-like behaviour [16].
In the present work, the first system is a polyurethane adhesive, which is described in its data sheet as a solvent-free one-component adhesive. For processing and to speed up the curing process up, a second cartridge with a booster component is screwed onto the main component cartridge. To simplify the designation, this adhesive is referred to as PU–adhesive.
The second adhesive is a one-component SMP–adhesive with curing at RT (room temperature). A representative stress–strain curve of each adhesive can be found in Figure 1. The PU–adhesive is stiffer and has a higher tensile strength, while the SMP–adhesive has a greater deformation at break. Both adhesives exhibit strong non-linearity typical of hyperelastic materials [17].

2.2. Adhesive Joints

The adhesively bonded joints were made using aluminium substrates, which are used extensively in rail vehicle construction. The substrates were made of the aluminium alloy EN AW 6082. This alloy is listed in DVS 1608 “Design and strength evaluation of welded structures made of aluminium alloys” [18]. The mechanical characteristic values of the joined parts made of aluminium (according to the supplier) are listed in Table 1.
An epoxy primer coating for metals was applied to the substrates prior to bonding. The primer can be recognised by the pink colour of the substrates (instead of the metal grey typical for aluminium).

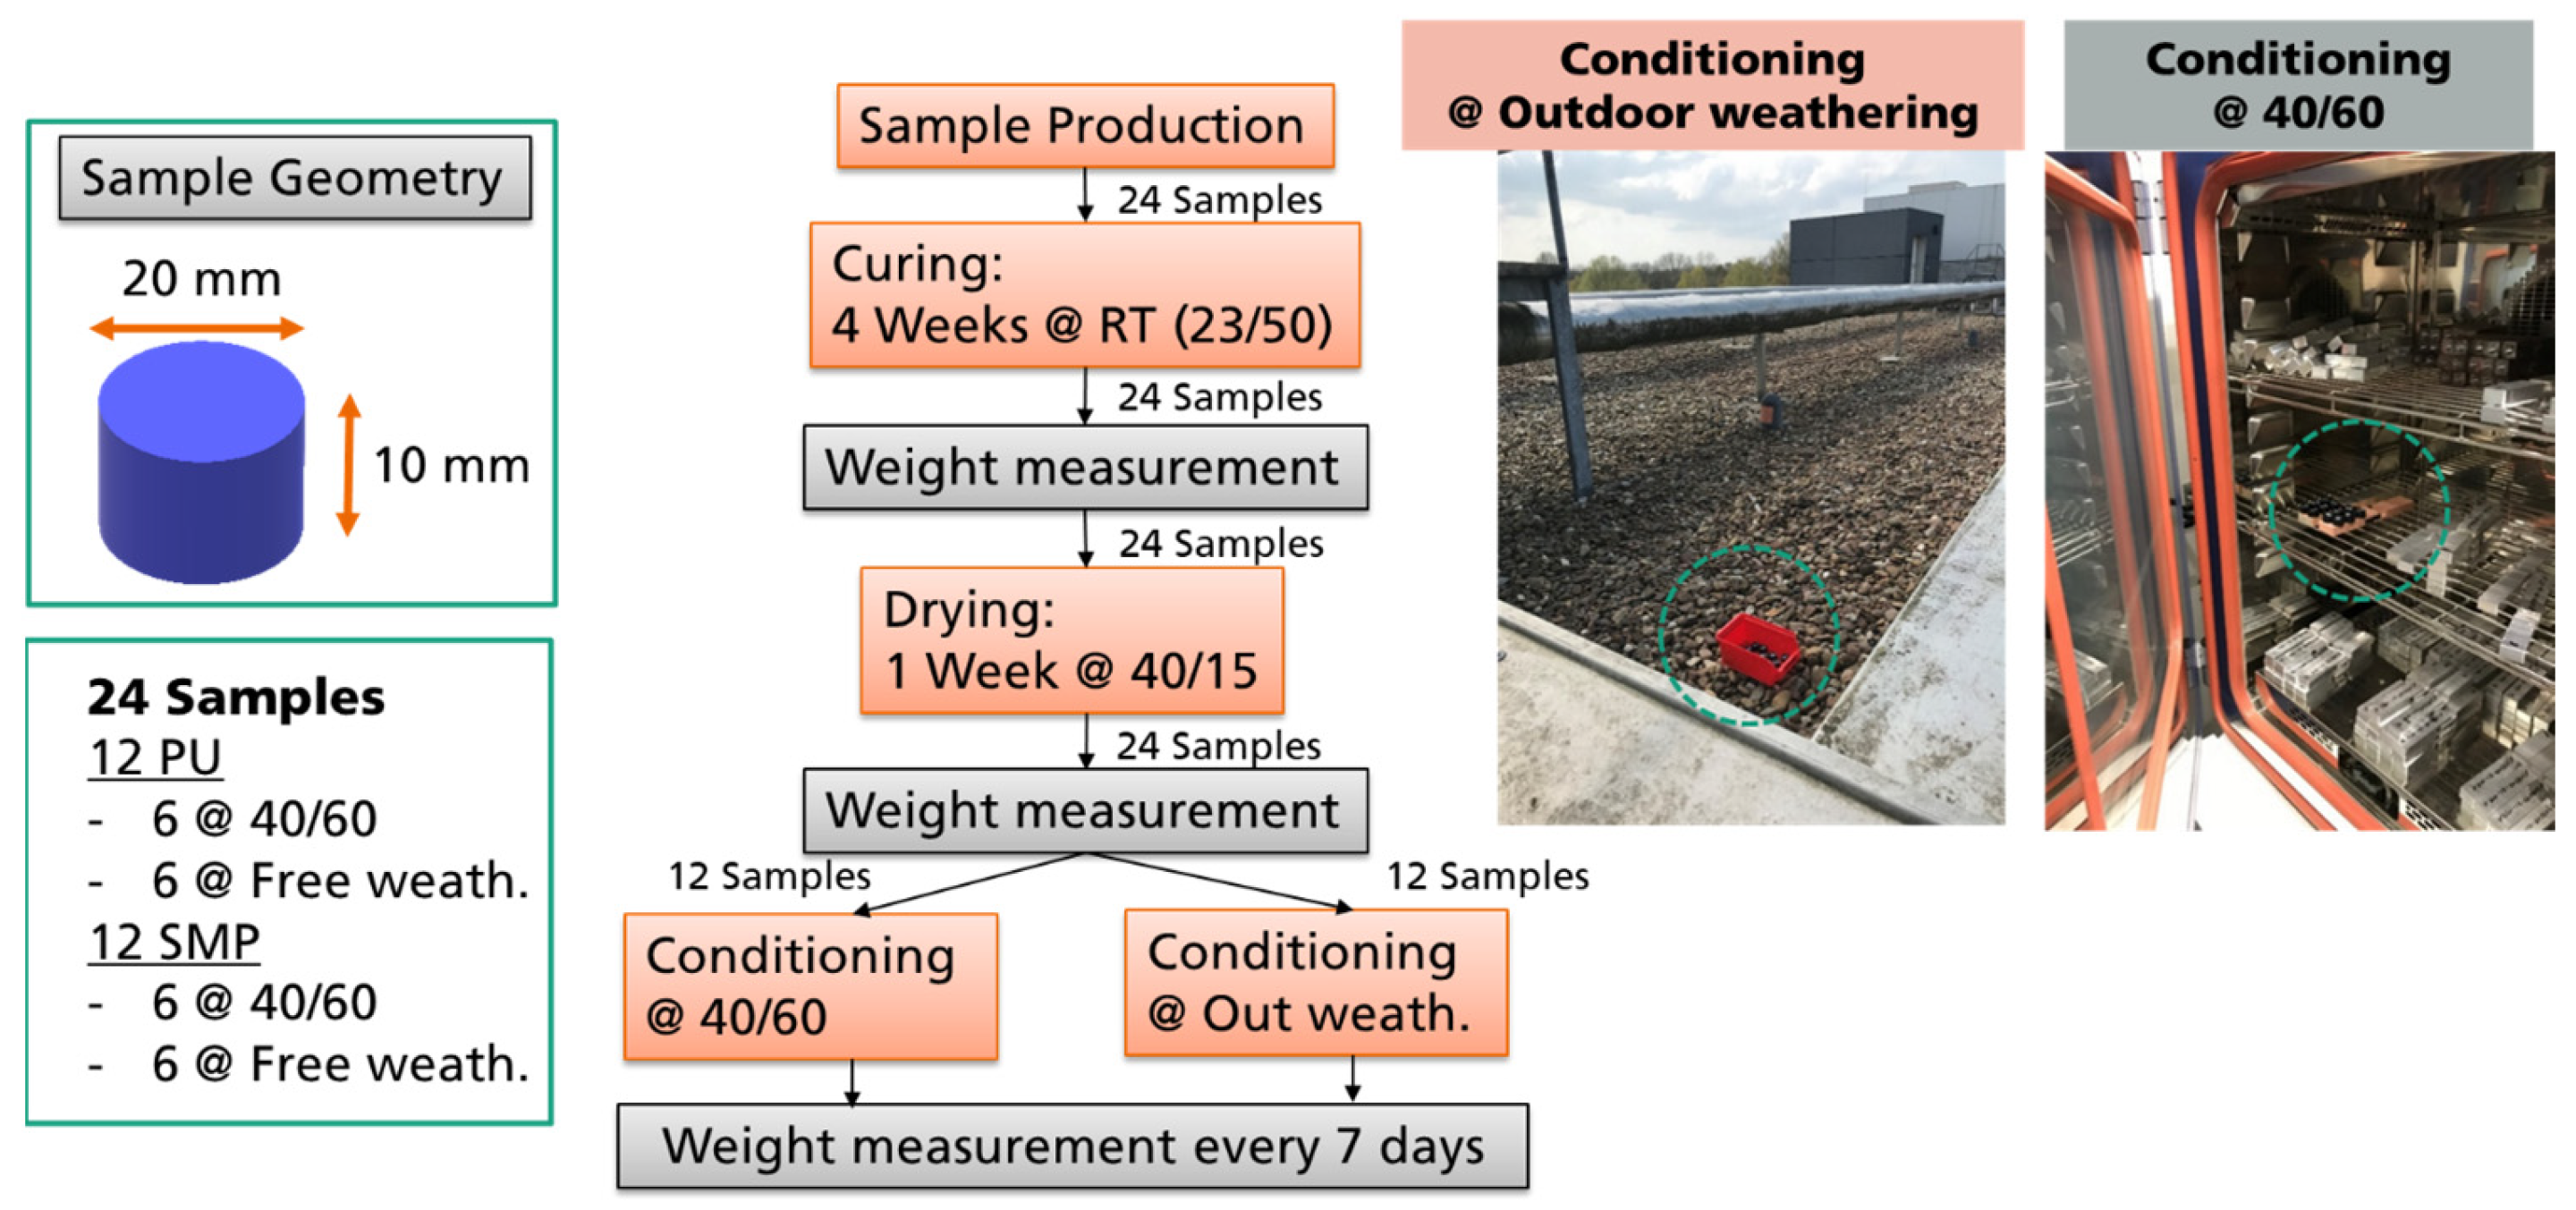
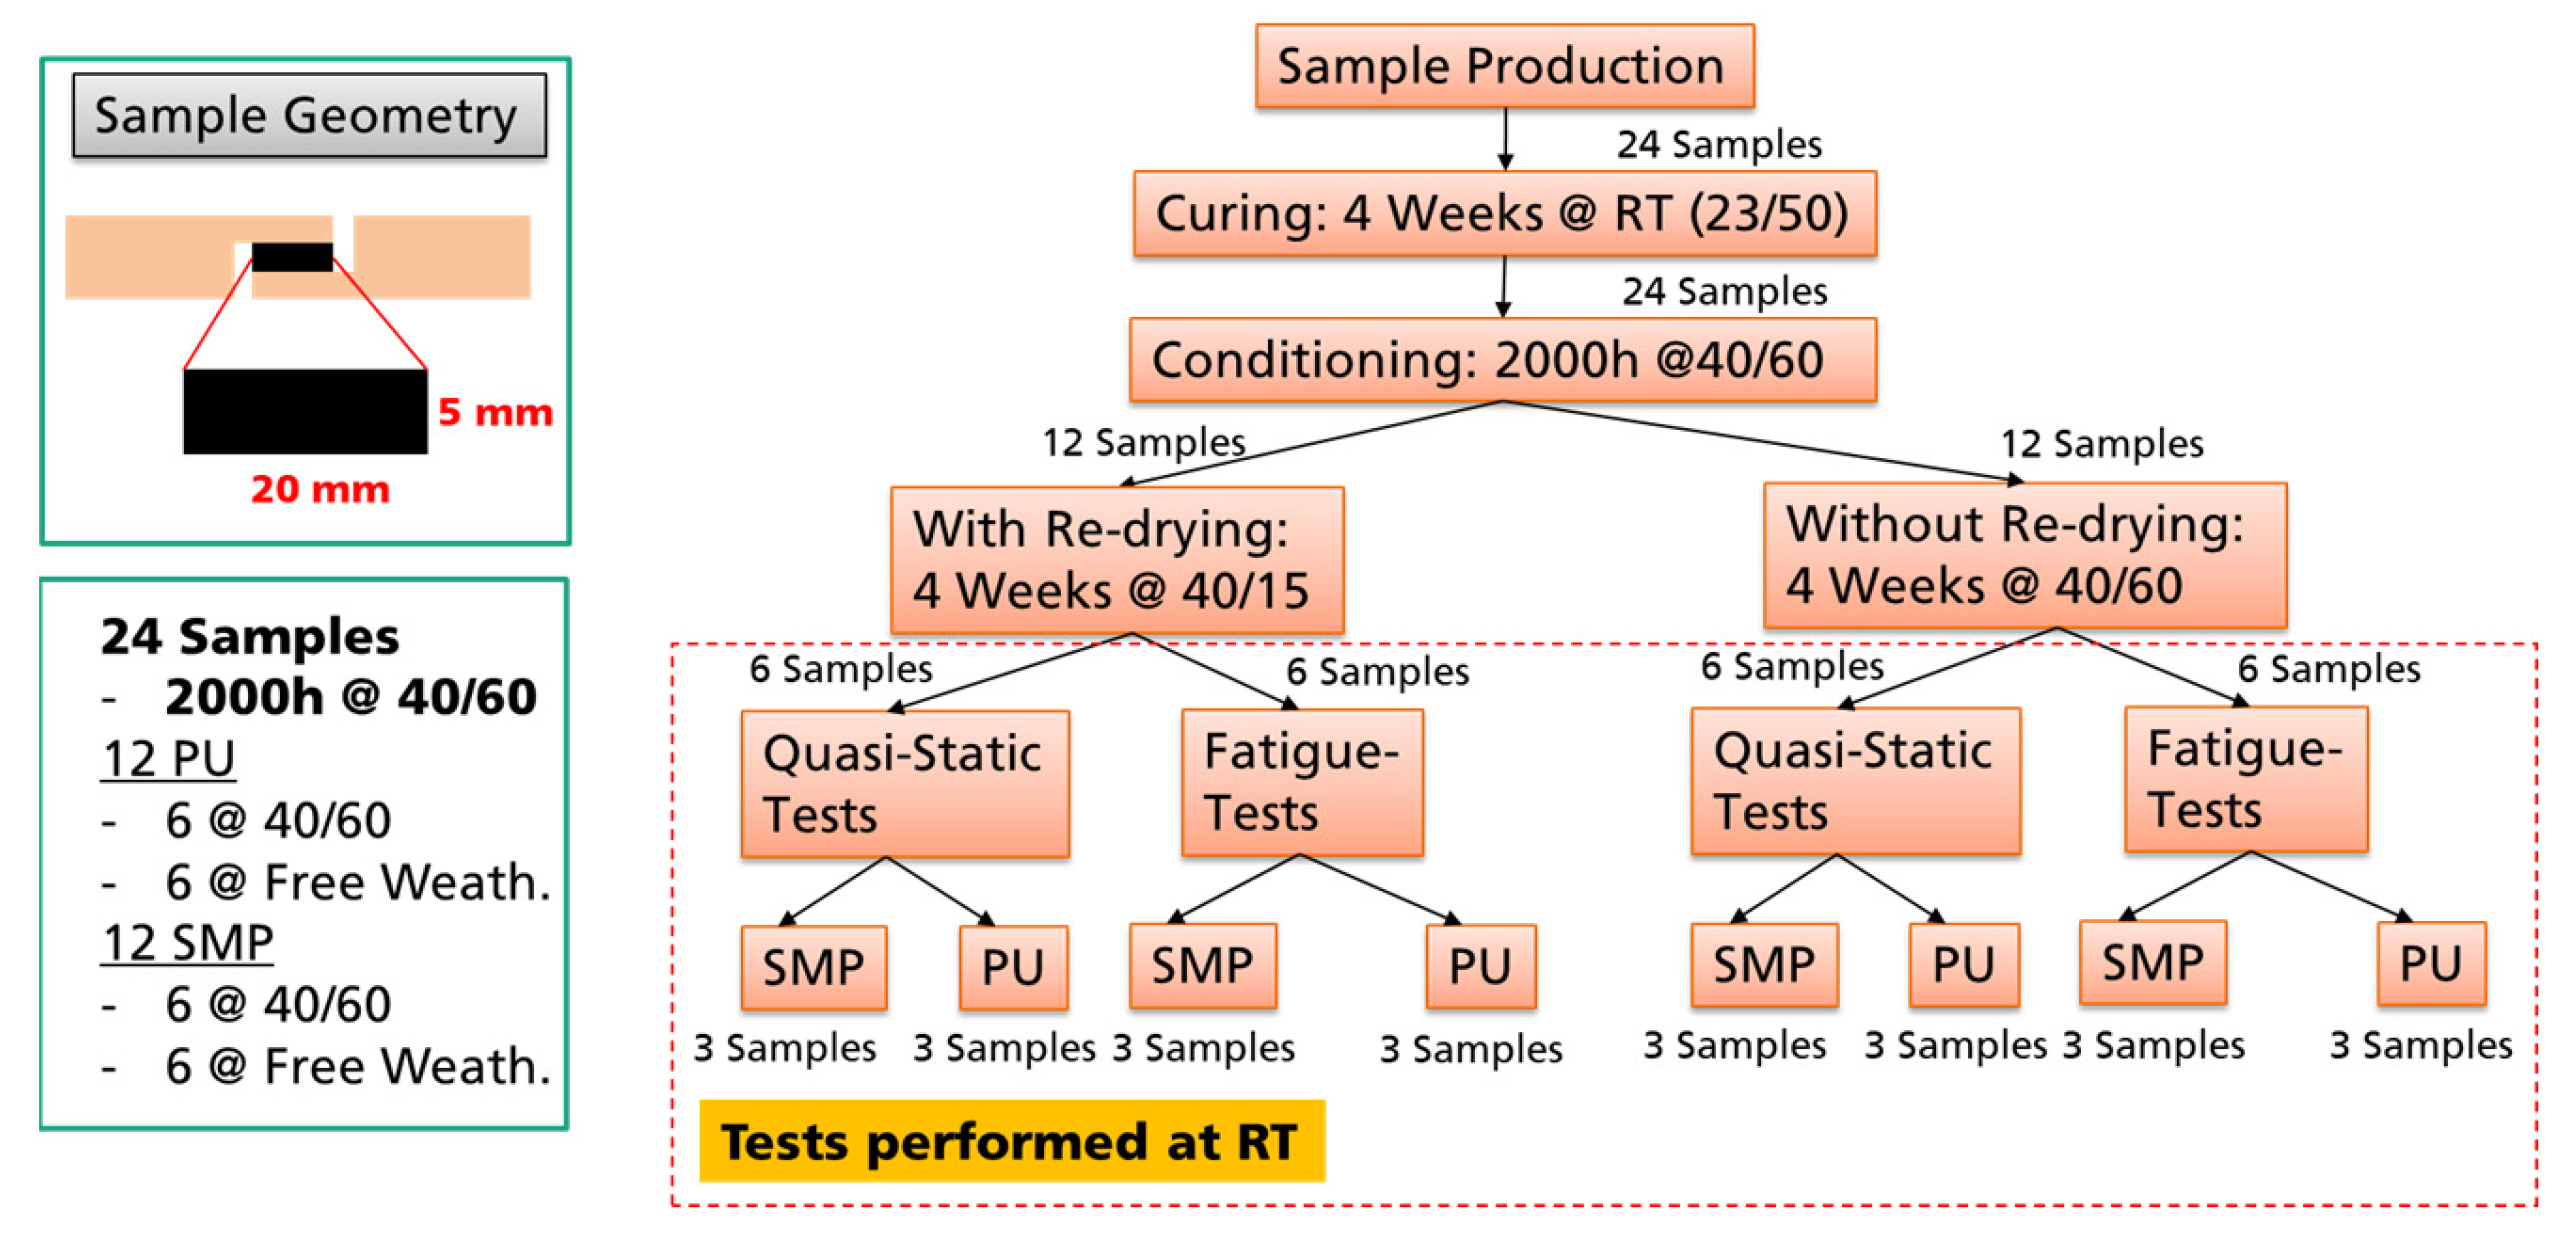
2.3. Sample Manufacturing

Two main types of samples were produced as part of the work: (a) bulk samples consisting of pure adhesive, and (b) thick adherend shear test (TAST) joints of aluminium bonded with an adhesive (either PU/SMP). For the pure adhesive samples, the adhesive was applied between two sheets. The sheets were covered with non-stick films to prevent the adhesive from sticking together. Then, a spacer of the desired thickness was placed between the plates. A weight was placed over the sheet to push out to the adhesive and provide the desired thickness. Finally, after the appropriate curing time, the cured adhesive plates were cut into the final geometry of the sample using a punch press.
As for the adhesive joints, the geometry of the substrates determined the desired adhesive layer thickness, and the bonding process was carried out as follows: (i) cleaning of the bonding surface with isopropanol; (ii) application of bonding primer to improve adhesion; (iii) flash-off time for the primer; (iv) adhesive application on each substrate; (v) joining and fixing of substrates; (vi) curing at RT (2 weeks for the PU–adhesive and 4 weeks for the SMP–adhesive).

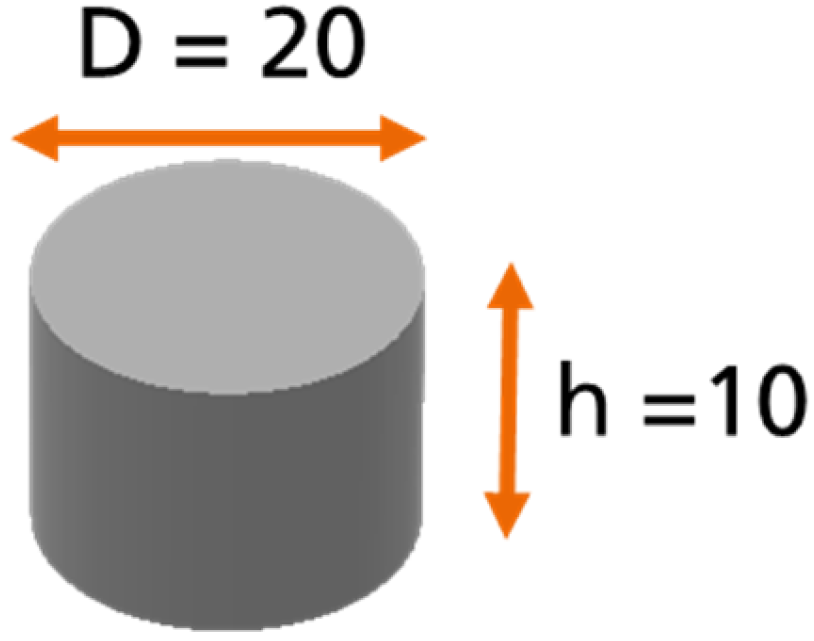
2.4. Geometry of Samples

2.4.1. Pure Adhesive Geometry-Coin Sample

In order to investigate the moisture absorption and desorption phenomena, a “coin sample” was used for the weight measurements (see Figure 2): a cylindrical sample of pure adhesive with a diameter of 20 mm and a height of 10 mm according to the DIN 6701-3 [8]. The idea behind the use of this sample was to allow the diffusion process to take place in all sides of the sample.

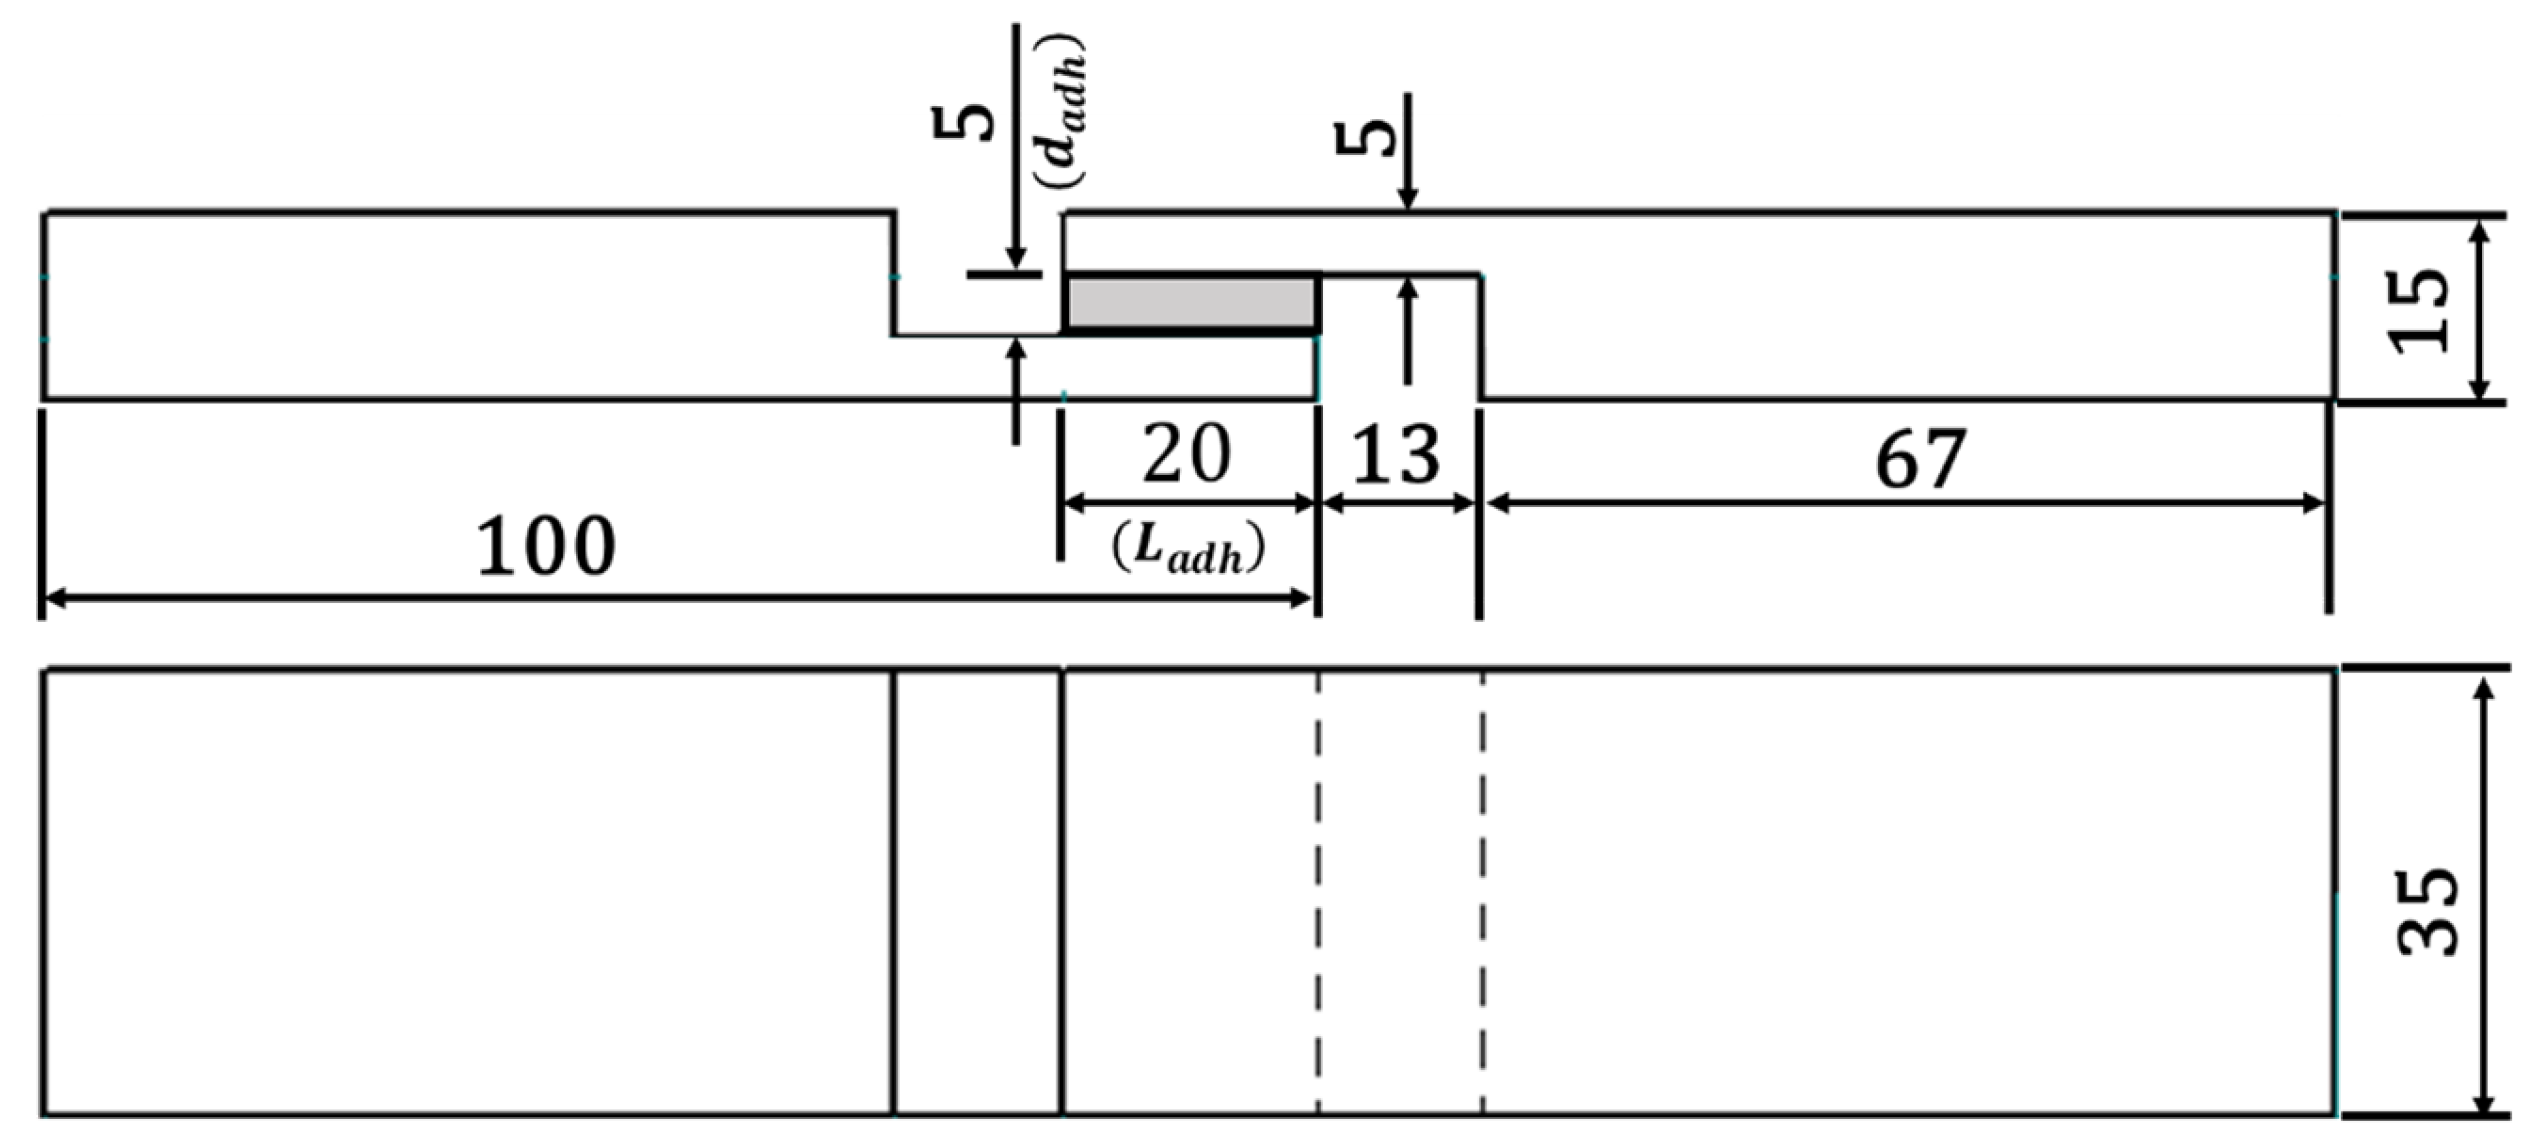
2.4.2. Adhesively Bonded Joint Geometry—TAST Sample

For the analysis of the mechanical properties, the TAST joint geometry was applied. This joint is relevant, as it is mentioned on the DIN 6701-3 [8] with regard to guidelines for the construction design and verification of adhesive bonds for the railway construction. Under loading, the failure of TAST samples starts from the overlap and ends at the interface edges with the substrate. This behaviour is due the border effect (concentration points) leading the adhesive layer to suffer higher peak of stresses in the edges. Regarding the diffusion process, in the presence of the substrates, the process of absorption and desorption of moisture [19] does not take place at the regions in contact with the substrates. In Figure 3, the dimensions of TAST joints in [mm] can be found. A nominal adhesive layer thickness ( d a d h ) of 5 mm (thick adhesive bonding) was employed in this investigation.

2.5. Diffusion Experiments

In order to perform the diffusion experiments, 24 coin samples were used in total, 12 of each adhesive. After curing, the weight of each sample was measured. Afterwards, the samples were post-dried at 40 °C/15% r.h. for 1 week and weighted again. The purpose of this step was to ensure that the weight measurements were based on a moisture condition as equal as possible. At this point, the samples were then separated. One half was stored at 40 °C/60% r.h. in a climate chamber, and the other half was left on an external roof (the red box in Figure 4) under outdoor weathering exposure to the climate (e.g., rain, snow, sun). The box had holes so that the samples would not “float” in the water. In both conditioning setups (at climate chamber or at outdoor weathering), the samples were weighed weekly on a scale with 4 decimal places (0.1 mg). The procedure for evaluating water diffusion (and the corresponding change in weight) is shown in Figure 4. A green circle was added to the figure to represent were the samples were located (either at outdoor weathering or in the climate chamber).
The climate data (air temperature in [°C], relative humidity in [%]) of every minute were collected from a weather station setup near the location of the samples during outdoor weathering. This data collection is important because one of the objectives of the study is to validate the water diffusion simulation, which requires the input of climatic data for the determination of saturation conditions.

2.6. Mechanical Characterisation of Environmental Effects

The procedure for investigating the environmental effects on the mechanical properties is described in Figure 5. The TAST samples of both adhesives (PU and SMP) were used as a representative bonded joint.
There were 24 TAST samples in total, 12 from each adhesive. The samples were prepared, cured at RT for 4 weeks and then stored in a climatic chamber at 40 °C/60% r.h for 2000 h (conditioning). These 2000 h served to ensure saturation of the moisture in the adhesive layer. Then, half of the samples (12 in total) was dried at 40 °C/15% r.h. for 4 weeks, while the other half was stored at 40 °C/60% r.h. Finally, the samples were tested at RT under static and fatigue loading. The idea was to compare the mechanical properties of the samples: (i) after 40/60 conditioning with 40/15 re-drying, (ii) after 40/60 conditioning without 40/15 re-drying, and (iii) without conditioning (storage at RT).
The static shear test on the TAST samples was carried out in accordance with the DIN 6701-3 [8] in a servo-hydraulic machine Zwick 50 kN with a constant shear strain of 0.1 1/s, which, for a nominal adhesive layer thickness of 5 mm, leads to a testing speed of 30 mm/min. The initial gauge length ( L 0 ) was 32 mm. The displacement was measured using an optical displacement transducer. The nominal shear strain ( γ n o m Z S , Equation (1)) is calculated by dividing the displacement ( s ) by the adhesive layer thickness ( d a d h e s ). The nominal shear stress ( τ n o m Z S ) is obtained by the force ( F ) divided by the bonding surface ( A ), which is the overlap length ( L a d h ) multiplied by the width ( b ).
γ n o m Z S = s d a d h e s
τ n o m Z S = F A = F L a d h × b
Fatigue tests were carried out in a servo-hydraulic machine with 3 repetitions for each condition. A sinusoidal loading with a stress ratio R = 0.1 (tensile–tensile loading) and a frequency of 7 Hz was used.

3. Finite Element Analysis—Diffusion and Weight

3.1. Implementation

The FE simulations of the diffusion were carried out using the Abaqus/CAE 2019 software [20]. Both samples used for the diffusion investigations, the coin sample and TAST sample, were modelled as 3D solid models (DC3D8 elements). Only the adhesive material was considered in the simulations, i.e., for the TAST sample, the aluminium substrates were ignored. The diffusion surfaces are also included in Figure 6.
The analysis was carried out as a mass diffusion procedure (in Abaqus “Step: Mass diffusion”) considering a transient behaviour (“Response: Transient”) according to Fick’s law [21]. The diffusion constants of water in both adhesives were determined by Wulf et al. [9] as shown in Table 2. These constants were measured at 23 °C and at 40 °C on pure adhesive substance samples with 4 cm2 of surface. The dynamic vapour sorption (DVS) method was used [22,23]. DVS is a gravimetric method that measures the rate and amount of sorption [24] of a solvent through a given thickness. The thickness of the samples was measured at nine different positions using a micrometre screw and the mean value of the individual measurements was determined. The measurements were taken at relative humidity of 40, 50, 60, 70, 80 and 90%.
Two types of conditioning were investigated: (i) 40 °C/60% r.h., and (ii) outdoor weathering. The temperature at which diffusion occurs was included as a predefined field. The saturation concentration was included as a boundary condition in the form of mass concentration. The saturation concentration is defined as the maximum amount of a solute (in this case, the mass of moisture, i.e., water) dissolved in a solid (i.e., the adhesive). Wulf et al. [9] determined the saturation concentration in Figure 7 for the temperatures of 23 °C and 40 °C and the relative humidities of 40, 50, 60, 70 and 80%. The saturation concentration for non-measured values of temperature and relative humidity were interpolated or extrapolated from Figure 7.
The FE simulation was then created in such a way that the total time of diffusion was simulated in hours, i.e., a diffusion of one week had a temporal duration of 168 h (7 × 24 h), which does not correspond to the total simulation time.
As an output, the FE simulation provides the volume ( V I P , in Abaqus: IVOL) and the amount of solutes ( C I P , ISOL) for each integration point [20]. Based on these outputs, the average concentration ( C ¯ ) for the entire adhesive can be calculated as follows:
C ¯ = i V i I P × C i I P i V i I P
where i is each integration point to be summed for the whole adhesive.
During outdoor weathering, it was not possible to directly measure the water concentration in the adhesive. The only property related to diffusion that could be measured directly was the sample weight. This assumes that the sample weight varies due to moisture loss (or gain) via diffusion. For this reason, it was important to be able to convert the simulation results (saturation concentration) into mass values (i.e., sample weight). This was carried out following the work of Bonilla Mora et al. [25], who provided a script to calculate the weight change due to mass diffusion of moisture.
The calculation of the mass change via diffusion ( m d in %) for a given time ( t ) is based on the use of the water density ρ w ( T ) in [g/cm3] for a given temperature T (from the hourly average measurements of the weather station), the density of each adhesive ( ρ A d h e s i v e in [g/cm3 ]) and the average concentration C ¯ ( t ) from the FE-simulations:
m d t = C ¯ ( t ) ρ w ( T ) ρ A d h e s i v e ( c o n s t . )
The density of the water varied with the temperature at which diffusion takes place, while the density of the adhesive was assumed to be constant with ρ P U = 1.2 g/cm3 and ρ S M P = 1.4 g/cm3. The mass change could be calculated for each time of diffusion. To calculate the weight of each sample, it was necessary to know the initial weight ( m 0 ) of the sample. Here, the weight of the sample for outdoor weathering after conditioning for one week at 40 °C/15% r.h. was taken as the initial weight with m 0 , P U = 3.6594 g and m 0 , S M P   = 4.4560 g.

3.2. Simulation Parameters of Conditioning in the Climatic Chamber

The simulation of mass diffusion of moisture for conditioning at 40 °C/60% r.h. was carried out in the same order as in the experiment, i.e., 4 weeks (672 h) at 23 °C/50% r.h. + 1 week (168 h) at 40 °C/15% r.h. + 4 weeks (672 h) at 40 °C/60% r.h. The resulting average saturation concentration of the coin sample for each adhesive under the previous mentioned conditioning is presented in Figure 8.
Based on the FE simulation of the diffusion of the conditioning under controlled (climatic chamber) conditions, one can determine the saturation concentration in the steady state for both adhesives. This amount (Table 3) should be independent of the sample geometry, as only the time for reaching the steady state has to be waited for. These values are important because the comparison between outdoor weathering and conditioning at 40 °C/60% r.h is based on the saturation concentration.

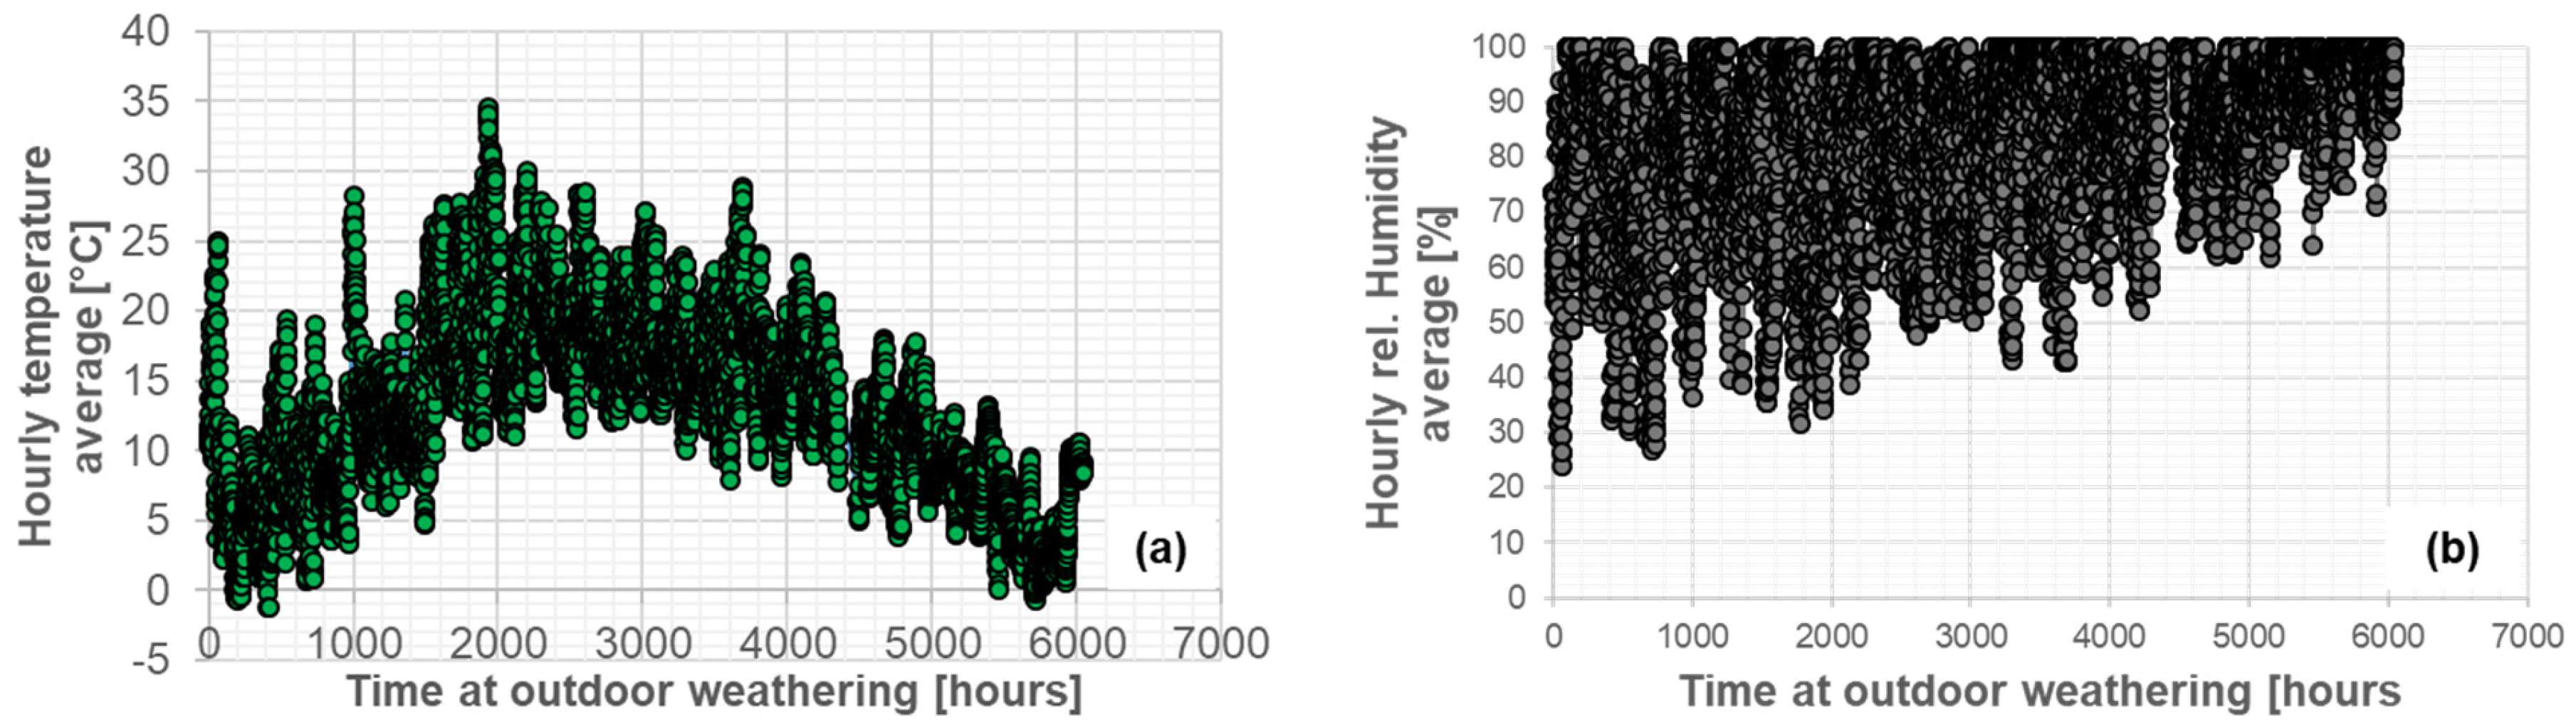
3.3. Simulation Parameters of Conditioning under Outdoor Weathering

The first step in performing the FE simulations of diffusion under outdoor weathering was to average the data from the weather station. The resulting hourly averages are shown in Figure 9: (a) air temperature and (b) relative humidity. Based on these values, the saturation concentration for each adhesive could be calculated.
The saturation concentration in Figure 10, (a) PU−adhesive and (b) SMP−adhesive, and the air temperature were used as input data for the FE simulation. For this purpose, the saturation concentration values from Figure 7 were inter/extrapolated based on the air temperature and relative humidity. As with the experimental measurements, outdoor weathering conditioning was carried out after conditioning in a climate chamber: 4 weeks at 23 °C/50% r.h. + 1 week at 40 °C/15% r.h., which was reflected in the FE calculation.

4. Diffusion Results

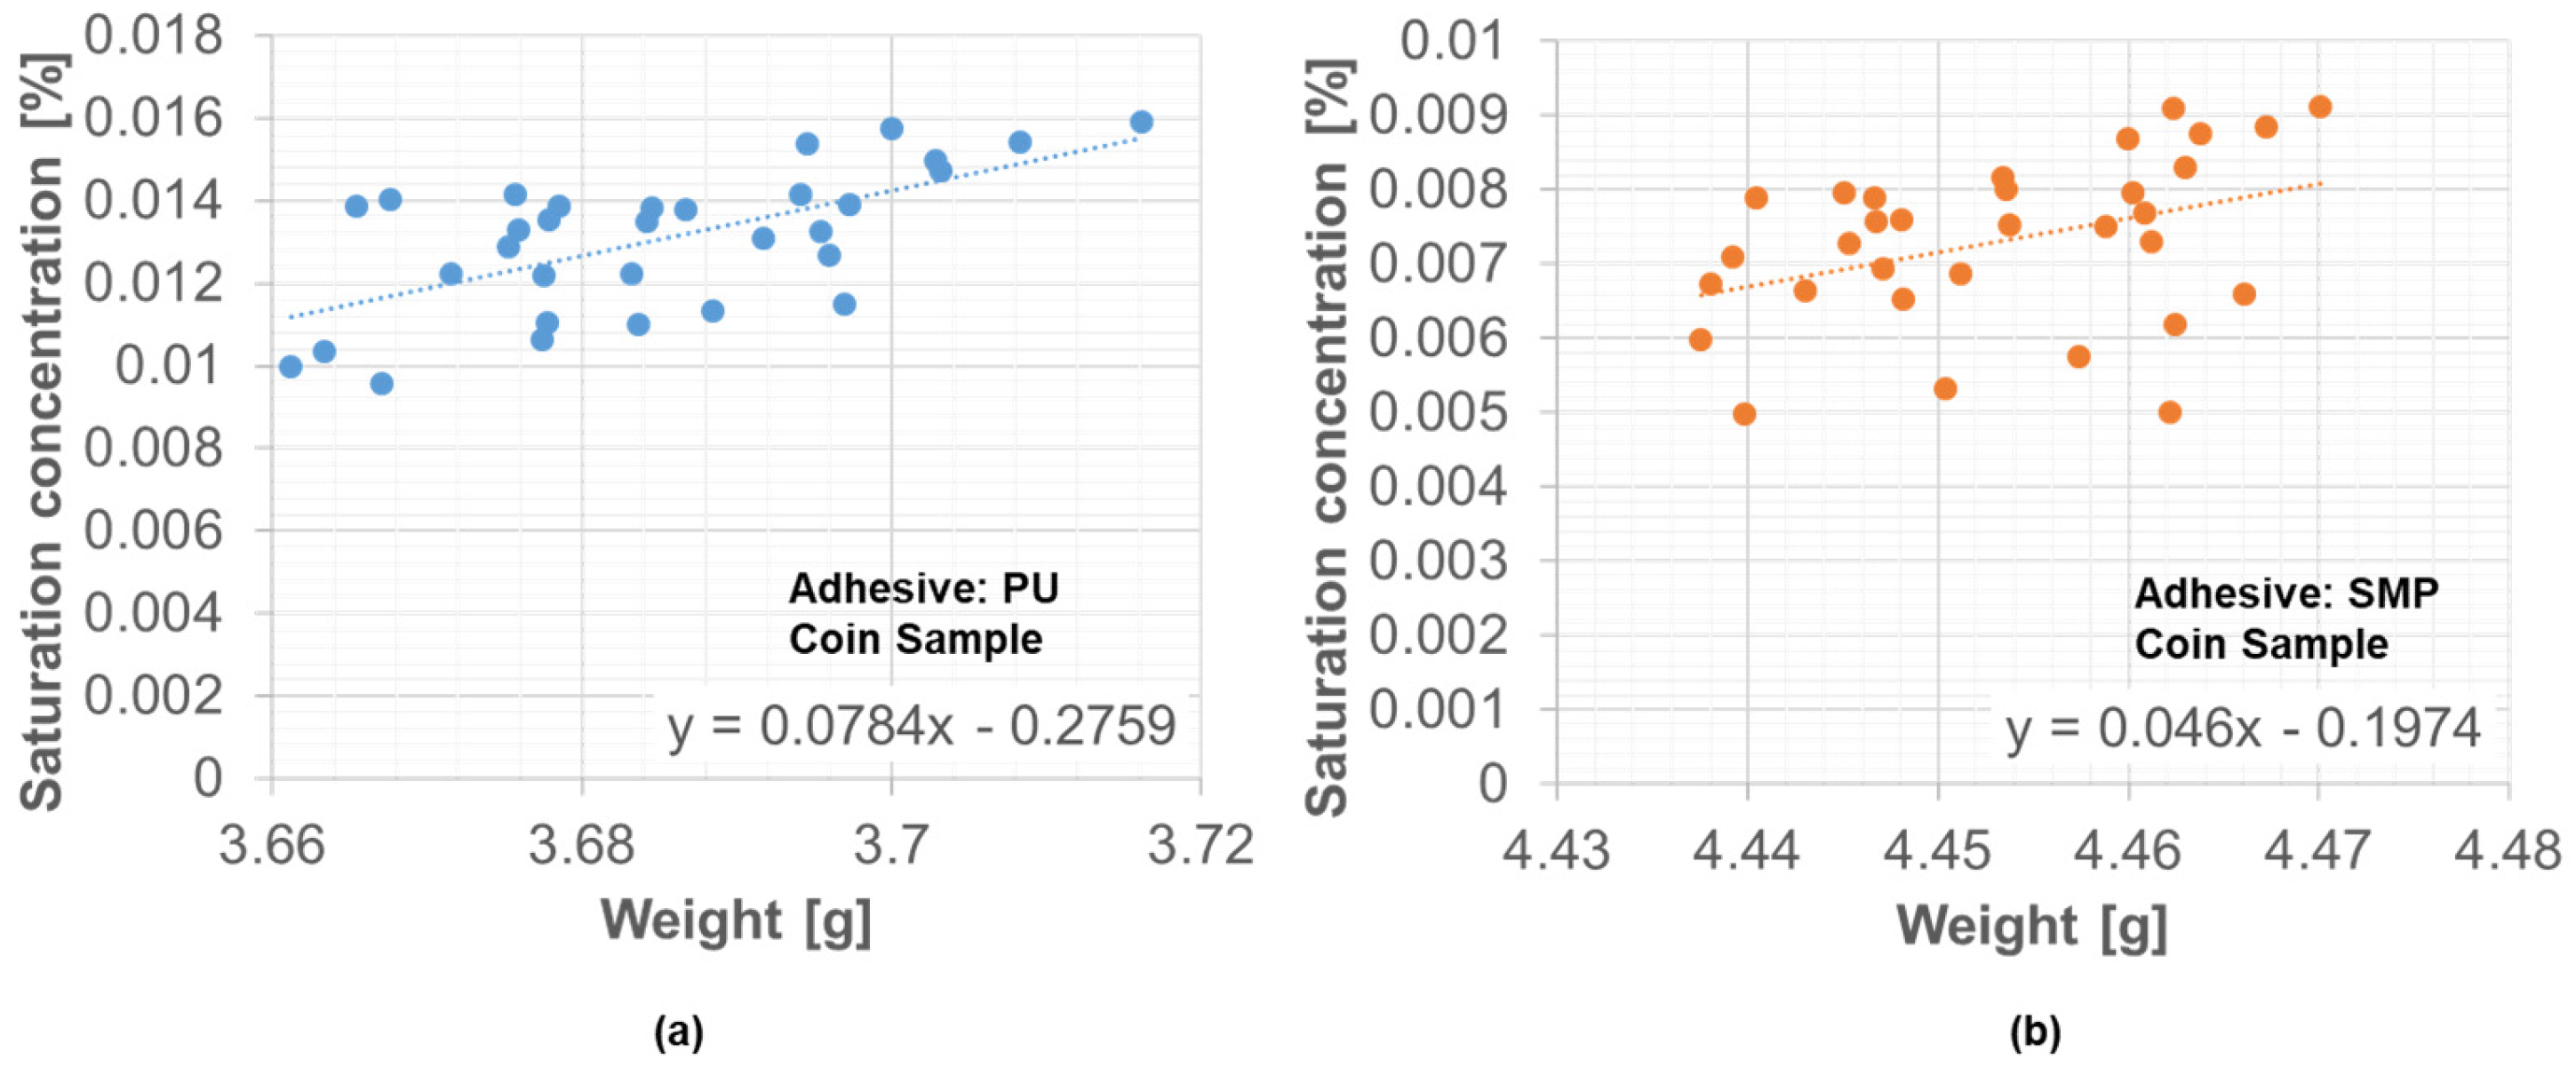
4.1. Weight Measurements

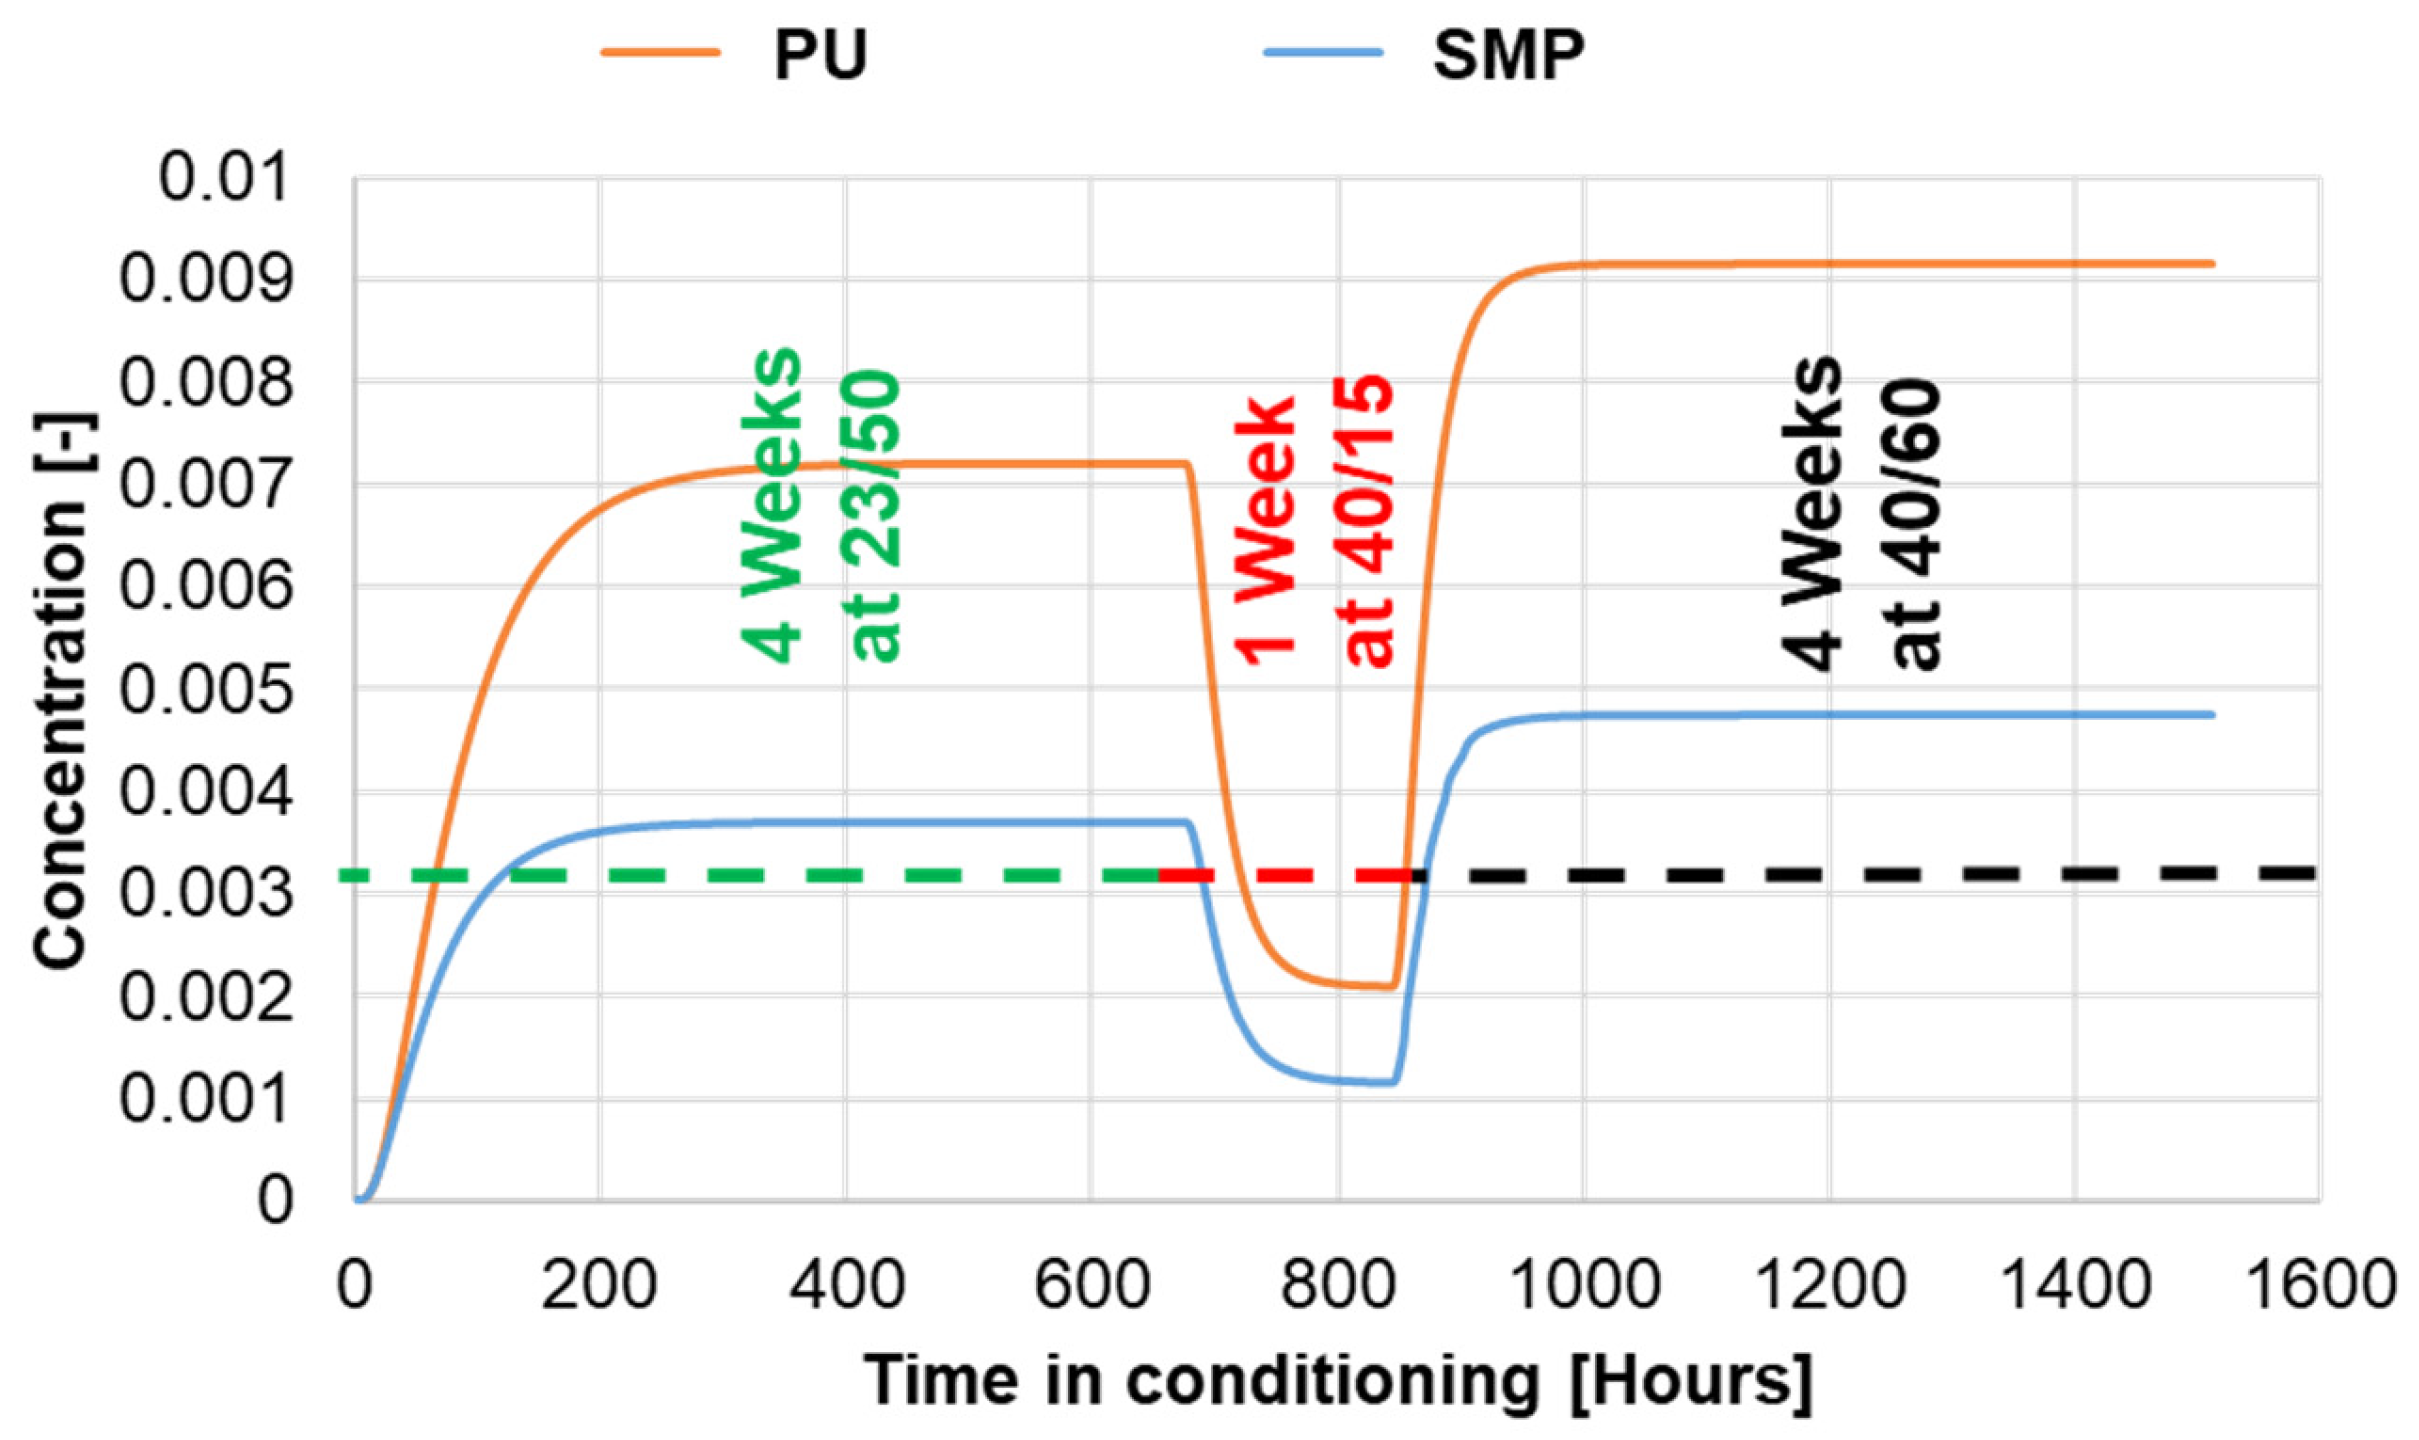
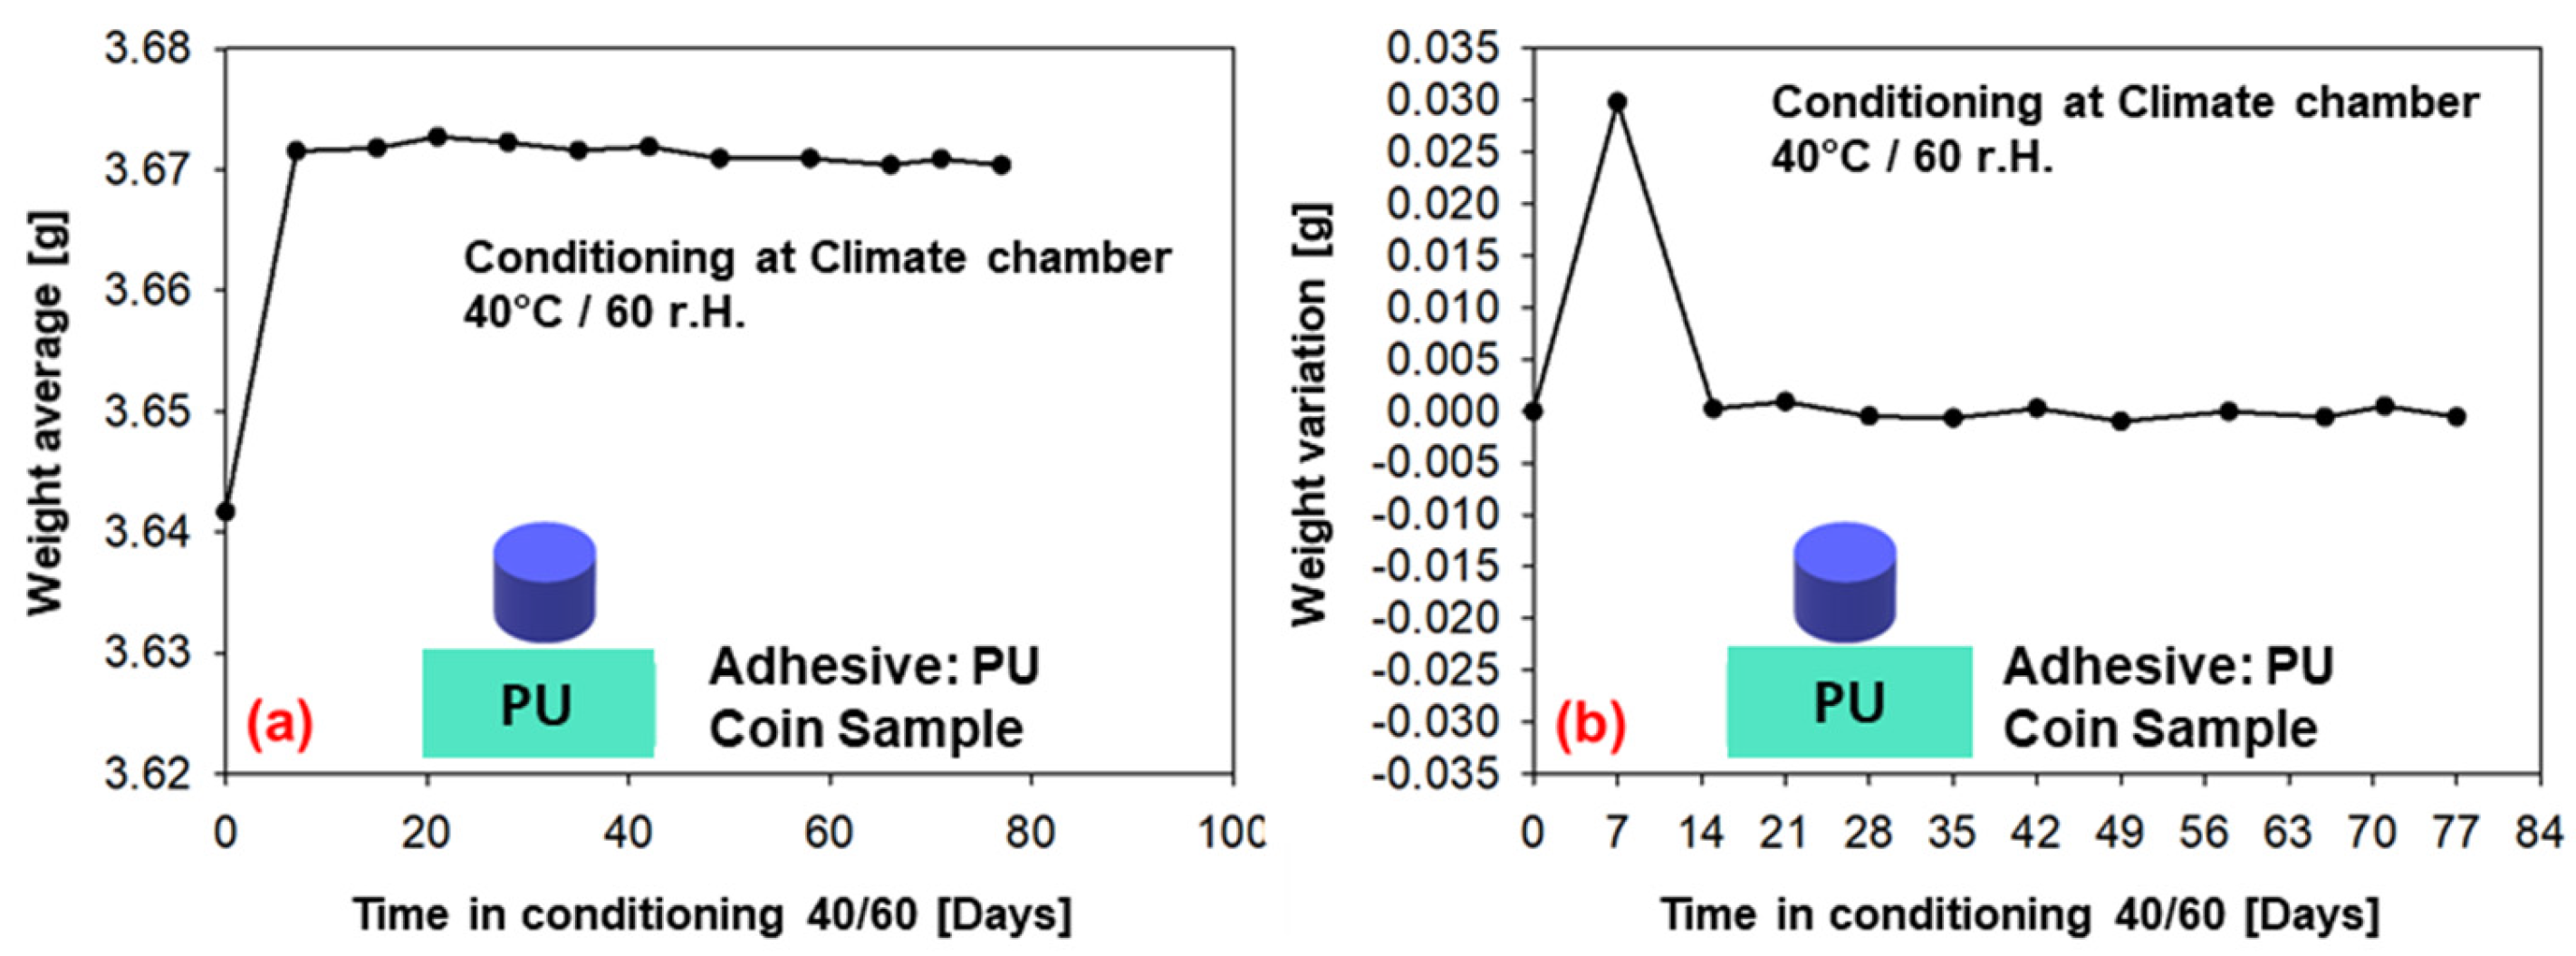
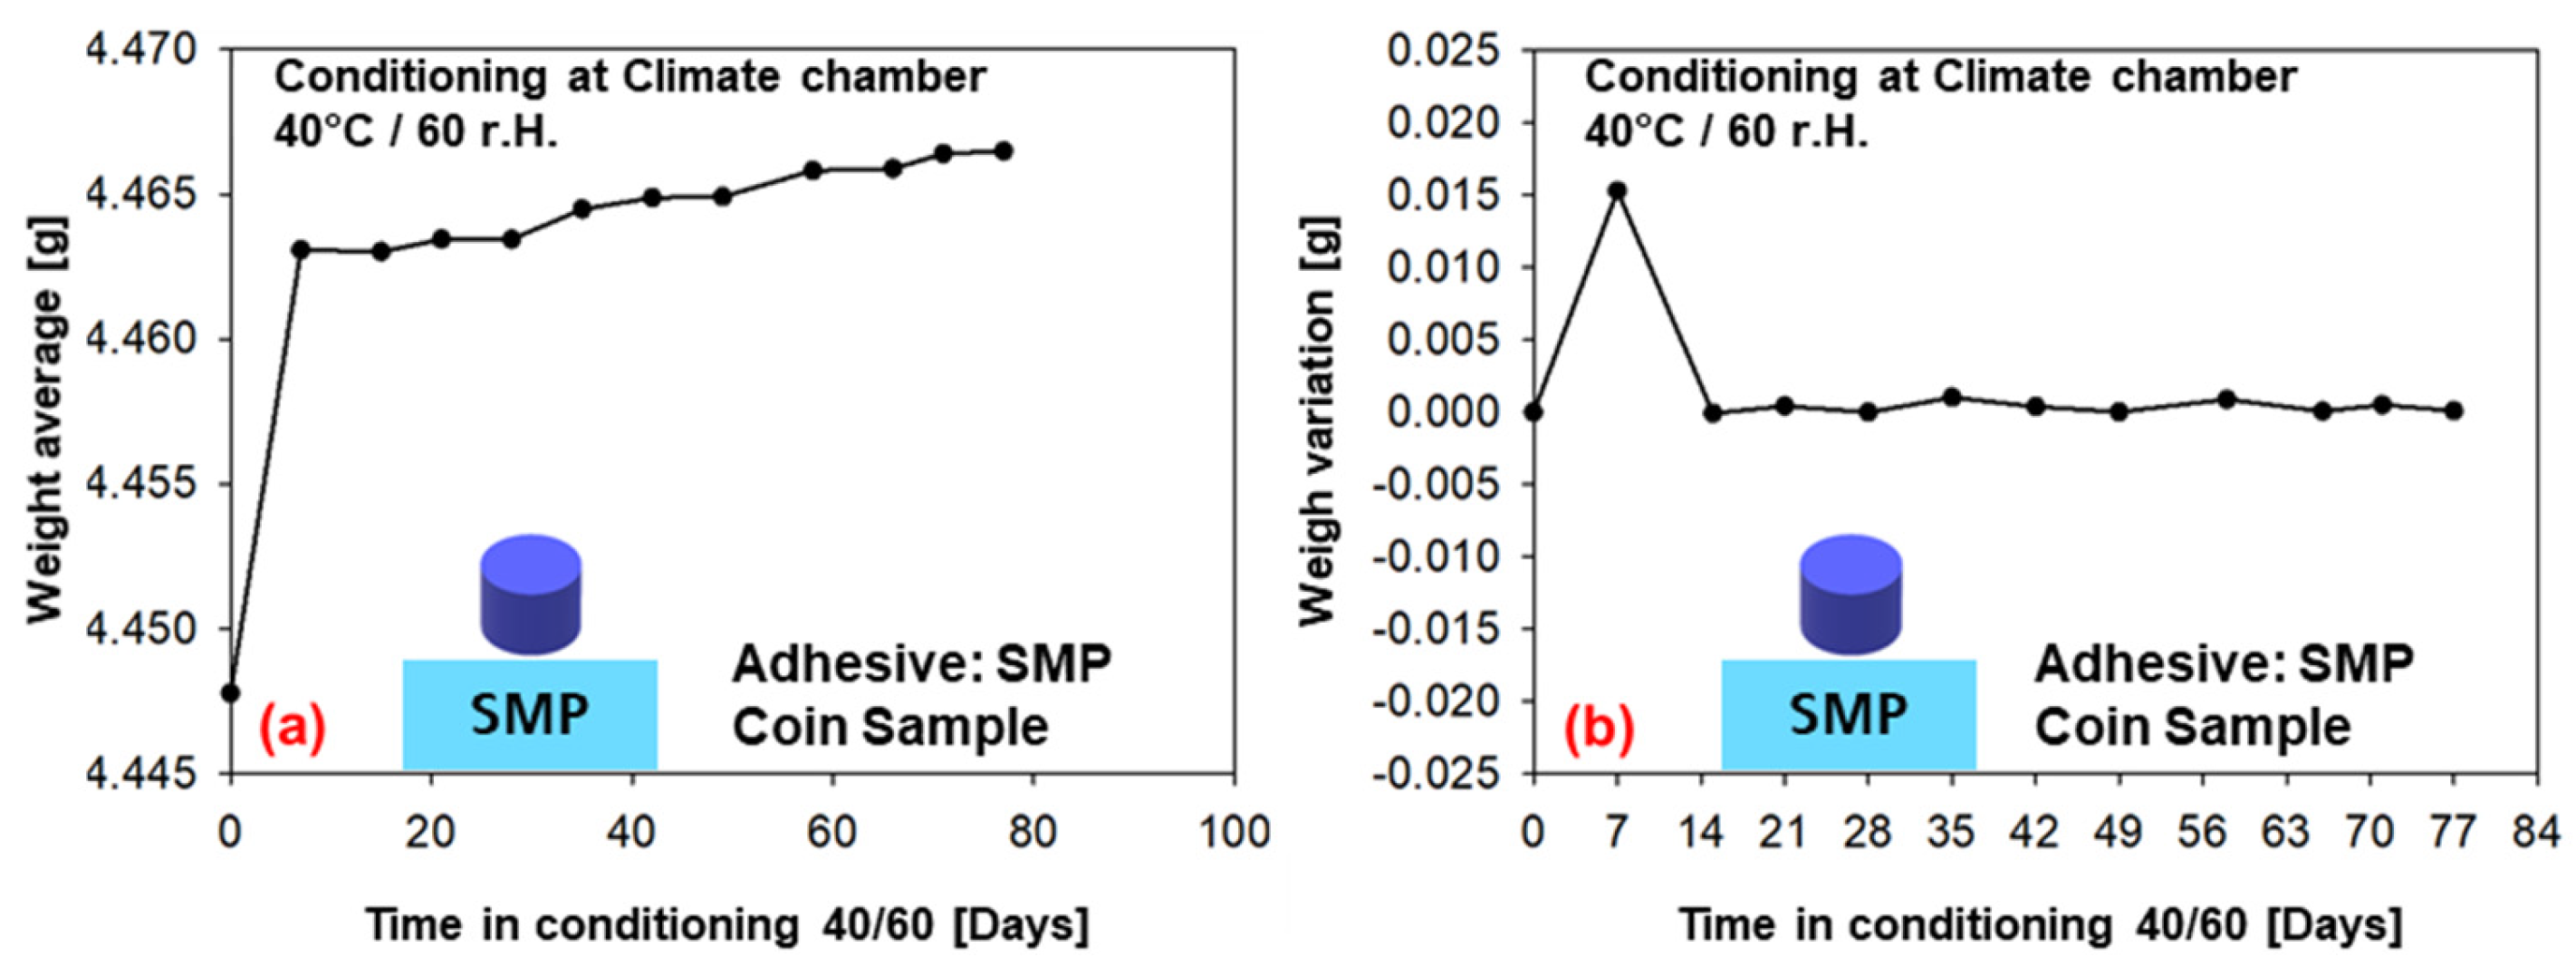
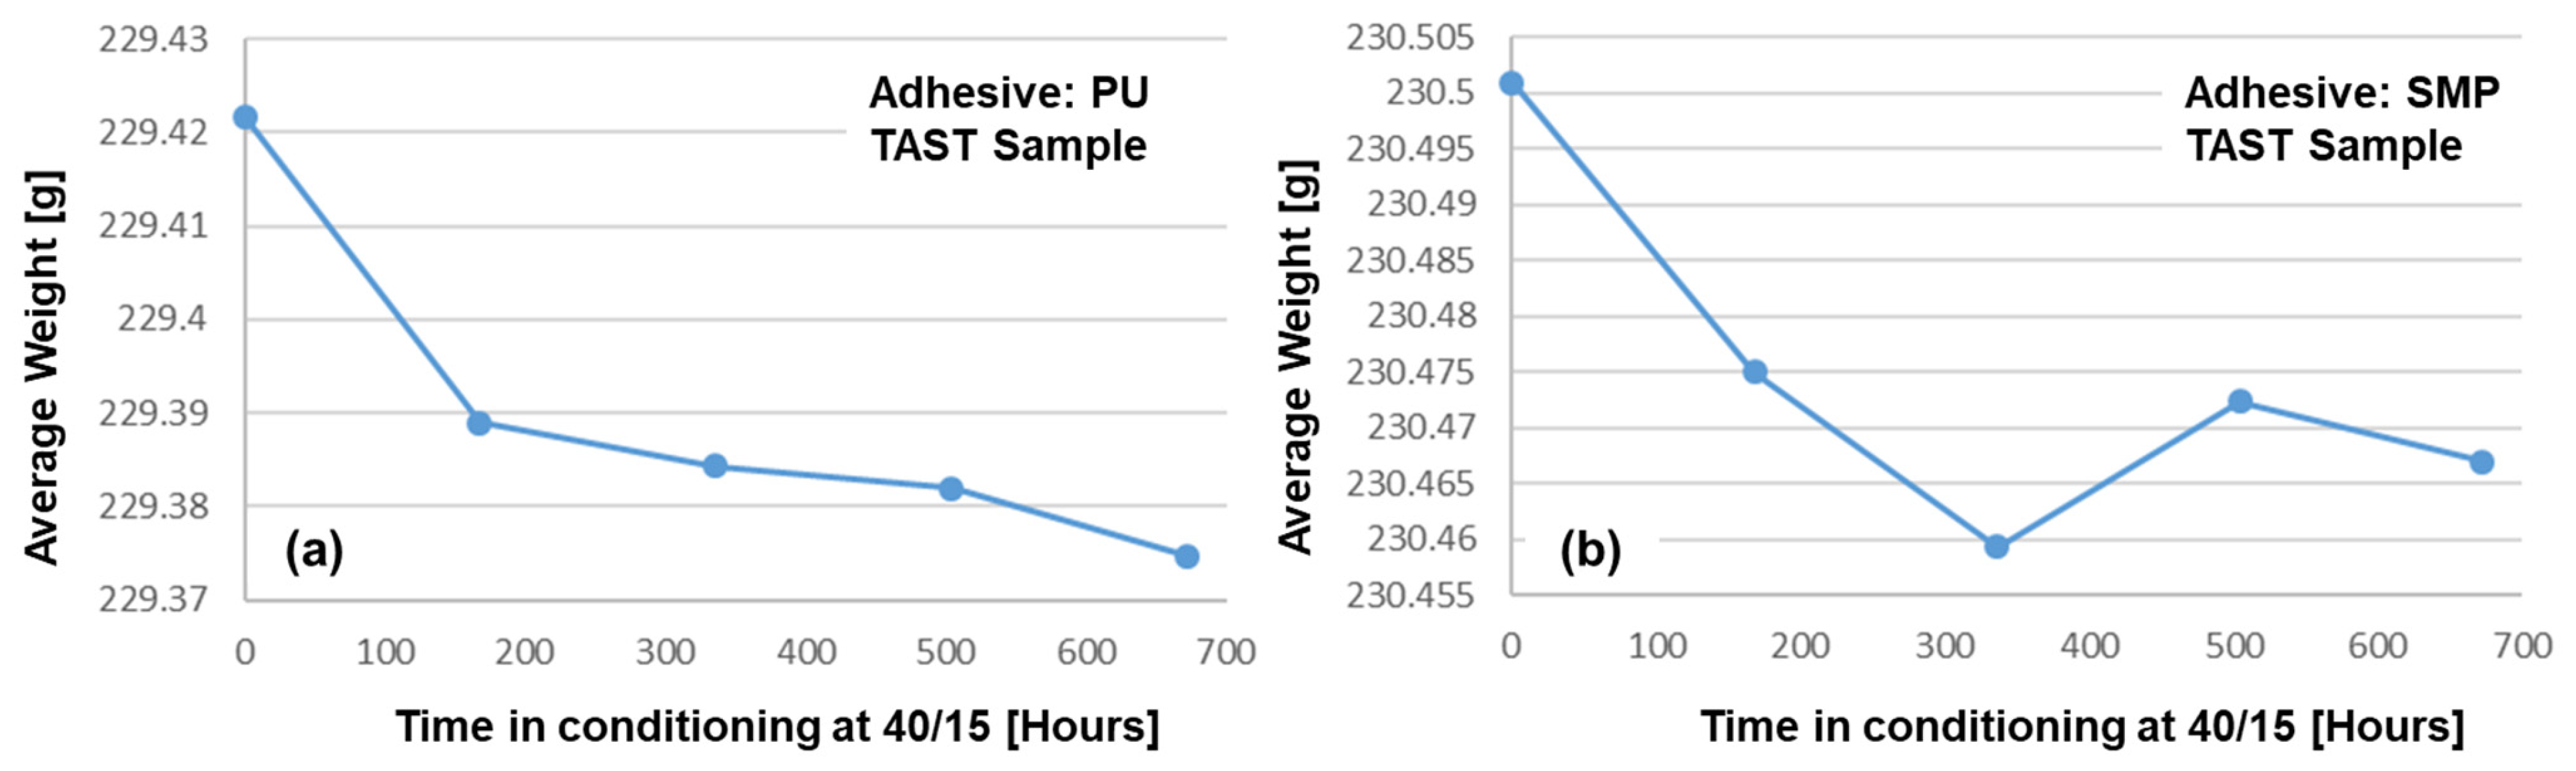
4.1.1. Measurements for Conditioning in the Climatic Chamber

The weight measurements (average of six samples) for conditioning in the climatic chamber at 40 °C/60% r.h. over a period of 77 days are given in Figure 11 (PU−adhesive) and in Figure 12 (SMP−adhesive). Both adhesives show a tendency towards saturation after 7 days of conditioning, as the average weight reaches a plateau. This can also be observed in the weight variation, which tends towards zero after the first week. As can be seen in the previous Section 3.2, the diffusion simulations support the assessment of saturation after seven days.

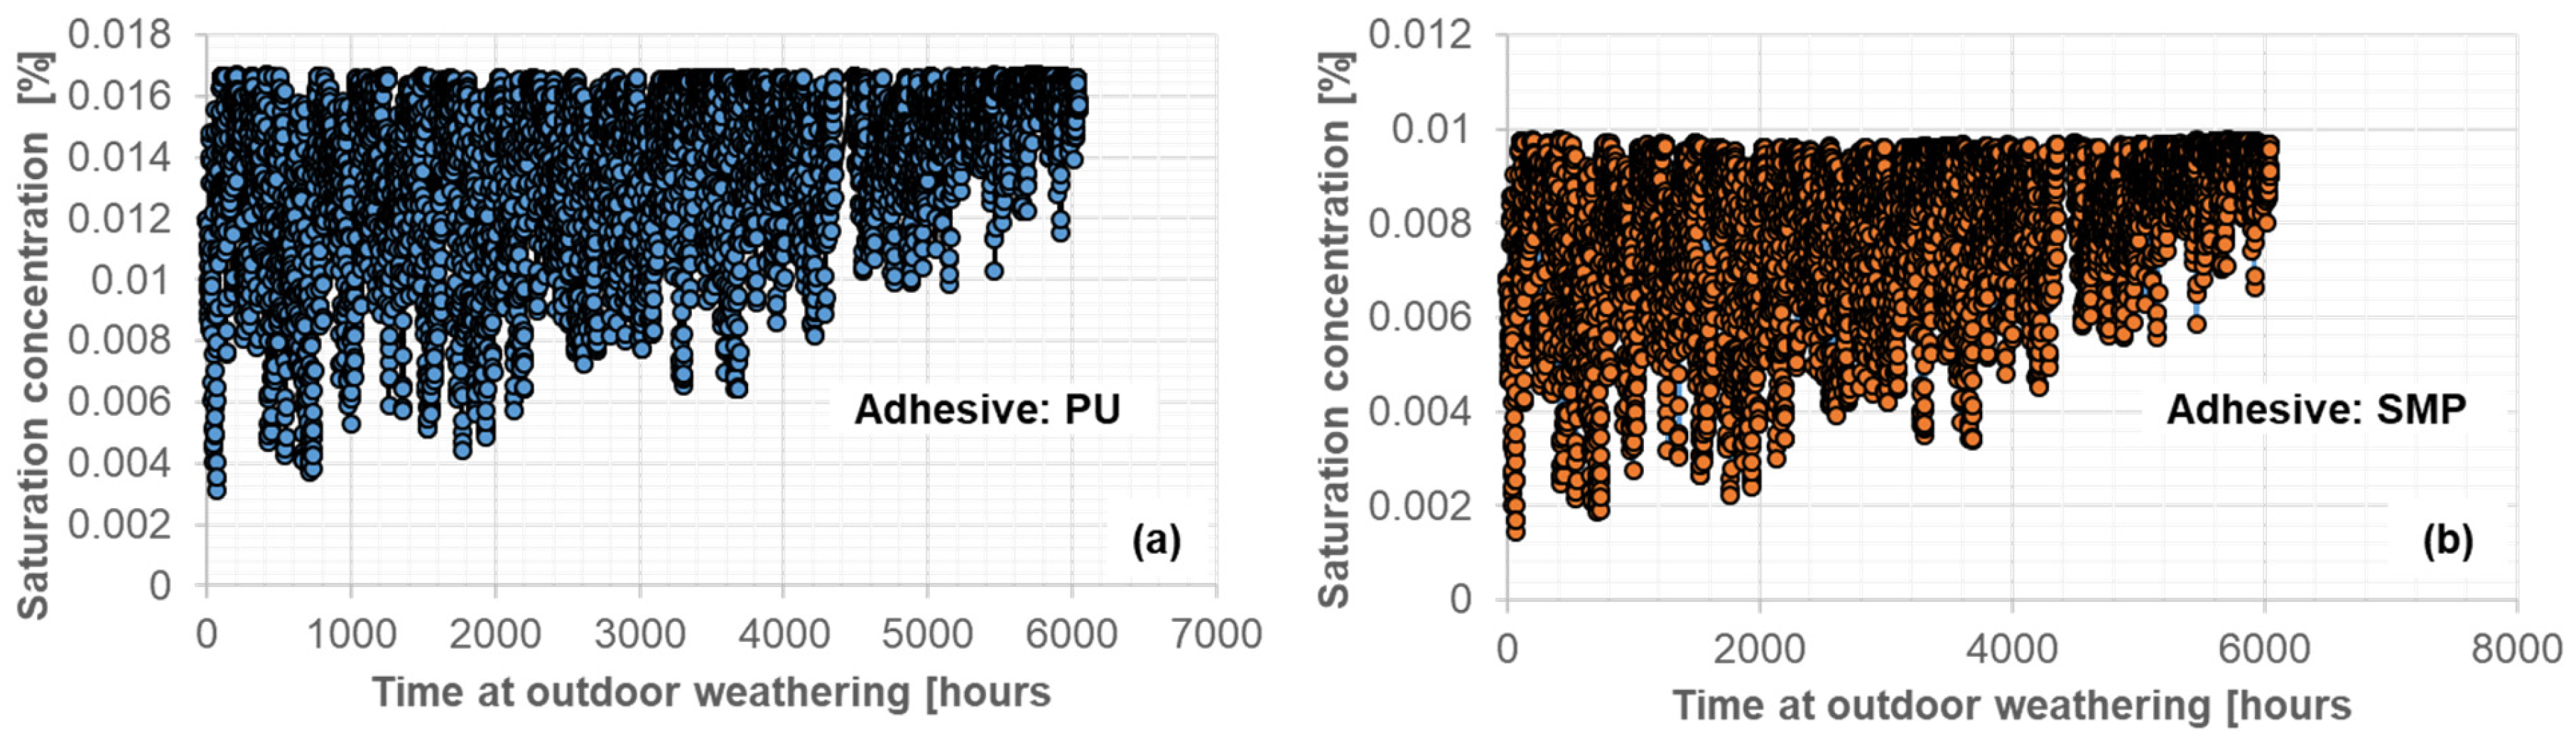
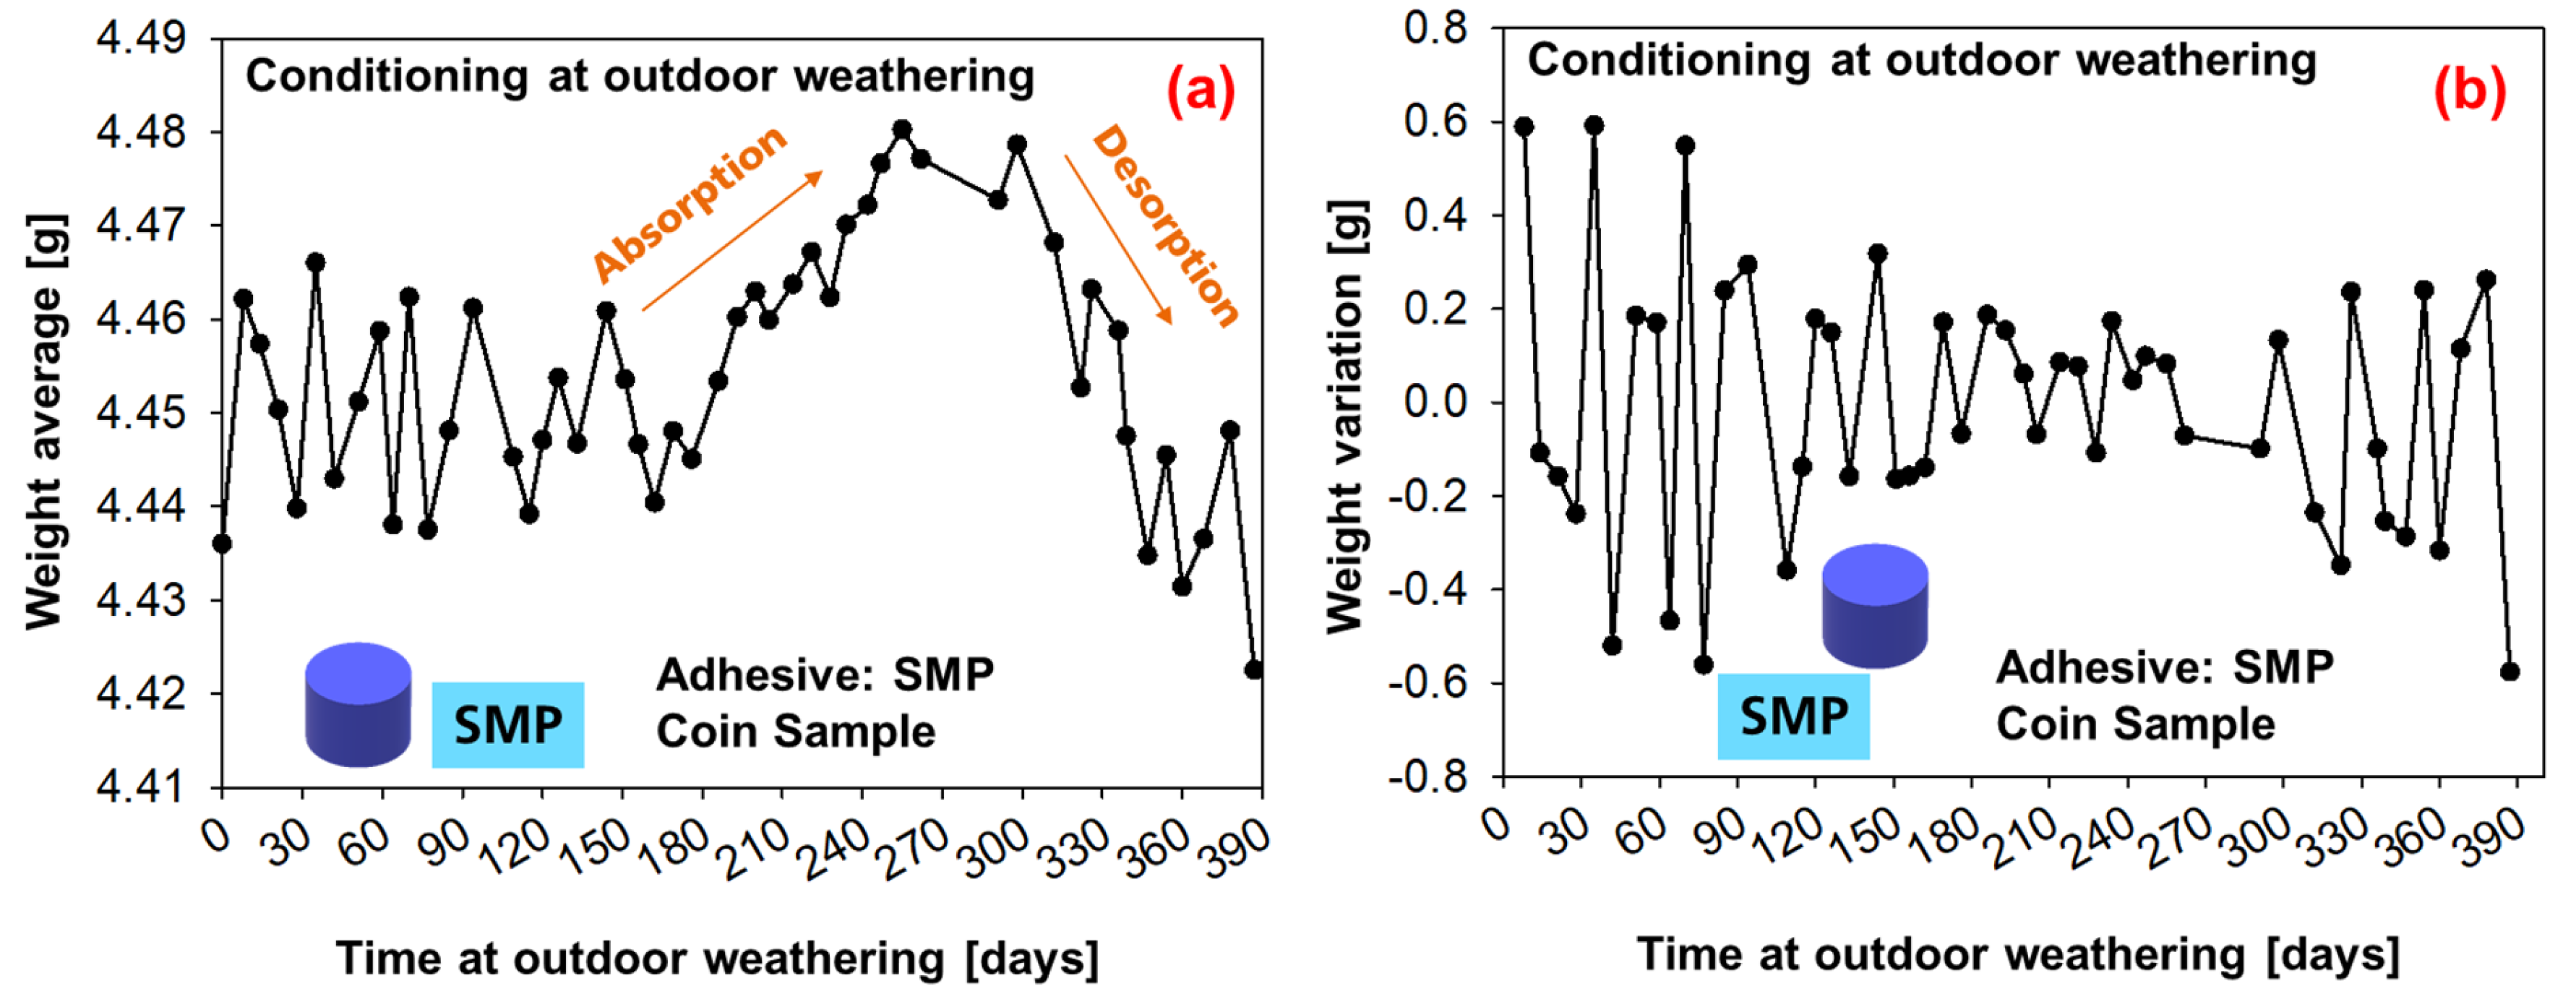
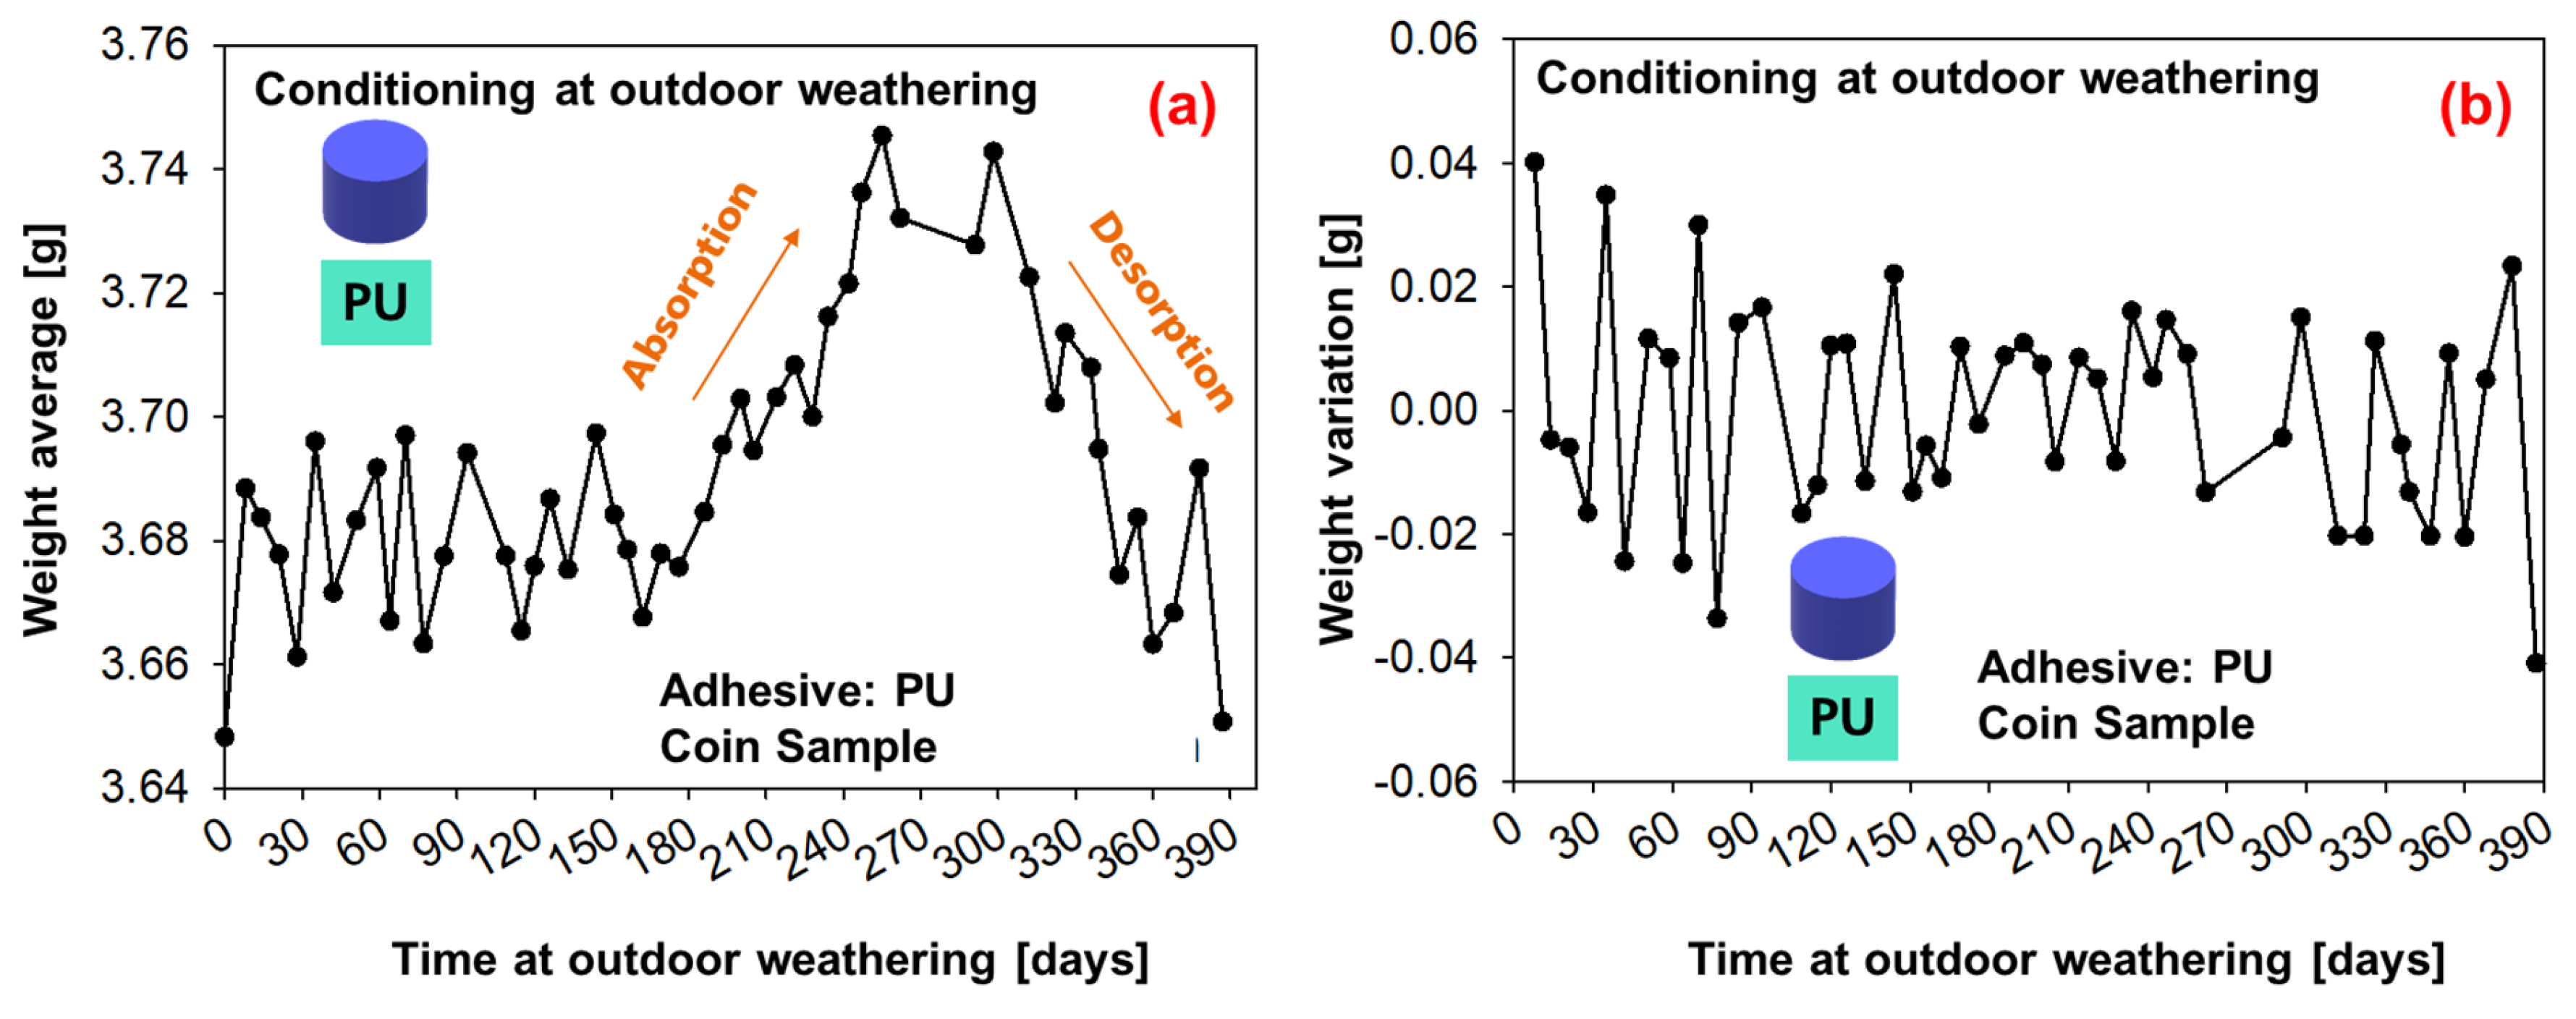
4.1.2. Measurements for Conditioning under Outdoor Weathering

The weight measurements of the coin samples under conditioning with outdoor weathering were carried out over a period of 387 days from 29 March 2021 to 20 April 2022. It is important to emphasize that the samples were only measured after drying for one week at 40 °C/15% r.h. (initial position).
A summary of the daily average values of air temperature and relative humidity from the period of 387 days is shown in Figure 13. The average daily air temperature ranged from 0.6 to 27.8 °C, while the relative humidity varied from 35.2 to 99.8%. The weather station data were later used for the simulations of conditioning under outdoor weathering. The gap in the data refers to a 42-day period between 17 December 2021 and 27 January 2022, when data were not recorded.
The average weight measurements of six coin samples under conditioning with outdoor weathering are shown in Figure 14 (SMP−adhesive) and Figure 15 (PU−adhesive). For the first 180 days, the average weight oscillates; then, a period of moisture absorption begins for up to 300 days (which corresponds to the period on Figure 13 in which the relative humidity increases). This is followed by a period of desorption until the end of the experiment, when the average weight decays.

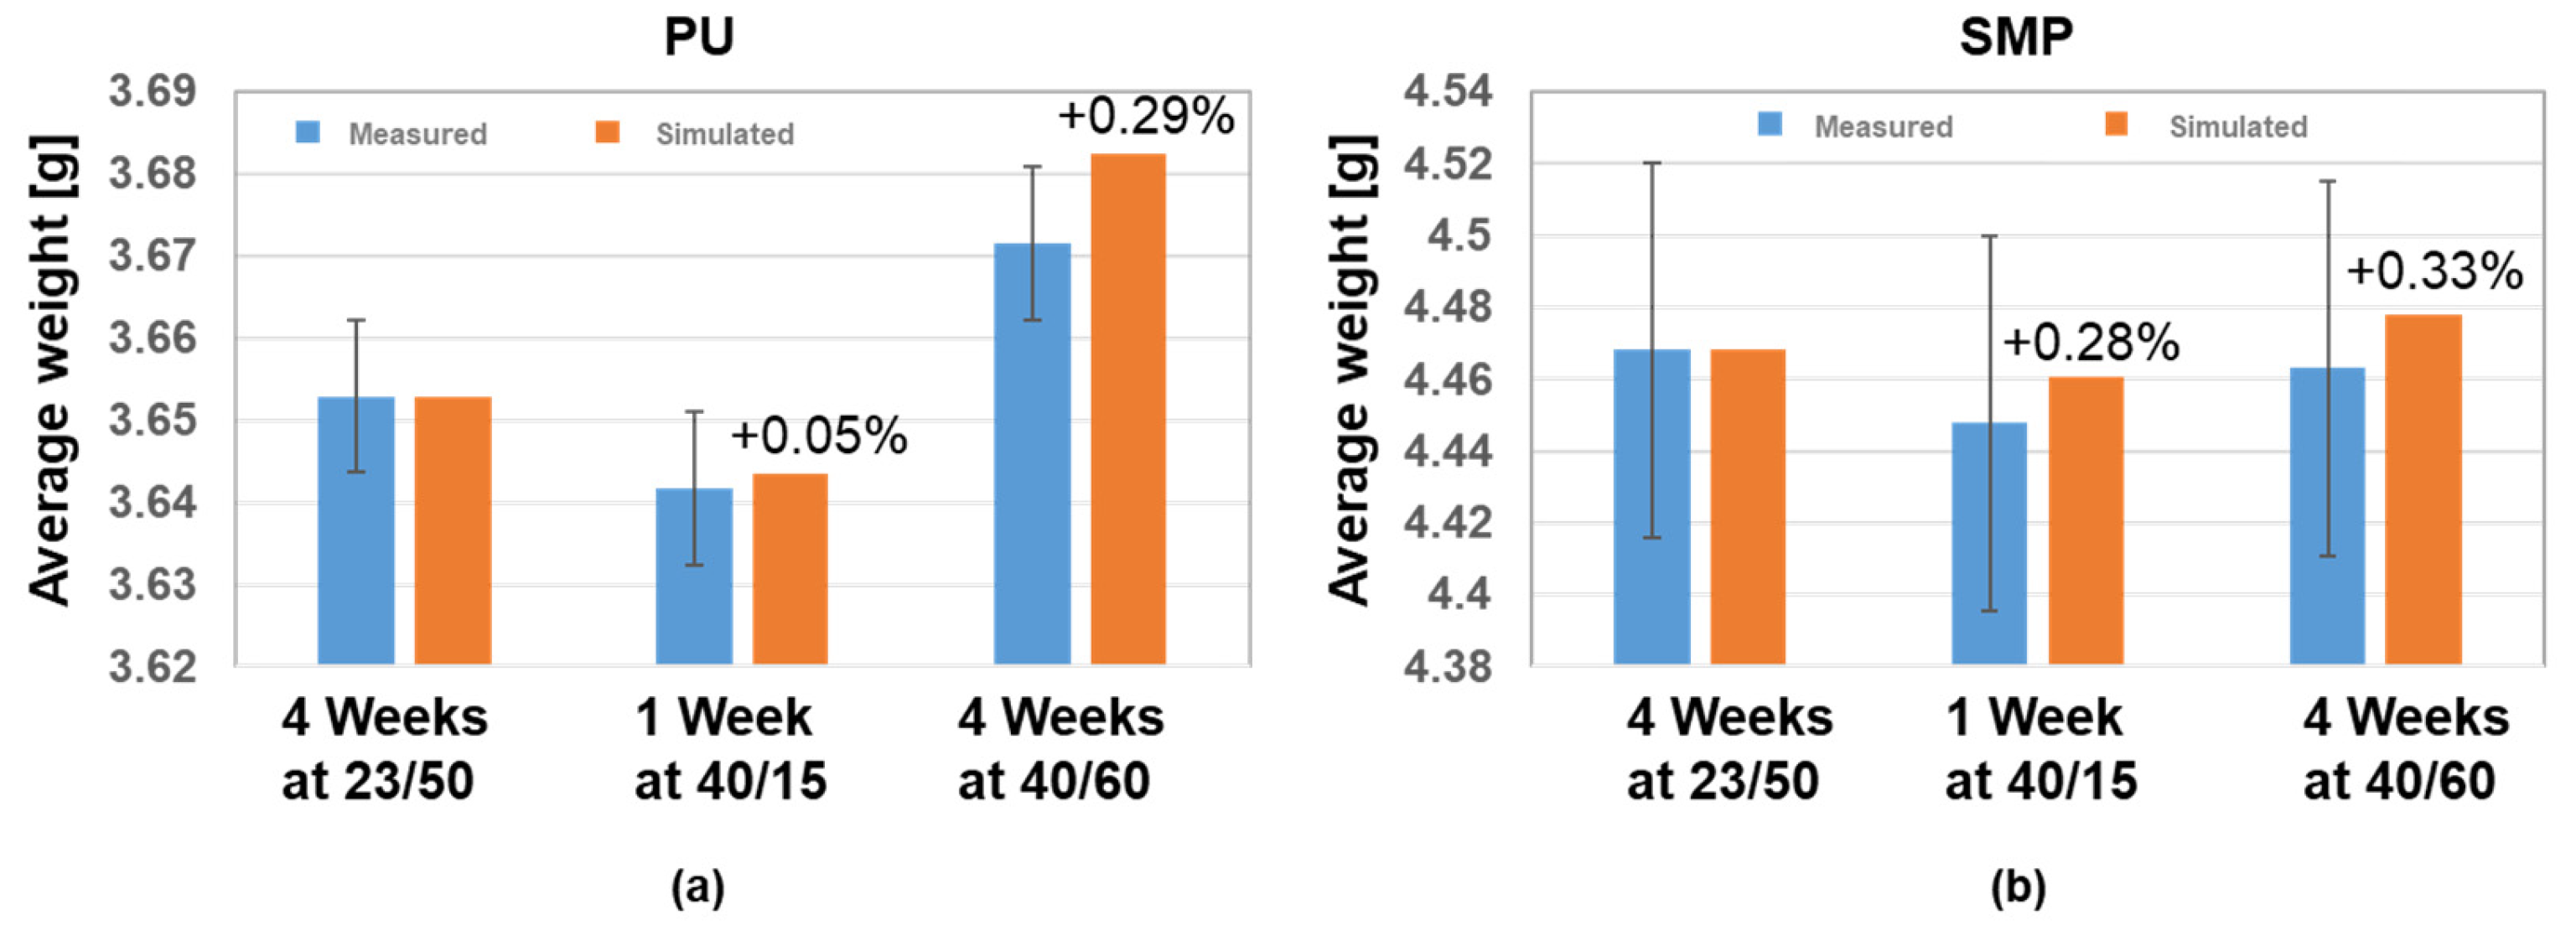
4.2. Simulations Results of Conditioning in the Climatic Chamber

Both adhesives showed a similar trend of moisture loss during 40 °C/15% r.h. conditioning, followed by moisture absorption at 40 °C/60% r.h (see Figure 8). Using Equation (4), the density of each adhesive and the density of water at 23 °C/50% r.h., 40 °C/15% r.h. and 40 °C/60% r.h., one can calculate the mass of the coin sample. The comparison of the measured and simulated average weight for each adhesive is given in Figure 16. The diffusion simulation seems to agree with the experimental measurements, as the simulation values are within the standard deviation of the measurements. Furthermore, the difference between measured and simulated values is between 0.05 and 0.33%, with the simulated results tending to slightly overestimate the average weight.

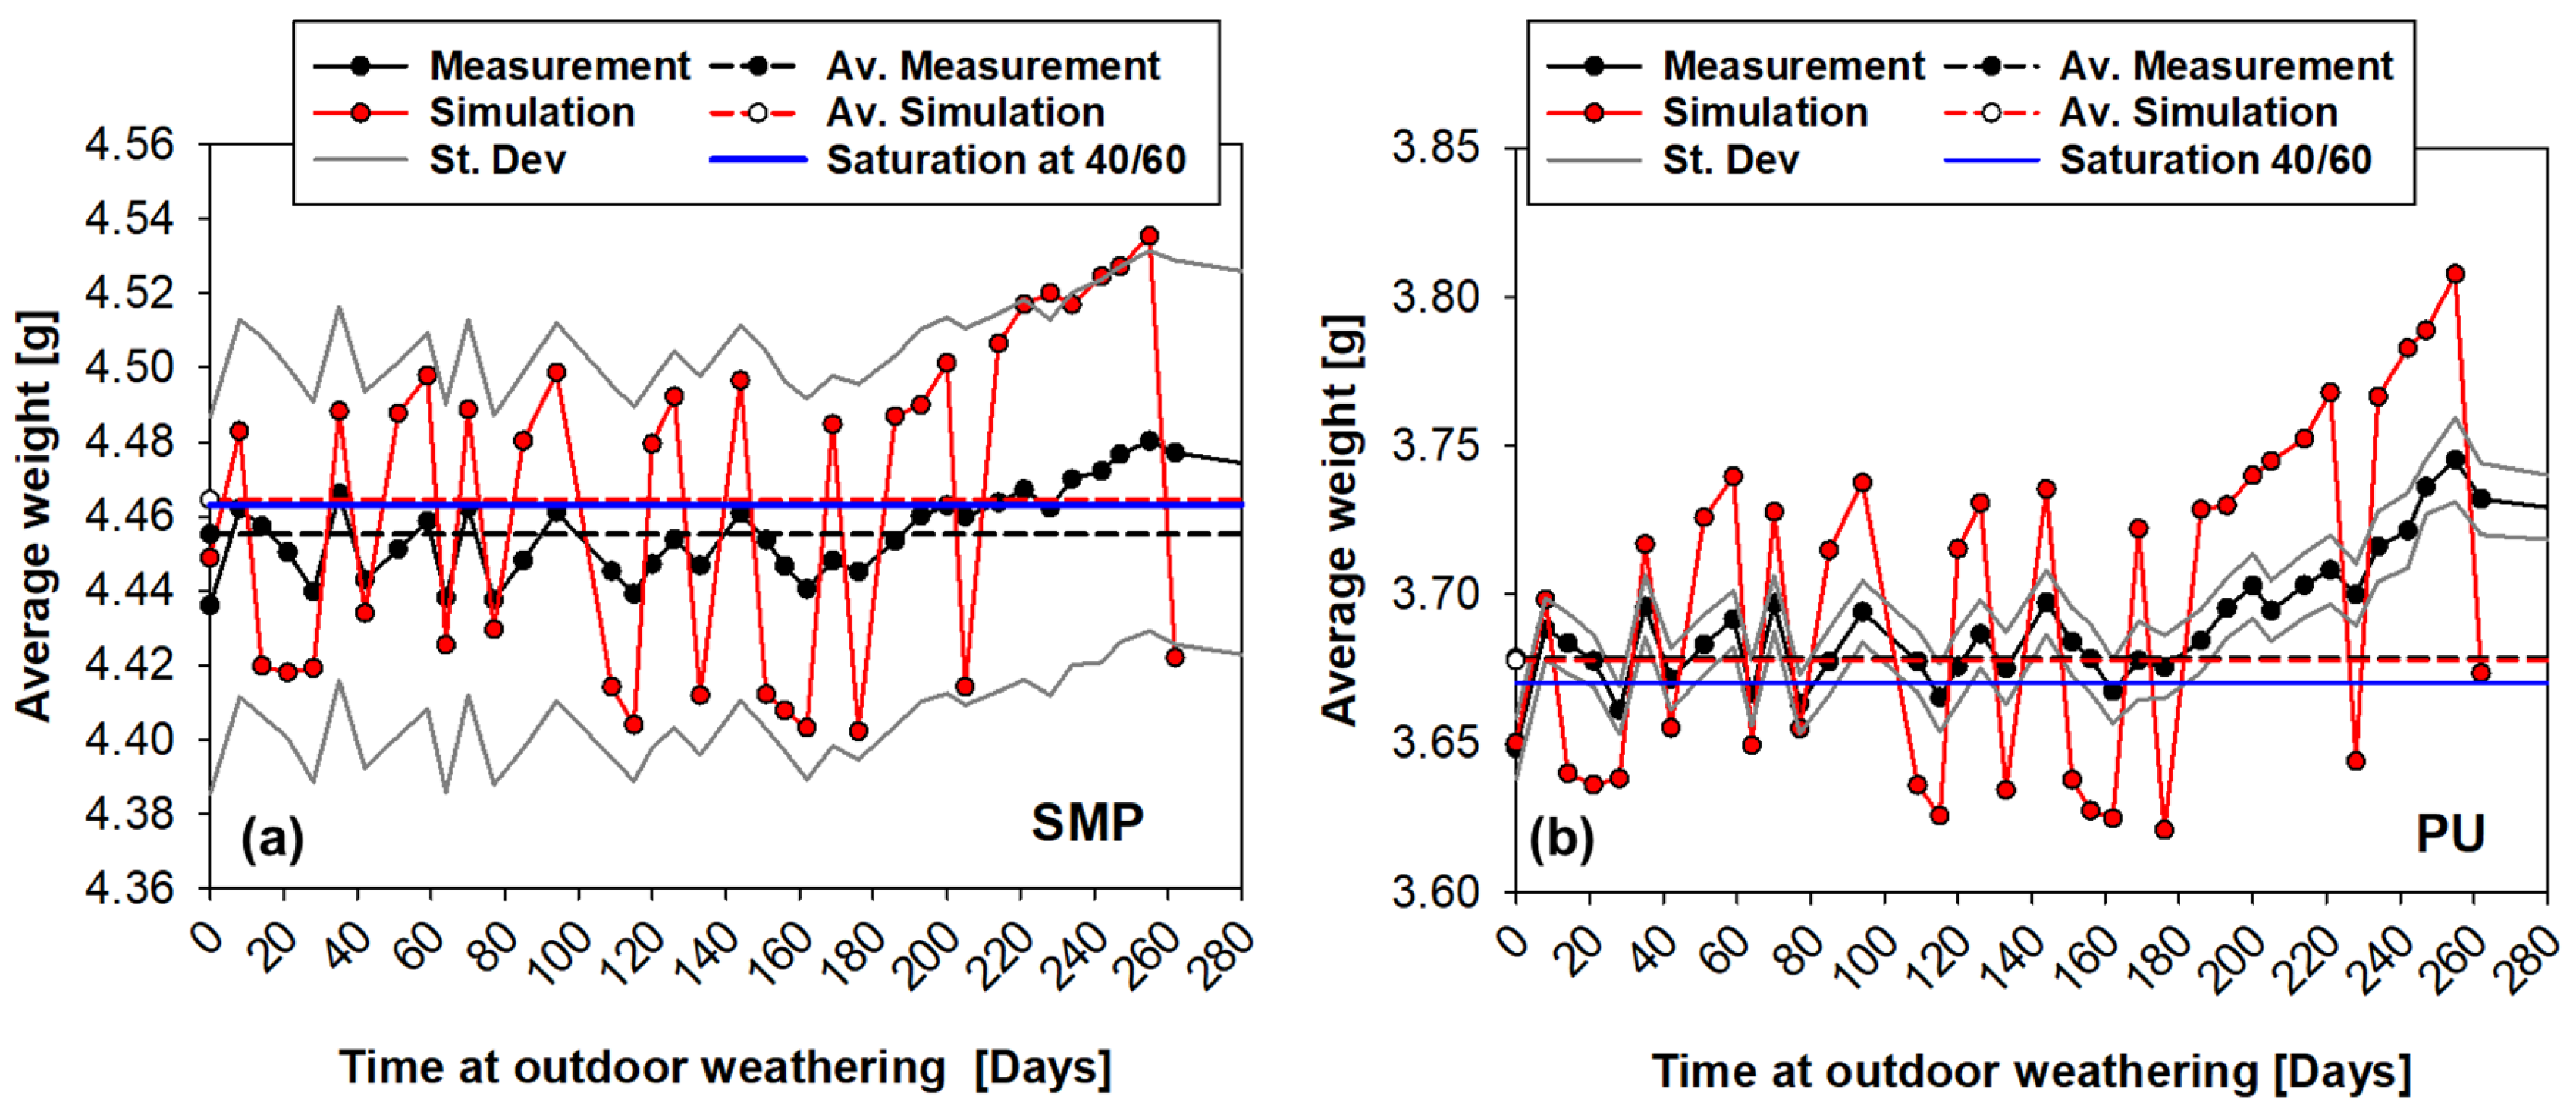
4.3. Simulations Results of Conditioning under Outdoor Weathering

The mass of the coin sample can be calculated using Equation (4). A comparison of the measured and FE-calculated average weight for each adhesive is given at Figure 17. For the PU−adhesive, the simulations can predict the tendency of weight loss/gain and an agreement between the average of the measured and simulated values. The PU−adhesive has a stronger tendency to absorb water (higher saturation concentration) and is lighter, which makes it more sensitive to temperature and humidity variations.
On the other hand, the simulations with the SMP−adhesive have a very good correlation with the experimental measurements, as the simulations are within the standard deviation of the measurements.
Another aim of the investigation with regard to climatic conditions and diffusion is to assess whether the substitute climate of 40 °C/60% r.h. is comparable with conditioning under outdoor weathering (i.e., real climatic conditions of a bonded joint in service) for a representative bonded joint, in this case, the TAST sample.
The concern here is that the weight variation due to moisture loss/gain is much less than the total weight of the TAST sample (due to aluminium substrates). For this reason, the comparison between conditioning at outdoor weathering and at 40 °C/60% r.h. was made using FE-simulations of diffusion.
However, during the period of 45 days between 17 December 2021 and 27 January 2022, the weather station data were not recorded. Since weight measurements are available for these 45 days, a correlation between the saturation concentration and the average weight of the samples was determined. With the linear relationship presented in Figure 18, it was possible to circumvent this limitation of the missing weather station data and to be able to provide the saturation concentration for the simulation under outdoor weathering of the TAST sample.
The calculated concentration from the FE-simulation of conditioning under outdoor weathering for the TAST specimen is shown in Figure 19. An arrow in each figure indicates the time at which the relationship between weight and saturation concentration was used to obtain input data for the simulations. The orange line indicates the saturation concentration resulting from the simulation of conditioning at 40 °C/60% r.h.
Comparing the concentration for the SMP−adhesive at outdoor weathering and the saturation concentration at 40 °C/60% r.h., the values are C ¯ S M P O u t = 0.00579% and C ¯ S M P 40 / 60 = 0.00475% with a deviation of 17.0%. Similarly, for the PU−adhesive, the concentration is C ¯ P U O u t = 0.01037% when exposed to outdoor weathering and C ¯ P U 40 / 60 = 0.00915% when saturated at 40 °C/60% r.h., showing a deviation of 11.8%.
The similarity between the saturation concentration with outdoor weathering for almost one year and at 40 °C/60% r.h. supports the concept of a 40 °C/60% r.h. surrogate climate, which was also presented by Wulf et al. [9]. Furthermore, the concentration does not return to its initial value after 9288 h (387 days) of conditioning with outdoor weathering, which suggests a tendency towards “moisture accumulation”.

5. Mechanical Characterisation Results

5.1. Verification

To verify that the conditioning times for the study were sufficient to ensure a steady state of moisture in the adhesive, a FE simulation of moisture diffusion was performed. The FE model of the TAST sample was implemented with conditioning for 2000 h at 23 °C/50% r.h., followed by 2000 h at 40 °C/60% r.h. and concluded in the case of re-drying with 2000 h at 40 °C/15% r.h. The resulting normalised moisture concentration at the centre of the adhesive layer is shown in Figure 20. The results support the conclusion that the conditioning times were sufficient to ensure a steady state within the adhesive layer for each of the temperature/humidity conditions. The green vertical lines indicate the beginning of a saturation condition, whereas the red vertical lines indicate the time at which the sample were kept in the climate chamber (i.e., for all conditioning the steady state was reached).
Another important assessment to be made is to determine whether the samples have actually “released” moisture during the re-drying process. For this reason, the samples were weighed weekly on a scale with an accuracy of four decimal places (0.1 mg). The average weight of the samples is shown in Figure 21: (a) PU−adhesive and (b) SMP−adhesive. These measurements show a weight loss that can be assumed to be related to moisture loss during re-drying.

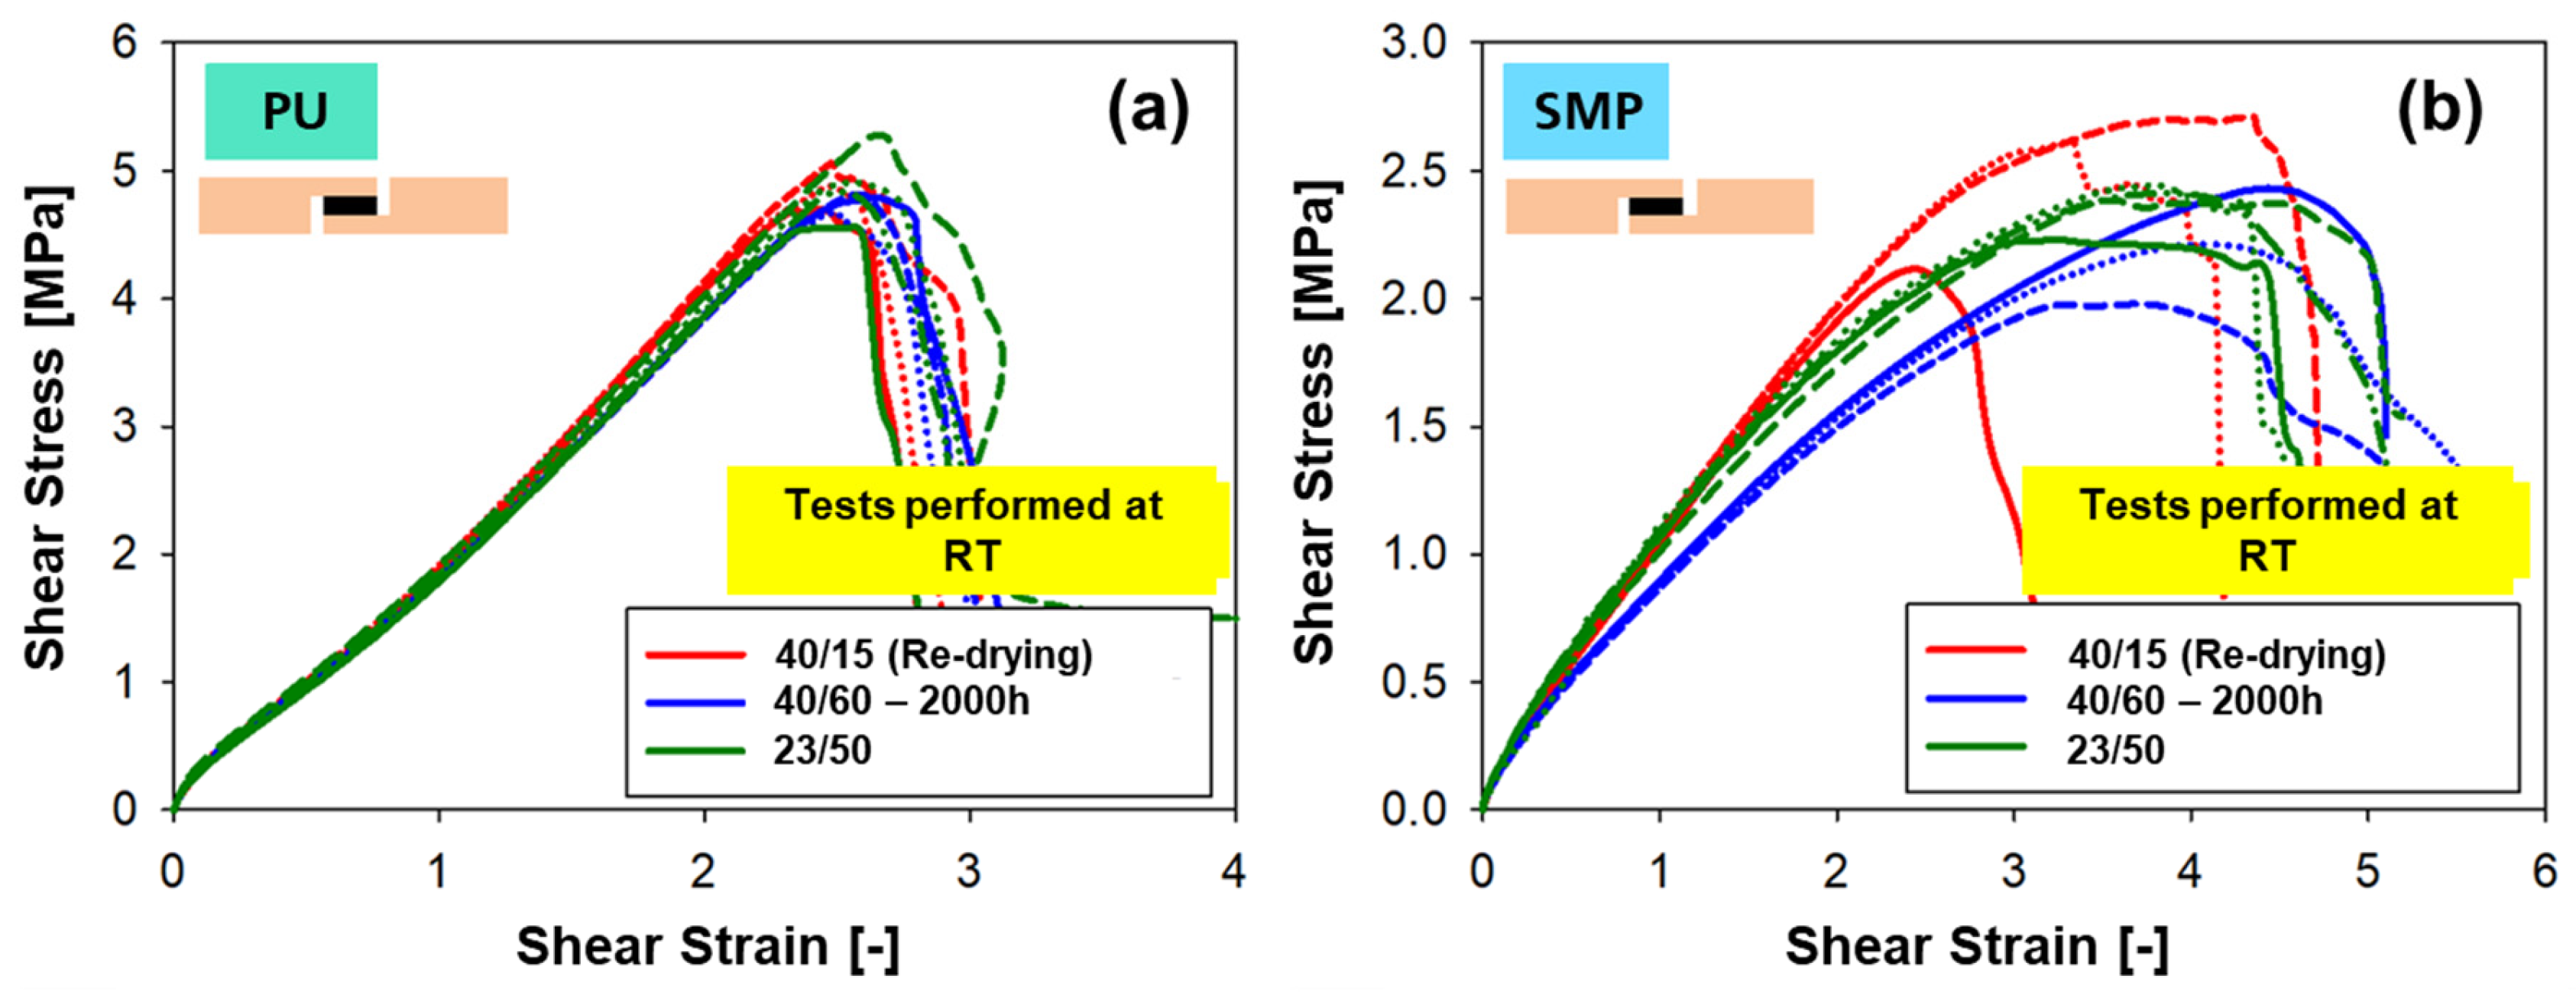
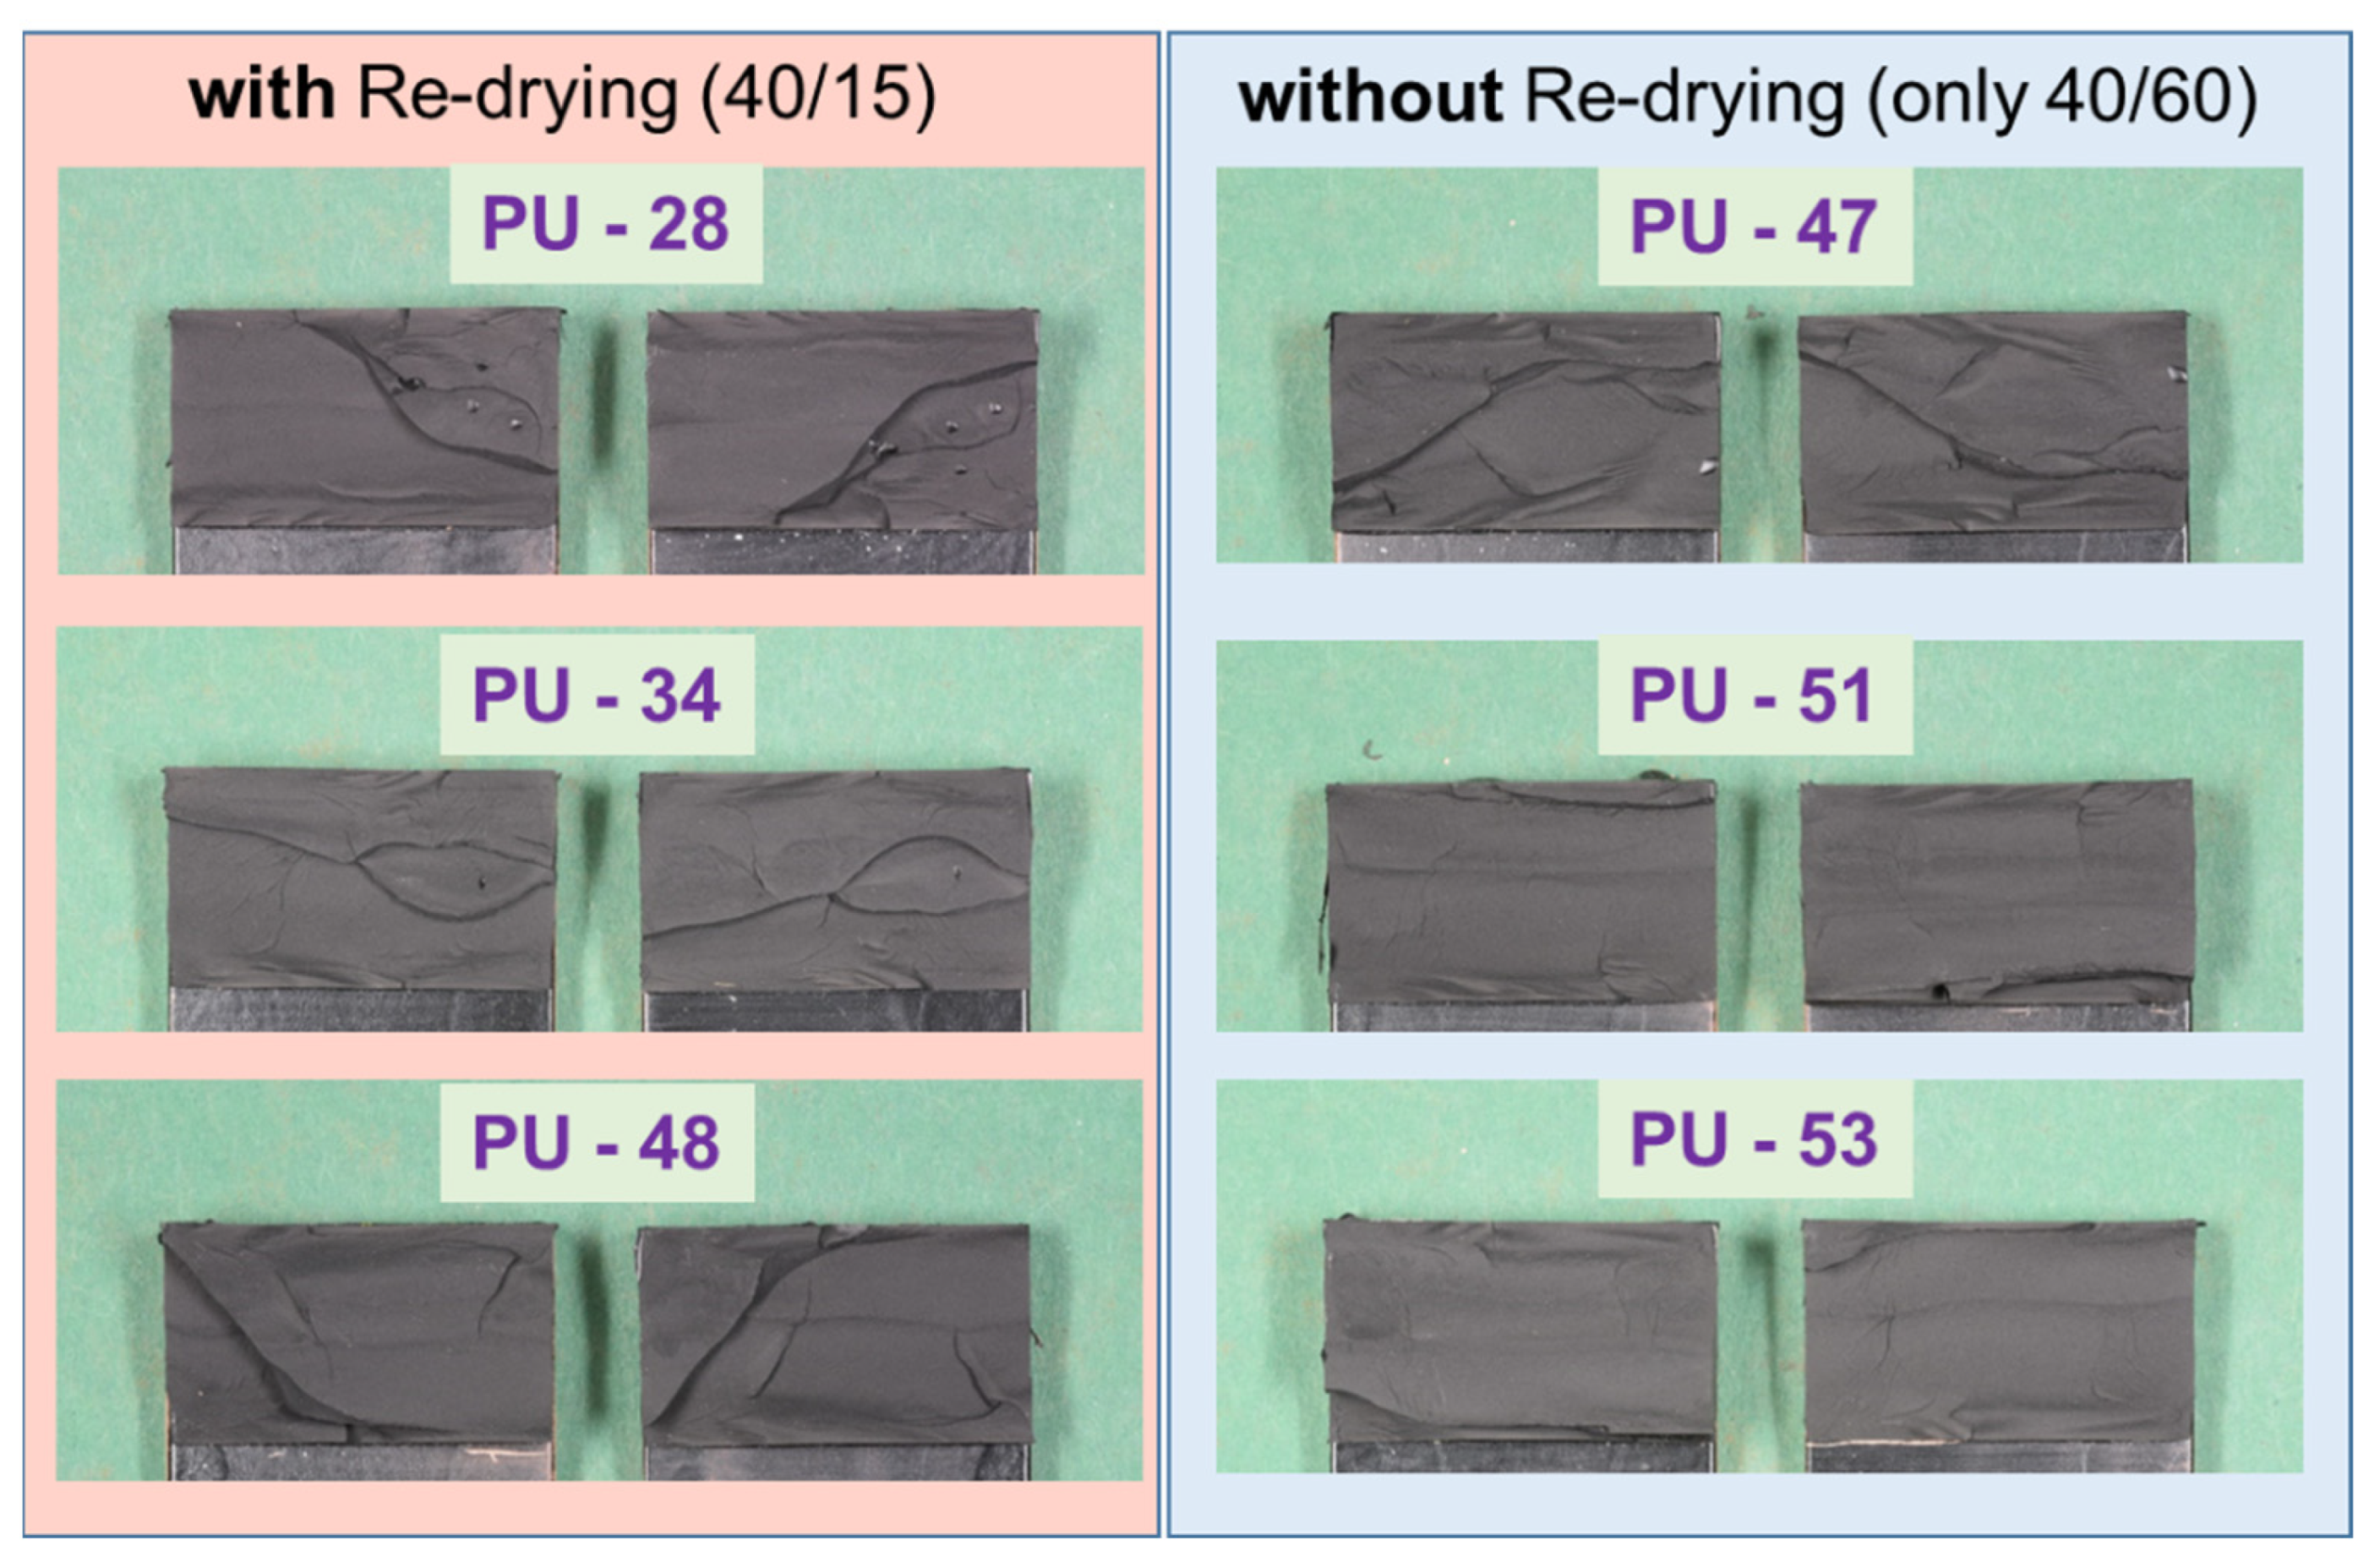
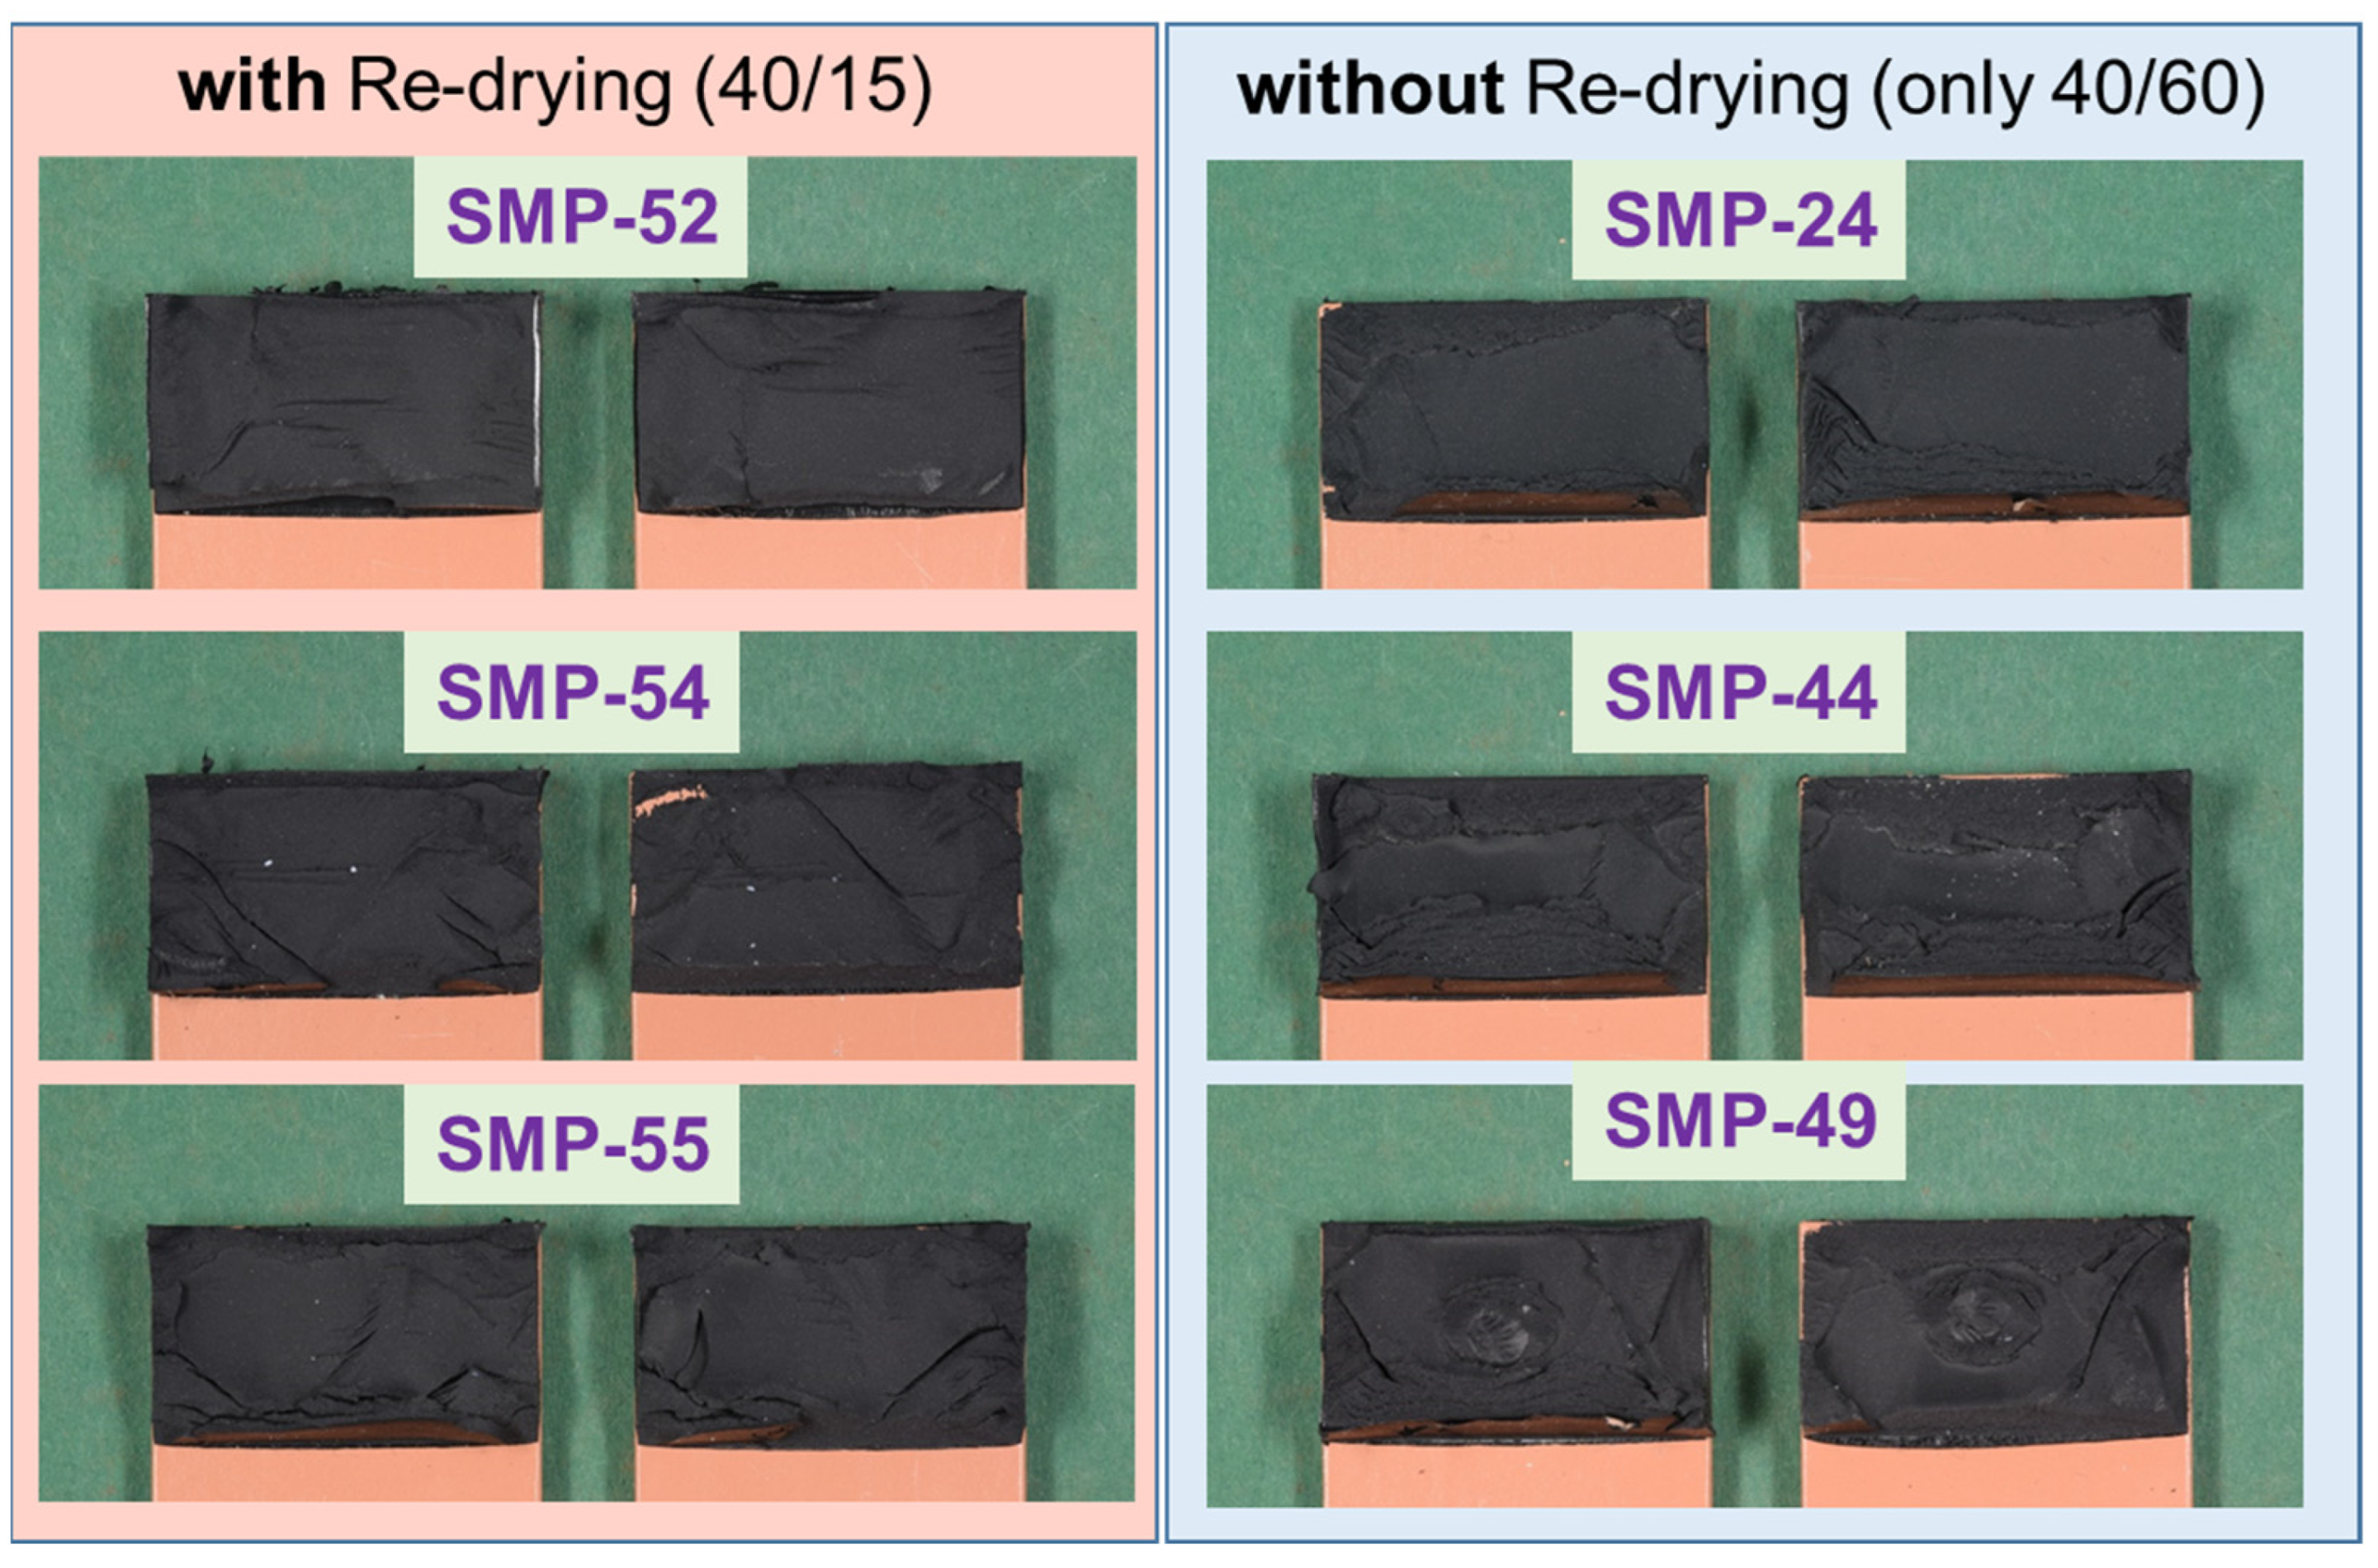
5.2. Quasi-Static Testing

The resulting shear stress–strain diagrams from quasi-static testing are shown in Figure 22 for (a) PU–adhesive and (b) SMP–adhesive. The quasi-static testing took place at RT, regardless of the conditioning type. The diagrams show the curves of samples with re-drying (2000 h at 40 °C/60% + re-drying at 40 °C/15% r.h.), without re-drying (40 °C/60% r.h. only) and, as a reference, the samples conditioned at RT (23 °C/50% r.h.). Samples with the same conditioning are represented with the same colour (with solid, dashed and dotted lines representing repetitions of the test).
In the case of the PU–adhesive, the curves of the three different conditions show a matching curve with comparable shear modulus (slope of the curves, see Figure 23a) and comparable tensile shear strength (maximum value, Figure 23b). In the case of the SMP–adhesive, a difference can be seen between the three different conditions, with the samples with re-drying showing a higher modulus and strength, followed by the samples at 23 °C/50% r.h. Finally, the samples with 40 °C/60% r.h. without re-drying have the lowest modulus and strength.
The shear strain at maximum force gives a good indication of the effect of moisture in the polymer network of the adhesives. The value of shear strain at maximum force after re-drying decreased from 406.75% to 337.37% (PU–adhesive) and from 257.53% to 246.58% (SMP–adhesive), indicating a decrease in the plasticising effect of moisture.
The fracture patterns (cohesive failure) of the test in Figure 24 (PU–adhesive) and Figure 25 (SMP–adhesive) show that the failure mode is similar between the samples. This indicates that neither the 2000 h conditioning at 40 °C/60% r.h. nor the re-drying changed the failure mode of the samples.

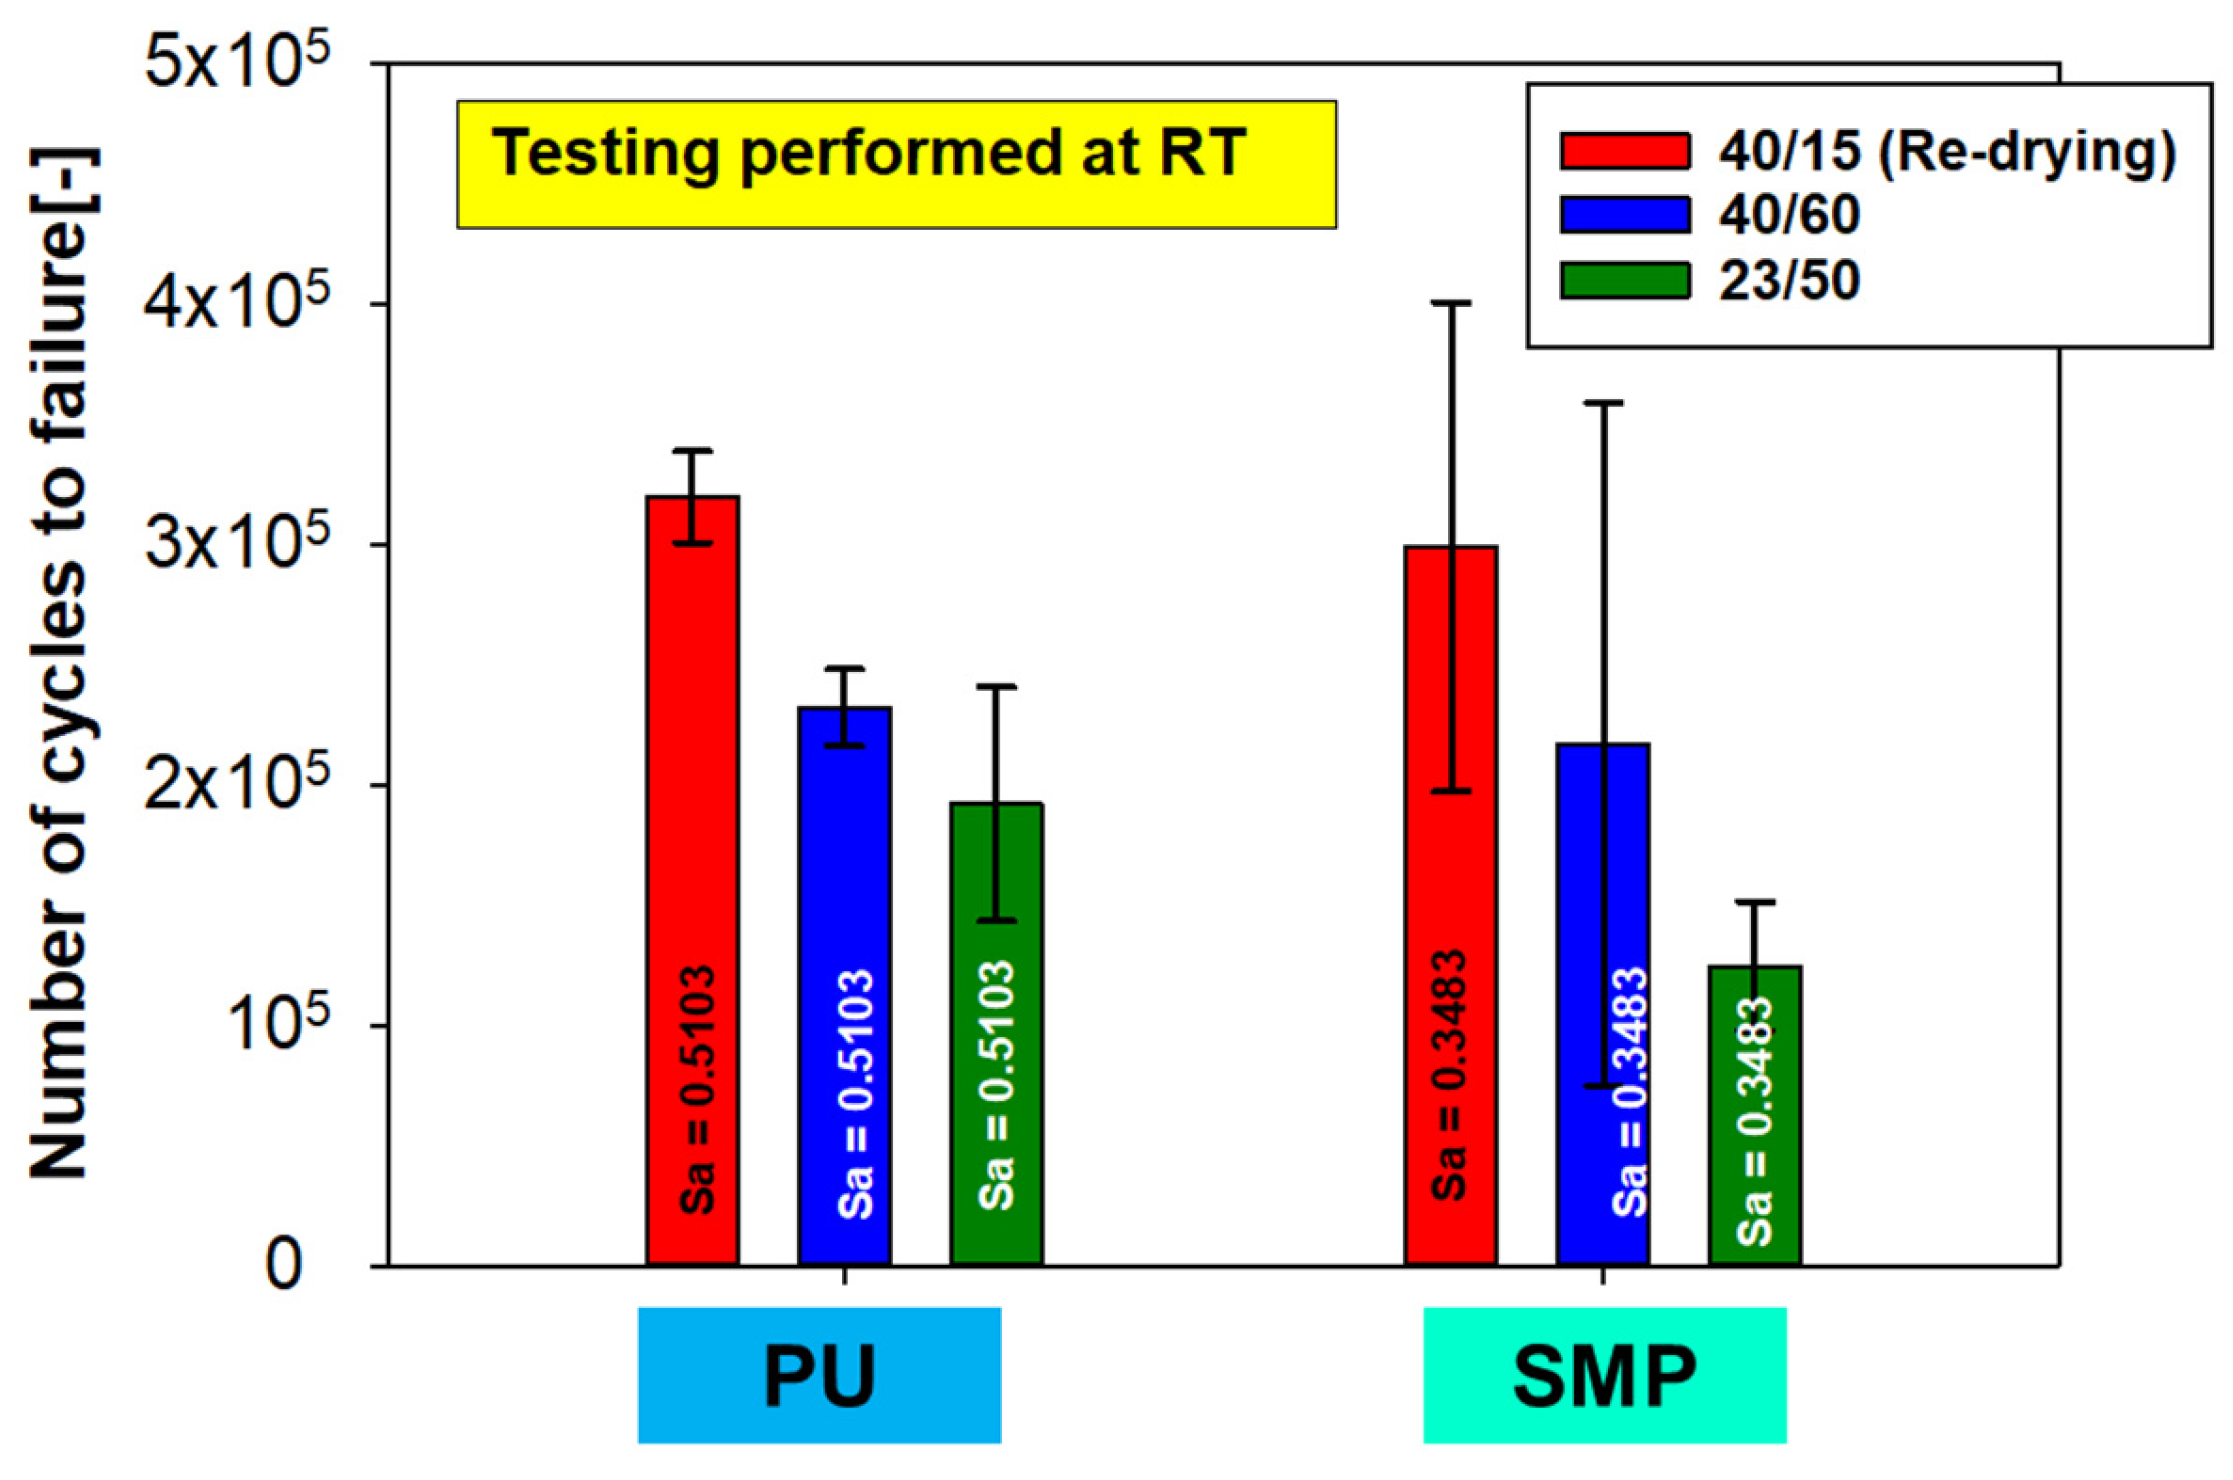
5.3. Fatigue Testing

Cyclic tests to determine the fatigue behaviour with and without re-drying were carried out for both adhesives with three repetitions for each condition. A sinusoidal loading with a stress ratio R = 0.1 and a frequency of 7 Hz was used. The samples were conditioned differently, but the fatigue tests were carried out at RT for all samples.
The stress amplitude for each adhesive was chosen so that the fatigue life was approximately 105 cycles. The stress amplitude for the PU– adhesive was σ a P U = 0.5103 MPa and σ a S M P = 0.3483 MPa for the SMP–adhesive. Figure 26 shows the number of cycles (lifetime) for each conditioning. As with the quasi-static tests, the reference conditioning of RT has been included in the plot. The same trend can be observed for both adhesives: when looking at the average values, the samples with re-drying show the highest number of cycles. However, the results at RT and at 40 °C/60% r.h. (without re-drying) are not statistically distinguishable, as the averages (including standard deviation) of both measurements are close to each other.
Finally, combining the results of the quasi-static tests in terms of shear modulus, tensile shear strength and fracture pattern with the results of the fatigue (cyclic) tests, strong evidence is found to support the conclusion that conditioning with the substitute climate of 40 °C/60% r.h. does not cause irreversible damage. Conditioning at 40 °C/60% r.h. has no negative effect on shear modulus, tensile shear strength, or durability, as the potential decrease caused by 40 °C/60% r.h. is reversed by re-drying at 40 °C/15% r.h.

6. Conclusions

In the current work, the effect of environment conditions on the diffusion and mechanical performance of two hyperelastic adhesives (a polyurethane, PU, and a silicon-modified polymer, SMP) was investigated.
The weight variation of the coin sample (cylindrical pure adhesive sample) driven by moisture loss/gain was measured considering two environmental conditionings: (i) for 77 days, in a climatic chamber under controlled temperature and humidity; (ii) for 387 days, under outdoor weathering. The climate data of air temperature and relative humidity were measured using a weather station to support the interpretation and provide input data for FEA-based diffusion models. A script was used to calculate the weight change due to moisture loss/gain. The FEA-diffusion procedure method was demonstrated for the coin sample by predicting the saturation concentration at steady conditions of 40 °C/15% r.h. (40/15) and 40 °C/60% r.h. (40/60), and predicting the experienced mass change due to outdoor weathering. Finally, the surrogate climate of 40/60 was validated by comparing the saturation concentration for a steady state at 40/60 and outdoor weathering after 387 days.
The reversibility of the effect of conditioning at 40 °C/60% r.h. on the mechanical properties of the adhesives was also investigated. TAST samples of both adhesives were first conditioned for 2000 h at 40/60. Then, the samples were divided into two groups: (i) with re-drying for 2000 h at 40 °C/15% r.h. (40/15) and (ii) without re-drying. The weight measurements showed mass loss during re-drying (probably due to the release of moisture). Quasi-static tensile shear tests for both adhesives revealed that specimens with re-drying had a higher shear modulus, higher tensile shear strength and lower deformation at maximum force than samples without re-drying. For both adhesives, fatigue tests under cyclic loading have demonstrated that samples with re-drying had a longer lifetime than samples without re-drying. These results support the conclusion that conditioning with the surrogate climate of 40 °C/60% r.h. does not cause irreversible damage, as any potential decrease in shear modulus, tensile shear strength and fatigue life due to 40/60 conditioning can be reversed by re-drying at 40/15.

Author Contributions

Conceptualization, P.H.E.F. and V.C.B.; code development, P.H.E.F.; validation and formal analysis, P.H.E.F. and V.C.B.; discussion, P.H.E.F. and V.C.B.; writing—manuscript review and editing, P.H.E.F. and V.C.B.; supervision, A.W. and C.N. All authors have read and agreed to the published version of the manuscript.

Funding

The IGF project No. 20655 N “Nachweisführung für die Beanspruchbarkeit von hyperelastischen Klebverbindungen unter betriebsrelevanten Bedingungen II” of the Research Association for Welding and Allied Processes of DVS was funded by the AiF within the framework of the programme for the promotion of Industrial Collective Research (IGF) of the Federal Ministry for Economic Affairs and Climate Action BMWK on the basis of a resolution of the German Bundestag. V. C. Beber acknowledges the funding from CAPES (Coordenaçao de Aperfeiçoamento de Pessoal de Nível Superior) through the Science without Borders program (grant BEX 13458/13-2).

Institutional Review Board Statement

Not applicable.

Informed Consent Statement

Not applicable.

Data Availability Statement

Research data are not shared.

Conflicts of Interest

The authors declare no conflict of interest.

Abbreviation

The following abbreviations/symbols were employed in this investigation:
SymbolMeaning
Asurface
bsample width
C ¯ average concentration
C I P ,amount of solute at each concentration point
d a d h adhesive layer thickness
Ddiameter
ffrequency
Fforce
Gshear modulus
i integration point
L 0 initial gauge length
L a d h overlap length
m d mass change due diffusion
PUpolyurethane
r.hrelative humidity
Rstress ratio
RTroom temperature
sdisplacement
SMPsilicon-modified polymer
TASTthick adherend shear test
V I P volume of each integration point
τ shear stress
γ shear strain
ρ density

References

  1. van Amerongen, G.J. Diffusion in Elastomers. Rubber Chem. Technol. 1964, 37, 1065–1152. [Google Scholar] [CrossRef]
  2. Costa, M.; Viana, G.; da Silva, L.F.M.; Campilho, R.D.S.G. Environmental effect on the fatigue degradation of adhesive joints: A review. J. Adhes. 2017, 93, 127–146. [Google Scholar] [CrossRef]
  3. Lai, M.; Botsis, J.; Cugnoni, J.; Coric, D. An experimental–numerical study of moisture absorption in an epoxy. Compos. Part A Appl. Sci. Manuf. 2012, 43, 1053–1060. [Google Scholar] [CrossRef]
  4. Possart, W.; Brede, M. (Eds.) Adhesive Joints: Ageing and Durability of Epoxies and Polyurethanes; Wiley-VCH: Weinheim, Germany, 2019. [Google Scholar]
  5. Pethrick, R.A. Design and ageing of adhesives for structural adhesive bonding—A review. Proc. Inst. Mech. Eng. Part L J. Mater. Des. Appl. 2015, 229, 349–379. [Google Scholar] [CrossRef]
  6. da Silva, L.F.M.; Öchsner, A.; Adams, R.D. Handbook of Adhesion Technology; Springer International Publishing: Cham, Switherland, 2017. [Google Scholar]
  7. Zhai, J.; Zhao, H.; Guo, X.; Li, X.; Song, T. Influence of Temperature on Mechanical Properties of P(BAMO-r-THF) Elastomer. Polymers 2020, 12, 2507. [Google Scholar] [CrossRef] [PubMed]
  8. DIN 6701-3: 2015-12; Adhesive Bonding of Railway Vehicles and Parts—Part 3: Guideline for Construction Design and Verification of Bonds on Railway Vehicles. Beuth Verlag GmbH: Berlin, Germany, 2015.
  9. Wulf, A.; Hesebeck, O.; Baumert, M.; Brede, M. Nachweisführung für die Beanspruchbarkeit von hyperelastischen Klebverbindungen unter betriebsrelevanten Bedingungen; Final Report of the Project; IGF-Vorhaben Nr. 18173 N; DVS Forschungsvereinigung, Band: 341; DVS-Media GmbH: Düsseldorf, Germany, 2018. [Google Scholar]
  10. da Silva, L.F.M.; Sato, C. Design of Adhesive Joints Under Humid Conditions; Springer Berlin Heidelberg: Berlin/Heidelberg, Germany, 2013. [Google Scholar]
  11. Huacuja-Sánchez, J.E.; Müller, K.; Possart, W. Water diffusion in a crosslinked polyether-based polyurethane adhesive. Int. J. Adhes. Adhes. 2016, 66, 167–175. [Google Scholar] [CrossRef]
  12. Guo, Y.C.; Wang, X.; Sun, K.W. Finite Element Analysis on Moisture Distribution within RAC under Standard Drying Conditions. AMR 2011, 261–263, 356–360. [Google Scholar] [CrossRef]
  13. Das, A.; Mahanwar, P. A brief discussion on advances in polyurethane applications. Adv. Ind. Eng. Polym. Res. 2020, 3, 93–101. [Google Scholar] [CrossRef]
  14. Sheikh, N.; Mirzadeh, H.; Katbab, A.A.; Salehian, P.; Daliri, M.; Amanpour, S. Isocyanate-terminated urethane prepolymer as bioadhesive material: Evaluation of bioadhesion and biocompatibility, in vitro and in vivo assays. J. Biomater. Sci. Polym. Ed. 2001, 12, 707–719. [Google Scholar] [CrossRef] [PubMed]
  15. Gadhave, R.V.; Gadhave, C.R.; Dhawale, P.V. Silane Terminated Prepolymers: An Alternative to Silicones and Polyurethanes. Open J. Polym. Chem. 2021, 11, 31–54. [Google Scholar] [CrossRef]
  16. Berzins, R.; Merijs-Meri, R.; Zicans, J. Comparison of Two-Component Silyl-Terminated Polyether/Epoxy Resin Model and Complete Systems and Evaluation of Their Mechanical, Rheological and Adhesive Properties. Polymers 2022, 14, 2421. [Google Scholar] [CrossRef] [PubMed]
  17. Hertz, D.L. Elastomers: An engineering material. Rubber Chem. Tech. 2007, 80, 520–532. [Google Scholar] [CrossRef]
  18. DVS 1608; Richtlinie DVS 1608-1 (02/2022): Gestaltung und Festigkeitsbewertung von Schweißkonstruktionen aus Aluminiumlegierungen im Schienenfahrzeugbau. Beuth Verlag GmbH: Berlin, Germany, 2022.
  19. Shen, C.-H.; Springer, G.S. Moisture Absorption and Desorption of Composite Materials. J. Compos. Mater. 1976, 10, 2–20. [Google Scholar] [CrossRef] [Green Version]
  20. Dassault Systèmes Simulia. Abaqus Users’ Manual, Version 2019; Dassault Systèmes Simulia: Providence, RI, USA, 2019. [Google Scholar]
  21. Crank, J. The Mathematics of Diffusion, 2nd ed.; Oxford University Press: London, UK, 1975. [Google Scholar]
  22. Driemeier, C.; Mendes, F.M.; Oliveira, M.M. Dynamic vapor sorption and thermoporometry to probe water in celluloses. Cellulose 2012, 19, 1051–1063. [Google Scholar] [CrossRef] [Green Version]
  23. Hosseinpourpia, R.; Adamopoulos, S.; Mai, C. Dynamic vapour sorption of wood and holocellulose modified with thermosetting resins. Wood Sci. Technol. 2016, 50, 165–178. [Google Scholar] [CrossRef]
  24. Eslami, S.; Honarbakhsh-Raouf, A.; Eslami, S. Effects of moisture absorption on degradation of E-glass fiber reinforced Vinyl Ester composite pipes and modelling of transient moisture diffusion using finite element analysis. Corros. Sci. 2015, 90, 168–175. [Google Scholar] [CrossRef]
  25. Bonilla Mora, V.; Mieloszyk, M.; Ostachowicz, W. Model of moisture absorption by adhesive joint. Mech. Syst. Signal Processs. 2018, 99, 534–549. [Google Scholar] [CrossRef]
Figure 1. Representative stress–strain curves of the adhesives used for the project: SMP−adhesive and PU−adhesive.
Eng 04 00121 g001
Figure 2. Geometry of the coin sample (C sample).
Eng 04 00121 g002
Figure 3. Geometry of the thick adherend shear test (TAST) sample.
Eng 04 00121 g003
Figure 4. Procedure for evaluating the change in weight due to water diffusion in a climatic chamber at 40/60 and in outdoor weathering.
Eng 04 00121 g004
Figure 5. Procedure for investigating the environmental effects relevance on the mechanical properties.
Eng 04 00121 g005
Figure 6. 3D models for the diffusion simulations (a) TAST sample; (b) coin sample.
Eng 04 00121 g006
Figure 7. Saturation concentration for both adhesives—PU and SMP. Data from Wulf et al. [9].
Eng 04 00121 g007
Figure 8. Average concentration of the coin sample for both adhesives: 4 weeks (672 h) at 23/50 + 1 week (168 h) at 40/15 + 4 weeks (672 h) at 40/60.
Eng 04 00121 g008
Figure 9. Hourly average of air temperature (a) and relative humidity (b) from the weather station during outdoor weathering (262 days between 29 March 2021 and 16 December 2021).
Eng 04 00121 g009
Figure 10. Input data of saturation concentration during outdoor weathering for the PU (a) and SMP (b) adhesive (262 days between 29 March 2021 and 16 December 2021).
Eng 04 00121 g010
Figure 11. Weight measurements of the samples conditioned in the climatic chamber at 40/60 (PU−adhesive): (a) average weight of six samples, (b) change in weight.
Eng 04 00121 g011
Figure 12. Weight measurements of the samples conditioned in the climatic chamber at 40/60 (SMP−adhesive): (a) average weight of six samples, (b) change in weight.
Eng 04 00121 g012
Figure 13. Weather station data: daily average of air temperature and relative humidity over a period of 387 days (29 March 2021–20 April 2022).
Eng 04 00121 g013
Figure 14. Weight measurements of the samples conditioned during outdoor weathering (SMP−adhesive): (a) average weight of six samples, (b) weight change.
Eng 04 00121 g014
Figure 15. Weight measurements of the samples conditioned during outdoor weathering (PU−adhesive): (a) average weight of six samples, (b) weight change.
Eng 04 00121 g015
Figure 16. Comparison of the measured and simulated average weight for each adhesive (coin sample); (a) PU−adhesive and (b) SMP−adhesive.
Eng 04 00121 g016
Figure 17. Measured and FE-calculated average weight of the coin sample of the SMP (a) and PU (b) adhesive under outdoor weathering.
Eng 04 00121 g017
Figure 18. Correlation between average weight and saturation concentration in the coin sample: (a) PU−adhesive, (b) SMP−adhesive.
Eng 04 00121 g018
Figure 19. Calculated average concentration from the FE simulation of the conditioning of the TAST sample for SMP−adhesive (a) and for PU−adhesive (b) during outdoor weathering (387 days between 29 March 2021 and 20 April 2022).
Eng 04 00121 g019
Figure 20. Values of normalized concentration in the middle of the adhesive layer against the time of conditioning. In orange for PU−adhesive and in blue for SMP−adhesive.
Eng 04 00121 g020
Figure 21. Average weight of six TAST sample of (a) PU− and (b) SMP−adhesives as a function of conditioning time under re-drying at 40/15.
Eng 04 00121 g021
Figure 22. Shear stress–strain curves for the tensile shear test at RT of TAST samples at different conditionings: (a) PU–adhesive, (b) SMP–adhesive.
Eng 04 00121 g022
Figure 23. Shear modulus (a) and shear strength (b) from the tensile shear test on TAST samples for different conditionings.
Eng 04 00121 g023
Figure 24. Fracture patterns of the tensile shear tests on TAST samples of the PU–adhesive: with and without re-drying.
Eng 04 00121 g024
Figure 25. Fracture patterns of the tensile shear tests on TAST samples of the SMP–adhesive: with and without re-drying.
Eng 04 00121 g025
Figure 26. Number of cycles for fatigue cyclic testing of the TAST sample with different conditioning and R = 0.1.
Eng 04 00121 g026
Table 1. Mechanical properties of the aluminium joint EN AW 6082 (AlMgSi).
E [GPa]Tensile Strength [Mpa]Yield Point [Mpa]Elongation at Rupture [%]
703102606
Table 2. Diffusivity (diffusion coefficient) of water as a function of temperature for both adhesives. Data from Wulf et al. [9].
T [°C]Diffusivity PU–Adhesive [mm2/s]Diffusivity SMP–Adhesive [mm2/s]
00.024620.056361603
50.035230.070434496
100.049780.08733106
150.06950.107475942
200.095940.131334501
230.11580.147641408
250.1310.159413882
300.177050.19226387
350.236970.230477522
400.314220.274691558
450.412970.325586527
500.53820.383886745
Table 3. Saturation concentration in steady state for each conditioning.
Conditioning C ¯ P U C ¯ S M P
23/500.003699830.00719743
40/600.004750.00915
40/150.001143750.00208125
Disclaimer/Publisher’s Note: The statements, opinions and data contained in all publications are solely those of the individual author(s) and contributor(s) and not of MDPI and/or the editor(s). MDPI and/or the editor(s) disclaim responsibility for any injury to people or property resulting from any ideas, methods, instructions or products referred to in the content.

