Article

Maximum Power Point Tracking Implementation under Partial Shading Conditions Using Low-Cost Photovoltaic Emulator

1
Chair of High-Power Converter Systems (HLU), Technical University of Munich (TUM), 80333 Munich, Germany
2
Electrical Engineering Department, Faculty of Engineering, Assiut University, Assiut 71516, Egypt
3
Electrical Engineering Department, Faculty of Engineering, Menoufia University, Shebin El-Koum 32511, Egypt
*
Author to whom correspondence should be addressed.
Eng 2022, 3(4), 424-438; https://doi.org/10.3390/eng3040031
Submission received: 30 September 2022 / Revised: 20 October 2022 / Accepted: 25 October 2022 / Published: 27 October 2022
(This article belongs to the Section Electrical and Electronic Engineering)

Abstract

:
Maximum power point tracking (MPPT) is a pivotal objective for photovoltaic (PV) systems. To test various MPPT techniques, a reliable and effective PV emulator is required. Therefore, this article proposes a low-cost PV emulator for partial shading conditions, in which a cascaded structure of a DC power source with a resistor is constructed to generate the multiple peaks of the power-voltage (P-V) curve. The proposed structure is simple and modular. Consequently, it can be extended to obtain several peaks in the P-V characteristics to emulate more complex partial shading conditions. The partial shading occurrence over the PV source (PV array) causes a significant power loss production from the PV system. To increase the PV system’s efficiency, optimization techniques are employed to harness the global power. Accordingly, the particle swarm optimization (PSO) technique is used to track the global peak. Furthermore, the conventional perturb and observe (P&O) method is applied for comparison and investigation. The proposed PV emulation system is validated under different operating conditions using simulation and experimental hardware-in-the-loop (HIL) results.

1. Introduction

Renewable energy sources are becoming perfect alternatives for traditional fossil fuel-based ones. Currently, the policy of different countries is to minimize CO 2 emissions for a clean and sustainable environment [1,2]. Among renewable energy sources, photovoltaic (PV) energy is an interesting surrogate due to its numerous merits, which include silent operation, less maintenance, abundance, and approximately no emissions [3,4,5]. Therefore, the research in this area is an essential issue to develop and maintain the PV generation systems [6]. The PV source has a nonlinear characteristic, and therefore different models were employed in the literature for PV characterization [7,8]. Simplified, single-diode, and double-diode models are used to describe and characterize the behavior of the PV source [3]. The aforementioned models differ according to their accuracy, complexity of implementation, computational burden, and number of employed parameters [9,10].
The non-linearity of the PV source model necessitates the utilization of a maximum power point tracker (MPPT) to harness the maximum power [11,12]. The operation of the PV system in MPPT mode can be divided into two main methods, namely operation under uniform solar irradiation and partial shading conditions. The uniform solar radiation operation is well-known in the literature, where the power-voltage (P-V) characteristic exhibit only one peak, and therefore the function of the MPPT technique is to operate the system at this peak [13,14]. However, in practice, partial shading occurs over the widespread modules due to clouds or nearby buildings [4]. This, in turn, causes hotspots, which deteriorate the performance and power production [6,15]. To solve such an issue, bypass diodes are connected across the PV modules or panels [15,16]. Consequently, the P-V curve reveals multiple peaks, where one of them is global (the highest power) and others are local (small power in comparison with the global).
Considering the above, MPPT methods can be sorted into two groups or two main categories, where some methods are intended for uniform solar radiation, and other methods can track the global peak (under partial shading conditions) [14]. On one side, and popularly, the perturb-and-observe (P&O) and incremental conductance (INC) methods are implemented to extract the maximum power under uniform operating conditions [17]. These methods depend on the fact that the slope of the P-V curve is positive on the left side of the maximum power point (MPP) and negative on the right one. Therefore, they are easy to implement, where no parameters are needed for calibration [18]. On the other side, optimization techniques are used to search for the global power in case of partial shading occurrence. Various algorithms have been utilized to tackle this problem, where particle swarm optimization (PSO), simulated annealing, gray wolf optimizer, bat algorithm, etc. are employed for such purpose [17,19]. Such algorithms depend on the searching nature of the technique used, making them complex compared to P&O or INC. Furthermore, they require a powerful controller for implementation [20]. However, global power extraction is guaranteed in comparison with the traditional schemes. This maximizes the PV efficiency and power production.
Recently, PV emulators are gaining considerable attention. They are of great benefit when testing and evaluating the efficiency of the PV system. In addition, PV emulators help to simplify the test environment compared to on-site installations [21]. Different classifications were provided in the literature for PV emulators [3,6]. However, the most common type is the DC-DC converter-based emulator. According to this type, the emulation process consists of three parts [3,22]. Firstly, the utilized model of the PV source receives the feedback signals (measurements) and accordingly provides the reference value (voltage or current). Secondly, the control technique, where the control objectives (producing nonlinear I-V relations) are executed based on the reference. At last, the control actions are sent to the converter, where different converters are employed including buck and buck-boost converters [3,23]. The converter-based emulation system provides accurate characterization of the PV source [23]. However, its implementation cost is high. Other PV emulators are also used, including battery-based and analog PV emulators [6]. Such emulators are simple in structure and control principle. Furthermore, their execution cost is low [24]. However, the replicated characteristics are not accurate when compared to the converter-based schemes.
To this end, the authors are motivated to propose a battery-based emulator for partial shading conditions, using two or more cascaded units to emulate the occurrence of multiple peaks. The proposed emulator is simple, cost-effective, and can be extended to emulate complex partial shading conditions. For better evaluation, two MPPT techniques are used to test the PV emulator and extract the maximum power from it, namely P&O and PSO. The P&O method is notorious for not being able to track the global maximum and being easily trapped at a local maximum. However, the PSO algorithm is able to harness the global maximum power. The validity of the suggested PV emulator is proven using experimental hardware-in-the-loop (HIL) results under different PV system configurations. Furthermore, analysis and investigation of the P&O and PSO MPPT techniques are provided. In brief, the main contributions of the present work are summarized as follows:
  • A cascaded structure of a battery-based PV emulation system is suggested for the partial shading conditions. Therefore, complex partial shading conditions can be easily represented.
  • Maximum power extraction employing the P&O and PSO techniques.
  • Experimental HIL verification of the proposed PV emulator and the MPPT operation.
The rest of this article is arranged as follows: The model of the PV system and the proposed PV emulator are described in Section 2. The maximum power point tracking process is discussed in Section 3, where the P&O and PSO algorithms are considered for implementation. Section 4 provides the simulation results for characterizing the PV source. Additionally, the MPPT is involved in the same section. Experimental assessment is given in Section 5. More complex partial shading conditions are presented in Section 6. Comments on the failure of the P&O technique are also included in this part. Finally, the conclusion is presented in Section 7.

2. The Model of the PV Source and Proposed Emulation System

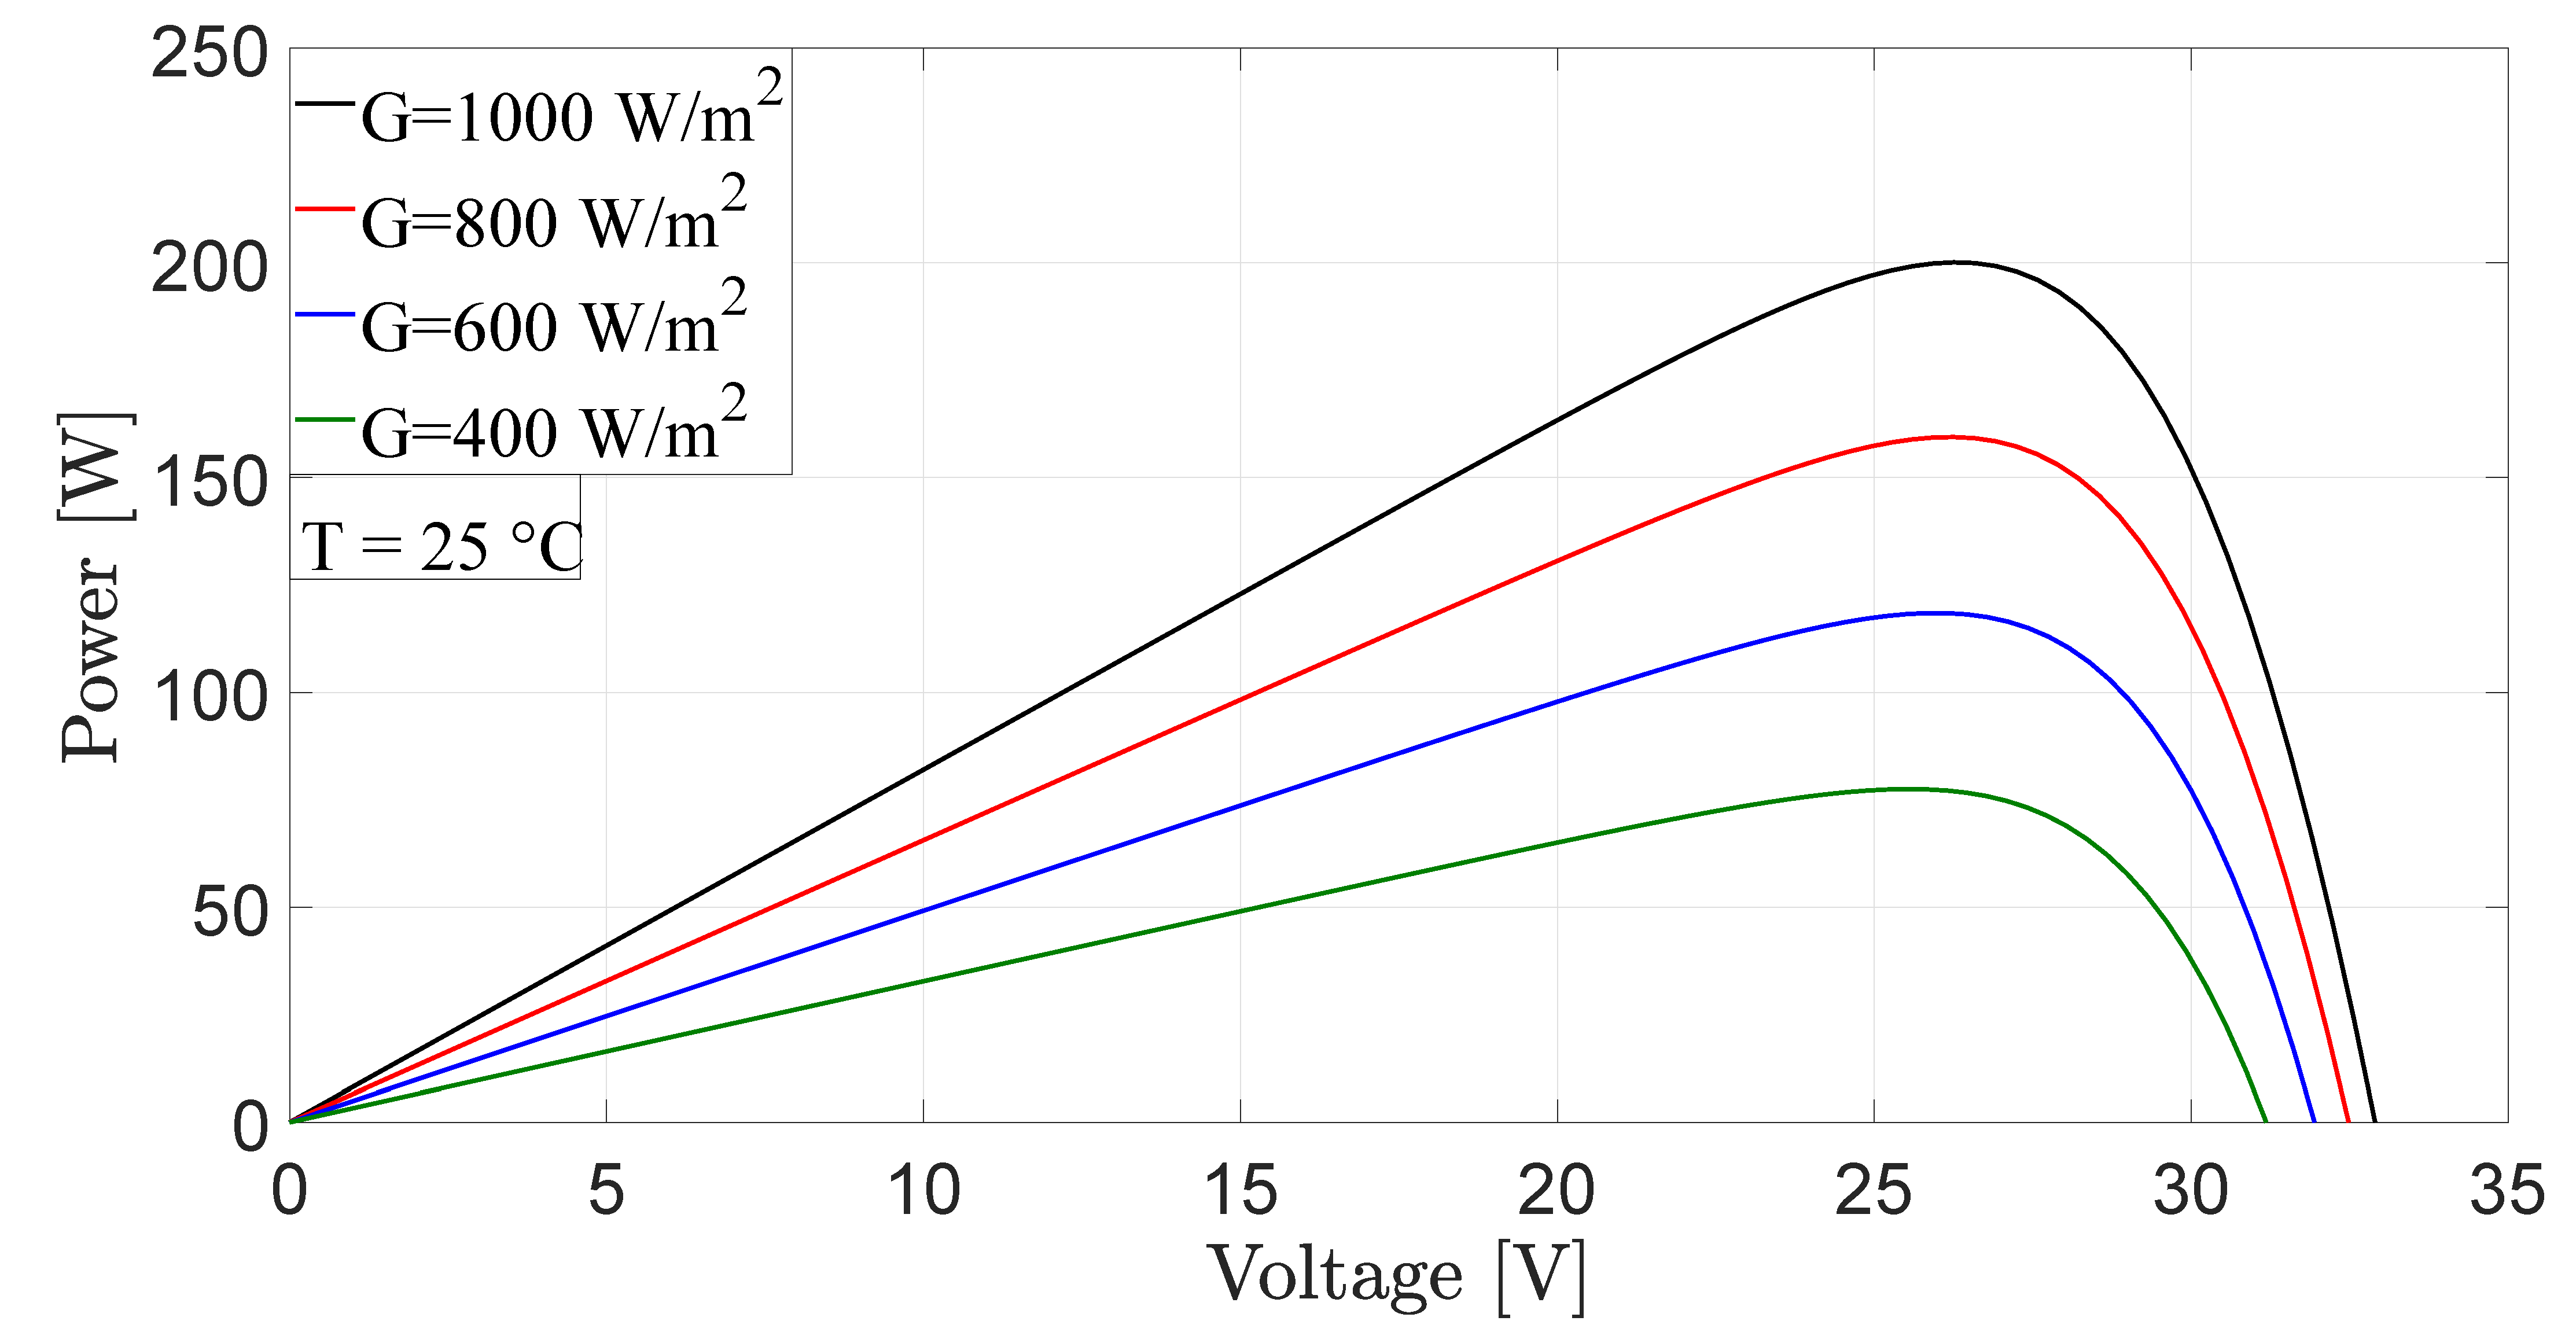
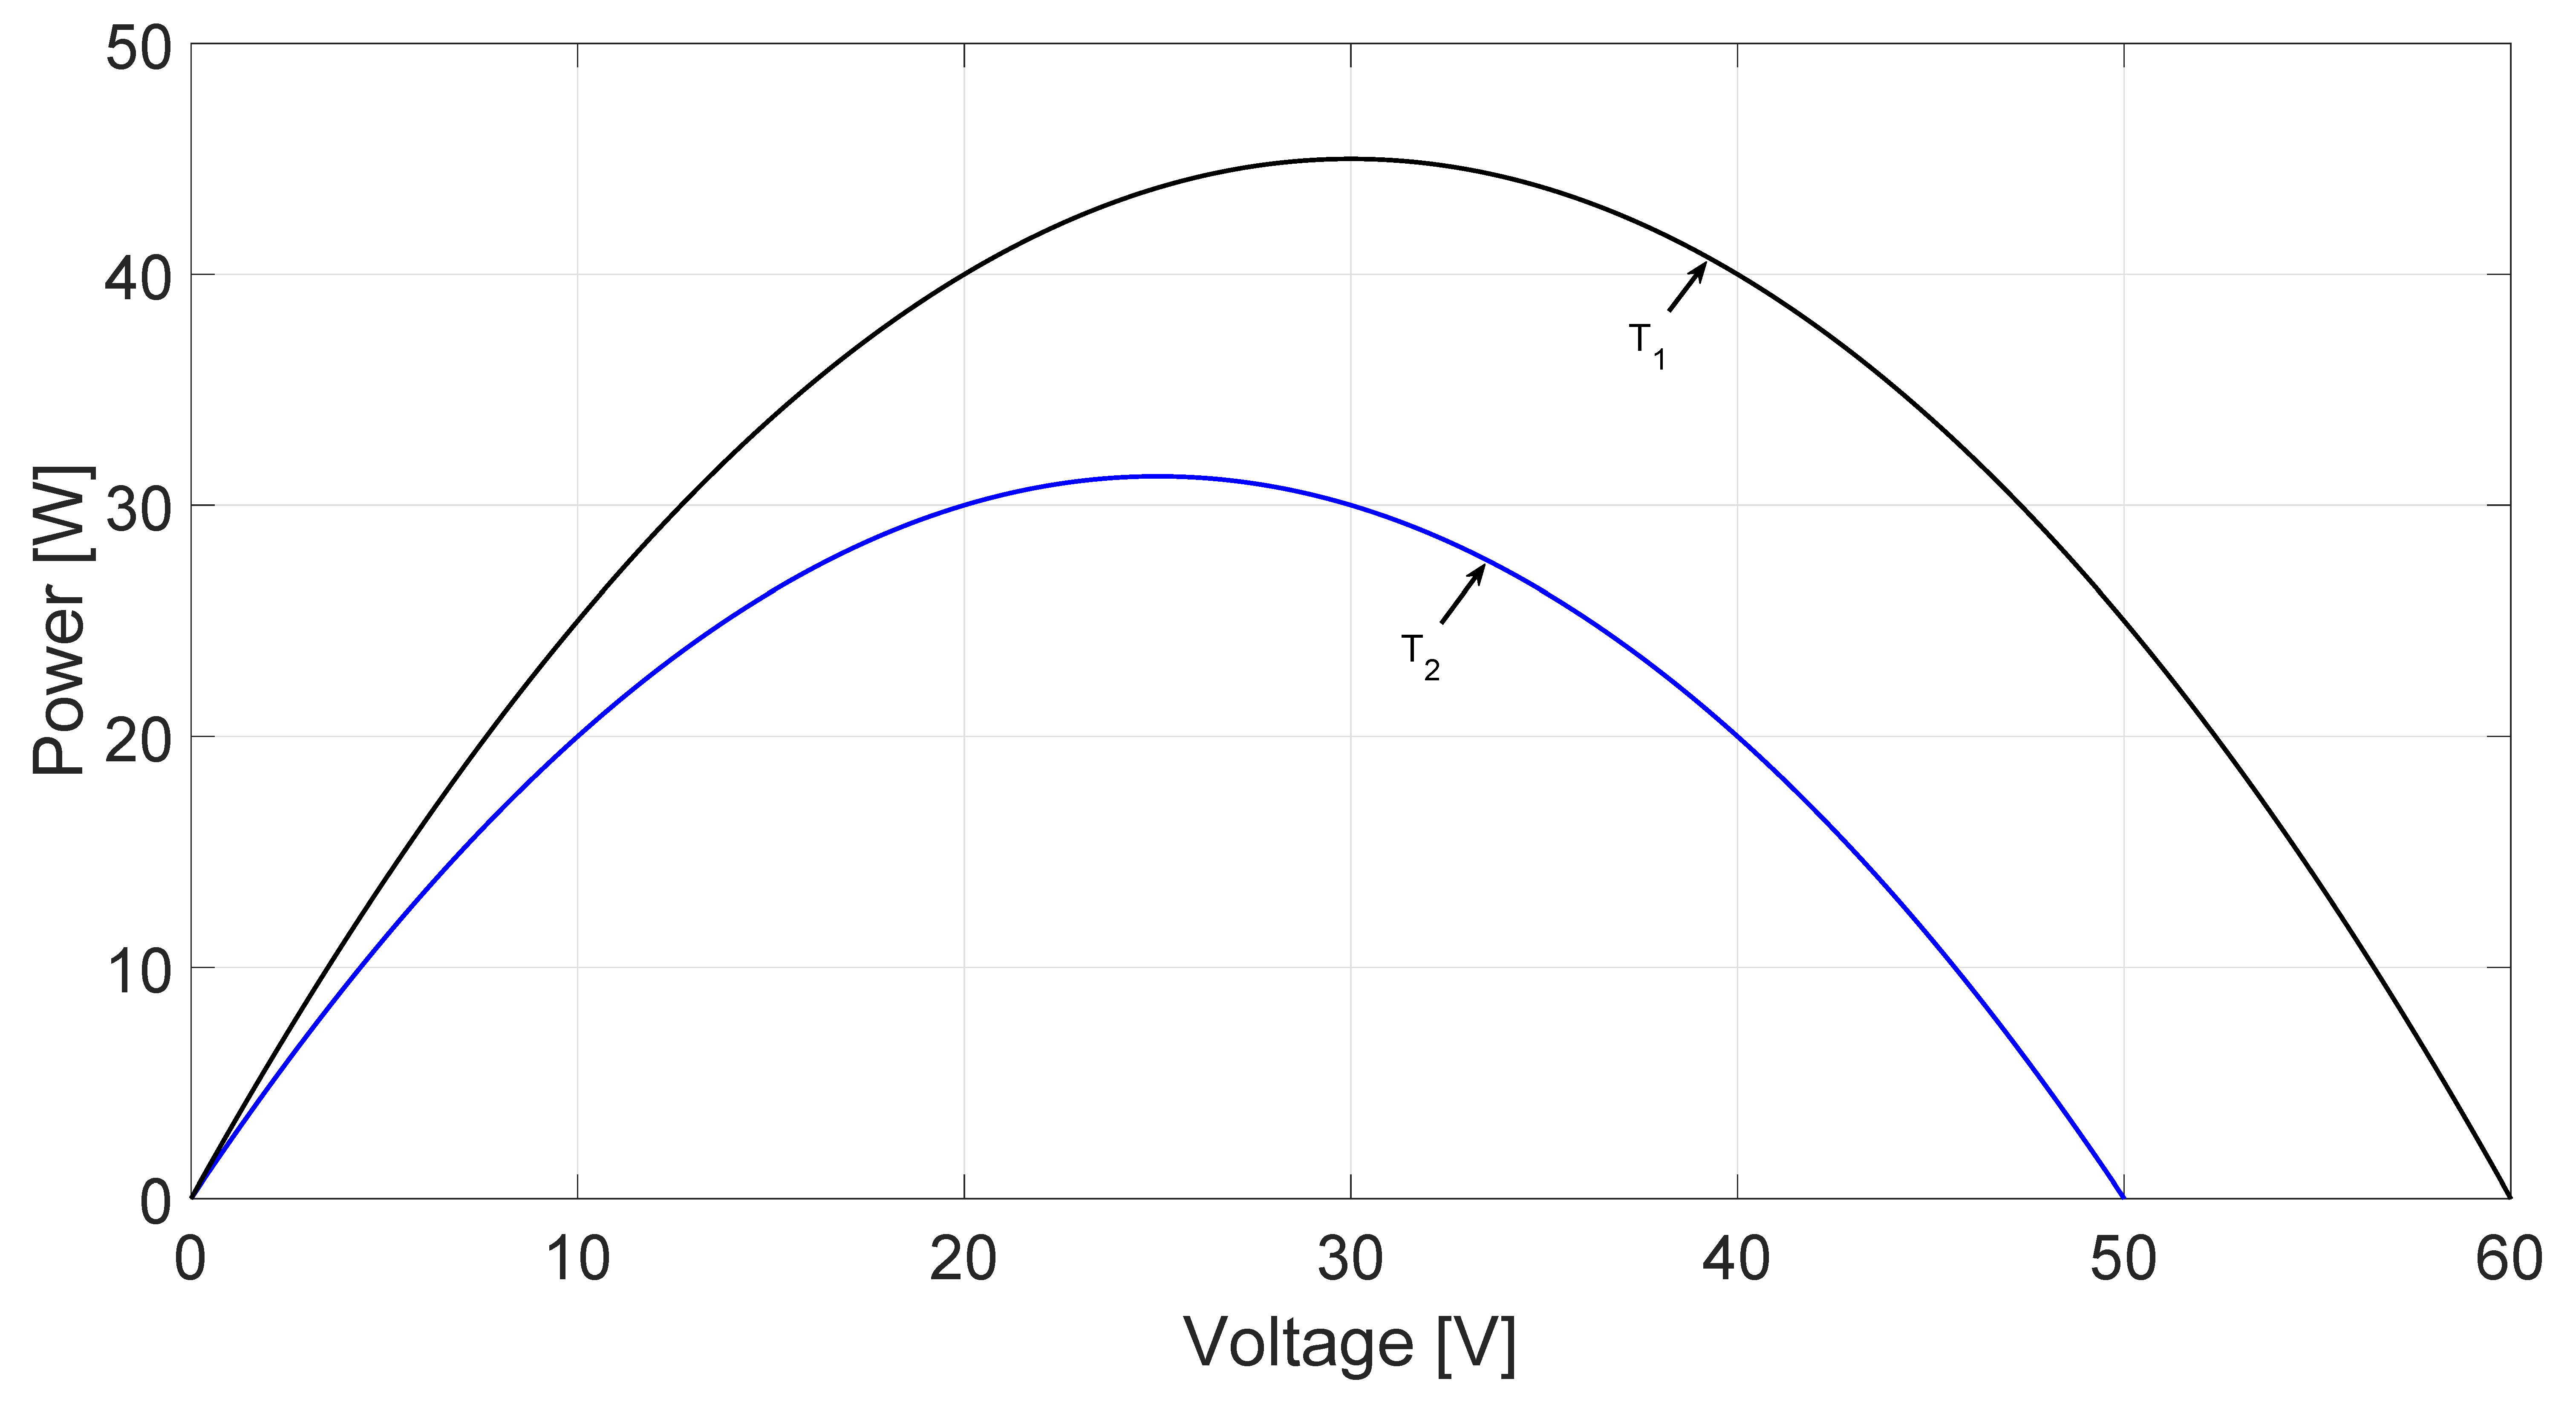
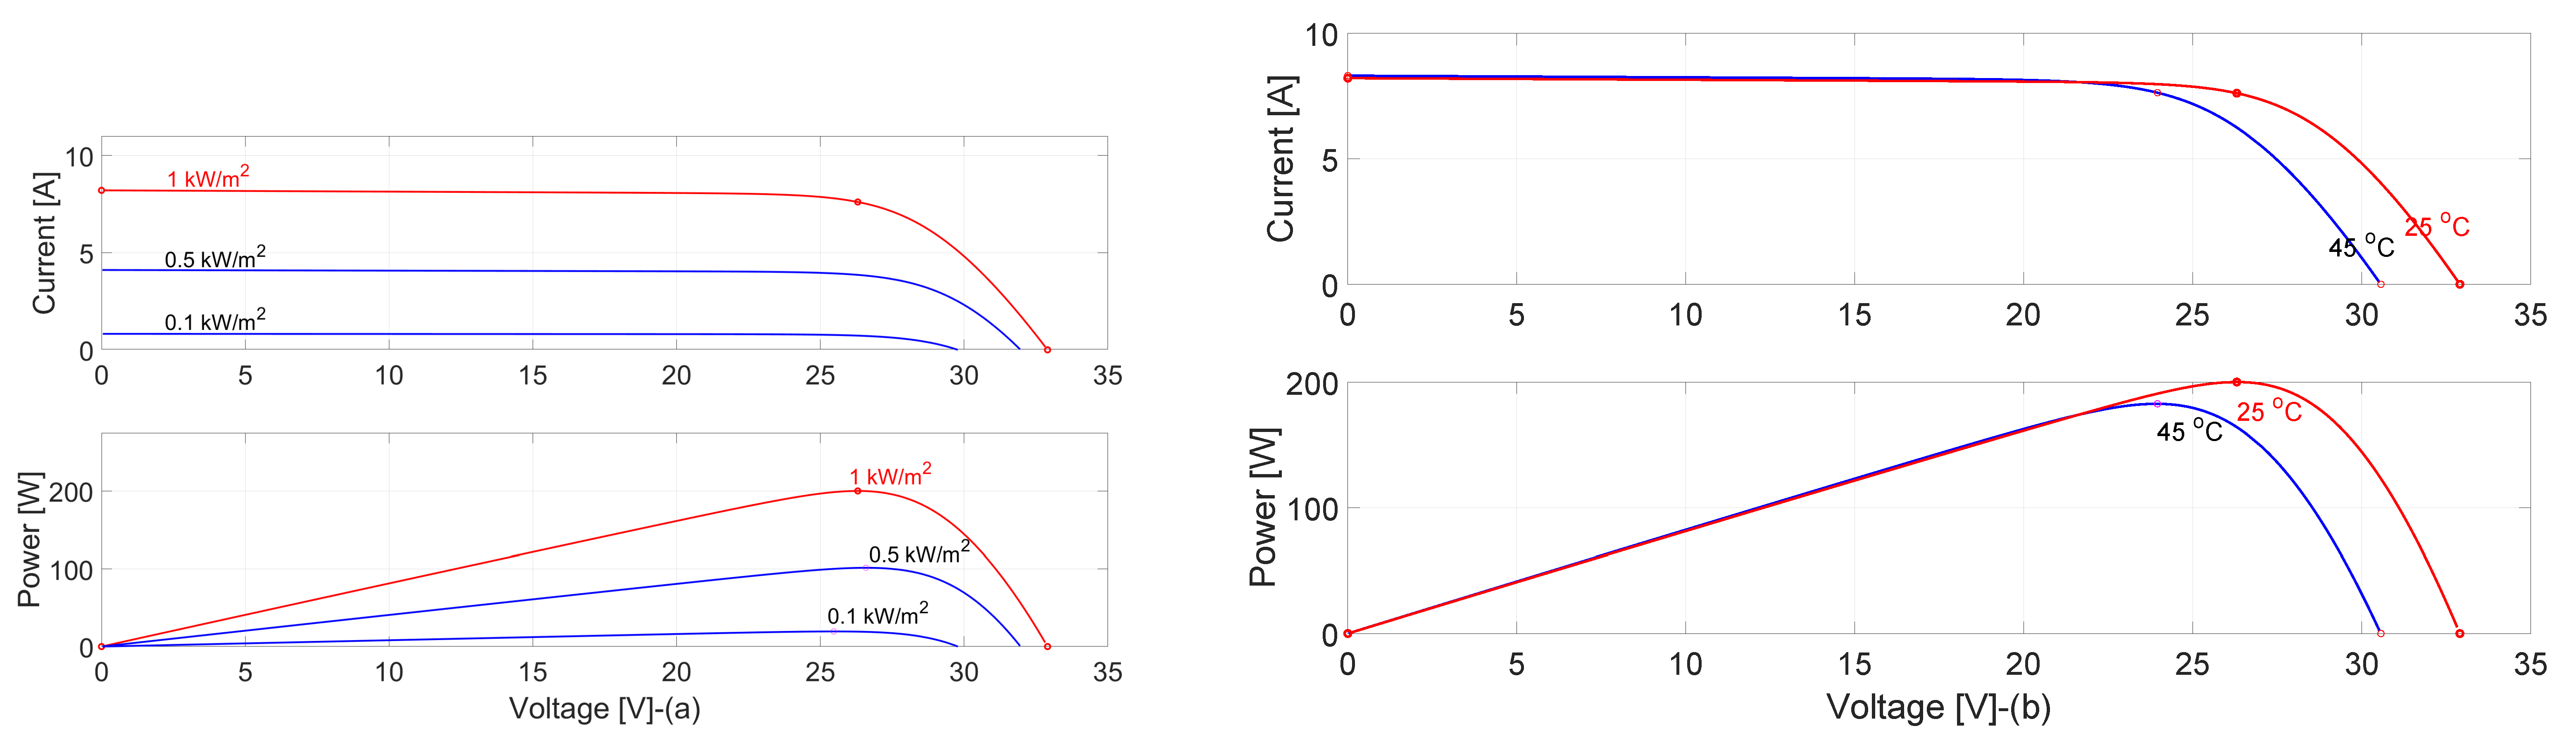
2.1. PV System Model

Different models are available in the literature to describe and characterize the behavior of the PV source. However, the PV source model is not used in this study. It is important to introduce it to know the main differences and analogies between this model and the PV emulator. The single-diode model gives a good compromise between accuracy and complexity. Therefore, it is used to describe the PV source’s performance. The I-V characteristics of this model are given by [6,25]
i p v = i p h i o [ e ( v p v + i p v R s n N s v t ) 1 ] v p v + i p v R s R s h ,
where i p h is the photovoltaic current, i o is the saturation current of the diode, n is the ideality factor, R s is the series resistance, v t is the thermal voltage, R s h is the shunt resistance, N s is the number of cells in the module, i p v is the output current, and v p v is the output voltage.
The P-V characteristics of the PV source according to this model are shown in Figure 1. These characteristics are drawn under uniform solar radiation conditions, where one can notice that the P-V curve at certain solar radiation has only one peak. However, under partial shading conditions, the solar radiation distribution becomes nonuniform, which means multiple peak occurrences in the P-V characteristics. An example of the characteristic of two series-connected modules is clarified in Figure 2, where two cases are shown. The first case indicates that the utmost peak is on the left side (or the first one from the left), while the second case shows that the global peak occurs on the right side.

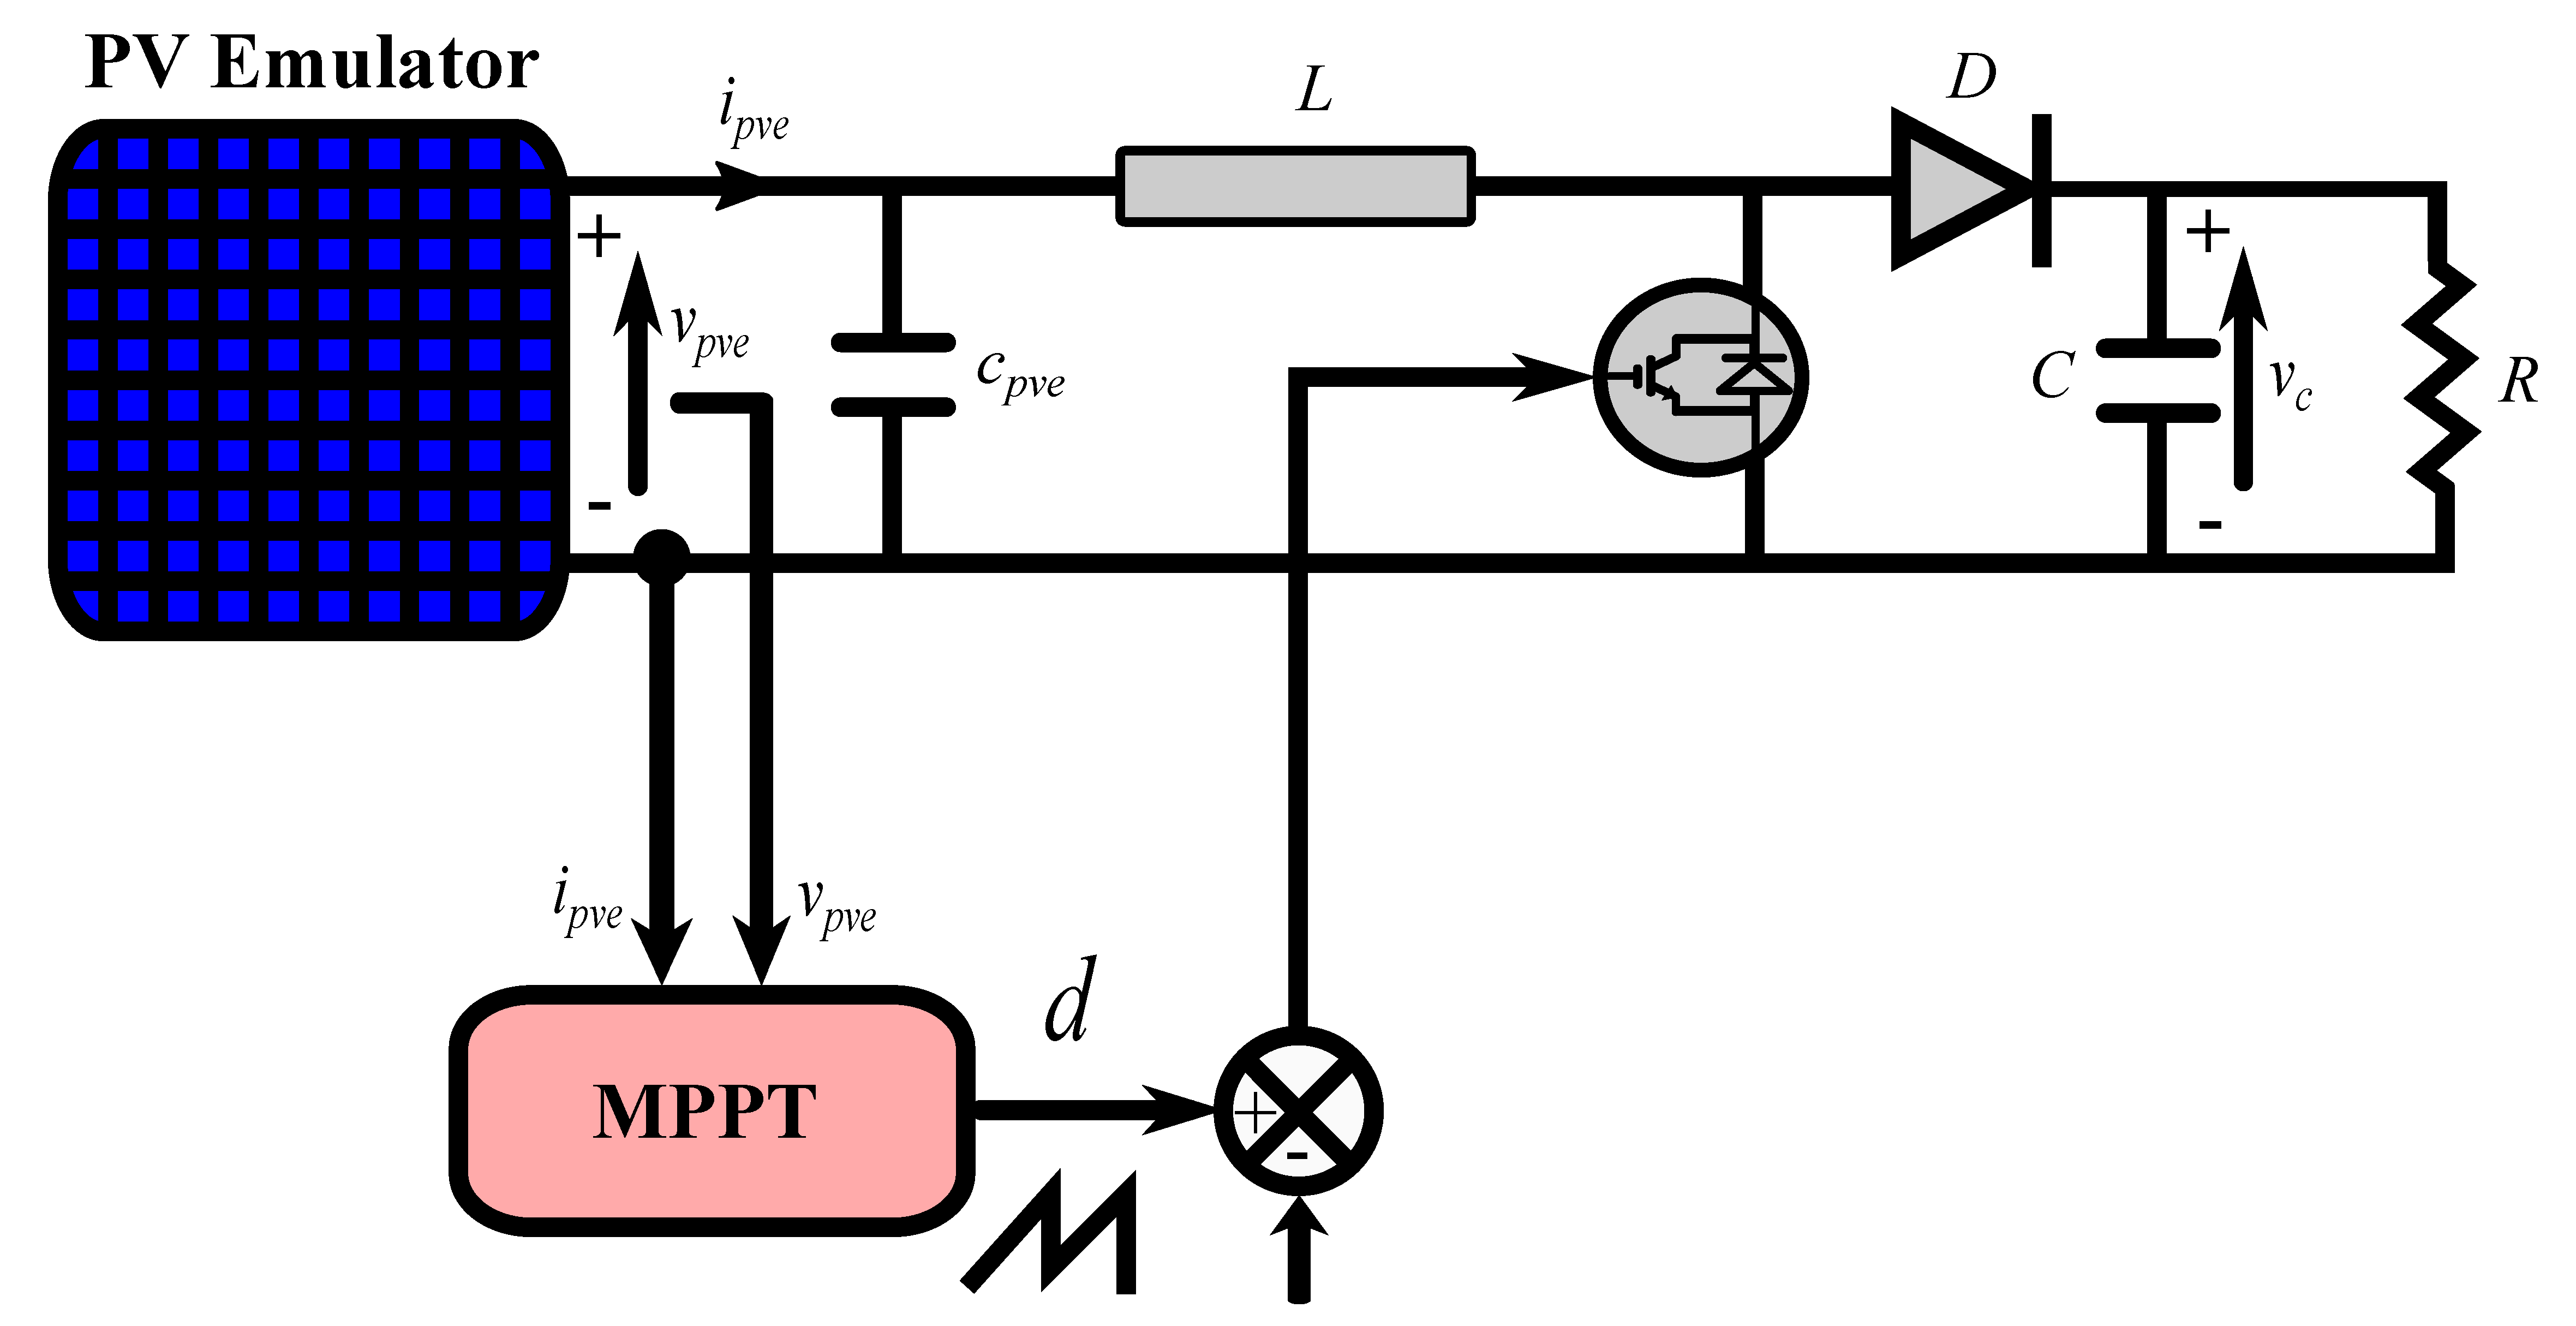
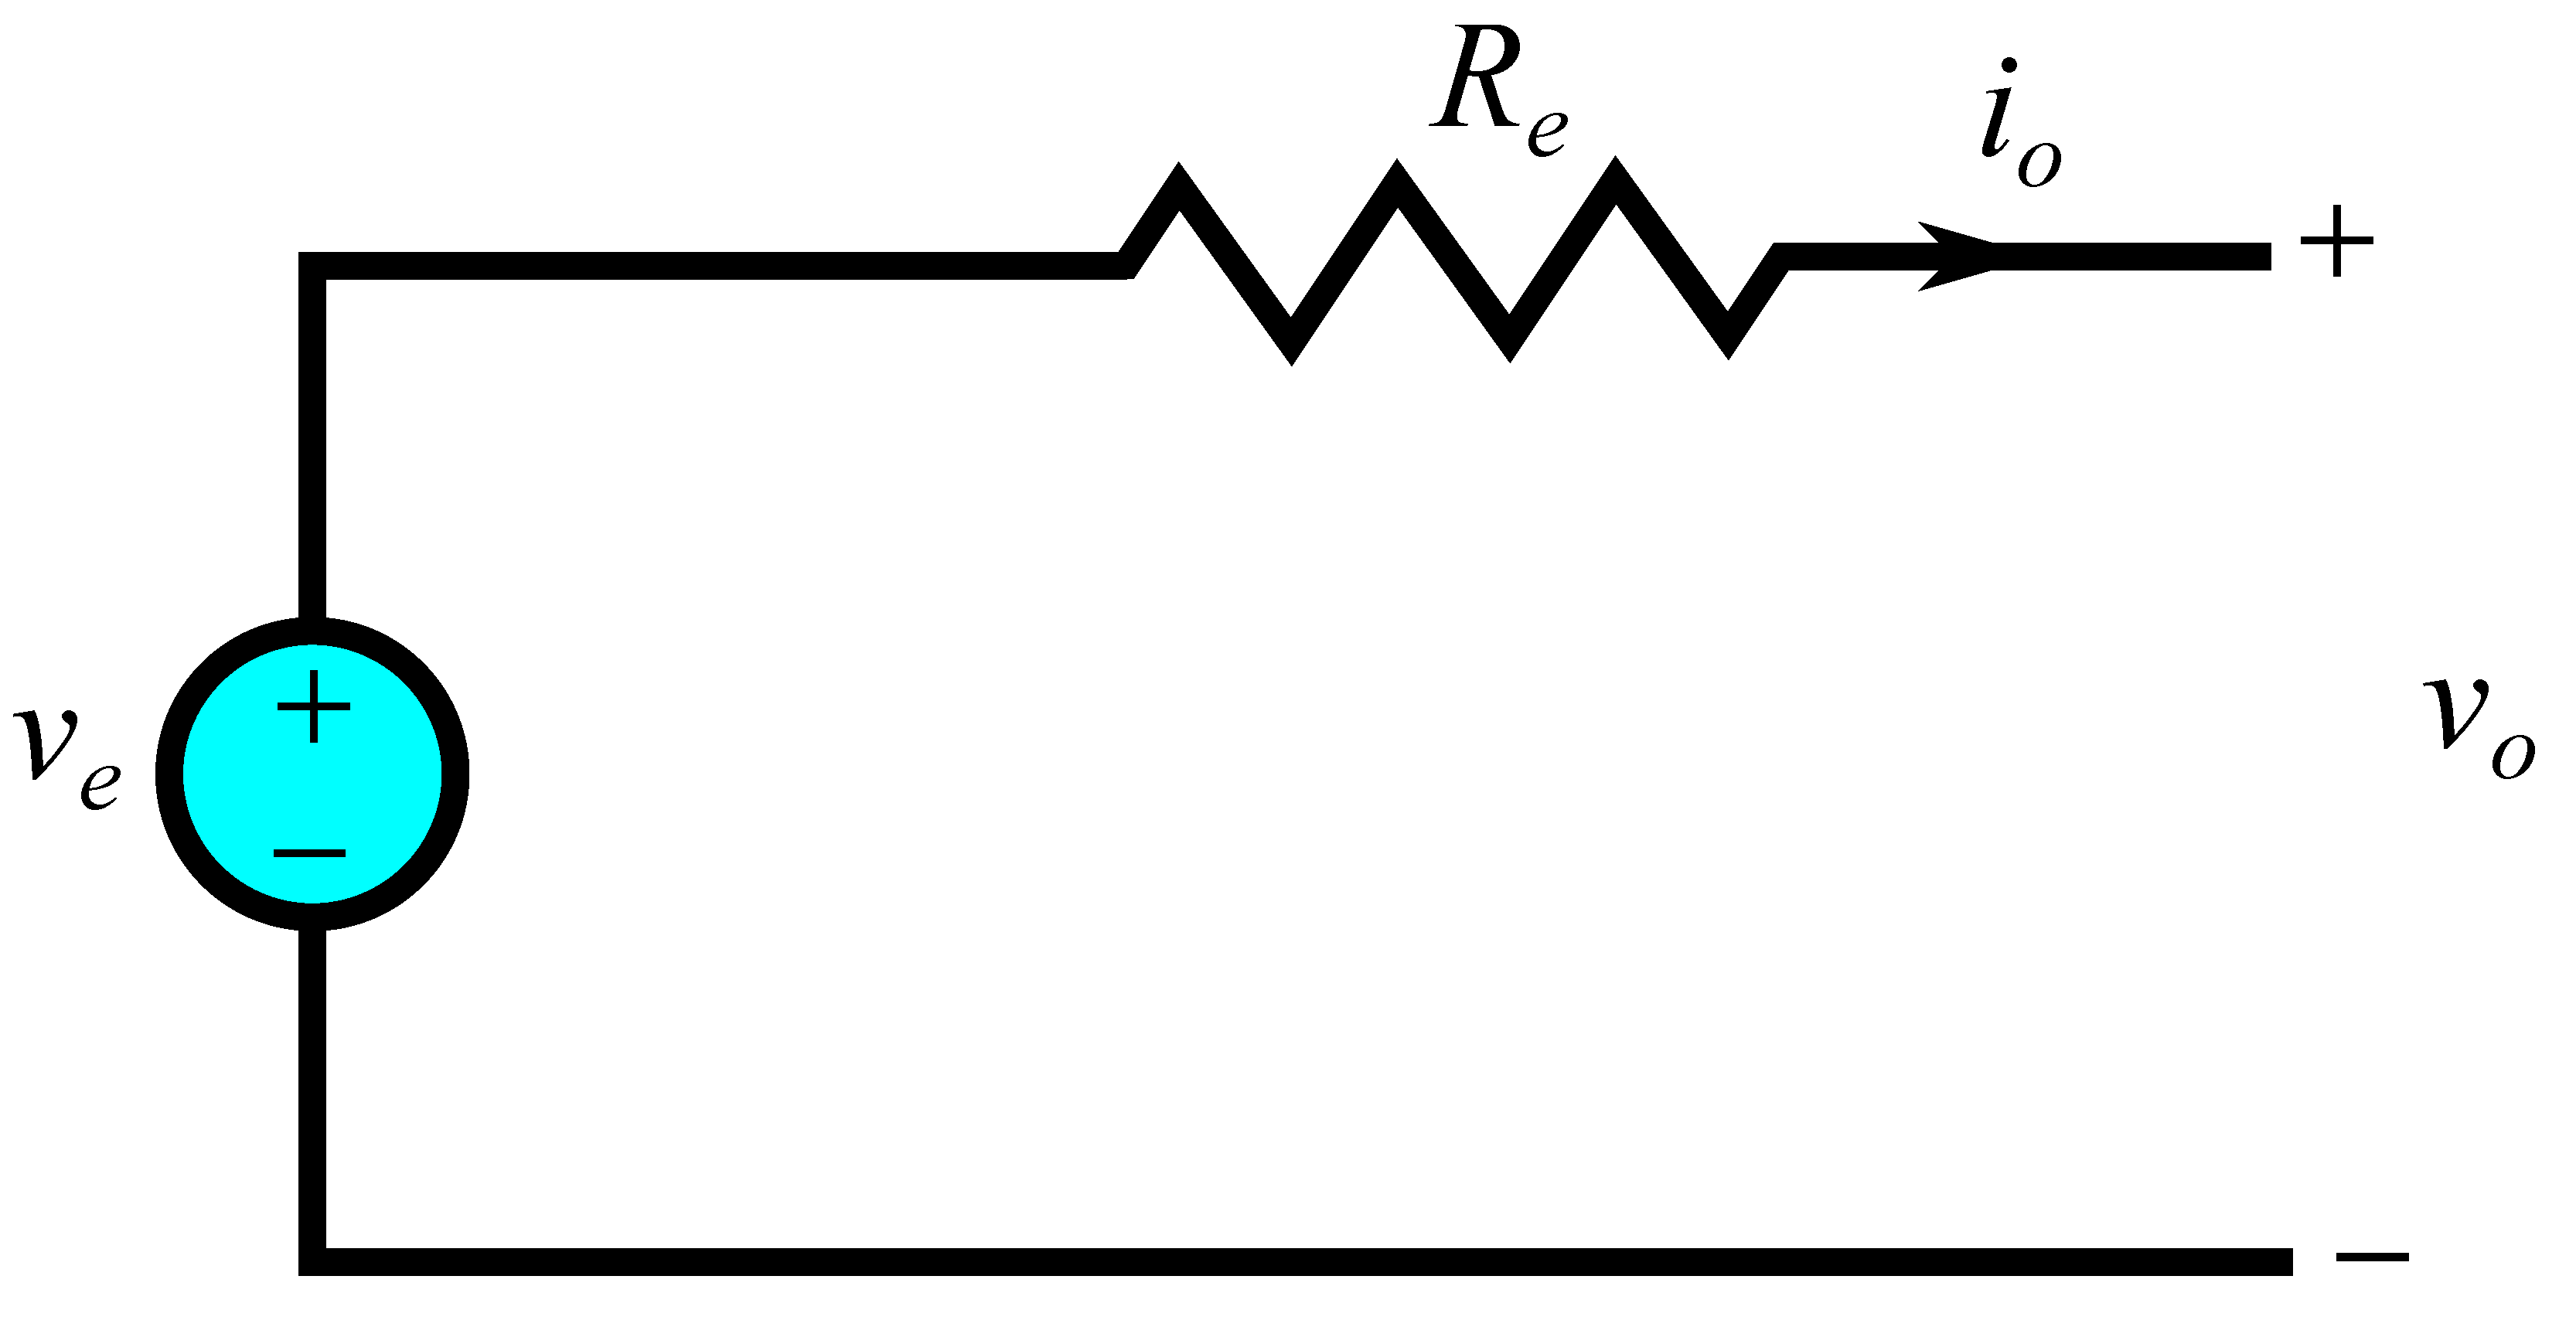
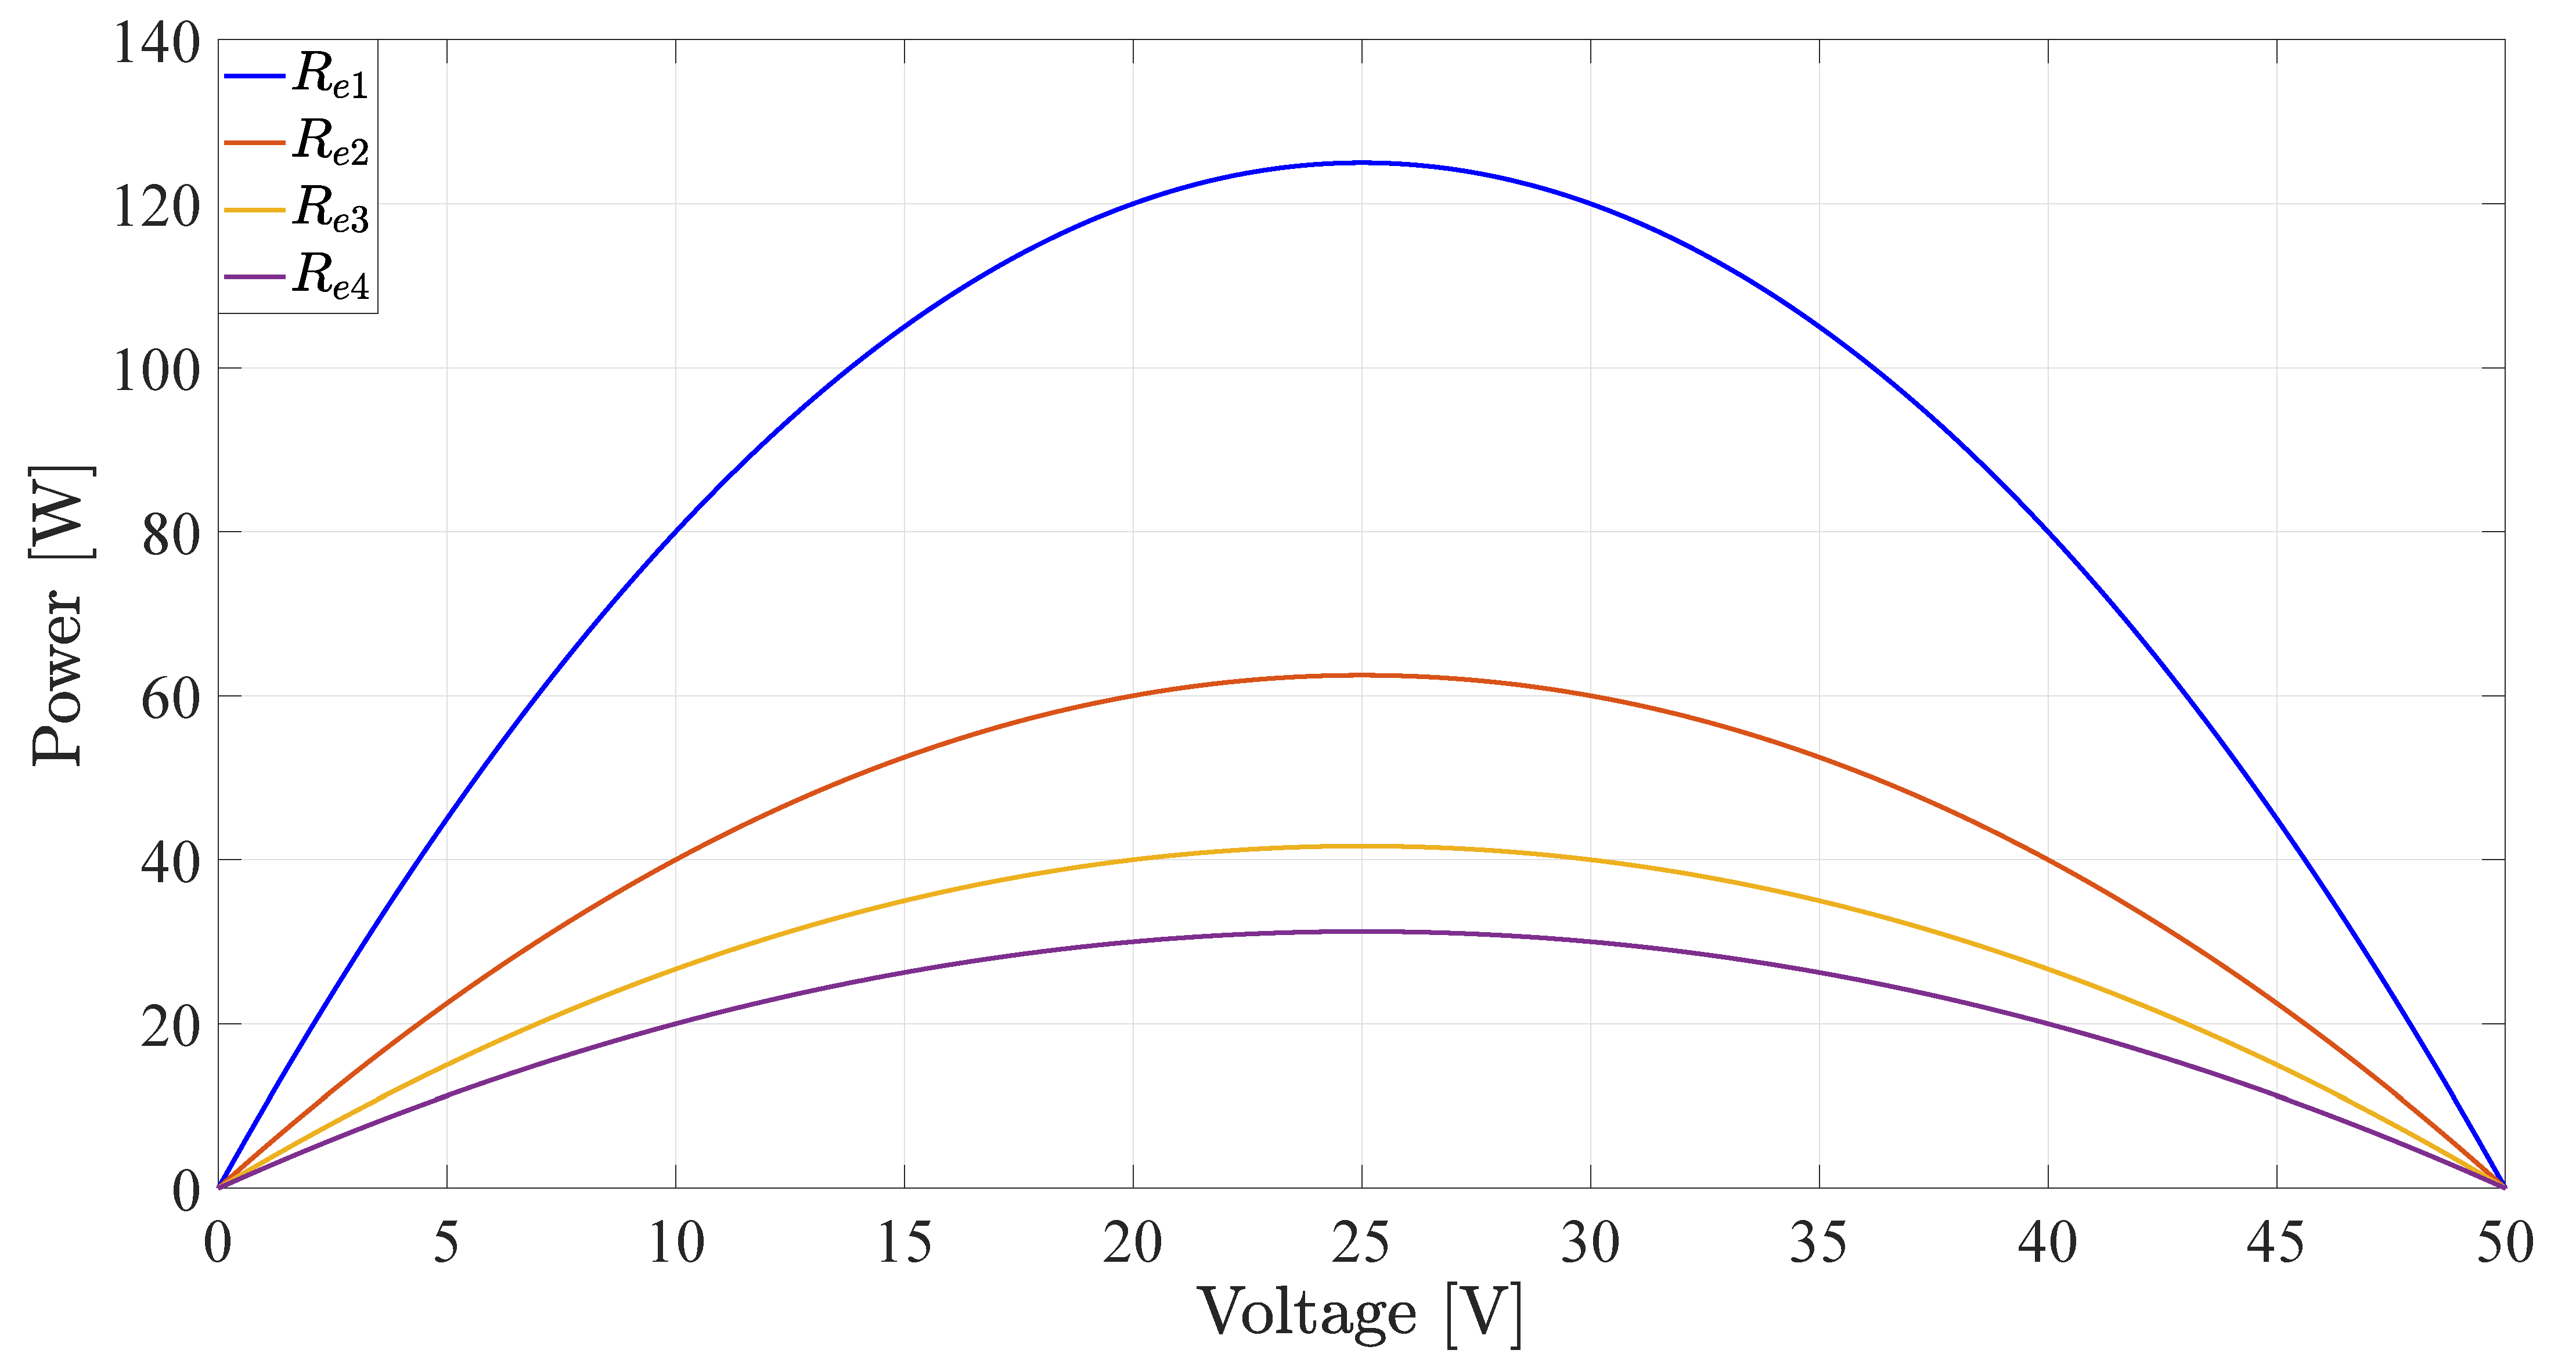
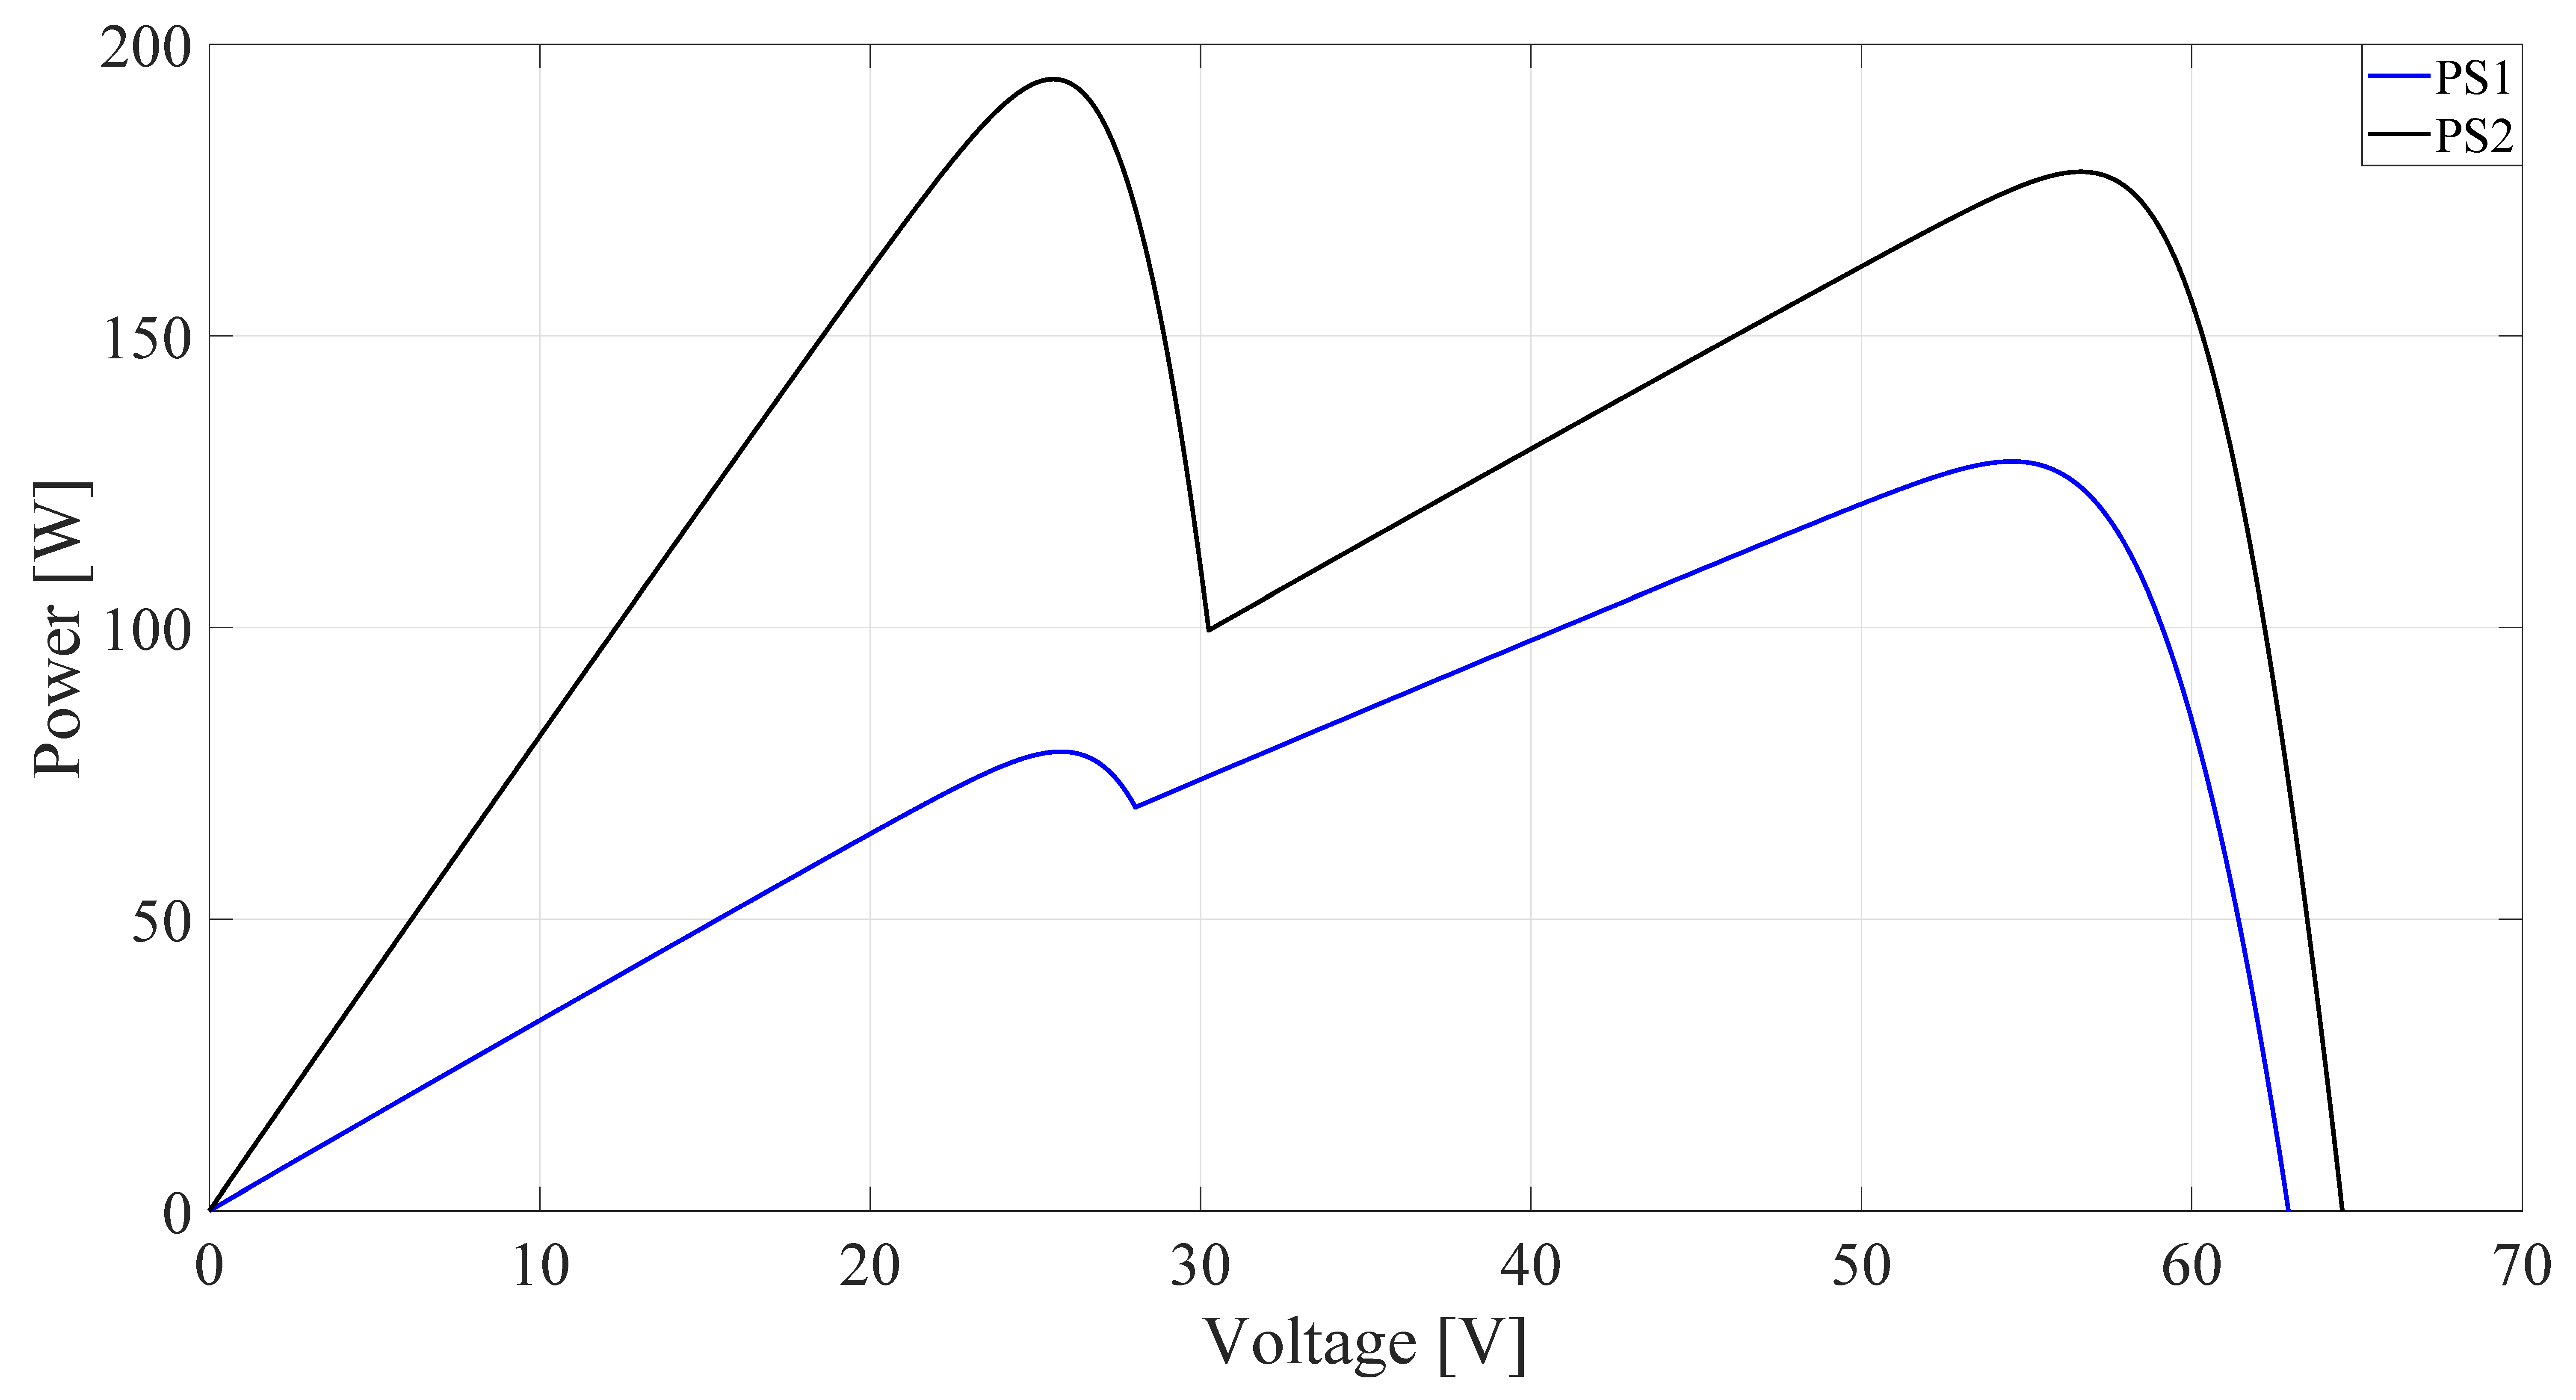
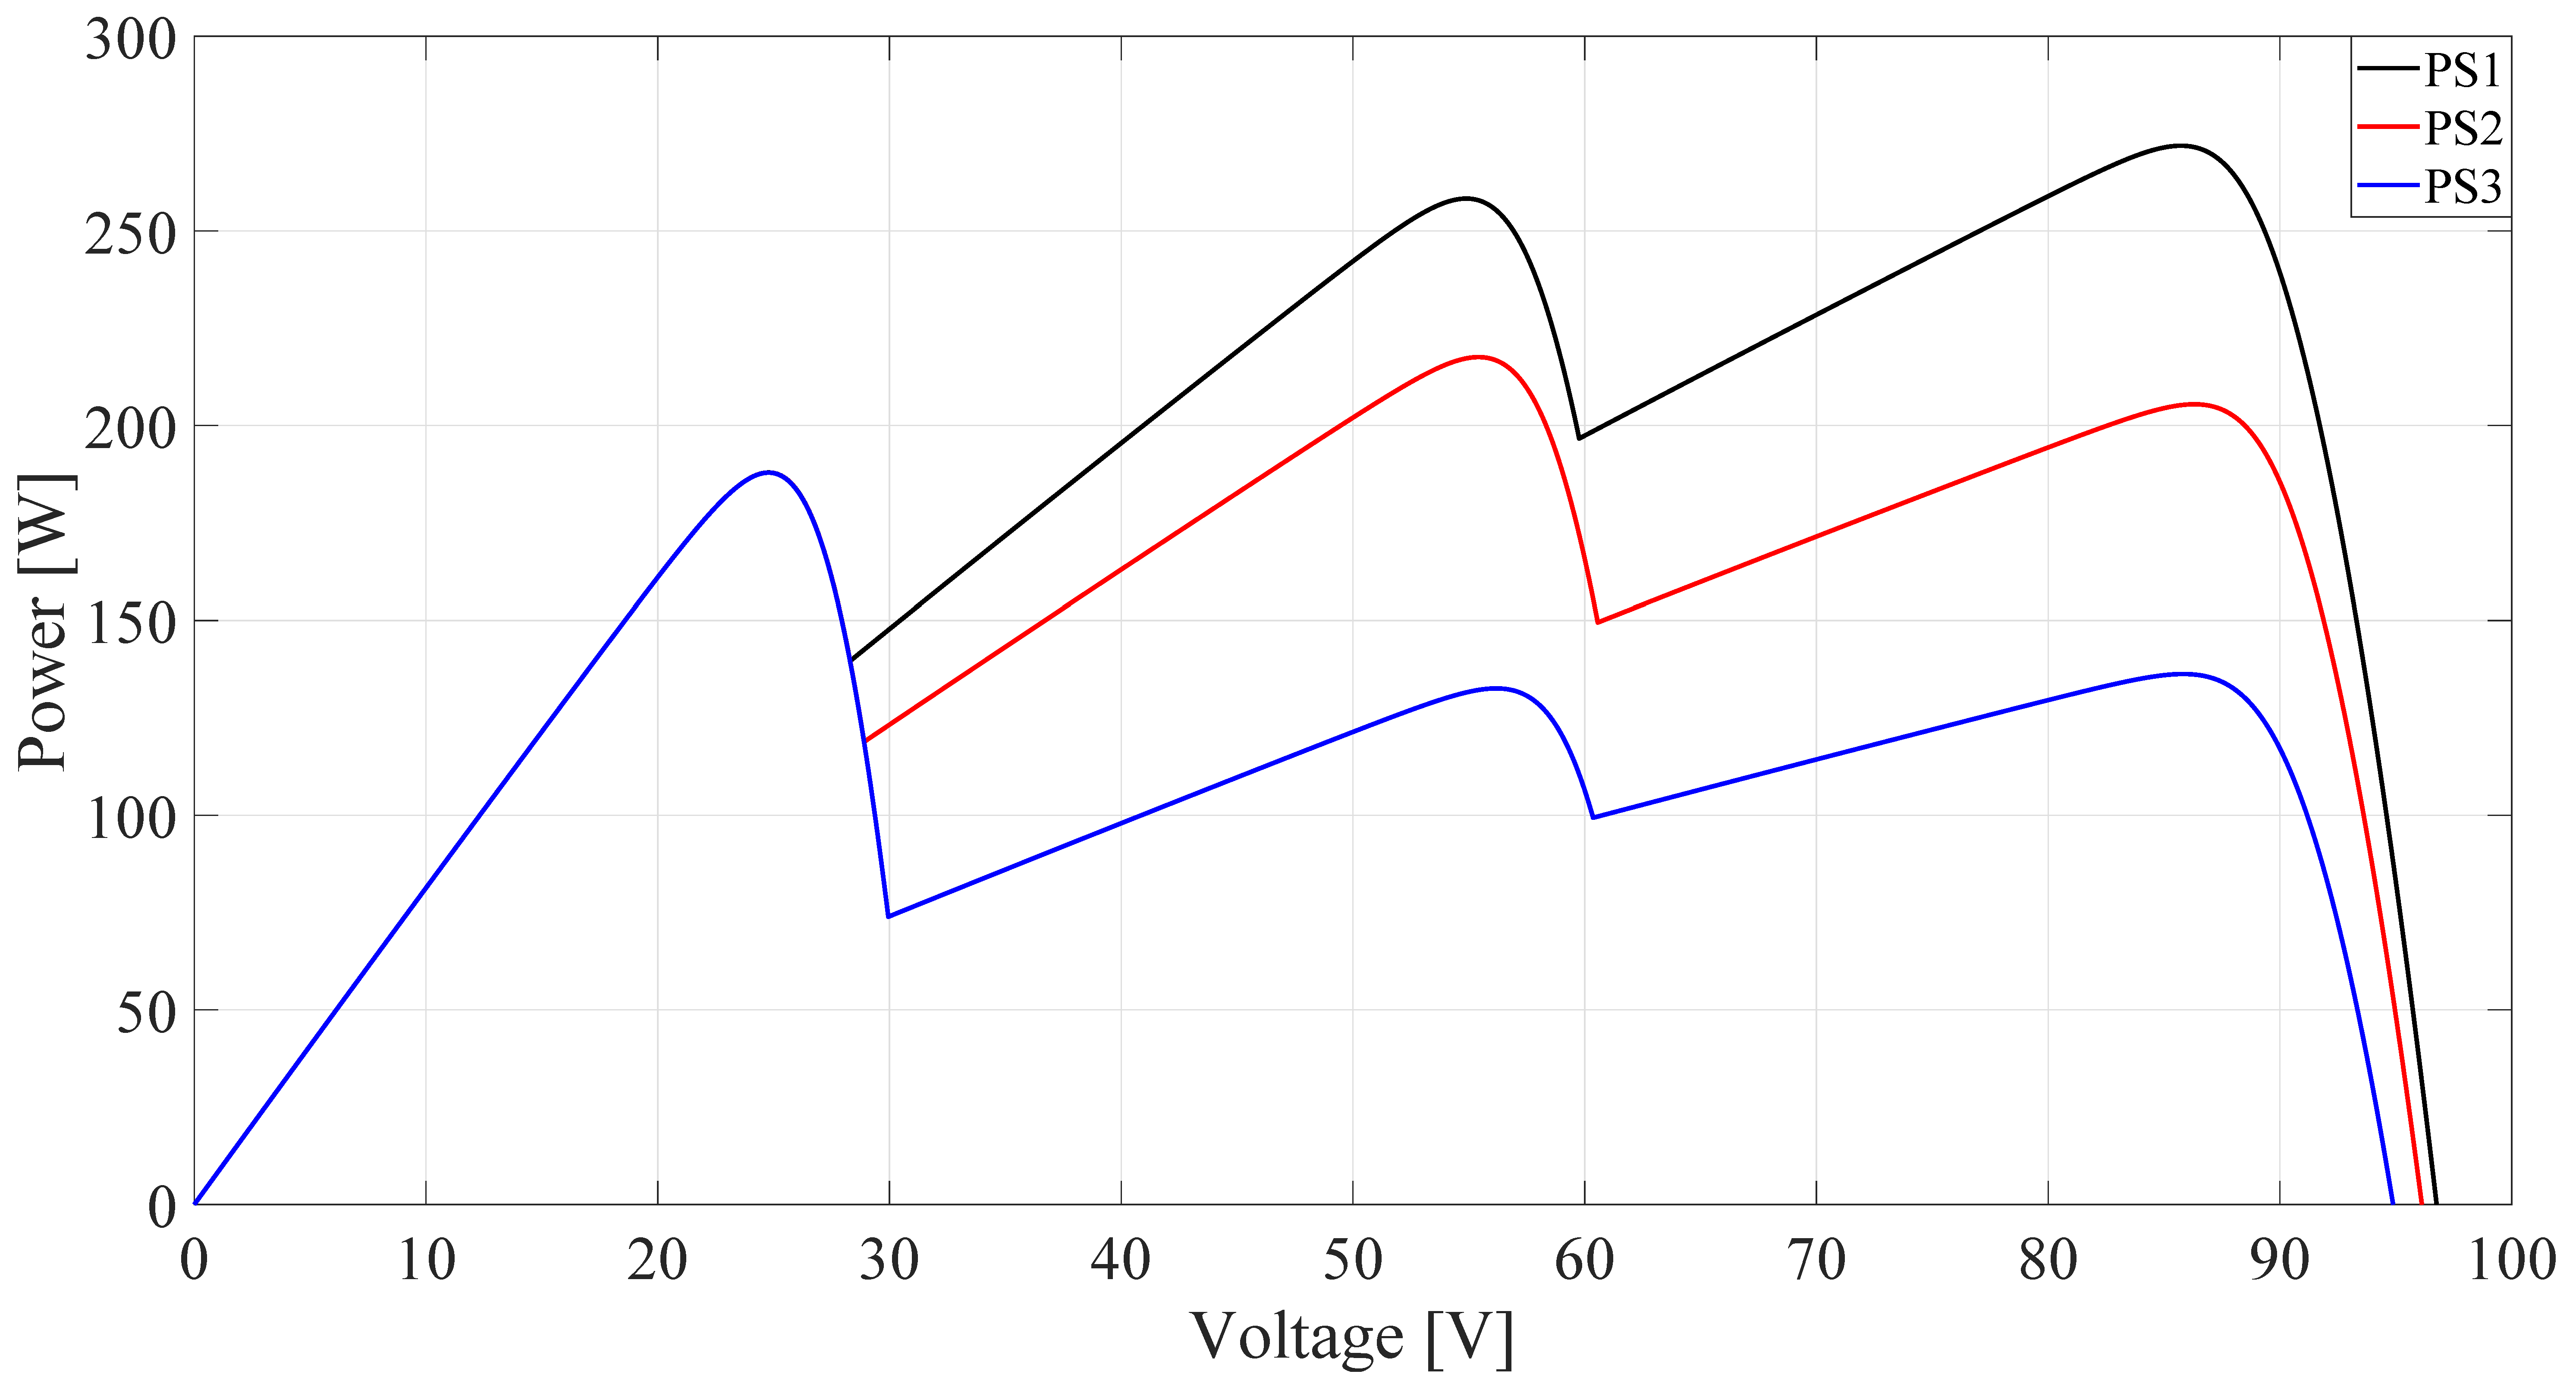
2.2. The Proposed PV Emulator

The suggested PV emulator is a battery-based type, in which a DC source is connected in series with a resistor as clarified in Figure 3. The behavior of this circuit is simply formulated as
i o = v e v o R e ,
The characteristics of this emulation system can be represented at different power levels by changing the value of the series resistance, which is considered a simple analogy for the solar radiation variation in the real PV source. The PV current variation is proportional to the solar radiation change. Thus, by varying the emulator resistance, the current is shifted, giving similar behavior to solar radiation variation. Hence, the characteristics of the emulator at different power levels are shown in Figure 4.
Similar to the real PV installation, the authors propose a cascaded structure with bypass diodes of the battery type emulator to imitate the case of partial shading conditions. Figure 5 shows two cases of partial shading using the cascaded structure of the emulator, where the location of the global peaks is on the left and the right sides.
Further investigation is given to the characteristics of the emulator in comparison with the real PV source. From Figure 1, the slope of the P-V curve is steeper on the right side of the MPP. However, for the emulator (Figure 4), the P-V curve slope is similar on both sides of the MPP. The voltage of the maximum power points (MPPs) is limited to a narrow range in the case of the PV generator. However, the MPPs’ voltage is constant in the proposed emulator. The open-circuit voltage changes when the solar radiation changes. Specifically, a logarithmic relation describes the variation of the open-circuit voltage with the solar radiation [26,27]. The open-circuit voltage of the PV emulator is constant.
Despite the dissimilarities of the characteristics between the emulator and the PV source, the battery-based emulator provides sufficient characteristics to test the MPPT, especially for partial shading conditions, where the produced characteristics are not so different from the real PV system. Furthermore, more complex configurations can be achieved by rearranging the emulator units in series and parallel, which makes it flexible and effective to test the algorithm in a simple manner. Moreover, the optimization algorithm, which is intended for global power tracking, is more concerned with the global peak location rather than the shape of the characteristics.

3. Maximum Power Point Tracking Based P&O and PSO Techniques

3.1. The Perturb-and-Observe Method

The P&O method is well-documented and known in the literature. It has a very satisfactory performance under uniform solar radiation conditions. However, under partial shading conditions, the P&O is easily trapped at a local maximum. It is included here for the purpose of validation and comparison. The performance of the P&O technique depends mainly on the P-V characteristics. The slope of these characteristics is positive on the left side of MPP and negative on the right side. According to the literature [28,29], the optimum performance of the P&O occurs when three steps operation is achieved at steady-state. Therefore, the P-V curve at such condition is shown in Figure 6.
To understand the three steps operation shown in Figure 6, suppose that the initial operating point is point 1. The operating principle of the P&O depends on perturbing the voltage in one direction and inspecting the behavior of the power. Therefore, assume that the voltage is increased. Thus, the operating point is directed to point 2. It can be noted that the PV power is increased as a result of the voltage increase. Therefore, the voltage will be increased again to track the ultimate maximum. Currently, the operating point is 3. However, it is obvious that the power is decreased after this perturbation (this increase of the voltage). Consequently, the perturbation direction will be reversed and the operating point is directed back to point 2. Following this manner, the operating voltage will oscillate in a three-level operation. To be specific, the working path is from point 1 to point 2 and then point 3, and the reverse direction from point 3 to point 2 to point 1.

3.2. The Particle Swarm Optimization Algorithm

Particle swarm optimization is a meta-heuristic algorithm which is inspired by the movement of the bird flocks during the search for food. The PSO technique incorporates a group or swarm of individuals (called particles), where each particle is considered a potential solution for the optimization problem (global maximum extraction in our case) [30,31]. Therefore, the particles are initiated randomly in the search space and the particle that get the highest amount of food will provide other particles with information about the location of the food. Consequently, and based on the new information, the particles change their movement to allocate the best or optimum place for feeding [32]. This mechanism can be used to harness the global power from the PV system under partial shading conditions. The optimization problem can be simply clarified following these steps [32,33]:
1
The duty cycle is chosen to represent the particles in this formulation, and therefore, they get random values in the beginning. It is worth mentioning that the duty cycle value is bounded between 0 and 1.
2
The values of output power corresponding to the duty cycles are collected and compared together. Thus, the one (duty cycle) with the highest power will attract other particles to its position. Therefore, the position of the particle is influenced by the best particle in the neighborhood.
3
During its journey, the particle will save the best value obtained. This value (power) is called the best private or p b e s t . Furthermore, the best solution obtained from all particles in the entire population is called the global solution ( g b e s t ).
4
Mathematically, the path ( v i ) or movement speed of each particle (represent the step size) to its new position is updated from
v i k + 1 = w v i k + c 1 r 1 ( p b e s t , i d i k ) + c 2 r 2 ( g b e s t d i k ) ,
where w is the inertia weight, c 1 and c 2 are the acceleration factors, p b e s t , i is the personal best solution of particle i, g b e s t is the global best position of the particles, r 1 and r 2 are random numbers, and k is the iteration number.
5
The new position or duty cycle ( d i ) is simply the addition of the velocity to the current position as
d i k + 1 = d i k + v i k + 1 .

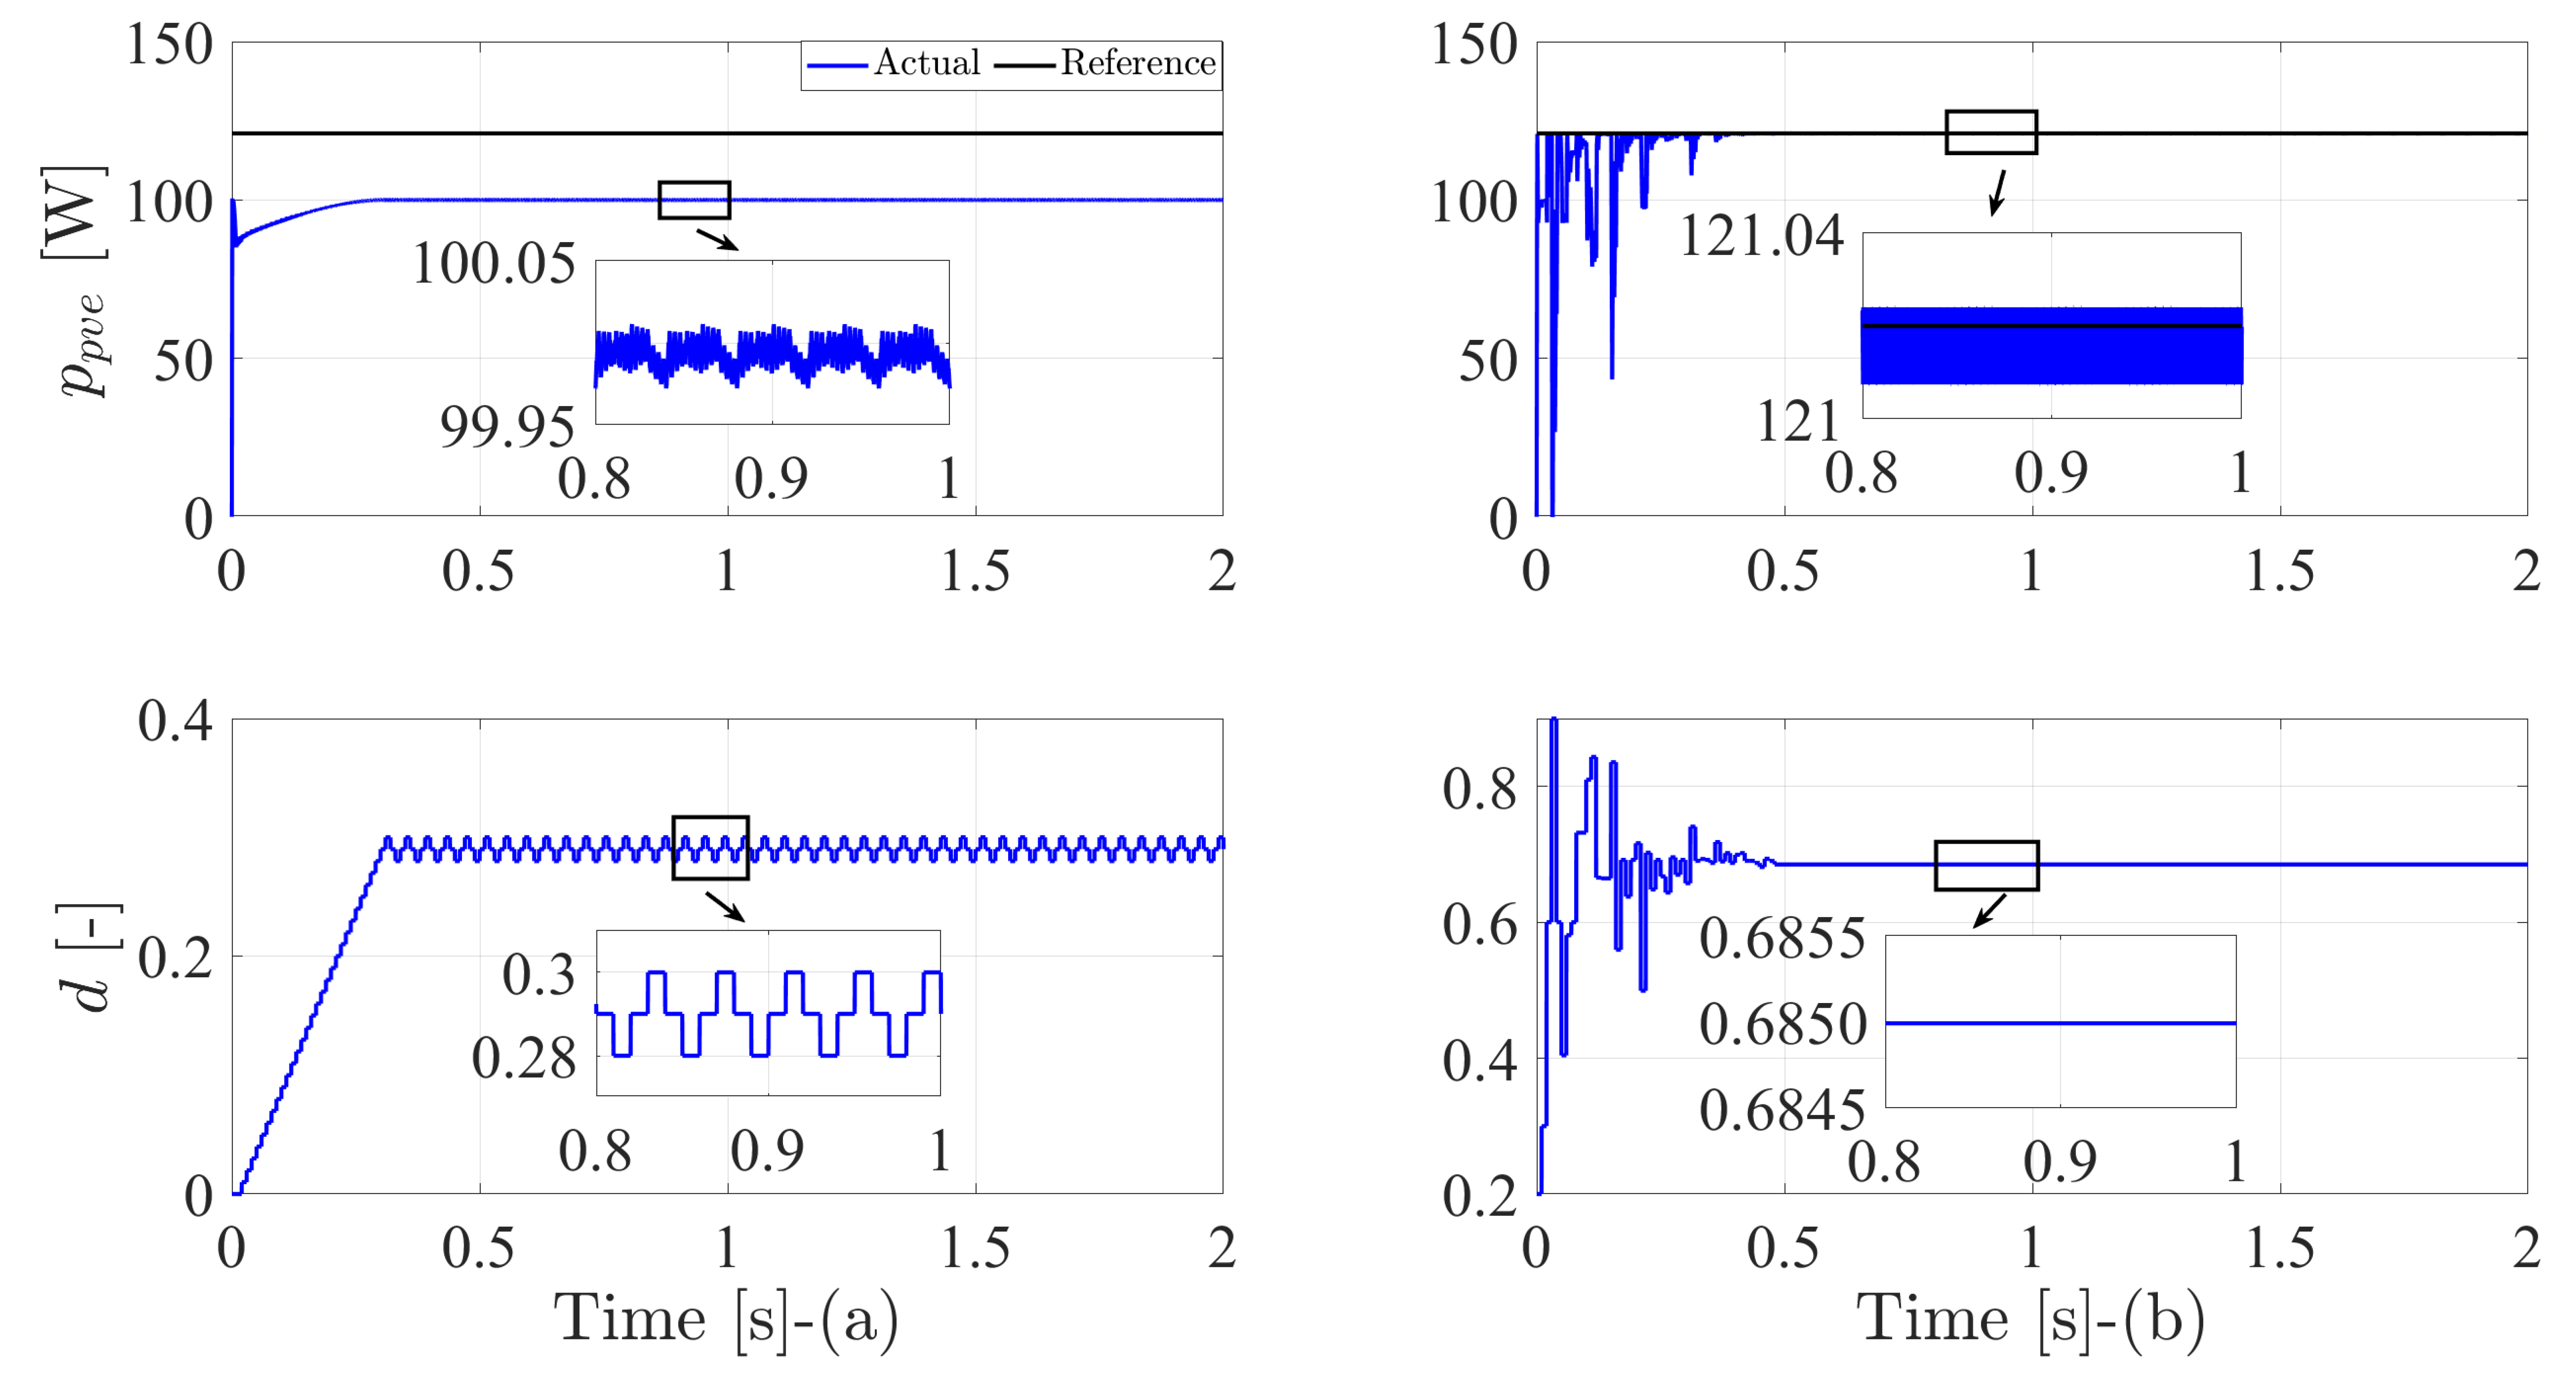
4. Simulation Results

The considered system for MPPT implementation is composed of a PV emulator, boost converter, and resistive load. Figure 7 shows the configuration of the studied system. The boost converter interfaces the load with the emulator such that the maximum power can be tracked. At steady-state, the behavior of the boost converter is described by
v c v p v e = 1 1 d ,
where v p v e is the emulator output voltage, v c is the capacitor output voltage, and d is the duty cycle of the boost converter. Furthermore, Table 1 gives the parameters of the system.
Figure 8 illustrates the behavior of the P&O and PSO techniques, where the power ( p p v e ) and duty cycle are shown. The global peak in this case study occurs on the left side (see Figure 5a). The emulator resistances to achieve this condition are 20 Ω and 5 Ω . The parameters of the PSO method used during the validation are w = 0.4 , c 1 = 1.025 , and c 2 = 1.025 . From Figure 8, it is obvious that the P&O technique is trapped at a local maximum. Furthermore, it is working according to the three-level operation. However, the PSO succeeded to harness the global maximum, thanks to the searching nature of this technique. Therefore, the duty cycle of the PSO method is approximately constant, which reflects on the power oscillations. Regardless of the failure of the P&O technique to track the global maximum, its power oscillation is higher when compared to the PSO method. Moreover, and due to the searching mechanism, the PSO algorithm has a slower starting transient behavior compared to the P&O method. It is worth mentioning that the P&O method may track the global maximum accidentally. However, this is more dependent on the global peak location [34]. Furthermore, the initial condition contributes to the failure rate of the P&O scheme. Table 2 summarizes the average efficiency of the two techniques under such partial shading condition. The average efficiency is calculated according to [35]
η p v , a v g = P m p p t ( t ) d t P r ( t ) d t × 100 ,
where P m p p t is the extracted maximum power using a specific MPPT method, and P r is the reference power (from the data-sheet).

5. Experimental Evaluation

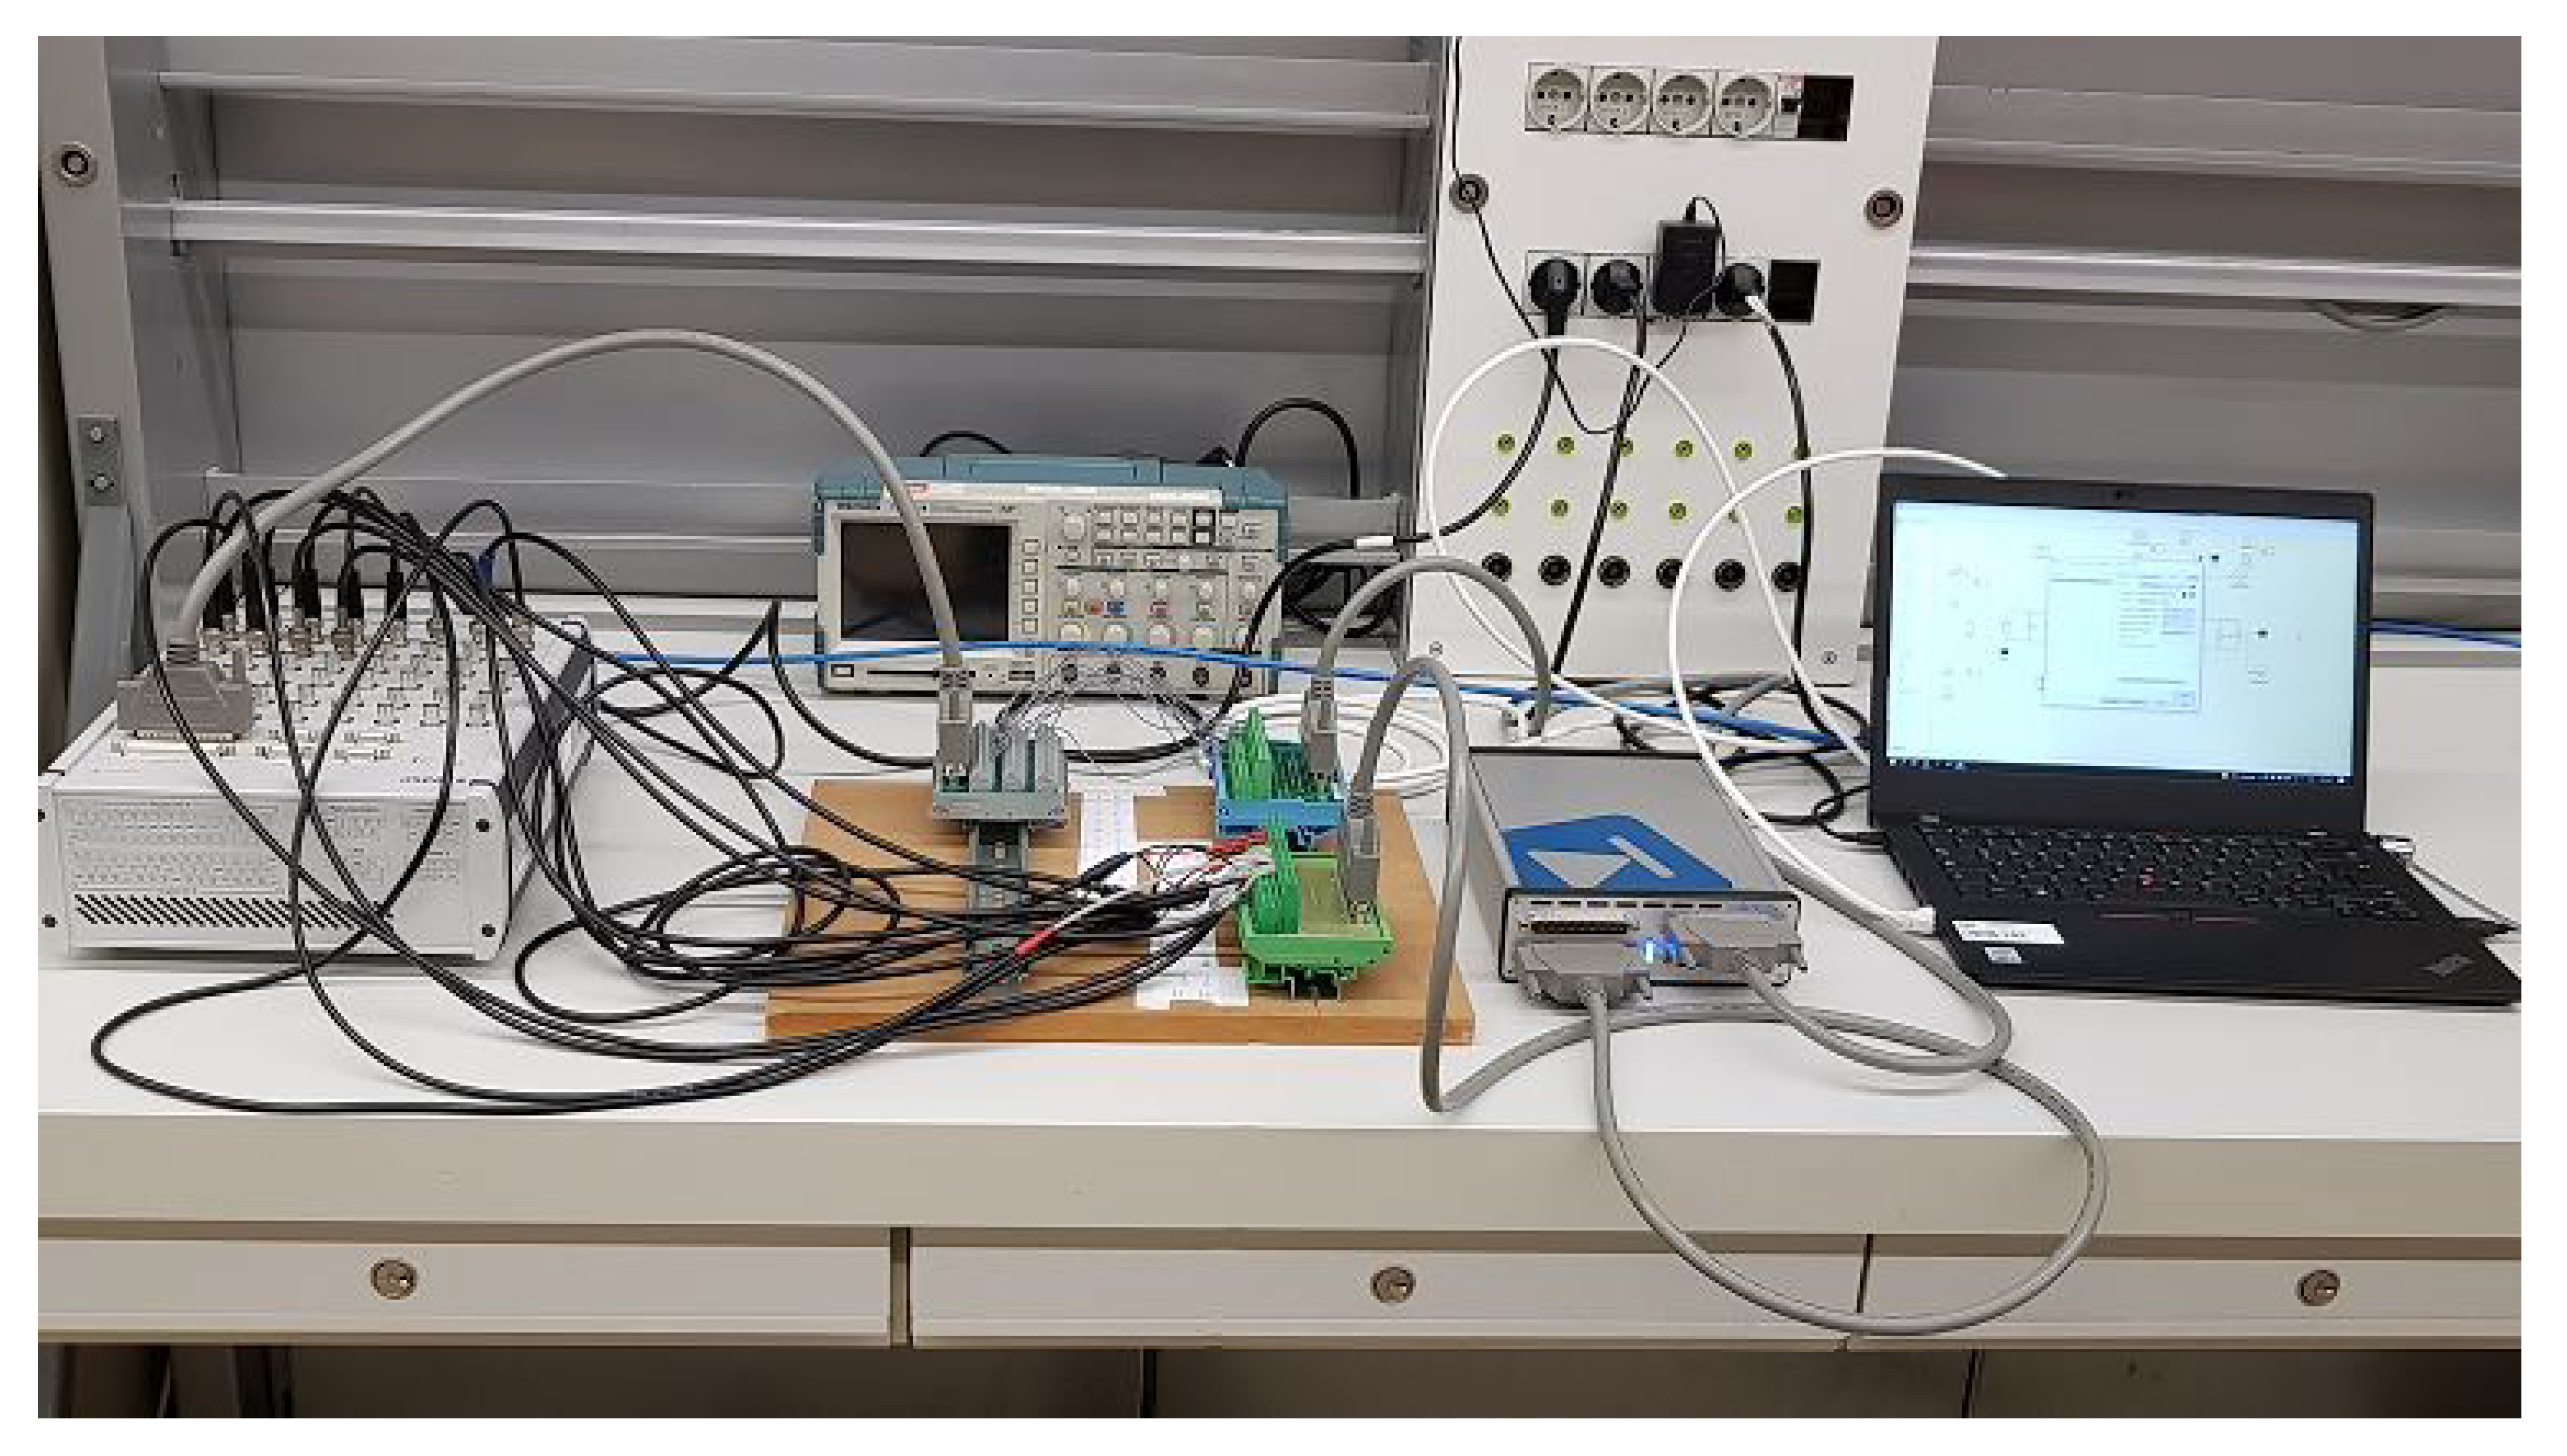
5.1. Set-Up Description

The considered PV system is built within the HIL set-up for the power circuit. The utilized controller is a dSPACE MicroLabBox. The controller is established using Matlab program and then built into the MicroLabBox, which provides the switching signals to the digital inputs of the HIL system (RT Box CE). Hence, the measurements (the emulator voltage and current) are fed back to the analog inputs of the controller. The parameters of the experimental system are the same as used in the simulation case (Table 1). The configuration of the experimental HIL set-up is shown in Figure 9.

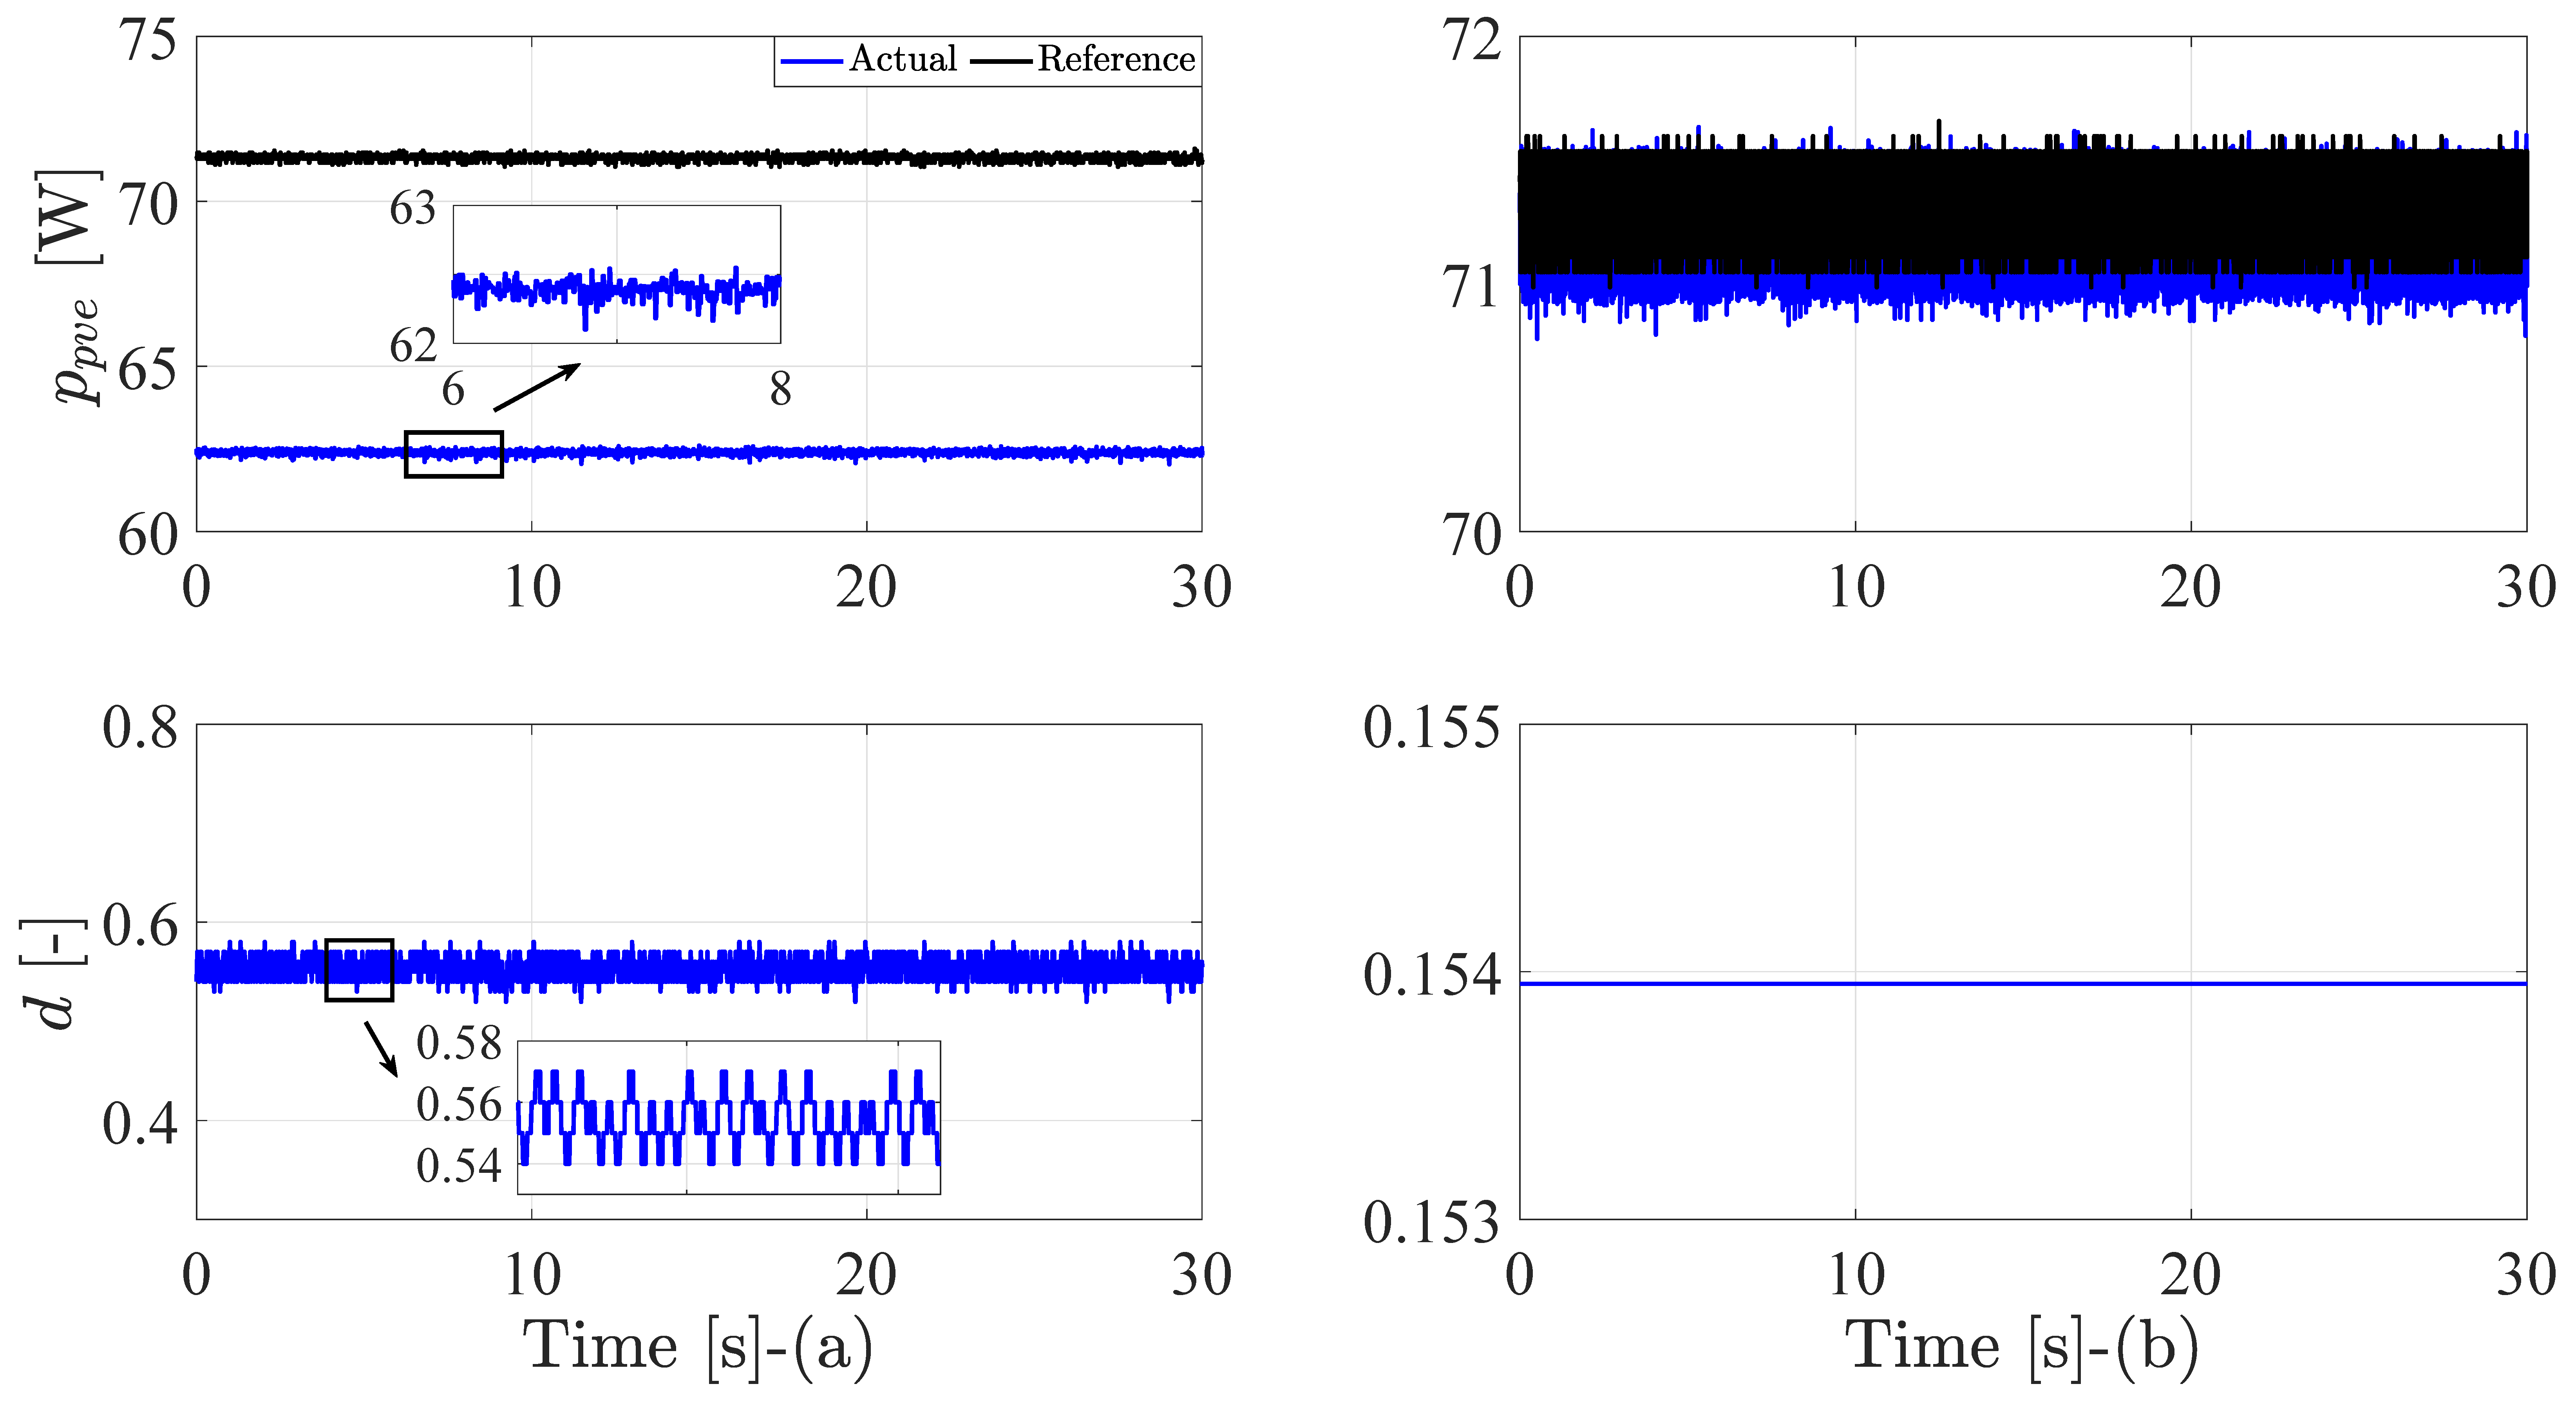
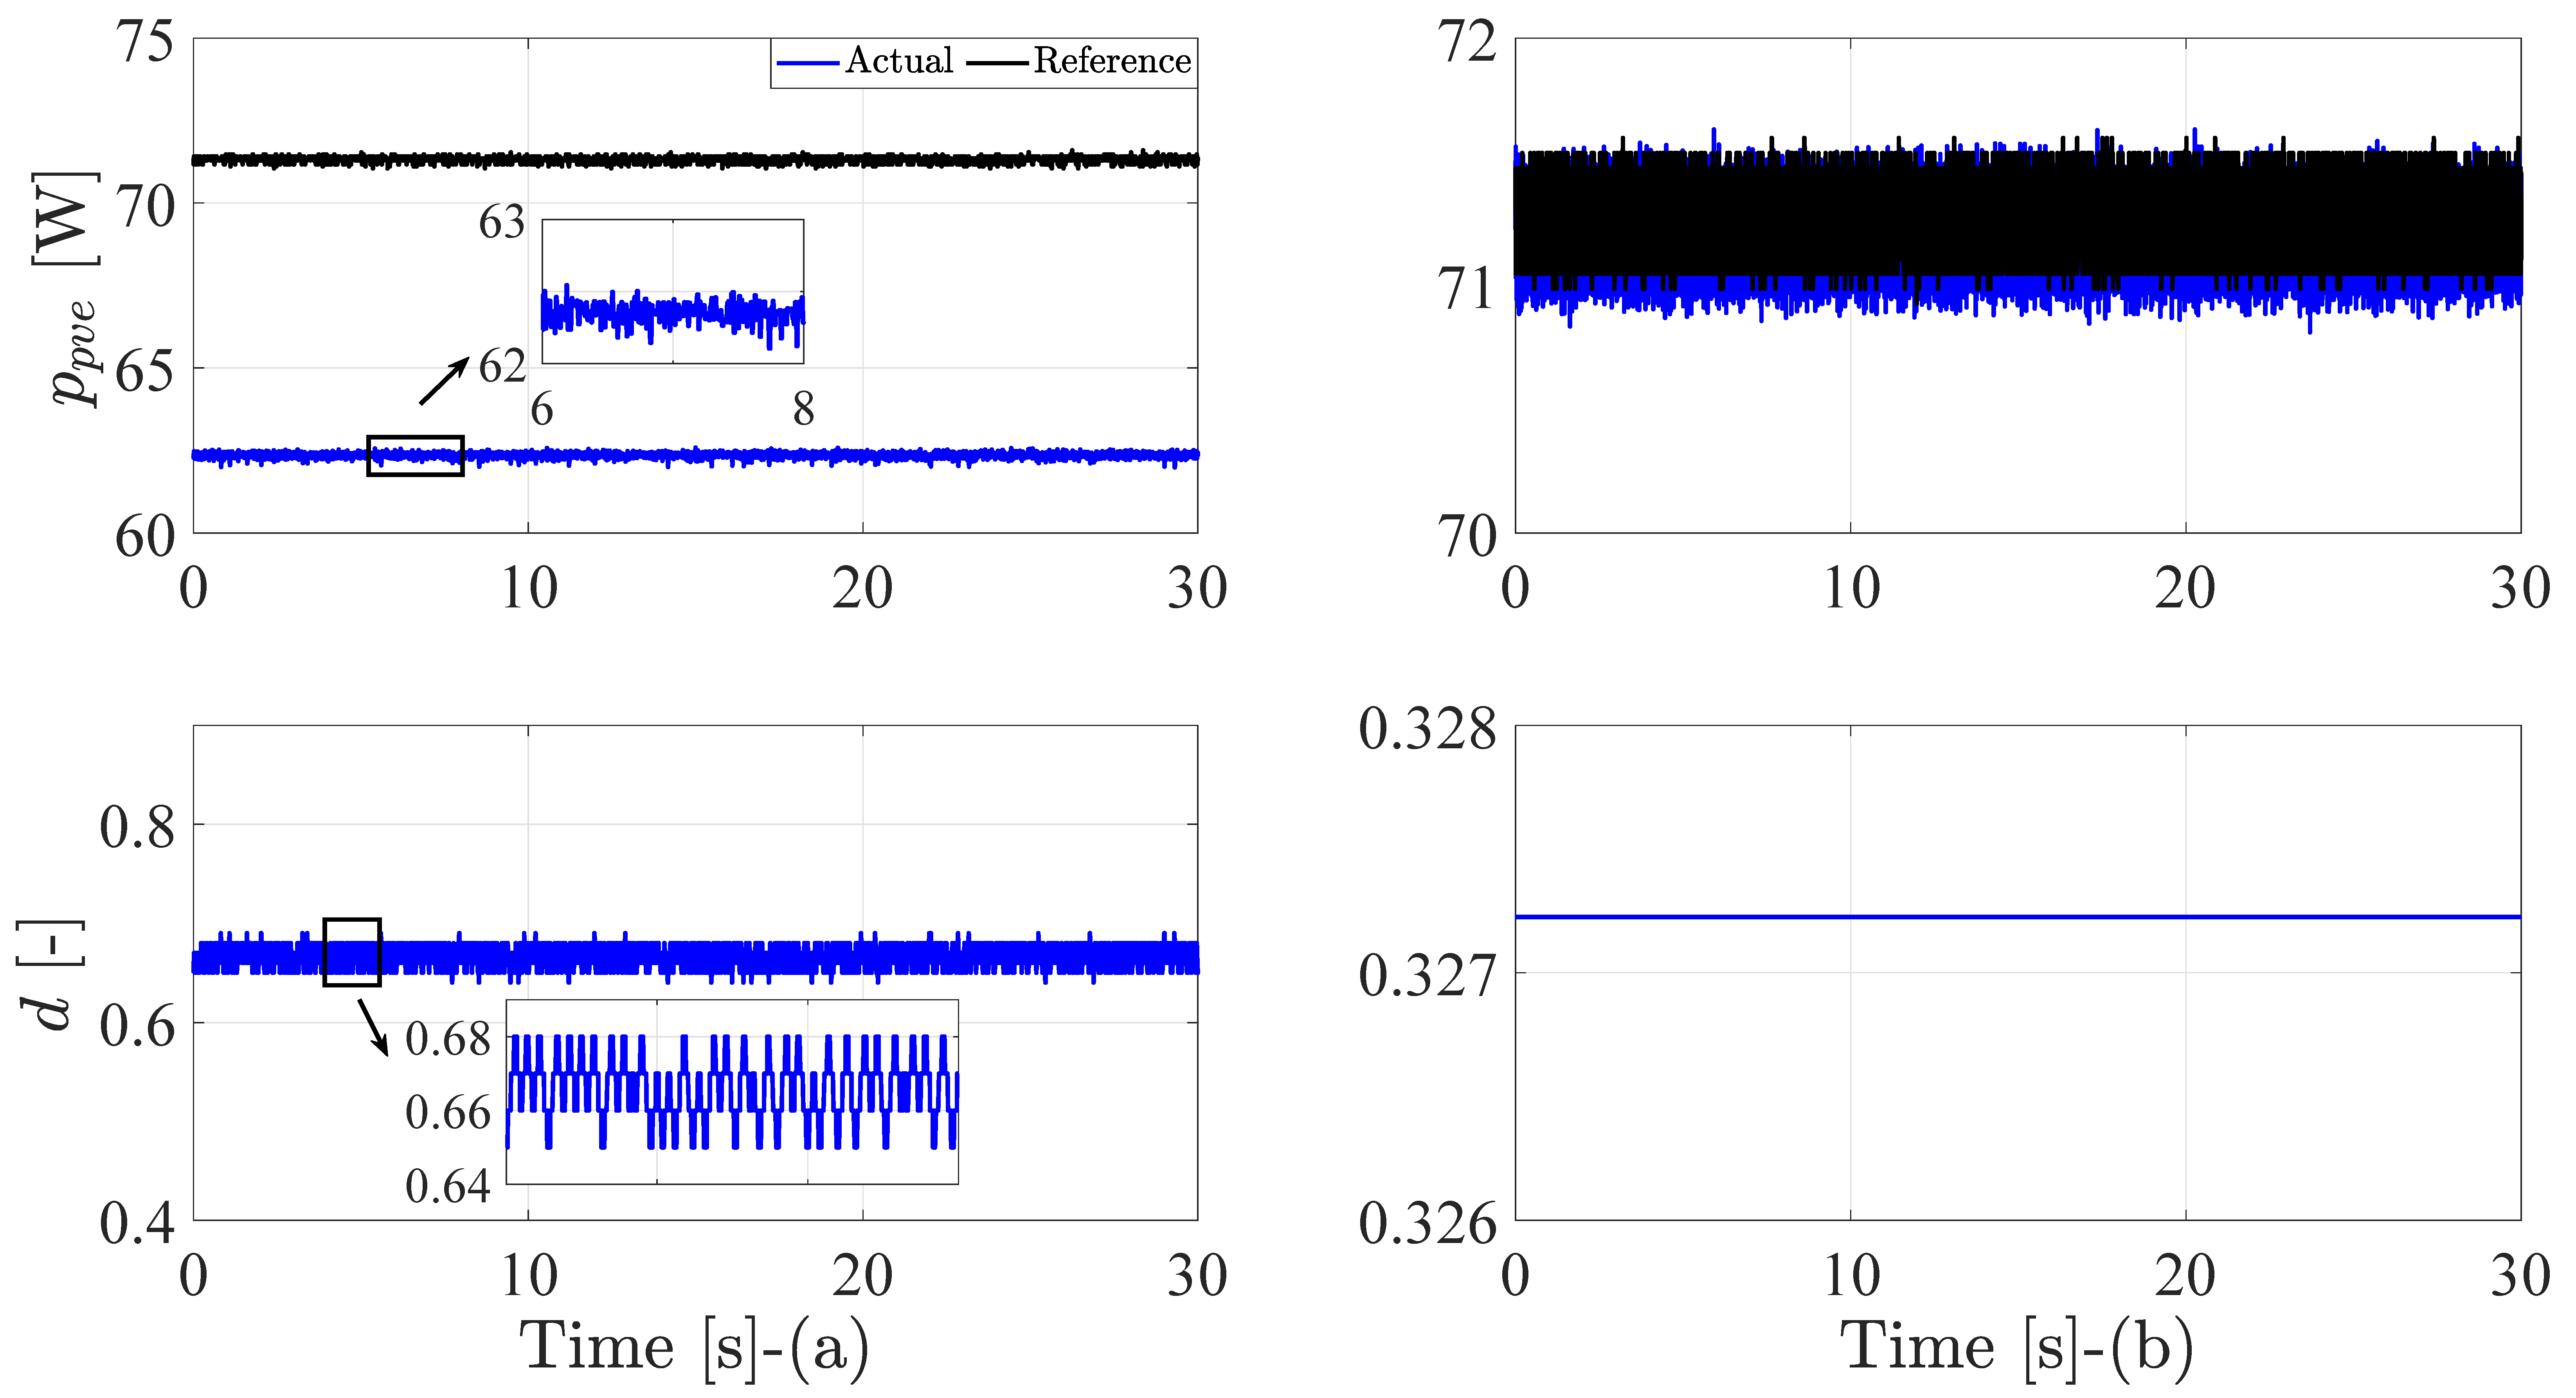
5.2. Experimental Results

For the experimental evaluation, two cases are used to assess the performance of MPPT techniques with the PV emulator. A resistive load similar to the simulation case, and a battery load to represent the constant DC-link voltage of the micro-grid or grid-connected applications, are considered. The partial shading condition considered here is when the global peak occurs on the right side (see Figure 5b). To establish such a condition, the resistors used in the emulation system are 25 Ω and 10 Ω , respectively.
The first case with resistive load is illustrated in Figure 10. The results show the waveforms of the power and duty cycle with the P&O and PSO methods. The P&O technique fails to capture the global peak. However, the PSO algorithm extracts the global power efficiently. The duty cycle for the P&O technique oscillates among three levels as specified in the simulation case. However, an occasional fourth level happens, which has no significant effect on the power oscillation. Therefore, even with a four-level operation, the MPPT performance is very satisfactory [28]. The duty cycle with the PSO algorithm is constant without any oscillation as clarified in the simulation case.
The second case with a battery is given in Figure 11. Similarly, the P&O is trapped at the local peak and the PSO succeeded to harness it. Furthermore, the duty cycle has a four-level behavior with the P&O and is constant in the case of PSO. Table 3 summarizes the efficiencies of the MPPT techniques for the two previously mentioned cases. It should be mentioned that the efficiency of the P&O technique is dependent on the extracted local peak. Therefore, it may vary in a wide range in comparison with the PSO algorithm.

6. Further Discussions

6.1. Comparison with Other PV Emulators

The behavior of the proposed PV emulator is compared with the built-in Matlab/Simulink PV emulator. Figure 12 provides the characteristics of KC200GT PV module at different atmospheric conditions of solar radiation and temperature. The PV power is proportional to the amount of solar radiation. Furthermore, the temperature effect on the PV power is smaller when compared to the solar radiation impact. However, the variation range of the MPP voltages is wider when the temperature changes. In comparison with the characteristics shown in Figure 4, the MPP voltage is fixed for the proposed PV emulator. However, it sustains the proportionality between the solar radiation and power, which is represented here by resistor change.
The performance of the proposed PV emulator under temperature variation is shown in Figure 13. The characteristics are quite similar to the waveforms provided in Figure 12b, where the MPP voltages vary significantly with temperature change. The same applies to the open-circuit voltages. However, the slope of the left-handed side of the curves in Figure 13 is steeper, which is a bit different from the real PV characteristics. The temperature change is mimicked here by supply voltage variation, which is considered a simple approach for implementation.
The behavior of the Matlab/Simulink PV emulator under non-uniform insolation is presented in Figure 14, where two cases are shown. In one case, the global maximum occurs in accordance with the second peak, while the other global peak is aligned with the first peak. The relocation of the global peak is dependent on the amount of incident solar radiation (shading pattern) and the configuration of the PV array. The characteristics are similar to the proposed PV emulator shown in Figure 5. However, the slope of the curves is different to some extent, especially in the left part.
Figure 15 shows another case of partial shading to represent complex shading issues, where three modules are used to obtain multiple peak occurrences. One case shows the global occurrence at the first peak, the second case is in the middle, and the last one happens at the third peak. The relocation of the global peak provides more complex partial shading conditions, which in turn makes it hard for MPPT techniques to harness the maximum power in different situations. Therefore, the continuous development of MPPT algorithms is still ongoing to address such an issue.

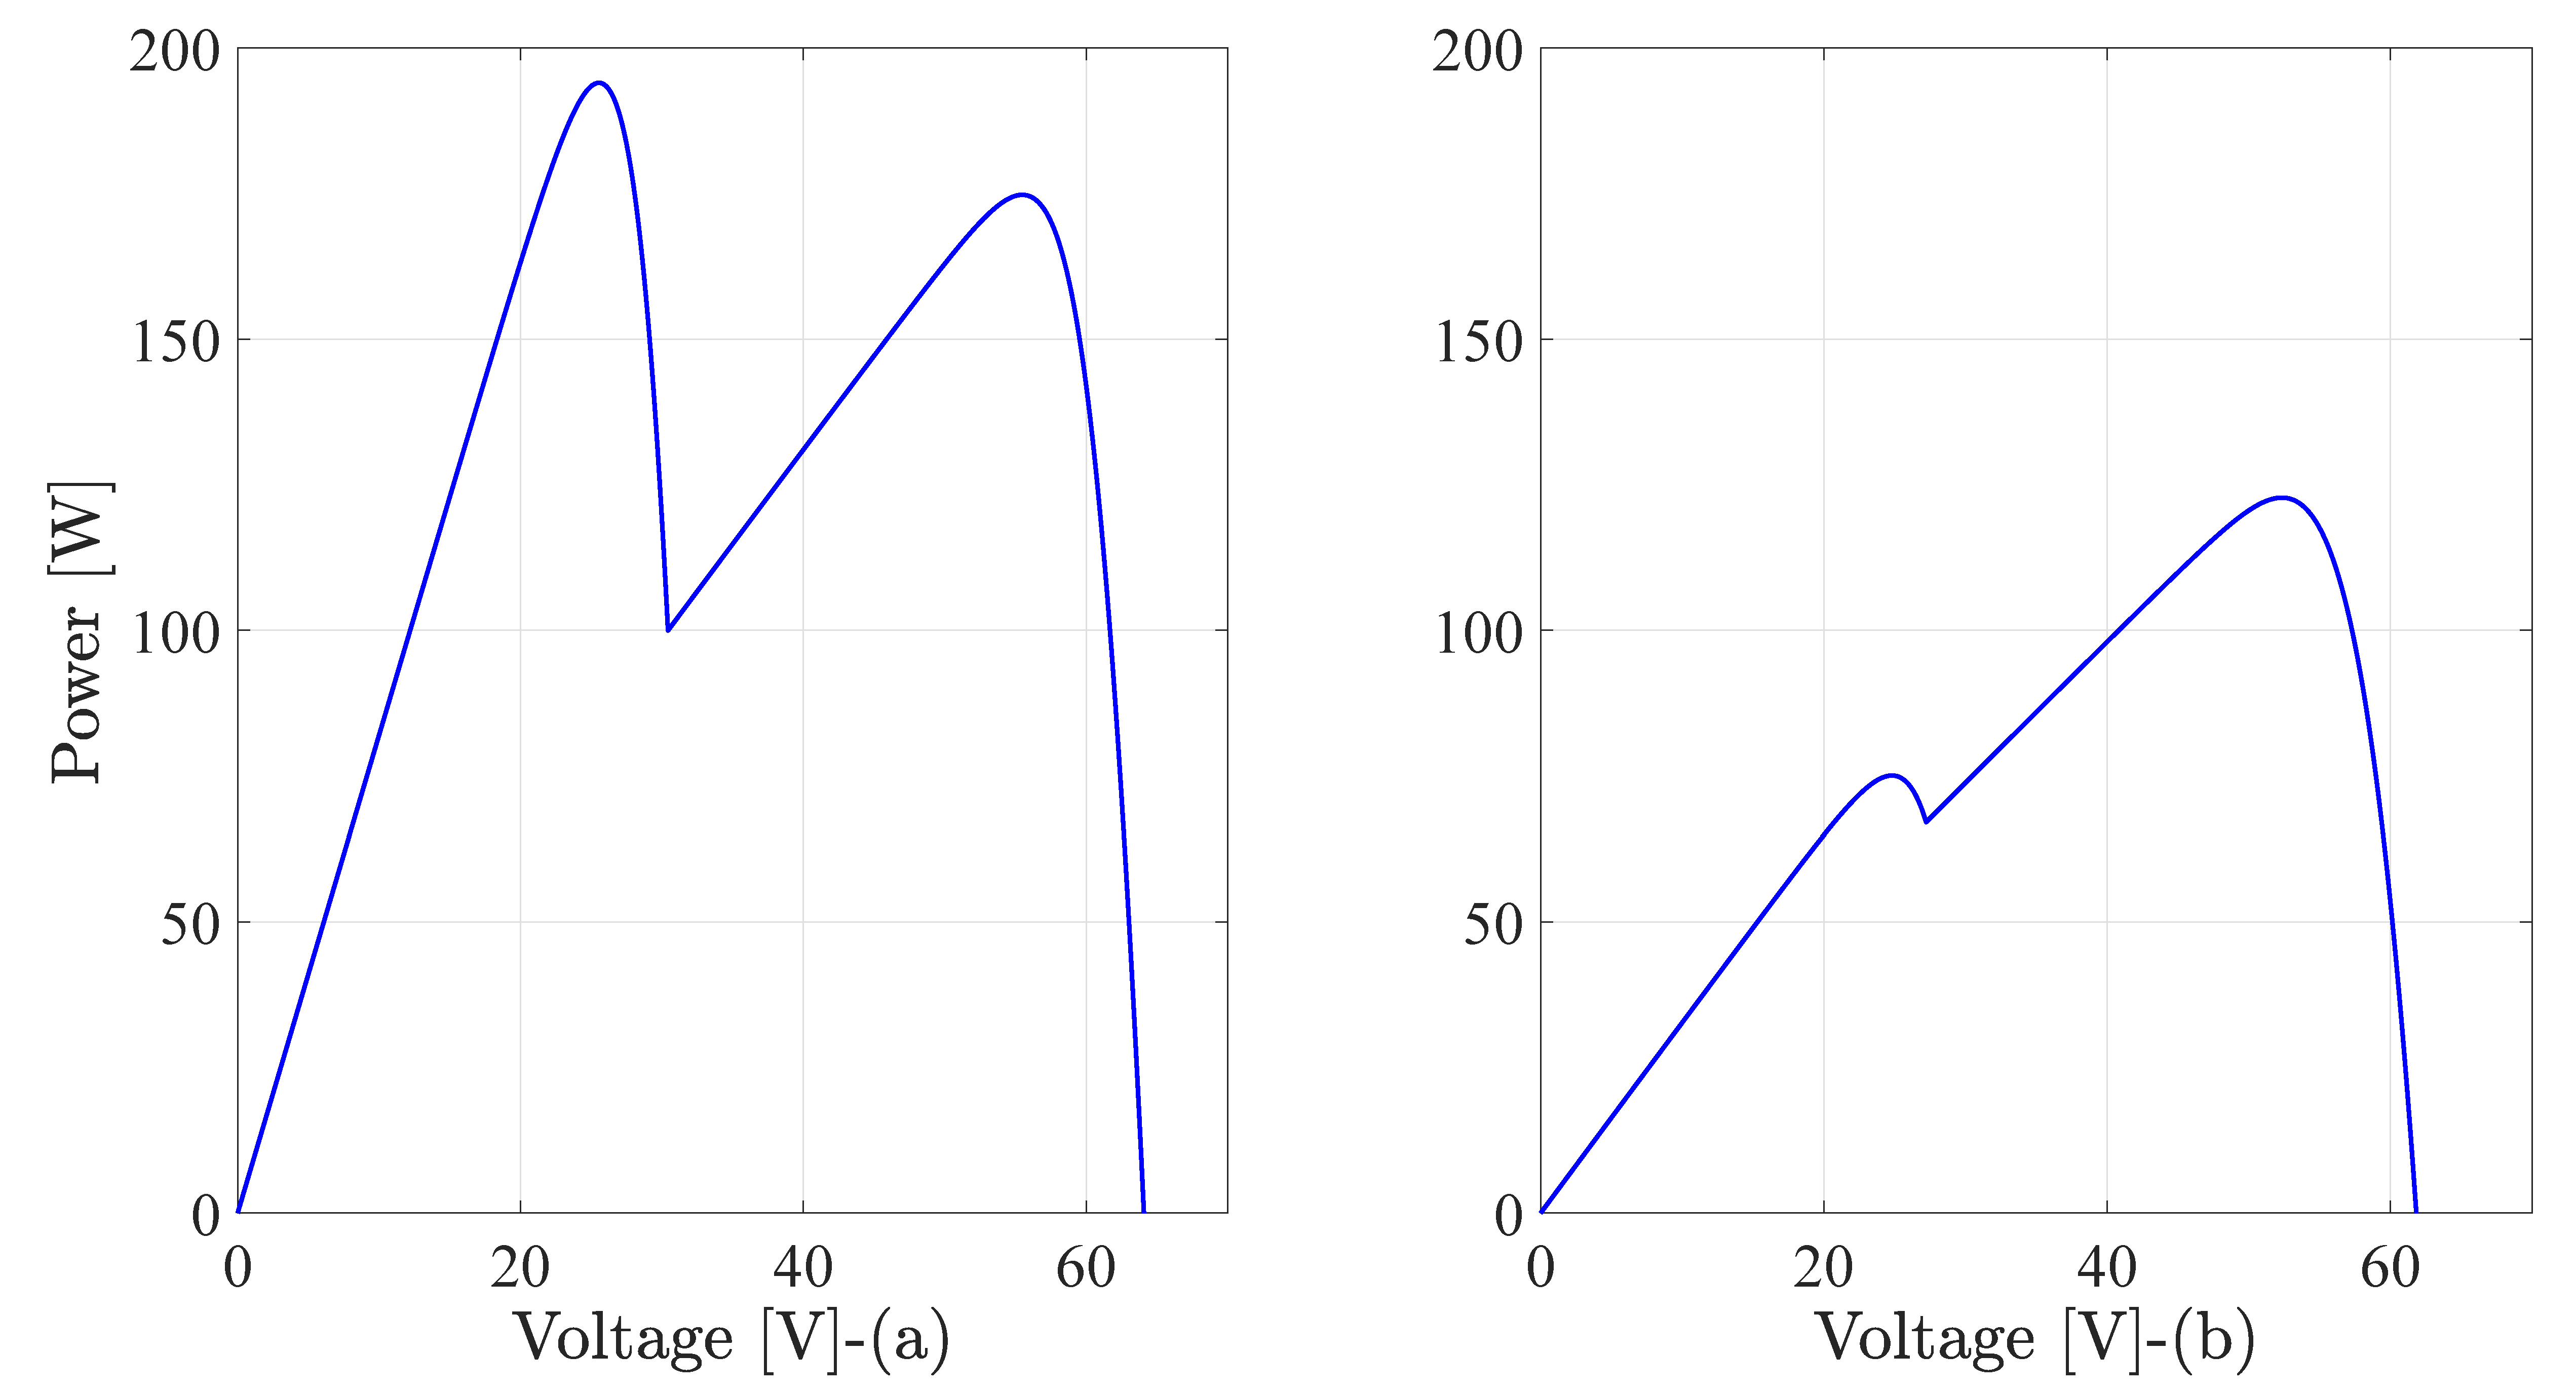
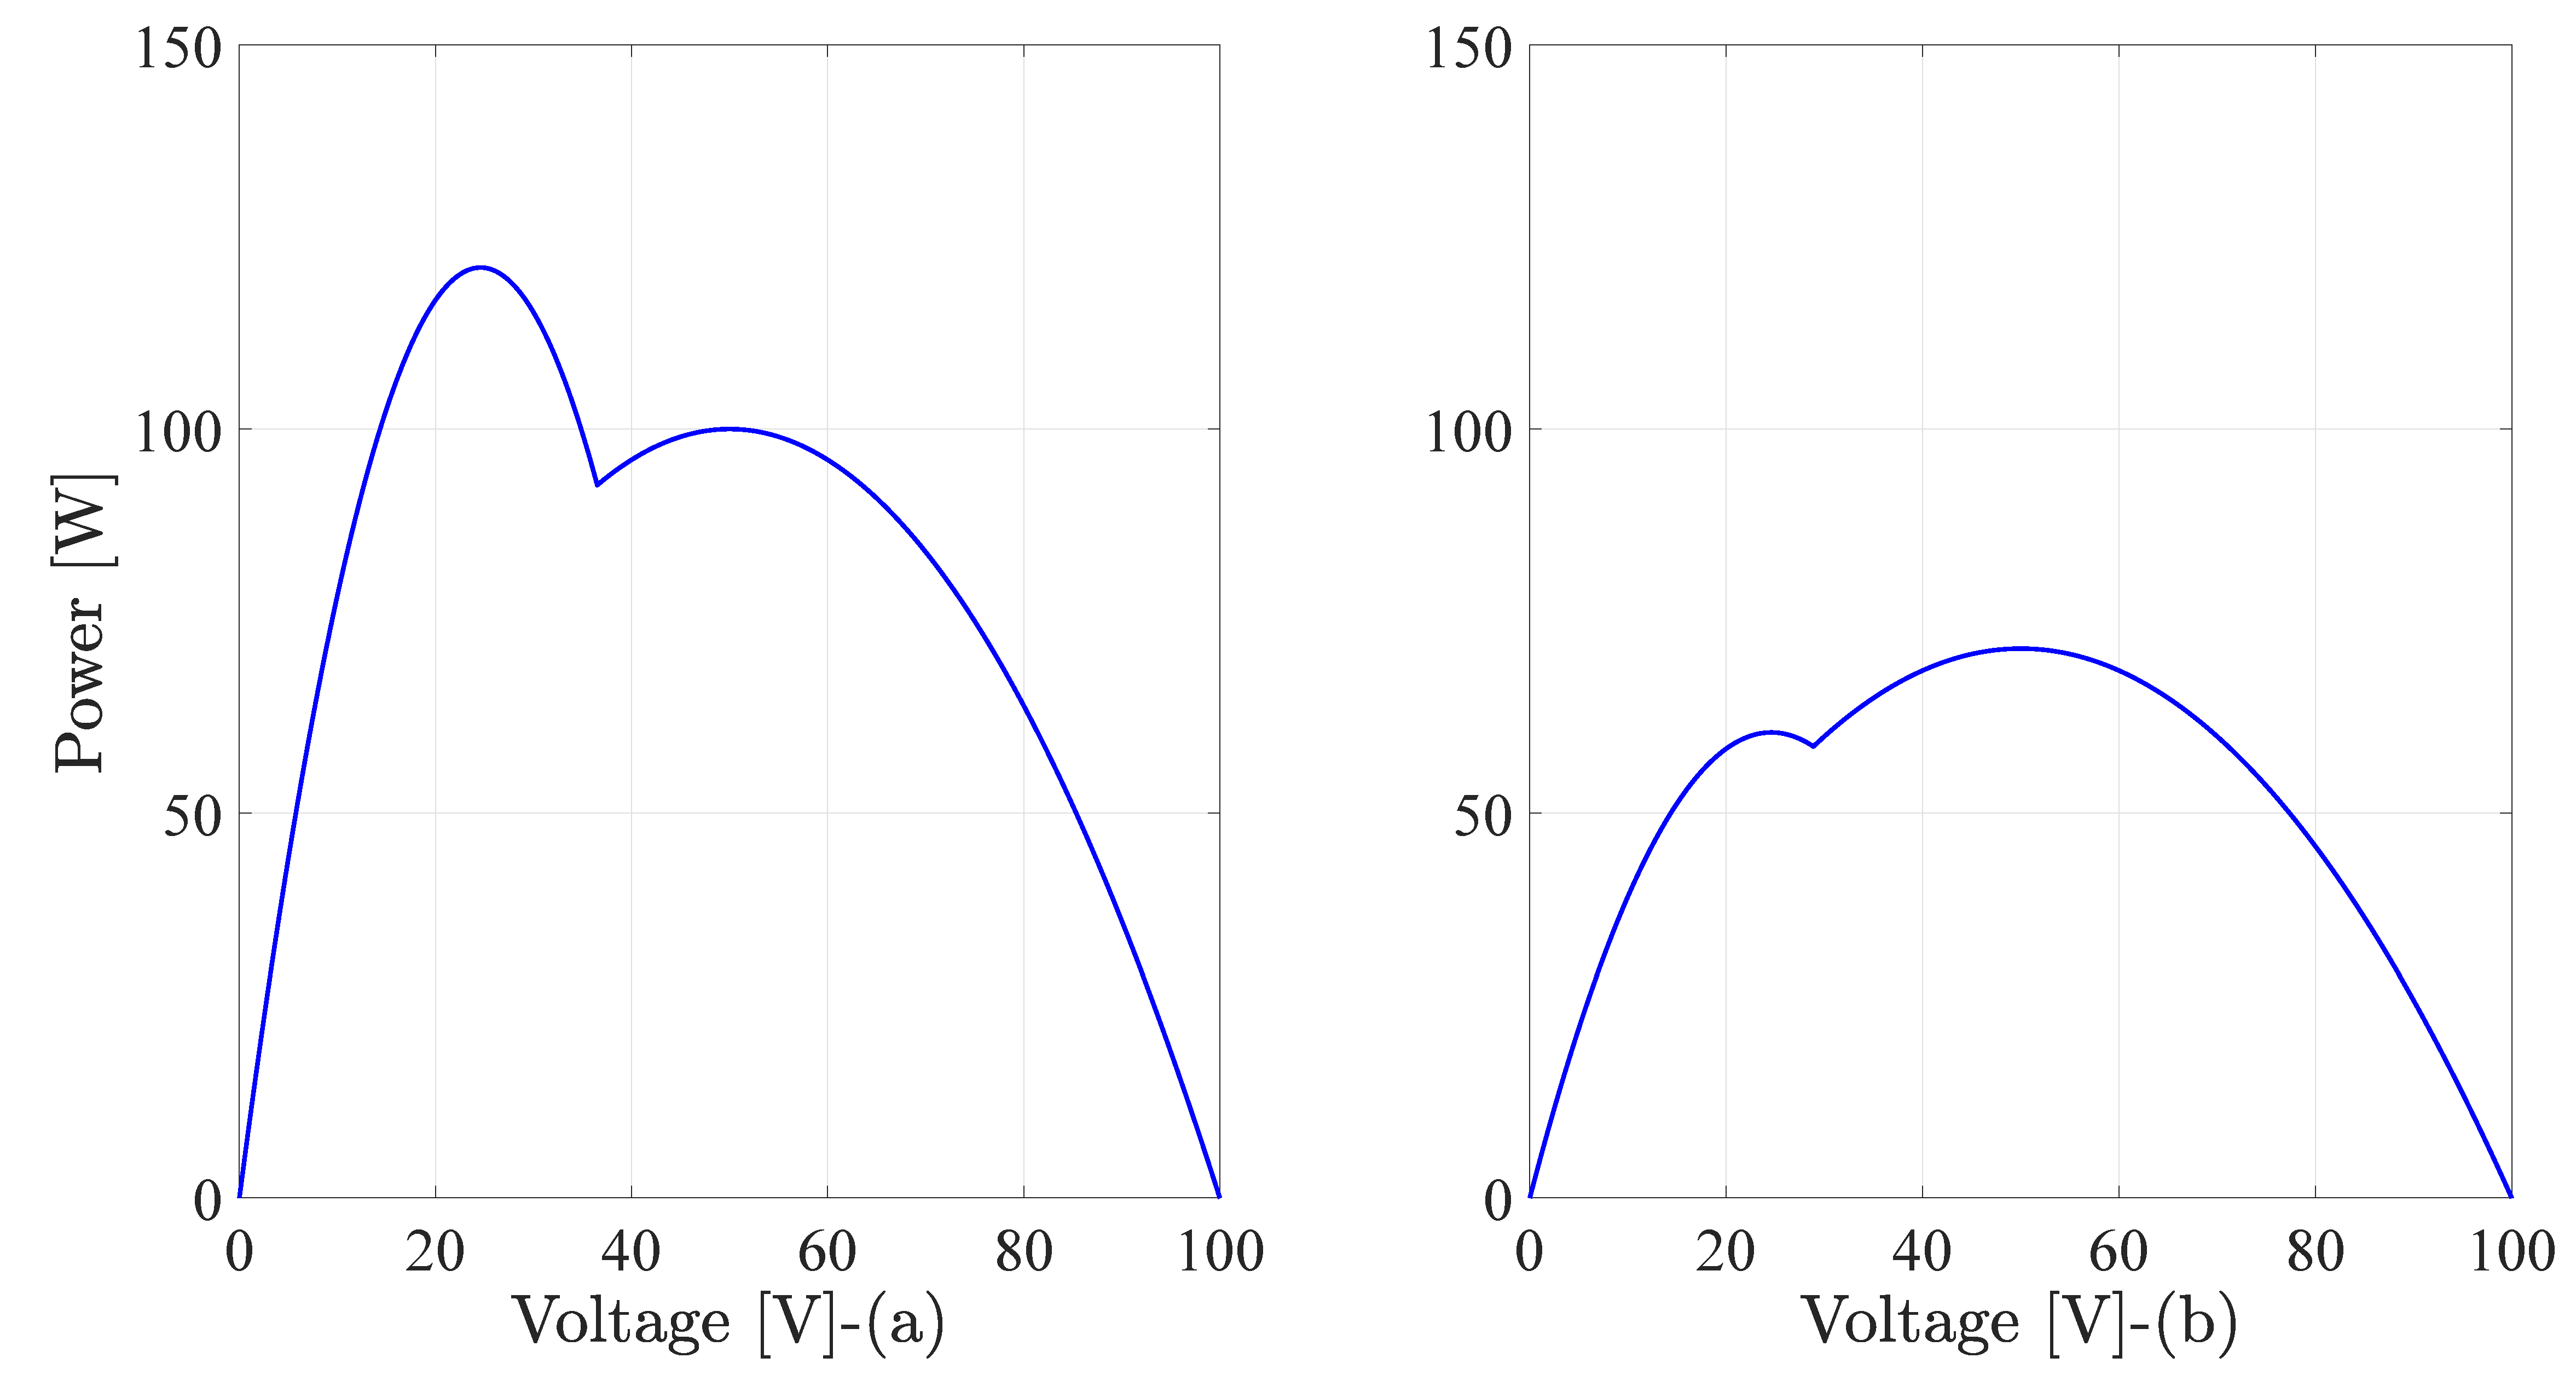
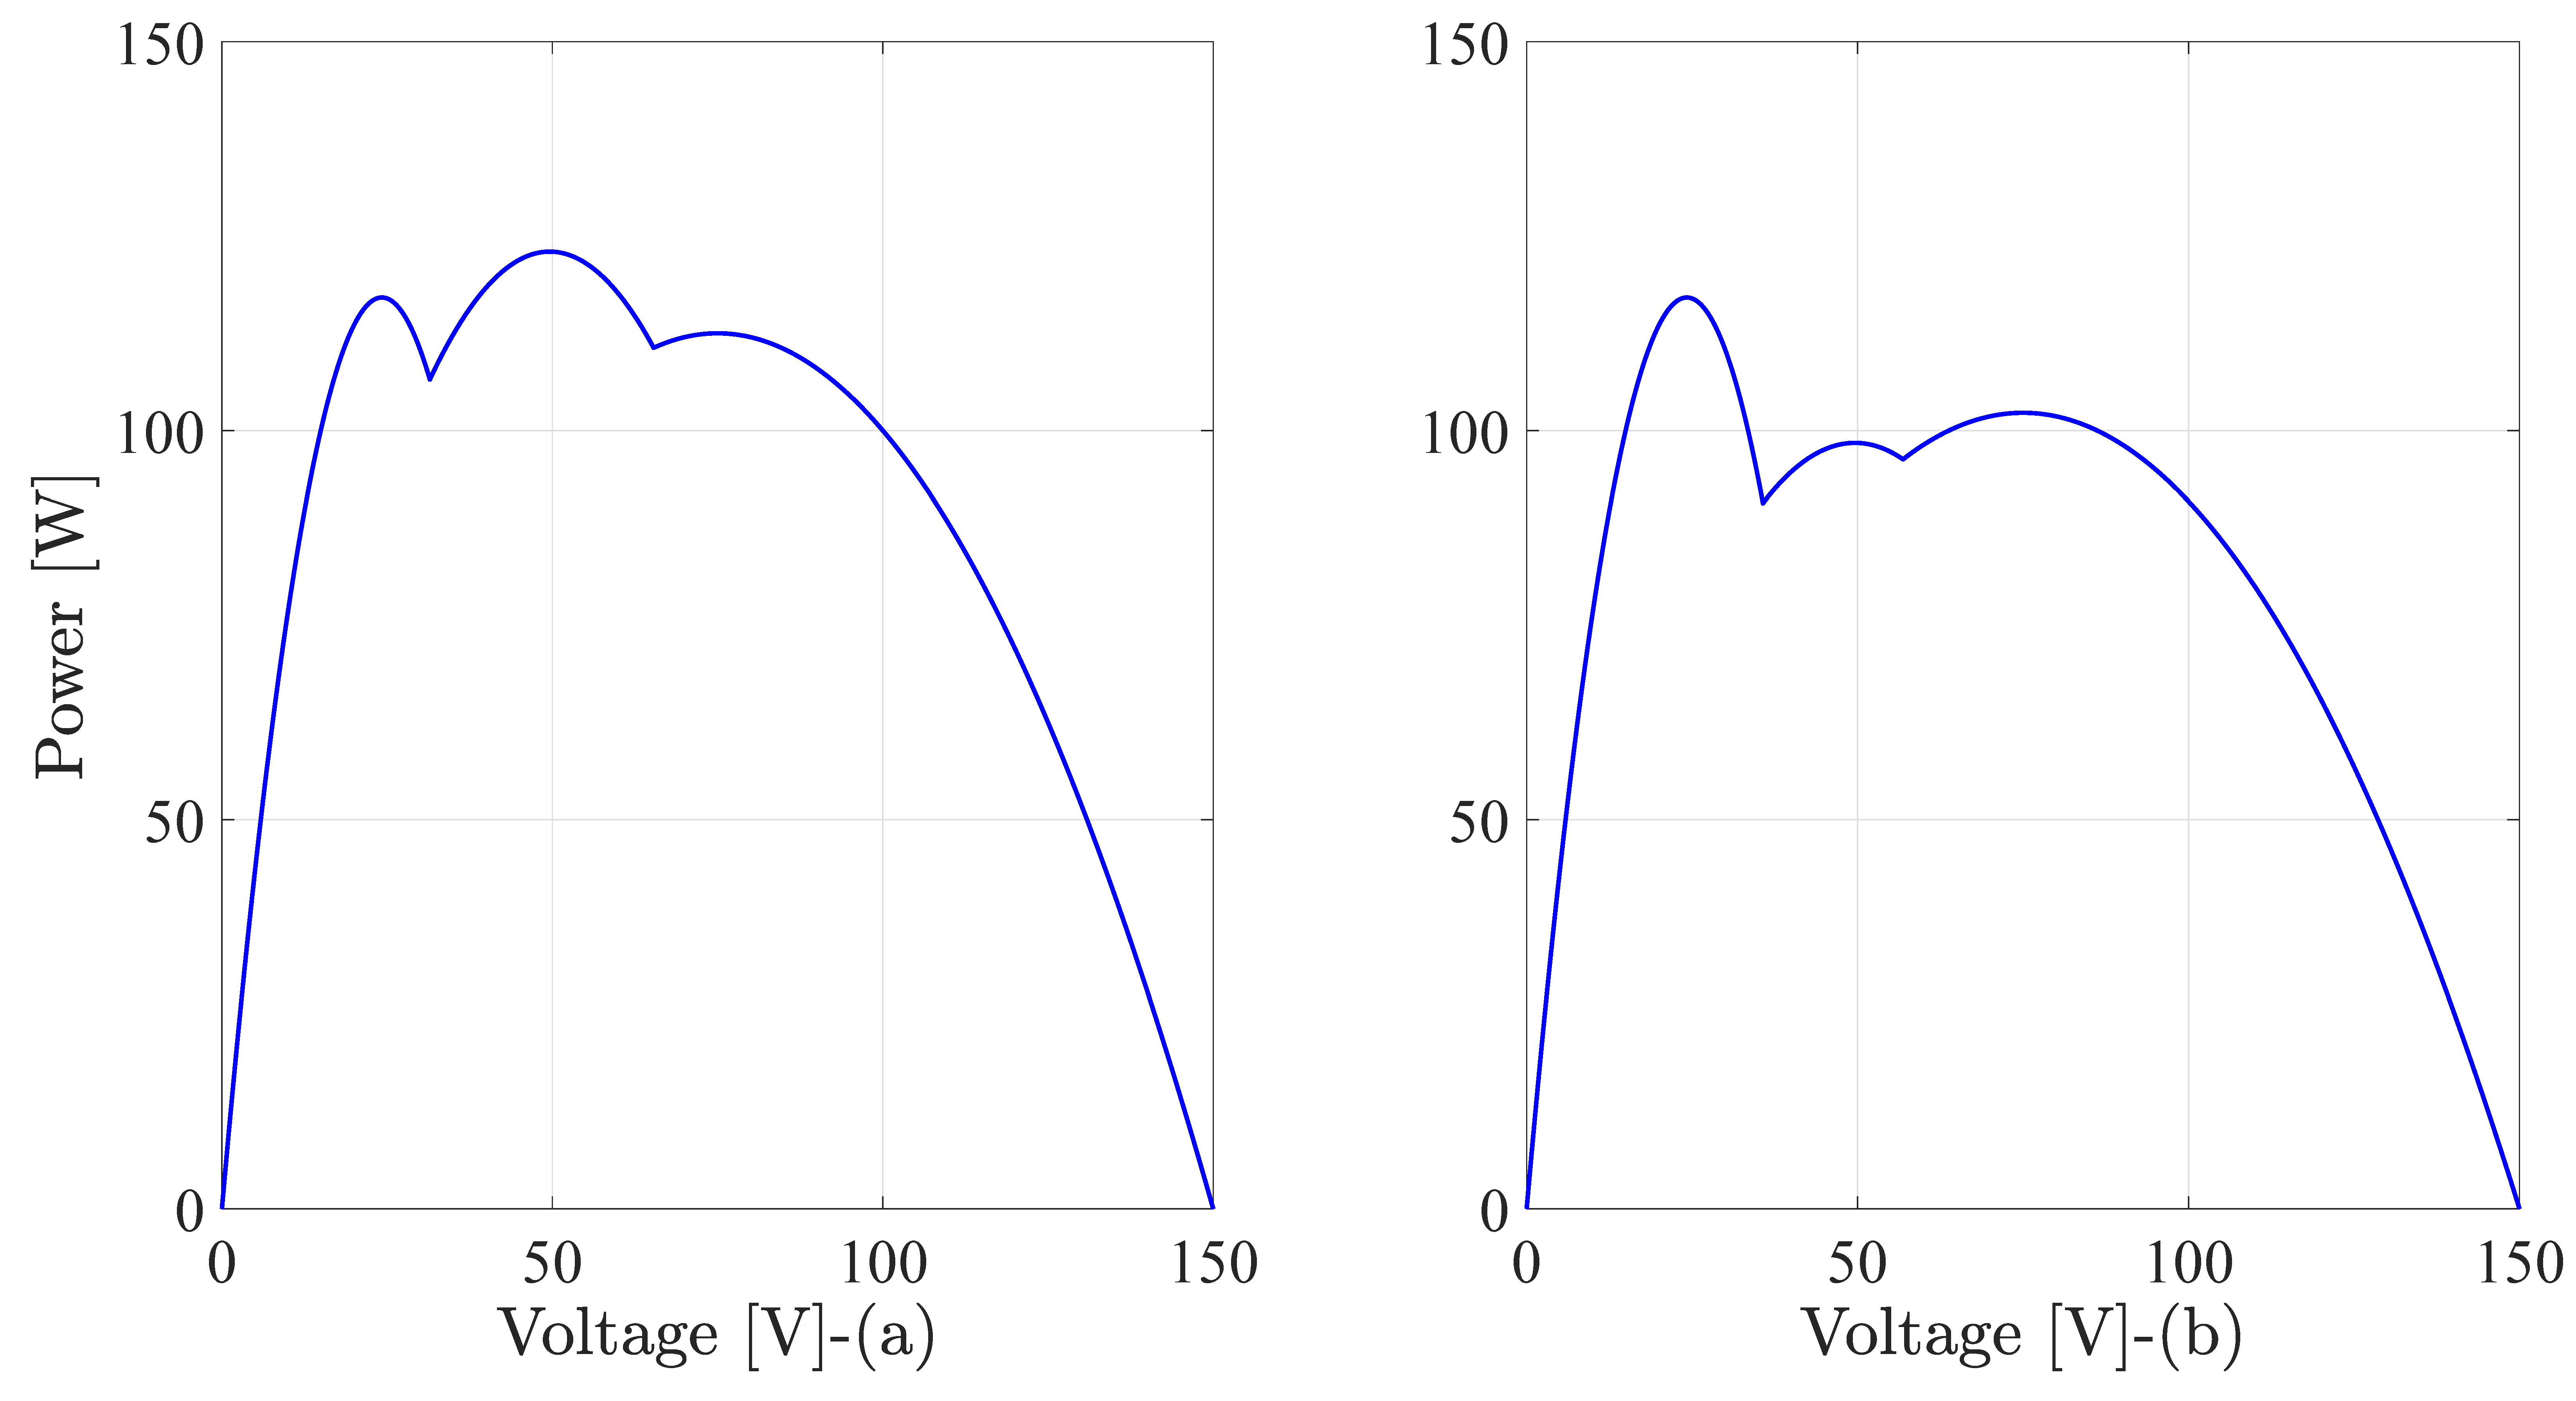
6.2. More Complex Partial Shading Conditions

The proposed PV emulator can be extended to obtain more complex and challenging partial shading conditions by connecting the PV emulators units in a cascaded structure. Two additional case studies are included to give more complex characteristics of the output of the PV emulator. Figure 16 shows the PV emulator characteristics, where the global peak occurs at the middle of the P-V curve. In another case, the global peak happens at the first peak. The changing position of the global peak from first to middle provides more realistic emulation for the variety of partial shading techniques. Therefore, to validate an optimization method for MPPT, it is mandatory to test it under complex partial shading conditions and variable peak occurrence at the output characteristics. In this regard, the suggested PV emulator provides a simple procedure for obtaining such conditions.
The utilized resistors for the middle peak are 5 Ω , 30 Ω , and 15 Ω . Furthermore, the employed resistors for the first peak are 5 Ω , 30 Ω , and 20 Ω . One can observe that modifying only one resistor changes the location of the global peak. Therefore, a parallel branch can be used to transfer the condition from the first peak to the middle one, which further simplifies the implementation of the proposed PV emulator and decreases the number of required resistors.
In comparison with the characteristics shown in Figure 15, the proposed PV emulator gives the possibility to relocate the global peak position in a simple manner. The non-uniformity of the incident solar radiation is represented here by resistor change. Similarly, the characteristics are very sufficient to represent complex partial shading condition. However, the slopes of the curves are different when compared to the real PV system. Nevertheless, this will not affect the effectiveness of the tested global peak tracker.

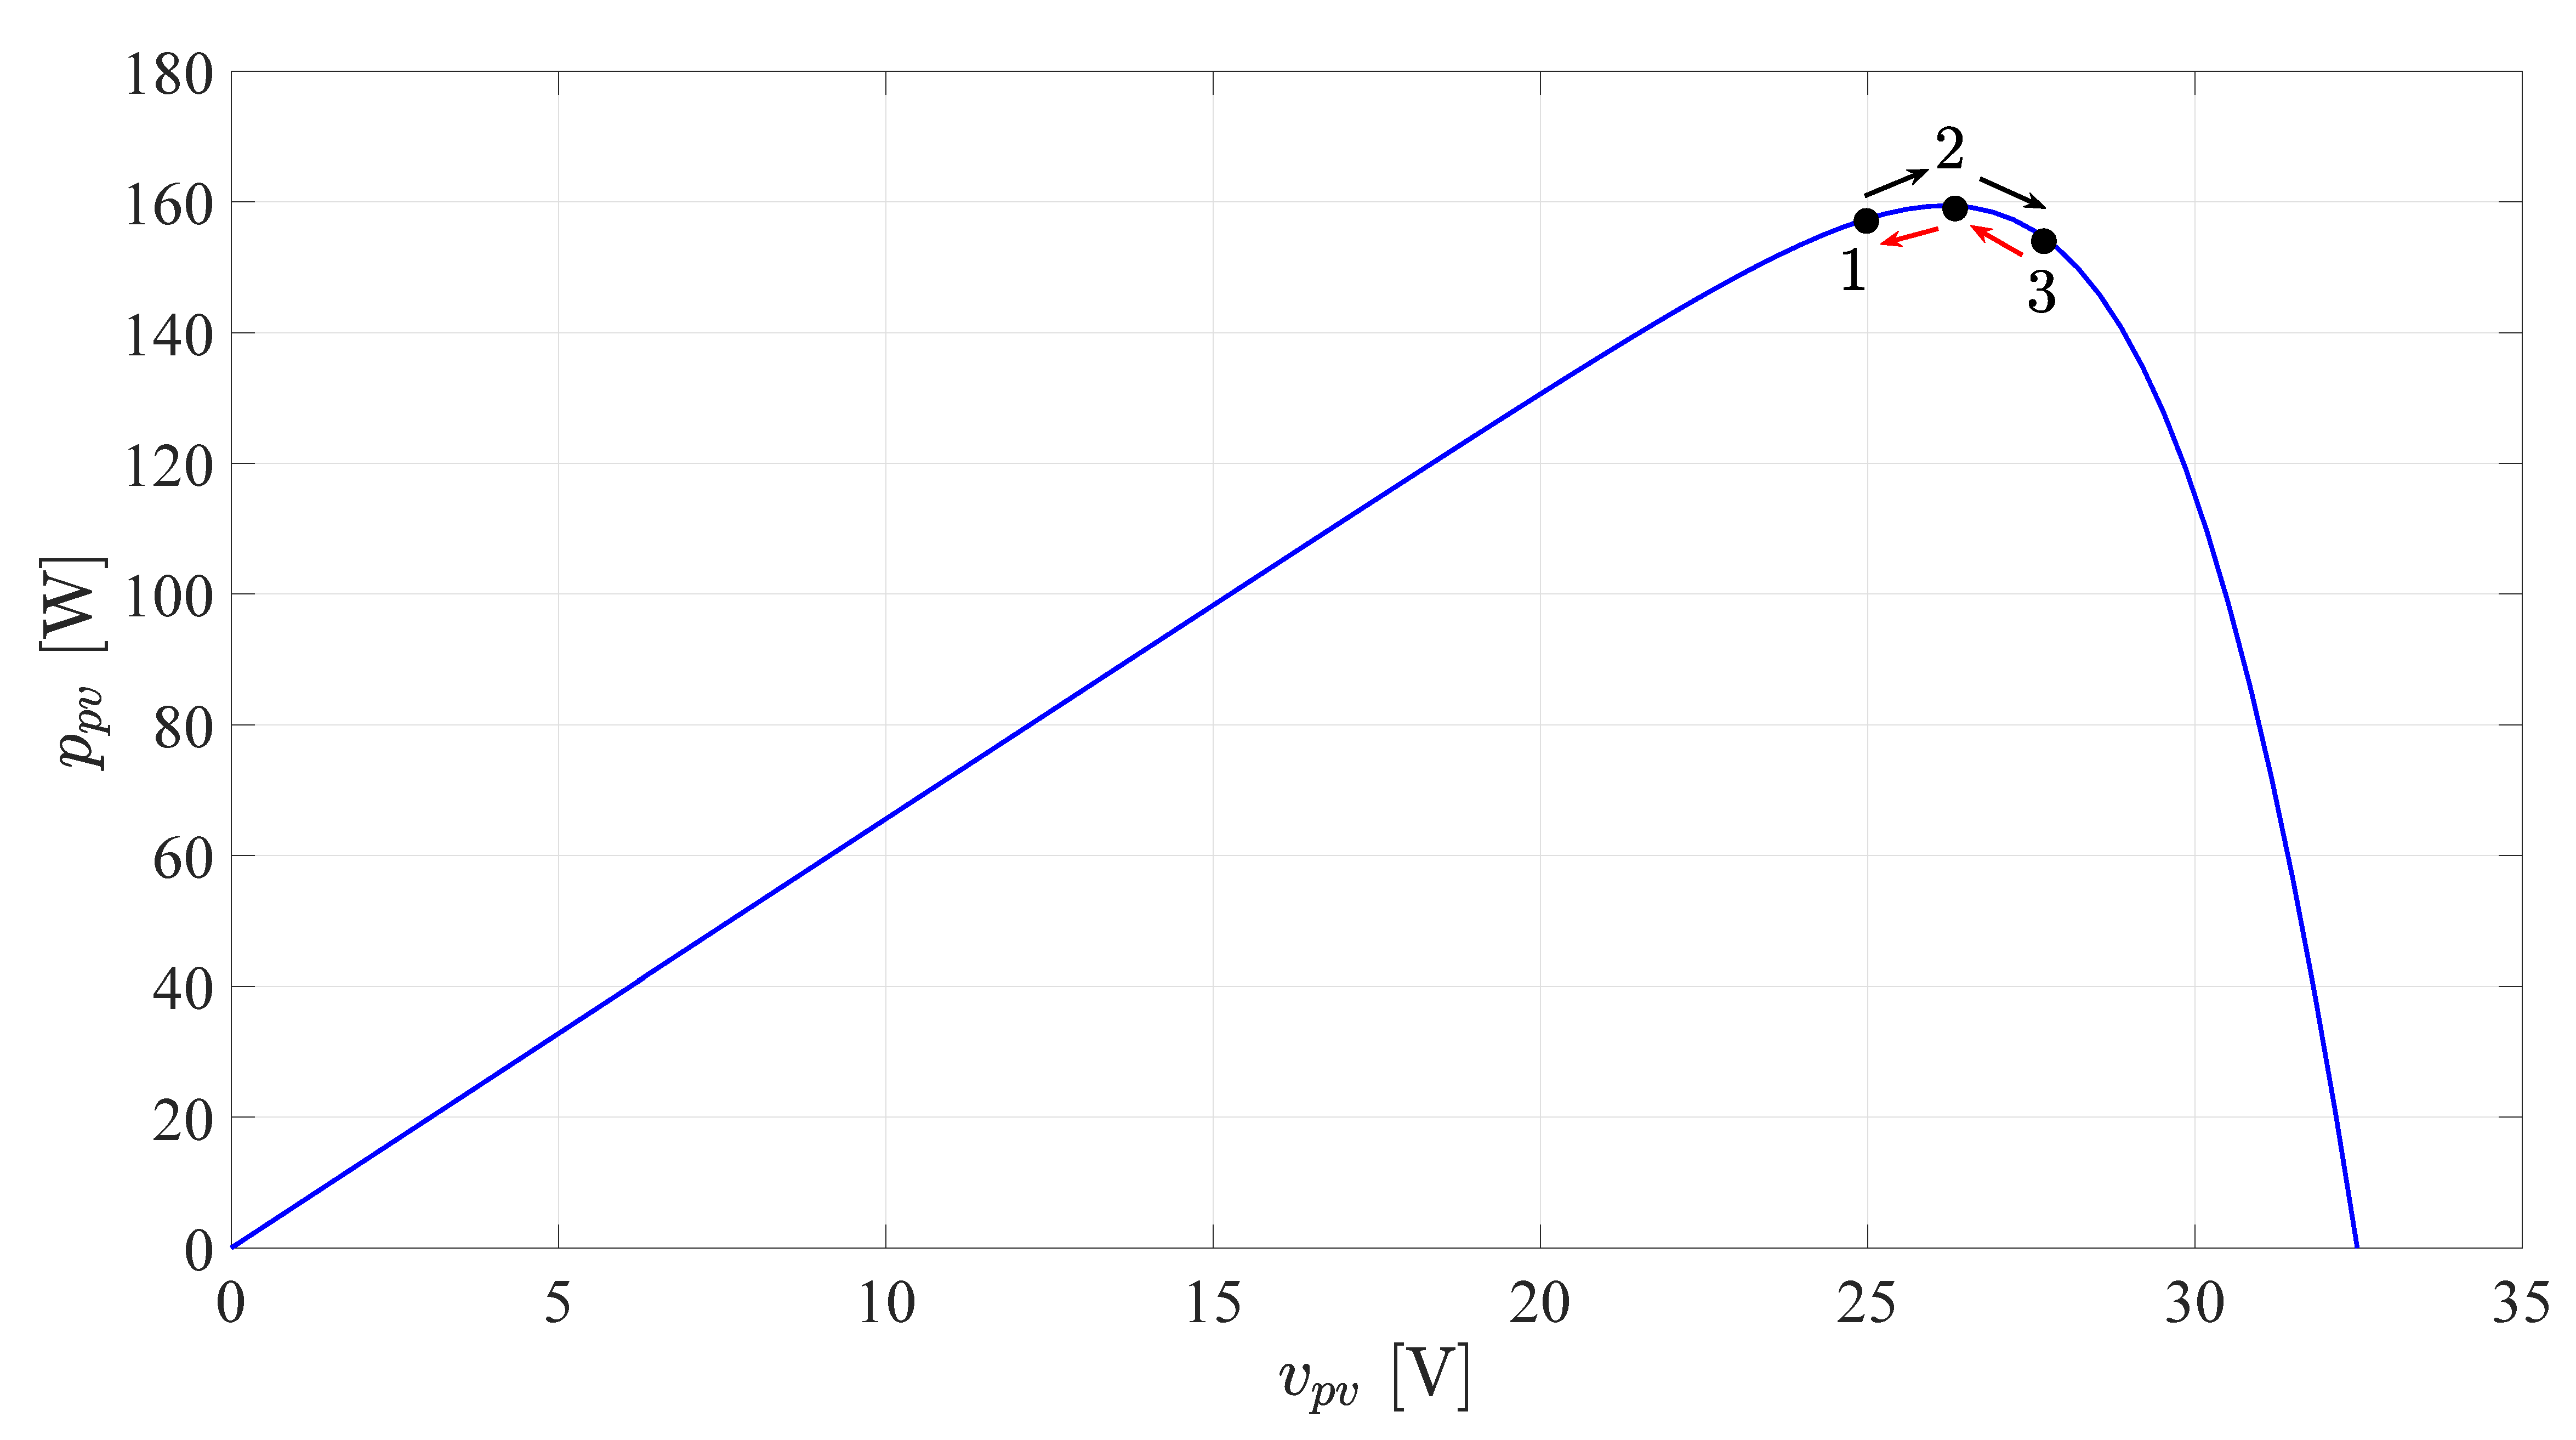
6.3. On the Failure of P&O Method

As discussed earlier, the P&O technique is easily trapped at the local peak due to the dependency on the hill-climbing principle. The location of the global peak plays an important role in the failure of the P&O method [34]. However, the initialization of the P&O also contributes to its failure rate. Therefore, we study here the effect of the initial value of the duty cycle on the maximum power extraction. Figure 17 shows two cases, where the P&O is firstly trapped at a local peak. In the other case, the P&O method can successfully obtain the global one. The case under study is when the global peak occurs in the middle (Figure 16a).
The P&O method fails to track the global peak when the duty cycle initial value is 0.7. However, it gets the global power when the initial duty is 0.4. It is worth mentioning that the three-step operation is guaranteed as shown in the duty waveform in both cases. Furthermore, the power oscillations clearly show a three-level operation, where the power swings among the points 1, 2, and 3, which is in agreement with the operation explained in Figure 6.

7. Conclusions

A cascaded structure of a battery-based PV emulator is proposed in this paper. The suggested emulator is designed for partial shading conditions. Furthermore, it has a simple structure with low-cost implementation. Therefore, several partial shading conditions can be easily constructed using this emulator, which simplifies the testing of the optimization techniques for MPPT. The PV emulator is validated using simulation and experimental results under different operating conditions. The suggested PV emulator provides a similar characterization to a real PV module, even under complex partial shading conditions. Moreover, two MPPT techniques are implemented to harness the maximum power from the emulator. Firstly, the P&O method fails to extract the global maximum and is easily trapped at a local one. In this regard, the P&O algorithm may track the global peak. However, this is mainly dependent on the location of the global peak. Secondly, the designed PSO technique succeeded to get the optimal maximum (global one) due to the searching nature of this scheme. The efficiency of the PSO method is higher than 99% under different studied conditions. However, the P&O efficiency is dependent on the extracted local peak.

Author Contributions

M.A. (Mostafa Ahmed) designed, implemented the proposed control strategy, and wrote the manuscript. I.H. helped in writing the manuscript and collection of the experimental results. M.A. (Mohamed Abdelrahem) revised and edited the manuscript. R.K. was responsible for the guidance and suggestions. All authors have read and agreed to the published version of the manuscript.

Funding

This research received no external funding.

Institutional Review Board Statement

Not applicable.

Informed Consent Statement

Not applicable.

Data Availability Statement

Not applicable.

Conflicts of Interest

The authors declare no conflict of interest.

References

  1. Muis, Z.A.; Hashim, H.; Manan, Z.A.; Taha, F.M.; Douglas, P.L. Optimal planning of renewable energy-integrated electricity generation schemes with CO2 reduction target. Renew. Energy 2010, 35, 2562–2570. [Google Scholar] [CrossRef] [Green Version]
  2. Qi, T.; Zhang, X.; Karplus, V.J. The energy and CO2 emissions impact of renewable energy development in China. Energy Policy 2014, 68, 60–69. [Google Scholar] [CrossRef] [Green Version]
  3. Ayop, R.; Tan, C.W. A comprehensive review on photovoltaic emulator. Renew. Sustain. Energy Rev. 2017, 80, 430–452. [Google Scholar] [CrossRef]
  4. Ahmed, M.; Abdelrahem, M.; Kennel, R. Highly efficient and robust grid connected photovoltaic system based model predictive control with kalman filtering capability. Sustainability 2020, 12, 4542. [Google Scholar] [CrossRef]
  5. Salama, H.S.; Kotb, K.M.; Vokony, I.; Dán, A. The Role of Hybrid Battery—SMES Energy Storage in Enriching the Permanence of PV—Wind DC Microgrids: A Case Study. Eng 2022, 3, 16. [Google Scholar] [CrossRef]
  6. Ram, J.P.; Manghani, H.; Pillai, D.S.; Babu, T.S.; Miyatake, M.; Rajasekar, N. Analysis on solar PV emulators: A review. Renew. Sustain. Energy Rev. 2018, 81, 149–160. [Google Scholar] [CrossRef]
  7. Chin, V.J.; Salam, Z.; Ishaque, K. Cell modelling and model parameters estimation techniques for photovoltaic simulator application: A review. Appl. Energy 2015, 154, 500–519. [Google Scholar] [CrossRef]
  8. Jordehi, A.R. Parameter estimation of solar photovoltaic (PV) cells: A review. Renew. Sustain. Energy Rev. 2016, 61, 354–371. [Google Scholar] [CrossRef]
  9. Humada, A.M.; Hojabri, M.; Mekhilef, S.; Hamada, H.M. Solar cell parameters extraction based on single and double-diode models: A review. Renew. Sustain. Energy Rev. 2016, 56, 494–509. [Google Scholar] [CrossRef] [Green Version]
  10. Bana, S.; Saini, R.P. A mathematical modeling framework to evaluate the performance of single diode and double diode based SPV systems. Energy Rep. 2016, 2, 171–187. [Google Scholar] [CrossRef]
  11. Abdelsalam, A.K.; Massoud, A.M.; Ahmed, S.; Enjeti, P.N. High-performance adaptive perturb and observe MPPT technique for photovoltaic-based microgrids. IEEE Trans. Power Electron. 2011, 26, 1010–1021. [Google Scholar] [CrossRef]
  12. Bhatnagar, P.; Nema, R.K. Maximum power point tracking control techniques: State-of-the-art in photovoltaic applications. Renew. Sustain. Energy Rev. 2013, 23, 224–241. [Google Scholar] [CrossRef]
  13. Ishaque, K.; Salam, Z. A review of maximum power point tracking techniques of PV system for uniform insolation and partial shading condition. Renew. Sustain. Energy Rev. 2013, 19, 475–488. [Google Scholar] [CrossRef]
  14. Liu, L.; Meng, X.; Liu, C. A review of maximum power point tracking methods of PV power system at uniform and partial shading. Renew. Sustain. Energy Rev. 2016, 53, 1500–1507. [Google Scholar] [CrossRef]
  15. Chen, K.; Tian, S.; Cheng, Y.; Bai, L. An improved MPPT controller for photovoltaic system under partial shading condition. IEEE Trans. Sustain. Energy 2014, 5, 978–985. [Google Scholar] [CrossRef]
  16. Ahmad, R.; Murtaza, A.F.; Sher, H.A.; Shami, U.T.; Olalekan, S. An analytical approach to study partial shading effects on PV array supported by literature. Renew. Sustain. Energy Rev. 2017, 74, 721–732. [Google Scholar] [CrossRef]
  17. Ahmed, M.; Harbi, I.; Kennel, R.; Abdelrahem, M. Dual-Mode Power Operation for Grid-Connected PV Systems with Adaptive DC-link Controller. Arab. J. Sci. Eng. 2022, 47, 2893–2907. [Google Scholar] [CrossRef]
  18. Sera, D.; Mathe, L.; Kerekes, T.; Spataru, S.V.; Teodorescu, R. On the perturb-and-observe and incremental conductance MPPT methods for PV systems. IEEE J. Photovolt. 2013, 3, 1070–1078. [Google Scholar] [CrossRef]
  19. Kermadi, M.; Salam, Z.; Eltamaly, A.M.; Ahmed, J.; Mekhilef, S.; Larbes, C.; Berkouk, E.M. Recent developments of MPPT techniques for PV systems under partial shading conditions: A critical review and performance evaluation. IET Renew. Power Gener. 2020, 14, 3401–3417. [Google Scholar] [CrossRef]
  20. Manoharan, P.; Subramaniam, U.; Babu, T.S.; Padmanaban, S.; Holm-Nielsen, J.B.; Mitolo, M.; Ravichandran, S. Improved perturb and observation maximum power point tracking technique for solar photovoltaic power generation systems. IEEE Syst. J. 2020, 15, 3024–3035. [Google Scholar] [CrossRef]
  21. Ayop, R.; Tan, C.W. Rapid prototyping of photovoltaic emulator using buck converter based on fast convergence resistance feedback method. IEEE Trans. Power Electron. 2018, 34, 8715–8723. [Google Scholar] [CrossRef]
  22. Moussa, I.; Khedher, A.; Bouallegue, A. Design of a low-cost PV emulator applied for PVECS. Electronics 2019, 8, 232. [Google Scholar] [CrossRef] [Green Version]
  23. Ali, A.N.; Premkumar, K.; Vishnupriya, M.; Manikandan, B.V.; Thamizhselvan, T. Design and development of realistic PV emulator adaptable to the maximum power point tracking algorithm and battery charging controller. Sol. Energy 2021, 220, 473–490. [Google Scholar]
  24. Merenda, M.; Iero, D.; Carotenuto, R.; Della Corte, F.G. Simple and low-cost photovoltaic module emulator. Electronics 2019, 8, 1445. [Google Scholar] [CrossRef] [Green Version]
  25. Batzelis, E. Non-iterative methods for the extraction of the single-diode model parameters of photovoltaic modules: A review and comparative assessment. Energies 2019, 12, 358. [Google Scholar] [CrossRef] [Green Version]
  26. Ahmed, M.; Abdelrahem, M.; Harbi, I.; Kennel, R. An adaptive model-based mppt technique with drift-avoidance for grid-connected PV systems. Energies 2020, 13, 6656. [Google Scholar] [CrossRef]
  27. Sera, D.; Teodorescu, R.; Rodriguez, P. PV panel model based on datasheet values. In Proceedings of the IEEE International Symposium on Industrial Electronics, Vigo, Spain, 4–7 June 2007; IEEE: Piscataway, NJ, USA, 2007; pp. 2392–2396. [Google Scholar]
  28. Femia, N.; Petrone, G.; Spagnuolo, G.; Vitelli, M. Optimization of perturb and observe maximum power point tracking method. IEEE Trans. Power Electron. 2005, 20, 963–973. [Google Scholar] [CrossRef]
  29. Elgendy, M.A.; Zahawi, B.; Atkinson, D.J. Assessment of perturb and observe MPPT algorithm implementation techniques for PV pumping applications. IEEE Trans. Sustain. Energy 2011, 3, 21–33. [Google Scholar] [CrossRef]
  30. Ishaque, K.; Salam, Z.; Amjad, M.; Mekhilef, S. An improved particle swarm optimization (PSO)—Based MPPT for PV with reduced steady-state oscillation. IEEE Trans. Power Electron. 2012, 27, 3627–3638. [Google Scholar] [CrossRef]
  31. Ishaque, K.; Salam, Z. A deterministic particle swarm optimization maximum power point tracker for photovoltaic system under partial shading condition. IEEE Trans. Ind. Electron. 2012, 60, 3195–3206. [Google Scholar] [CrossRef]
  32. Eltamaly, A.M.; Al-Saud, M.S.; Abo-Khalil, A.G. Performance improvement of PV systems’ maximum power point tracker based on a scanning PSO particle strategy. Sustainability 2020, 12, 1185. [Google Scholar] [CrossRef]
  33. Rezk, H.; Fathy, A.; Abdelaziz, A.Y. A comparison of different global MPPT techniques based on meta-heuristic algorithms for photovoltaic system subjected to partial shading conditions. Renew. Sustain. Energy Rev. 2017, 74, 377–386. [Google Scholar] [CrossRef]
  34. Nadeem, A.; Sher, H.A.; Murtaza, A.F. Online fractional open-circuit voltage maximum output power algorithm for photovoltaic modules. IET Renew. Power Gener. 2020, 14, 188–198. [Google Scholar] [CrossRef]
  35. Ahmed, J.; Salam, Z. An improved perturb and observe (P&O) maximum power point tracking (MPPT) algorithm for higher efficiency. Appl. Energy 2015, 150, 97–108. [Google Scholar]
Figure 1. P-V characteristics of the PV source under uniform solar radiation conditions.
Eng 03 00031 g001
Figure 2. P-V characteristics of the PV source under nonuniform solar radiation conditions: (a) The global peak on the left side (b) The global peak on the right side.
Eng 03 00031 g002
Figure 3. Single unit of the battery-based PV emulator.
Eng 03 00031 g003
Figure 4. The P-V characteristics of the PV emulator at different power levels.
Eng 03 00031 g004
Figure 5. The characteristics of the PV emulator to represent partial shading conditions: (a) The global peak is on the left side (b) The global peak is on the right side.
Eng 03 00031 g005
Figure 6. The behavior of the P&O method under three steps operation.
Eng 03 00031 g006
Figure 7. The considered PV emulation system for MPPT implementation.
Eng 03 00031 g007
Figure 8. The performance of the MPPT methods under partial shading conditions (the global peak is on the left side): (a) The P&O method (b) The particle swarm optimization technique.
Eng 03 00031 g008
Figure 9. The experimental HIL set-up of the PV system.
Eng 03 00031 g009
Figure 10. The performance of the MPPT methods under partial shading conditions with resistive load (the global peak is on the right side): (a) The P&O method (b) The particle swarm optimization technique.
Eng 03 00031 g010
Figure 11. The performance of the MPPT methods under partial shading conditions with battery (the global peak on the right side): (a) The P&O method (b) The particle swarm optimization technique.
Eng 03 00031 g011
Figure 12. The I-V and P-V characteristics of KC200GT PV module at different atmospheric conditions (Matlab/Simulink PV emulator): (a) Solar radiation (b) Temperature.
Eng 03 00031 g012
Figure 13. P-V characteristics of the proposed PV emulator to represent various temperature conditions.
Eng 03 00031 g013
Figure 14. Different cases of partial shading based on Matlab/Simulink PV emulator.
Eng 03 00031 g014
Figure 15. Complex partial shading cases using Matlab/Simulink PV emulator.
Eng 03 00031 g015
Figure 16. The characteristics of the PV emulator for more complex partial shading conditions: (a) The global peak is in the middle (b) The global peak occurs at first.
Eng 03 00031 g016
Figure 17. The performance of the P&O method under complex partial shading condition (peak at the middle): (a) Failure to extract the global peak (b) Success to obtain the global peak.
Eng 03 00031 g017
Table 1. The parameters of the PV emulation system.
ParameterValue
Boost inductance ( L ) 1 mH
Input capacitor ( c p v e ) 500 μ F
Output capacitor ( C ) 200 μ F
Load resistance ( R ) 50 Ω
Switching frequency5 kHz
MPPT sampling 0.01 s
Table 2. Average efficiencies of the MPPT techniques (simulation).
Method η p v , a v g (%)
P&O82.04
PSO98.69
Table 3. Average efficiencies of the MPPT techniques (experimental).
MethodResistive Load, η p v , a v g (%)Battery, η p v , a v g (%)
P&O87.4787.43
PSO99.8599.89
Publisher’s Note: MDPI stays neutral with regard to jurisdictional claims in published maps and institutional affiliations.

