1. Introduction
Intersection-related crashes are responsible for more than 20% of road traffic fatalities, and more than 40% of total crash injuries in the United States. Complex traffic movements and the interaction between different transportation modes establish the intersections as hazardous locations for all road users [
1,
2,
3,
4]. In addition, intersection safety is facing new challenges with rapidly increasing traffic volumes and developing technologies. Planning for traffic control and safety at intersections can be even more challenging with multimodal operations. Therefore, the Federal Highway Administration (FHWA) and state Departments of Transportations (DOTs) are continuously striving to mitigate crash injury severity and reduce traffic-related fatalities [
5,
6,
7,
8,
9]. The injury severity of traffic crashes can be related to different categories of contributing factors including crash, driver, environmental, and roadway attributes. While roadway characteristics are usually considered in traffic safety studies, pavement surface friction is a commonly omitted variable in crash analysis.
Pavement friction is the force resisting the relative motion between the vehicle tires and the pavement surface. The loss of skid resistance prevents drivers from safely maneuvering or stopping their vehicles, which leads to increased crash frequency and severity [
10,
11,
12]. Tire-pavement interaction leads to aggregate polishing in the pavement surface layer, which reduces pavement friction supply over time. Thus, transportation agencies ought to consistently monitor the pavement surface friction levels. A recent survey of the roadway surface friction management practices revealed that only eleven of the surveyed thirty-two DOTs collect pavement friction data on specific road locations (such as ramps, curves, and intersections) to investigate safety concerns. The increase in wet pavement crashes is a grave safety concern, urging the need for friction-related data collection at locations experiencing such crashes [
13].
Wet pavement crashes are typically linked to poor skid resistance, since wet pavement surfaces can substantially reduce the frictional force. Insufficient friction levels may lead to a similar issue on dry pavement surfaces [
14,
15]. The State of Wyoming has one of the highest snowfall rates in the United States. Therefore, non-dry pavement conditions are common in the state. A third of traffic crashes in Wyoming occur on non-dry pavement surface conditions, including snowy, icy, wet, or slushy road surfaces [
16,
17,
18]. Pavement surface treatments play a critical role in supplying sufficient friction levels across the roadway network. Surface treatments are commonly applied to specific locations with high friction demand, such as intersections. These surface treatments include hot-mix asphalt (HMA) overlays, chip seals, open-graded friction courses (OGFC), micro-milling, and high friction surface treatments (HFST) [
14,
19,
20,
21,
22].
The objective of this study was to investigate the roadway risk factors, including pavement friction, influencing the injury severity of intersection crashes. A set of roadway-related characteristics and critical environmental conditions were considered in the analysis. This paper is organized as follows. A review of the relevant studies in the traffic safety literature is discussed. Afterward, the methodology, data description, results of the empirical analysis, conclusion, and recommendations are all discussed.
2. Literature Review
This section provides a review of multiple studies related to the influence of roadway characteristics and pavement friction on crash injury severity. The limitations of the reviewed studies are identified, and the contribution of this research is discussed. The following studies did not consider pavement friction as a risk factor in the analysis.
Abdel-Aty and Keller [
23] addressed different contributing factors to crash injury severity at signalized intersections in Florida using ordinal probit models. The results demonstrated that a combination of crash-related attributes and intersection characteristics influence crash injury severity. It was found that an increase in the number of lanes, the presence of medians, and right-turn channelization reduces the risk of sustaining severe injury. Even though the authors examined a wide set of roadway attributes, the pavement surface friction and road surface condition variables were not incorporated in the study.
Haleem and Abdel-Aty [
24] selected multiple approaches, including two ordinal probit models, to examine crash injury severity at unsignalized intersections in Florida. The authors incorporated the driver’s characteristics, intersection attributes, pavement surface type (concrete, asphalt, etc.), and road surface condition (dry, wet, etc.), among other factors. This study included the number of thorough lanes as a surrogate measure for traffic volume on the minor road. The authors identified several significant factors influencing the crash severity including intersection and driver characteristics. The left shoulder width, right shoulder width, and number of turning lanes were found to be among the influential factors. Yet, the authors did not account for pavement friction as a potential risk factor.
Anowar et al. [
25] investigated the contributing factors to intersection crash severity in Bangladesh by utilizing a generalized ordinal logit model. The authors examined the impact of various crash, environmental, and roadway attributes. As per the results, undivided roads, dry pavement surfaces, and rural areas were found to raise the risk of incurring severe injury. Even though the authors considered the road surface condition, pavement friction was not considered in the analysis.
Oh [
26] examined the contributing factors to crash injury severity at four-leg signalized intersections in rural areas. The author applied ordinal probit models to investigate the crash, weather, and roadway risk factors. The results indicated that tighter horizontal curves and higher speed limits contribute to severe crashes, while wider medians and the presence of protected left-turn phases are associated with less severe crashes. Yet, the author did not incorporate pavement surface friction as a potential contributing factor to crash injury severity.
Lee et al. [
27] developed Bayesian ordinal logistic regression models to explore the impact of pavement surface conditions on the crash injury severity. The findings indicated that poor pavement surfaces increase the severity of multiple-vehicle crashes regardless of the posted speed limit. The findings also demonstrated that deteriorated pavement surfaces decrease the severity of single-vehicle crashes on low-speed roads (having posted speed limits of 35 mi/h or below) and increase such severity on high-speed roads (having speed limits of 50 mi/h or above). It should be noted that this study incorporated the pavement condition variable instead of the pavement friction in the analyses.
Zhao et al. [
28] employed a multivariate Poisson log-normal model to analyze traffic crashes on the approaches of urban signalized intersections in the State of Nebraska. The study was focused on traffic and roadway geometric risk factors. The study’s results demonstrated that intersection approaches on urban arterial roads have more frequent and higher severity crashes compared to collector roads. The results also indicated that the number of right-turn, left-turn, and through lanes influences crash frequency. The study did not consider any factors related to pavement condition or pavement friction.
The following study considered pavement friction as a risk factor, but they had other limitations, as follows.
Hussien et al. [
29] investigated the effects of pavement resurfacing on intersection safety by conducting a before-after study on signalized intersections that were subjected to resurfacing in Melbourne, Australia. The authors incorporated multiple pavement condition data variables including roughness, skid resistance, and rutting. The authors also considered roadway characteristics and environmental conditions. The results demonstrated that pavement maintenance and improving skid resistance reduce the frequency and severity of crashes at signalized intersections. The results also identified other significant factors, including lighting, road surface condition, and interaction parameters, such as approach width interactions with the presence of a median, bus stop, or shared lane. Even though the authors incorporated pavement condition information including skid resistance and various roadway characteristics, the study’s scope did not encompass rural intersections and the authors omitted several roadway characteristics. They include the roadway grade, horizontal curvature, roadway functional classification, and right shoulder attributes.
Sharafeldin et al. [
30] developed a Bayesian ordinal probit model to investigate the impact of pavement friction, among other risk factors, on injury severity of the intersection crashes. The study concluded that insufficient pavement friction supply is one of the main contributors to severe crashes at intersections. Even though the study considered pavement friction as a potential risk factor, the study analyzed a limited data set and did not include other roadway attributes. Other related studies to this research topic include those of Chen et al. [
31], Sharafeldin et al. [
32], Karlaftis and Golias [
33], Roy et al. [
12], Chen et al. [
34], Papadimitriou et al. [
35], and Zhao et al. [
36].
Generally, there is a growing interest in research about the relationship between pavement friction and traffic safety. However, to the best of the authors’ knowledge, the investigation of the pavement friction’s effect, among the other roadway attributes, on intersection crash severity is insufficient. In this research, the risk of observing severe injury crashes at intersections is modeled as a function of environmental and roadway factors, especially pavement surface friction.
3. Research Methodology
Ordered response modeling techniques have been widely adopted in crash injury severity studies to account for the ordinal nature of the injury severity levels. Ordinal probit and logit models were extensively utilized to study the risk factors of crash injury severity [
37,
38]. The ordinal probit model structure estimates the latent propensity,
, for each crash, i, as follows [
39]:
The predictors are described by the X’s, while their regression coefficients are described by the β’s, which are estimated using the maximum likelihood estimation (MLE) method. The random error term is defined by ɛ
i, and it is assumed to be normally distributed. The response formulation is stated as follows [
39], where ψ is a threshold that is estimated via the MLE technique.
The outcome probabilities, P(.)’s, are calculated by the following equations where F(.) is the cumulative standard normal distribution function [
40]:
Confidence intervals of 90th were utilized to identify the statistically significant variables instead of the 95th intervals. This was to retain the valuable information usually lost by utilizing narrower confidence intervals. Marginal effects are estimated to identify the influences of contributing factors on crash injury severity. The marginal effect is the average change in the probability of incurring an injury of severity j, ΔP (y = j), as a result of the variable’s influence, provided that all other variables are controlled [
40].
4. Data Collection
This study involved the examination of crash data obtained from the Critical Analysis Reporting Environment (CARE) package of the Wyoming Department of Transportation (WYDOT). The crash records were collected by WYDOT from police crash reports and inputted into the package. The data were prepared such that each data point represented a unique intersection crash record, including the pavement friction number measured at the intersection in the crash year. The data included records of 9108 unique crashes at 359 intersections from January 2007 through December 2017, except for the years 2010 and 2011 due to friction data availability. Crashes specified as intersection crashes are those located within 250 feet (76.2 m) from the center of the intersection, as per the American Association of State Highway and Transportation Officials [
41]. The crash records included information on the roadway and other characteristics as well.
WYDOT personnel collected the pavement friction data across the state using the locked-wheel tester. The locked-wheel tester is a trailer with two wheels having standard tires. The device tests the longitudinal friction by using either one or two wheels. The testing tires can be either smooth or ribbed. The smooth tire is sensitive to macrotexture while the ribbed tire is more sensitive to microtexture [
10]. The locked-wheel device measures pavement friction by fully locking the testing wheel(s) and recording the average sliding force at which the fully locked state is achieved. Accordingly, the locked-wheel device can only measure friction at specific time intervals due to the full-lock requirement [
42]. The friction number are usually reported as (FN40R), which is measured by using a locked wheel tester, fitted by a standard ribbed tire at 40 mile per hour. The Federal Highway Administration (FHWA) promotes utilizing the continuous pavement friction measurement (CPFM) technique to collect friction data continually along road networks, including special locations, such as curves, ramps, and intersections [
43].
The field data were calibrated by WYDOT at the regional calibration center. Friction data were integrated with the obtained intersection crash data by matching the mile post of the intersection with the friction measurement’s locations identified by mile posts. When the friction measure was not gauged exactly at the intersection location, the nearest two measurements (before and after the intersection) along the major route were averaged to calculate the friction at the intersection. Moreover, the friction numbers were estimated at the years with no friction data collection by averaging the measurements of the previous and the subsequent years at the study location. This approach was only applied at locations where friction numbers were declining. This indicated that no maintenance work was performed and the difference in friction numbers (FN40R) between the previous and the subsequent years was 10 or less, to ensure the validity of the averaged measurements. This method assumes that the pavement friction was deteriorating at a steady rate over the three years. The friction measurements were matched to the crash records that occurred in the same year of the friction measurement. Each row of the dataset represented a unique crash record with the friction number at the intersection, measured in the crash year.
5. Data Description
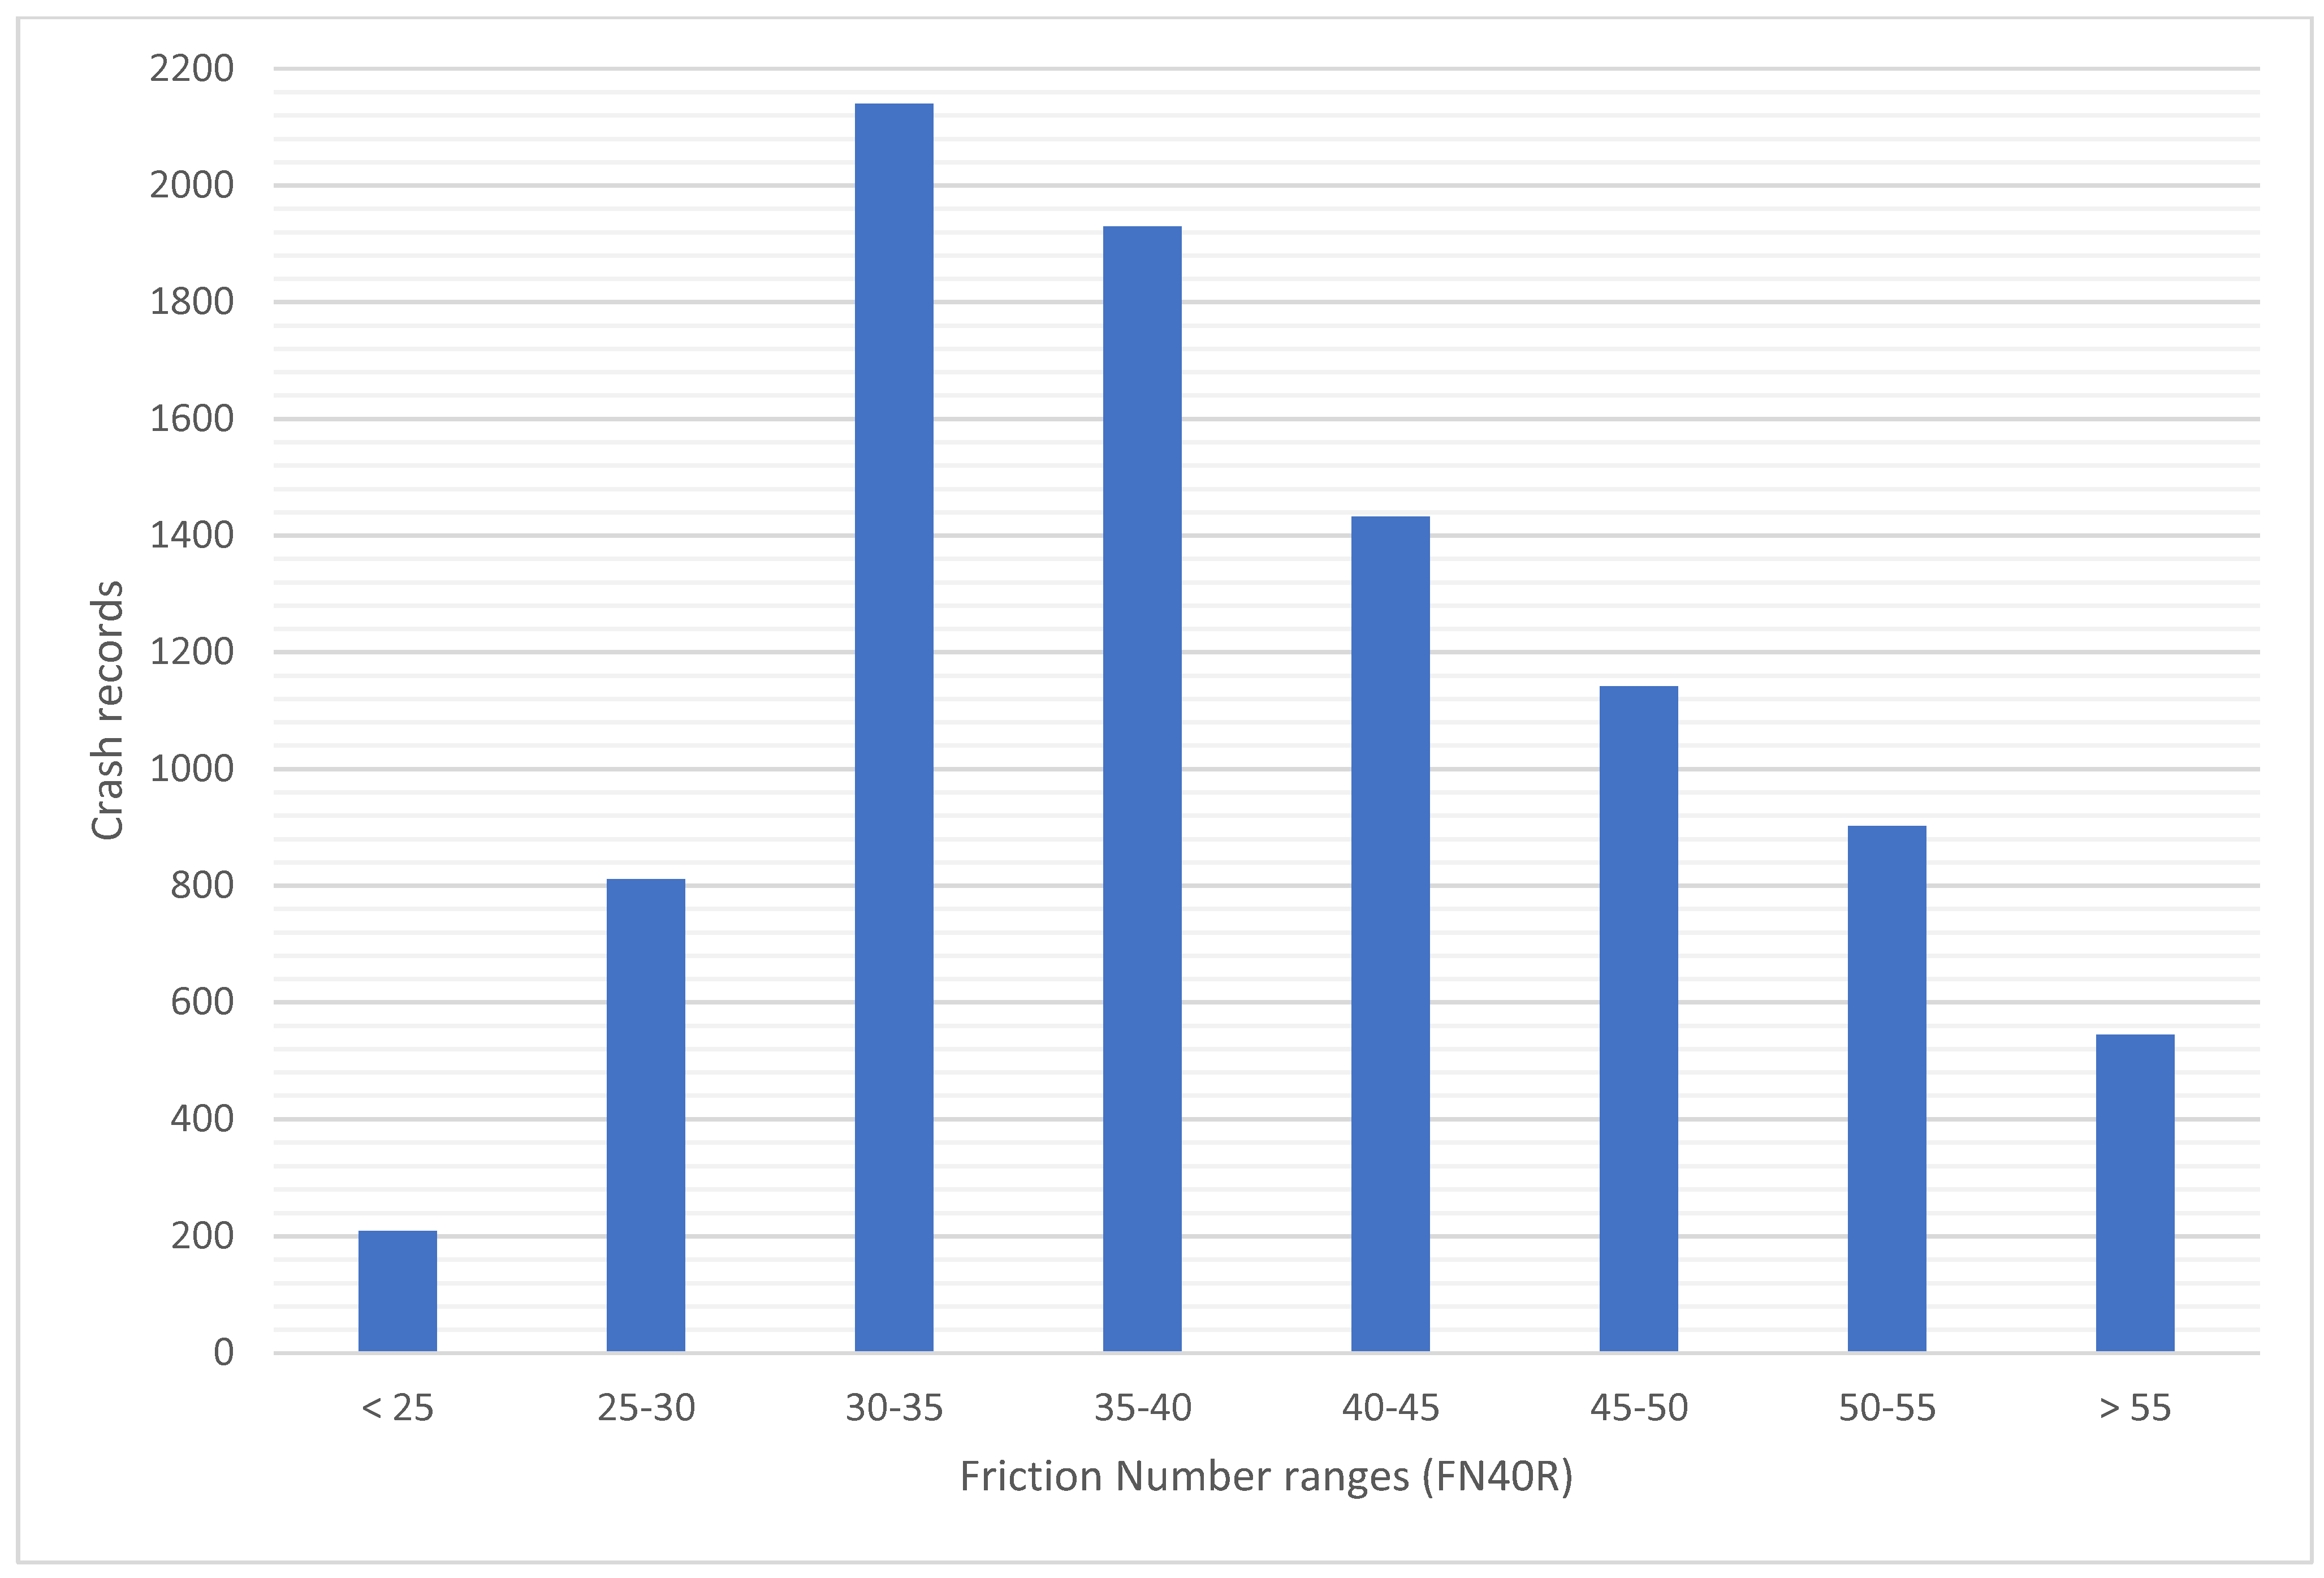
In this study, the crash injury severity is classified into three categories: O for property damage only (PDO) or no injury crashes, BC for possible or minor injury crashes, and KA for the highest severity level, which is disabling or fatal injury crashes. PDO crashes represented 75.9% of the total crash records. Possible and minor injury crashes accounted for 22.3%, while disabling and fatal injury crashes comprised 1.8% of the data. The investigated roadway attributes were pavement surface friction, intersection type, intersection location attributes, number of lanes, grade (uphill, downhill, and level), horizontal curvature, roadway functional classification, roadway surface type, guardrail presence, presence of rumble strips, median type, median width, right shoulder type, and right shoulder width. The pavement friction values (FN40R) ranged from 19 to 71 with an average of 40.
Figure 1 illustrates the friction number distribution for the crash records.
Table 1 presents summary statistics of this study’s data. As for the other roadway characteristics, the majority of the examined crashes occurred at signalized intersections, intersections with four or more legs, and intersections in urban areas. The intersections were identified as urban or rural according to the US Census Bureau’s definition [
44]. Limited proportions of crashes were at uphill and downhill intersections in contrast to crashes on level intersections. The data included the functional classification of the major roadways of the intersections. Most recorded crashes occurred at intersections of principal arterial roads, while smaller proportions occurred on interstate, minor arterial, and collector roads. Local roads were considered as the reference category for this variable in the modeling. It should be noted that the intersections with a functional classification of “Interstate” refer to intersections with interstate interchanges (on/off ramps).
Low proportions of crashes occurred at intersections having horizontal curves. The number of through lanes and road surface type were also considered. Low proportions of crashes occurred at intersections with guardrails or rumble strips. A total of 45% of the collected crash records occurred at intersections near schools, while a low proportion of them occurred near liquor stores.
As for the median type, almost half of the crashes involved a raised median, while a limited proportion involved a depressed median. The absence of a median was considered as the reference category in the modeling. Medians wider than 100 feet (30.5 m) were estimated as 120 feet (36.6 m) wide. As for the right shoulder type, more than a quarter of the crash records occurred at sites having asphalt shoulders, while a third of them occurred at sites having concrete shoulders. On the contrary, a small percentage occurred at sites with unpaved right shoulders. The absence of a right shoulder was considered as the reference category for this variable in the modeling. Moreover, right shoulders that were wider than 8.5 feet (2.6 m) were estimated as 10 feet (3 m) wide.
When it comes to environmental conditions, almost a quarter of the crashes occurred under non-daylight conditions, such as nighttime, dawn, or dusk conditions. Moreover, a considerable proportion of crashes occurred during adverse weather conditions. The adverse weather categories included rain, snow, blizzard, hail, fog, and any other inclement weather conditions. Concerning the road surface condition, over a quarter of the crashes occurred on non-dry road surfaces such as wet, snowy, icy, slushy, and any other adverse conditions.
6. Empirical Analysis
An ordinal probit model was developed to analyze the intersection crash data. The aforementioned explanatory variables were all considered in the model. The 90th percentile confidence level was selected for ascertaining statistically significant variables and the log-likelihood ratio test was conducted to test for the model’s significance. The results of the model are presented in
Table 2. Note that statistically insignificant variables are not shown in the table.
The modeling results indicated that several roadway attributes, including pavement surface friction, and two environmental conditions, are significantly impacting the crash injury severity at intersections. The marginal effects of the significant risk factors are presented in
Table 3. In
Table 3, the ΔP(.)’s represent the changes in the risks of observing crash severity j, whether KA, BC, or O are as a result of the explanatory variable’s effect. Each variable’s effect on the injury severity was estimated assuming all other variables were controlled, and the continuous variables (pavement friction and right shoulder width) were at their average values.
The findings demonstrated that several intersection attributes had a strong impact on crash severity risk. As shown in
Table 3, pavement surface friction substantially influences the severity of intersection crashes. It was estimated that, on average, increasing the pavement friction numbers (FN40R) at intersections from 25 to 45 reduces the risk of observing BC and KA injuries by 1.65% and 0.36%, respectively. Sharafeldin et al. [
30] and Hussien et al. [
29] reported relevant findings indicating that insufficient friction levels increase the risks of crash frequency and severity. This finding emphasizes the significance of maintaining sufficient pavement friction levels on roadway networks, especially at high-risk crash locations with a larger friction demand, such as intersections, ramps, and curves, to alleviate severe injury concerns.
Crashes at urban intersections were found to be associated with lower injury severity risk compared to crashes at rural intersections. It was estimated that, on average, an urban intersection crash would have a 6.44% and a 1.14% lower chance of resulting in BC and KA injuries, respectively, relative to rural intersection crashes. The higher severity of rural crashes is plausibly related to higher speed limits, higher chances of driver distraction, non-compliance with safety measures, and driver fatigue due to longer travel distances. In addition, medical assistance has better access to crash victims in urban areas compared to rural locations. These findings align with those of Anowar et al. [
25] and Oh [
26]. This finding shed light on the premise that crashes at rural intersections have higher injury severities. This is critical to the State of Wyoming, since it has a higher number of rural and semirural intersections.
The roadway functional classification was found to be a significant contributing factor to crash severity. Intersection crashes on principal and minor arterial roads were found to be severe compared to those that occurred on local roads. Crashes on principal arterials were found to have higher severity levels with marginal effects of 2.39% and 0.55% for BC and KA injuries, respectively. Crashes on minor arterials were found to have higher severity levels with marginal effects of 4.23% and 1.02% for BC and KA injuries, respectively. These findings are possibly attributed to the higher percentage of trucks and more complex traffic mixes on arterial roads compared to those on local roads. Zhao et al. [
28] reported similar findings. The higher severity of crashes on minor arterials compared to that of principal arterials is plausibly related to the higher speed differentials among vehicles on minor arterials. The presence of guardrails was found to be associated with higher injury severity levels. Crashes on intersections with guardrails would have 7.02% and 1.86% higher chances of resulting in BC and KA injuries, respectively. Plausibly, this is because of the correlation between higher speed facilities and guardrail installation.
The right shoulder width was found to significantly impact intersection crash injury severity. It was estimated that, on average, widening the right shoulders at intersections from 4 to 10 feet (1.2 to 3 m) raises the risk of observing BC and KA injuries by 2.73% and 0.64%, respectively. This finding may be attributed to the improper use of wide shoulders, which increases the risk of observing sideswipe and rear-end crashes. Such crashes are possibly severe at high-impact speeds. It should be noted that wider shoulders are typically utilized on high-speed roads. Haleem and Abdel-Aty [
24] reported similar findings.
As for the environmental factors, two environmental conditions were found to have a significant impact on injury severity risk. Non-dry road surfaces were found to be inversely related to crash injury severity. It was estimated that, on average, crashes on non-dry road surfaces have 6.97% and 1.21% lower chances of resulting in BC and KA injuries, respectively, compared to crashes on dry surfaces. This finding is possibly attributed to the cautious driving behavior and lower speeds observed on non-dry roads. Comparable findings were reported by Anowar et al. [
25]. The lighting condition at the time of the crash was found to influence crash injury severity. Crashes that occurred during non-daylight conditions would have 2.11% and 0.48% higher chances of resulting in BC and KA injuries, respectively, compared to crashes that occurred under daylight conditions. Haleem and Abdel-Aty [
24] and Oh [
26] reported similar findings.
7. Conclusions and Recommendations
In this study, an attempt was made to explore the influencing factors of crash injury severity at intersections. That is, intersection and environmental contributing factors were examined. An ordinal probit model was developed to investigate the crash severity risk factors. The analysis results demonstrated that several parameters significantly impact crash injury severity. Pavement friction was found to be a substantial effect, as increasing friction numbers at intersections was found to mitigate crash injury severity. It was also concluded that fatal and disabling injury crashes are more likely to occur at rural intersections compared to urban intersections. Therefore, rural intersections require more attention when it comes to maintaining adequate pavement friction levels and implementing crash mitigation measures. This finding is particularly valuable to the State of Wyoming, since it is characterized by rural and semi-rural areas. The functional classification of the roadway was also found to influence crash severity, as intersection crashes on arterial roads tend to have higher injury severity likelihoods compared to local roads. The widening of right shoulders and the deployment of guardrails were found to be associated with severe crashes. On the other hand, non-dry road surfaces were found to reduce the likelihood of observing severe crashes. Finally, crashes that occurred during daylight conditions were found to be less severe than those that occurred during other conditions.
It is recommended to raise pavement friction levels at intersections to adequate levels to mitigate crash injury severity and crash probability. It is also recommended to provide proper lighting at intersections, especially rural intersections, to lower the risk of observing severe crashes. Intersections on arterials, high-speed facilities, and rural intersections require more attention for countermeasure planning and implementation, since they are linked to high injury severity crashes. In addition, the findings related to the intersection characteristics can be further investigated to plan for the appropriate treatments. Implementing countermeasures that reduce severe crashes, such as those documented in the Crash Modification Factors (CMF) Clearinghouse [
45], may be extensively reviewed.
8. Study Limitations and Future Research
The study had one main limitation, which is not including the traffic volume at intersection approaches due to data availability.
Author Contributions
Conceptualization, M.S., A.F. and K.K.; methodology, M.S.; software, M.S.; validation M.S., A.F. and K.K.; formal analysis, M.S.; investigation, M.S. and A.F.; resources, K.K.; data curation, M.S.; writing—original draft preparation, M.S.; writing—review and editing, M.S., A.F. and K.K.; visualization, M.S.; supervision, K.K.; project administration, K.K.; funding acquisition, K.K. All authors have read and agreed to the published version of the manuscript.
Funding
This research was funded by the Wyoming Department of Transportation (WYDOT), grant number: RS05221.
Institutional Review Board Statement
Not applicable.
Informed Consent Statement
Not applicable.
Data Availability Statement
The data were collected from the Critical Analysis Reporting Environment (CARE) package, supported by the Wyoming Department of Transportation (WYDOT).
Acknowledgments
The authors gratefully acknowledge the effective financial support of WYDOT. All opinions are solely of the authors. The subject matter, all figures, tables, and equations, not previously copyrighted by outside sources, are copyrighted by WYDOT, the State of Wyoming, and the University of Wyoming. All rights reserved copyrighting in 2022.
Conflicts of Interest
The authors declare that they have no conflict of interest with all parties.
References
- PDO; TPDO. The National Intersection Safety Problem; U.S. Department of Transportation, Federal Highway Administration, Office of Safety: Washington, DC, USA, 2004.
- Arafat, M.; Hadi, M.; Raihan, M.A.; Iqbal, M.S.; Tariq, M.T. Benefits of connected vehicle signalized left-turn assist: Simulation-based study. Transp. Eng. 2021, 4, 100065. [Google Scholar] [CrossRef]
- Stevanovic, A.; Dobrota, N.; Mitrovic, N. NCHRP 20-07/Task 414: Benefits of Adaptive Traffic Control Deployments—A Review of Evaluation Studies; NCHRP: Washington, DC, USA, 2019. [Google Scholar]
- Reza, I.; Ratrout, N.T.; Rahman, S.M. Calibration protocol for paramics microscopic traffic simulation model: Application of neuro-fuzzy approach. Can. J. Civ. Eng. 2016, 43, 361–368. [Google Scholar] [CrossRef]
- Cvijovic, Z.; Zlatkovic, M.; Stevanovic, A.; Song, Y. Multi-Level Conditional Transit Signal Priority in Connected Vehicle Environments. J. Road Traffic Eng. 2021, 67, 1–12. [Google Scholar] [CrossRef]
- Dobrota, N.; Stevanovic, A.; Mitrovic, N. Development of assessment tool and overview of adaptive traffic control deployments in the US. Transp. Res. Rec. 2020, 2674, 464–480. [Google Scholar] [CrossRef]
- Dobrota, N.; Stevanovic, A.; Mitrovic, N. A novel model to jointly estimate delay and arrival patterns by using high-resolution signal and detection data. Transp. A Transp. Sci. 2022, 1–33. [Google Scholar] [CrossRef]
- Cvijovic, Z.; Zlatkovic, M.; Stevanovic, A.; Song, Y. Conditional transit signal priority for connected transit vehicles. Transp. Res. Rec. 2022, 2676, 490–503. [Google Scholar] [CrossRef]
- Reza, I.; Ratrout, N.T.; Rahman, S.M. Artificial Intelligence-Based Protocol for Macroscopic Traffic Simulation Model Development. Arab. J. Sci. Eng. 2021, 46, 4941–4949. [Google Scholar] [CrossRef]
- Hall, J.W.; Smith, K.L.; Titus-Glover, L.; Wambold, J.C.; Yager, T.J.; Rado, Z. Guide for Pavement Friction; Final Report for NCHRP Project; NCHRP: Washington, DC, USA, 2009; Volume 1, p. 43. [Google Scholar]
- Hafez, M.; Farid, A.; Ksaibati, K.; Director, P.E.; Rickgauer, S.; Carlson, M. Managing Pavement Friction of Wyoming’s Roads Considering Safety; Wyoming Department of Transportation: Cheyenne, WY, USA, 2020. [Google Scholar]
- Roy, U.; Farid, A.; Ksaibati, K. Effects of Pavement Friction and Geometry on Traffic Crash Frequencies: A Case Study in Wyoming. Int. J. Pavement Res. Technol. 2022, 1–14. [Google Scholar] [CrossRef]
- Elkhazindar, A.; Hafez, M.; Ksaibati, K. Incorporating Pavement Friction Management into Pavement Asset Management Systems: State Department of Transportation Experience. CivilEng 2022, 3, 541–561. [Google Scholar] [CrossRef]
- FHWA. Evaluation of Pavement Safety Performance. Available online: https://www.fhwa.dot.gov/publications/research/safety/14065/003.cfm (accessed on 31 July 2022).
- Abaza, O.A.; Chowdhury, T.D.; Arafat, M. Comparative analysis of skid resistance for different roadway surface treatments. Am. J. Eng. Appl. Sci. 2017, 10, 890–899. [Google Scholar] [CrossRef][Green Version]
- NHTSA. National Highway Traffic Safety Administration (NHTSA) Motor Vehicle Crash Data Querying and Reporting. Available online: https://www.nhtsa.gov/research-data/fatality-analysis-reporting-system-fars (accessed on 19 July 2022).
- Alrejjal, A.; Farid, A.; Ksaibati, K. Investigating factors influencing rollover crash risk on mountainous interstates. J. Saf. Res. 2022, 80, 391–398. [Google Scholar] [CrossRef]
- Alrejjal, A.; Farid, A.; Ksaibati, K. A correlated random parameters approach to investigate large truck rollover crashes on mountainous interstates. Accid. Anal. Prev. 2021, 159, 106233. [Google Scholar] [CrossRef]
- Abdalla, A.; Faheem, A.F.; Walters, E. Life cycle assessment of eco-friendly asphalt pavement involving multi-recycled materials: A comparative study. J. Clean. Prod. 2022, 362, 132471. [Google Scholar] [CrossRef]
- Abaza, O.A.; Arafat, M.; Uddin, M.S. Physical and economic impacts of studded tyre use on pavement structures in cold climates. Transp. Saf. Environ. 2021, 3, tdab022. [Google Scholar] [CrossRef]
- Rezapour, M.; Hafez, M.; Ksaibati, K. Evaluating the Complex Relationship between Environmental Factors and Pavement Friction Based on Long-Term Pavement Performance. Computation 2022, 10, 85. [Google Scholar] [CrossRef]
- Abdalla, A.; Faheem, A.F.; Hosseini, A.; Titi, H. Performance Related Asphalt Mixtures Characterization; No. TRBAM-21-03073; National Academies of Sciences, Engineering, and Medicine: Washington, DC, USA, 2021. [Google Scholar]
- Abdel-Aty, M.; Keller, J. Exploring the overall and specific crash severity levels at signalized intersections. Accid. Anal. Prev. 2005, 37, 417–425. [Google Scholar] [CrossRef]
- Haleem, K.; Abdel-Aty, M. Examining traffic crash injury severity at unsignalized intersections. J. Saf. Res. 2010, 41, 347–357. [Google Scholar] [CrossRef]
- Anowar, S.; Yasmin, S.; Tay, R. Factors influencing the severity of intersection crashes in Bangladesh. Asian Transp. Stud. 2014, 3, 143–154. [Google Scholar]
- Oh, J.T. Development of severity models for vehicle accident injuries for signalized intersections in rural areas. KSCE J. Civ. Eng. 2006, 10, 219–225. [Google Scholar] [CrossRef]
- Lee, J.; Nam, B.; Abdel-Aty, M. Effects of pavement surface conditions on traffic crash severity. J. Transp. Eng. 2015, 141, 04015020. [Google Scholar] [CrossRef]
- Zhao, M.; Liu, C.; Li, W.; Sharma, A. Multivariate Poisson-lognormal model for analysis of crashes on urban signalized intersections approach. J. Transp. Saf. Secur. 2018, 10, 251–265. [Google Scholar] [CrossRef]
- Hussein, N.; Hassan, R.; Fahey, M.T. Effect of pavement condition and geometrics at signalised intersections on casualty crashes. J. Saf. Res. 2021, 76, 276–288. [Google Scholar] [CrossRef] [PubMed]
- Sharafeldin, M.; Albatayneh, O.; Farid, A.; Ksaibati, K. A Bayesian Approach to Examine the Impact of Pavement Friction on Intersection Safety. Sustainability 2022, 14, 12495. [Google Scholar] [CrossRef]
- Chen, S.; Saeed, T.U.; Alqadhi, S.D.; Labi, S. Safety impacts of pavement surface roughness at two-lane and multi-lane highways: Accounting for heterogeneity and seemingly unrelated correlation across crash severities. Transp. A Transp. Sci. 2019, 15, 18–33. [Google Scholar] [CrossRef]
- Sharafeldin, M.; Farid, A.; Ksaibati, K. Examining the Risk Factors of Rear-End Crashes at Signalized Intersections. J. Transp. Technol. 2022, 12, 635–650. [Google Scholar] [CrossRef]
- Karlaftis, M.G.; Golias, I. Effects of road geometry and traffic volumes on rural roadway accident rates. Accid. Anal. Prev. 2002, 34, 357–365. [Google Scholar] [CrossRef]
- Chen, H.; Cao, L.; Logan, D.B. Analysis of risk factors affecting the severity of intersection crashes by logistic regression. Traffic Inj. Prev. 2012, 13, 300–307. [Google Scholar] [CrossRef]
- Papadimitriou, E.; Filtness, A.; Theofilatos, A.; Ziakopoulos, A.; Quigley, C.; Yannis, G. Review and ranking of crash risk factors related to the road infrastructure. Accid. Anal. Prev. 2019, 125, 85–97. [Google Scholar] [CrossRef]
- Zhao, G.; Jiang, Y.; Li, S.; Tighe, S. Exploring implicit relationships between pavement surface friction and vehicle crash severity using interpretable extreme gradient boosting method. Can. J. Civ. Eng. 2022, 99, 1–14. [Google Scholar] [CrossRef]
- Farid, A.; Alrejjal, A.; Ksaibati, K. Two-lane highway crash severities: Correlated random parameters modeling versus incorporating interaction effects. Transp. Res. Rec. 2021, 2675, 565–575. [Google Scholar] [CrossRef]
- Farid, A.; Ksaibati, K. Modeling severities of motorcycle crashes using random parameters. J. Traffic Transp. Eng. (Engl. Ed.) 2021, 8, 225–236. [Google Scholar] [CrossRef]
- Eluru, N.; Bhat, C.R.; Hensher, D.A. A mixed generalized ordered response model for examining pedestrian and bicyclist injury severity level in traffic crashes. Accid. Anal. Prev. 2008, 40, 1033–1054. [Google Scholar] [CrossRef]
- Fountas, G.; Anastasopoulos, P.C.; Abdel-Aty, M. Analysis of accident injury-severities using a correlated random parameters ordered probit approach with time variant covariates. Anal. Methods Accid. Res. 2018, 18, 57–68. [Google Scholar] [CrossRef]
- National Research Council. Highway Safety Manual, 1st ed.; AASHTO: Washington, DC, USA, 2010. [Google Scholar]
- De León Izeppi, E.; Flintsch, G.; Katicha, S.; McCarthy, R.; McGhee, K. Locked-Wheel and Sideway-Force CFME Friction Testing Equipment Comparison and Evaluation Report; No. FHWA-RC-19-001; U.S. Federal Highway Administration: Washington, DC, USA, 2019.
- FHWA. Pavement Friction Management. Federal Highway Administration (FHWA). Available online: https://safety.fhwa.dot.gov/roadway_dept/pavement_friction/cpfm/ (accessed on 31 July 2022).
- U.S. Census Bureau. 2010 Census Urban Area Reference Maps. Available online: https://www.census.gov/geographies/reference-maps/2010/geo/2010-census-urban-areas.html (accessed on 19 July 2022).
- FHWA. Crash Modification Factors Clearinghouse. Available online: http://www.cmfclearinghouse.org (accessed on 19 July 2022).
| Publisher’s Note: MDPI stays neutral with regard to jurisdictional claims in published maps and institutional affiliations. |
© 2022 by the authors. Licensee MDPI, Basel, Switzerland. This article is an open access article distributed under the terms and conditions of the Creative Commons Attribution (CC BY) license (https://creativecommons.org/licenses/by/4.0/).


