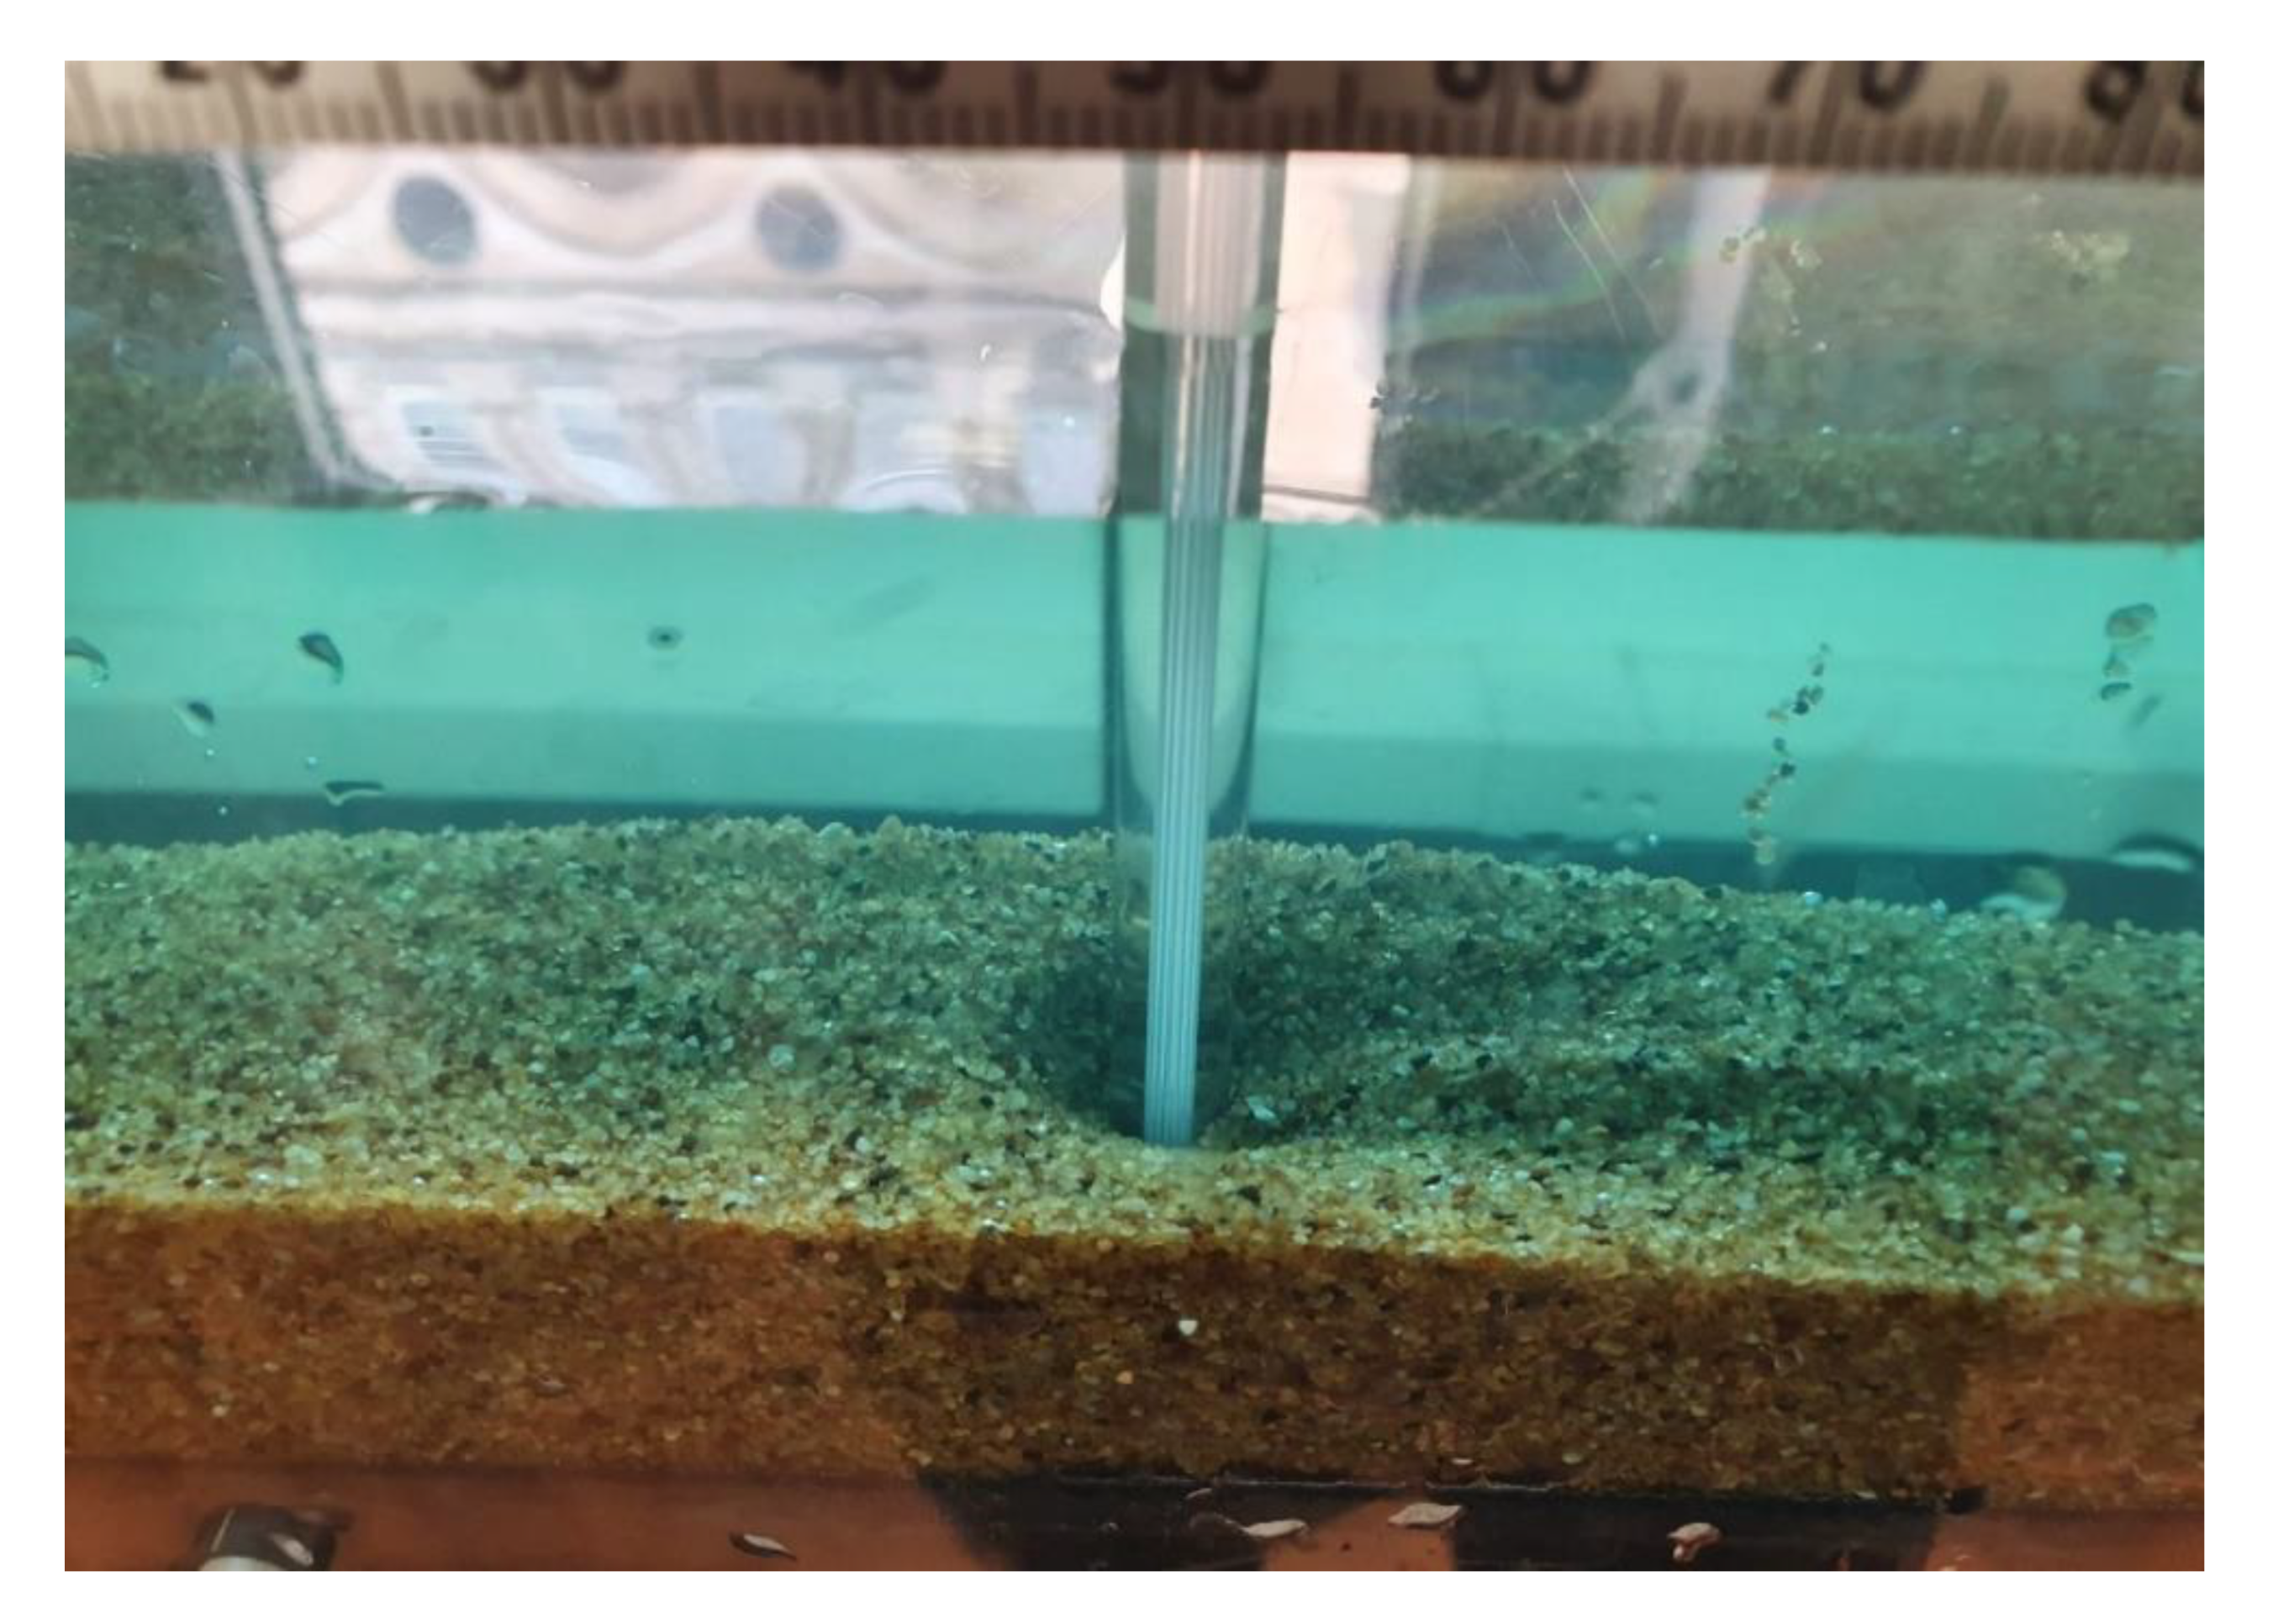
3.4. Effect of Gabion Fill—50 mm Sediment Depth
The cumulative scour at various time intervals were recorded for each model of each fill type. This is represented in graphical form for when sediment depth varied from 40 mm and 50 mm. At certain time intervals, the height of the vertical sluice gate downstream of the bridge pier was lowered in order to increase the flow depth and simulate river flooding, as shown in
Table 2.
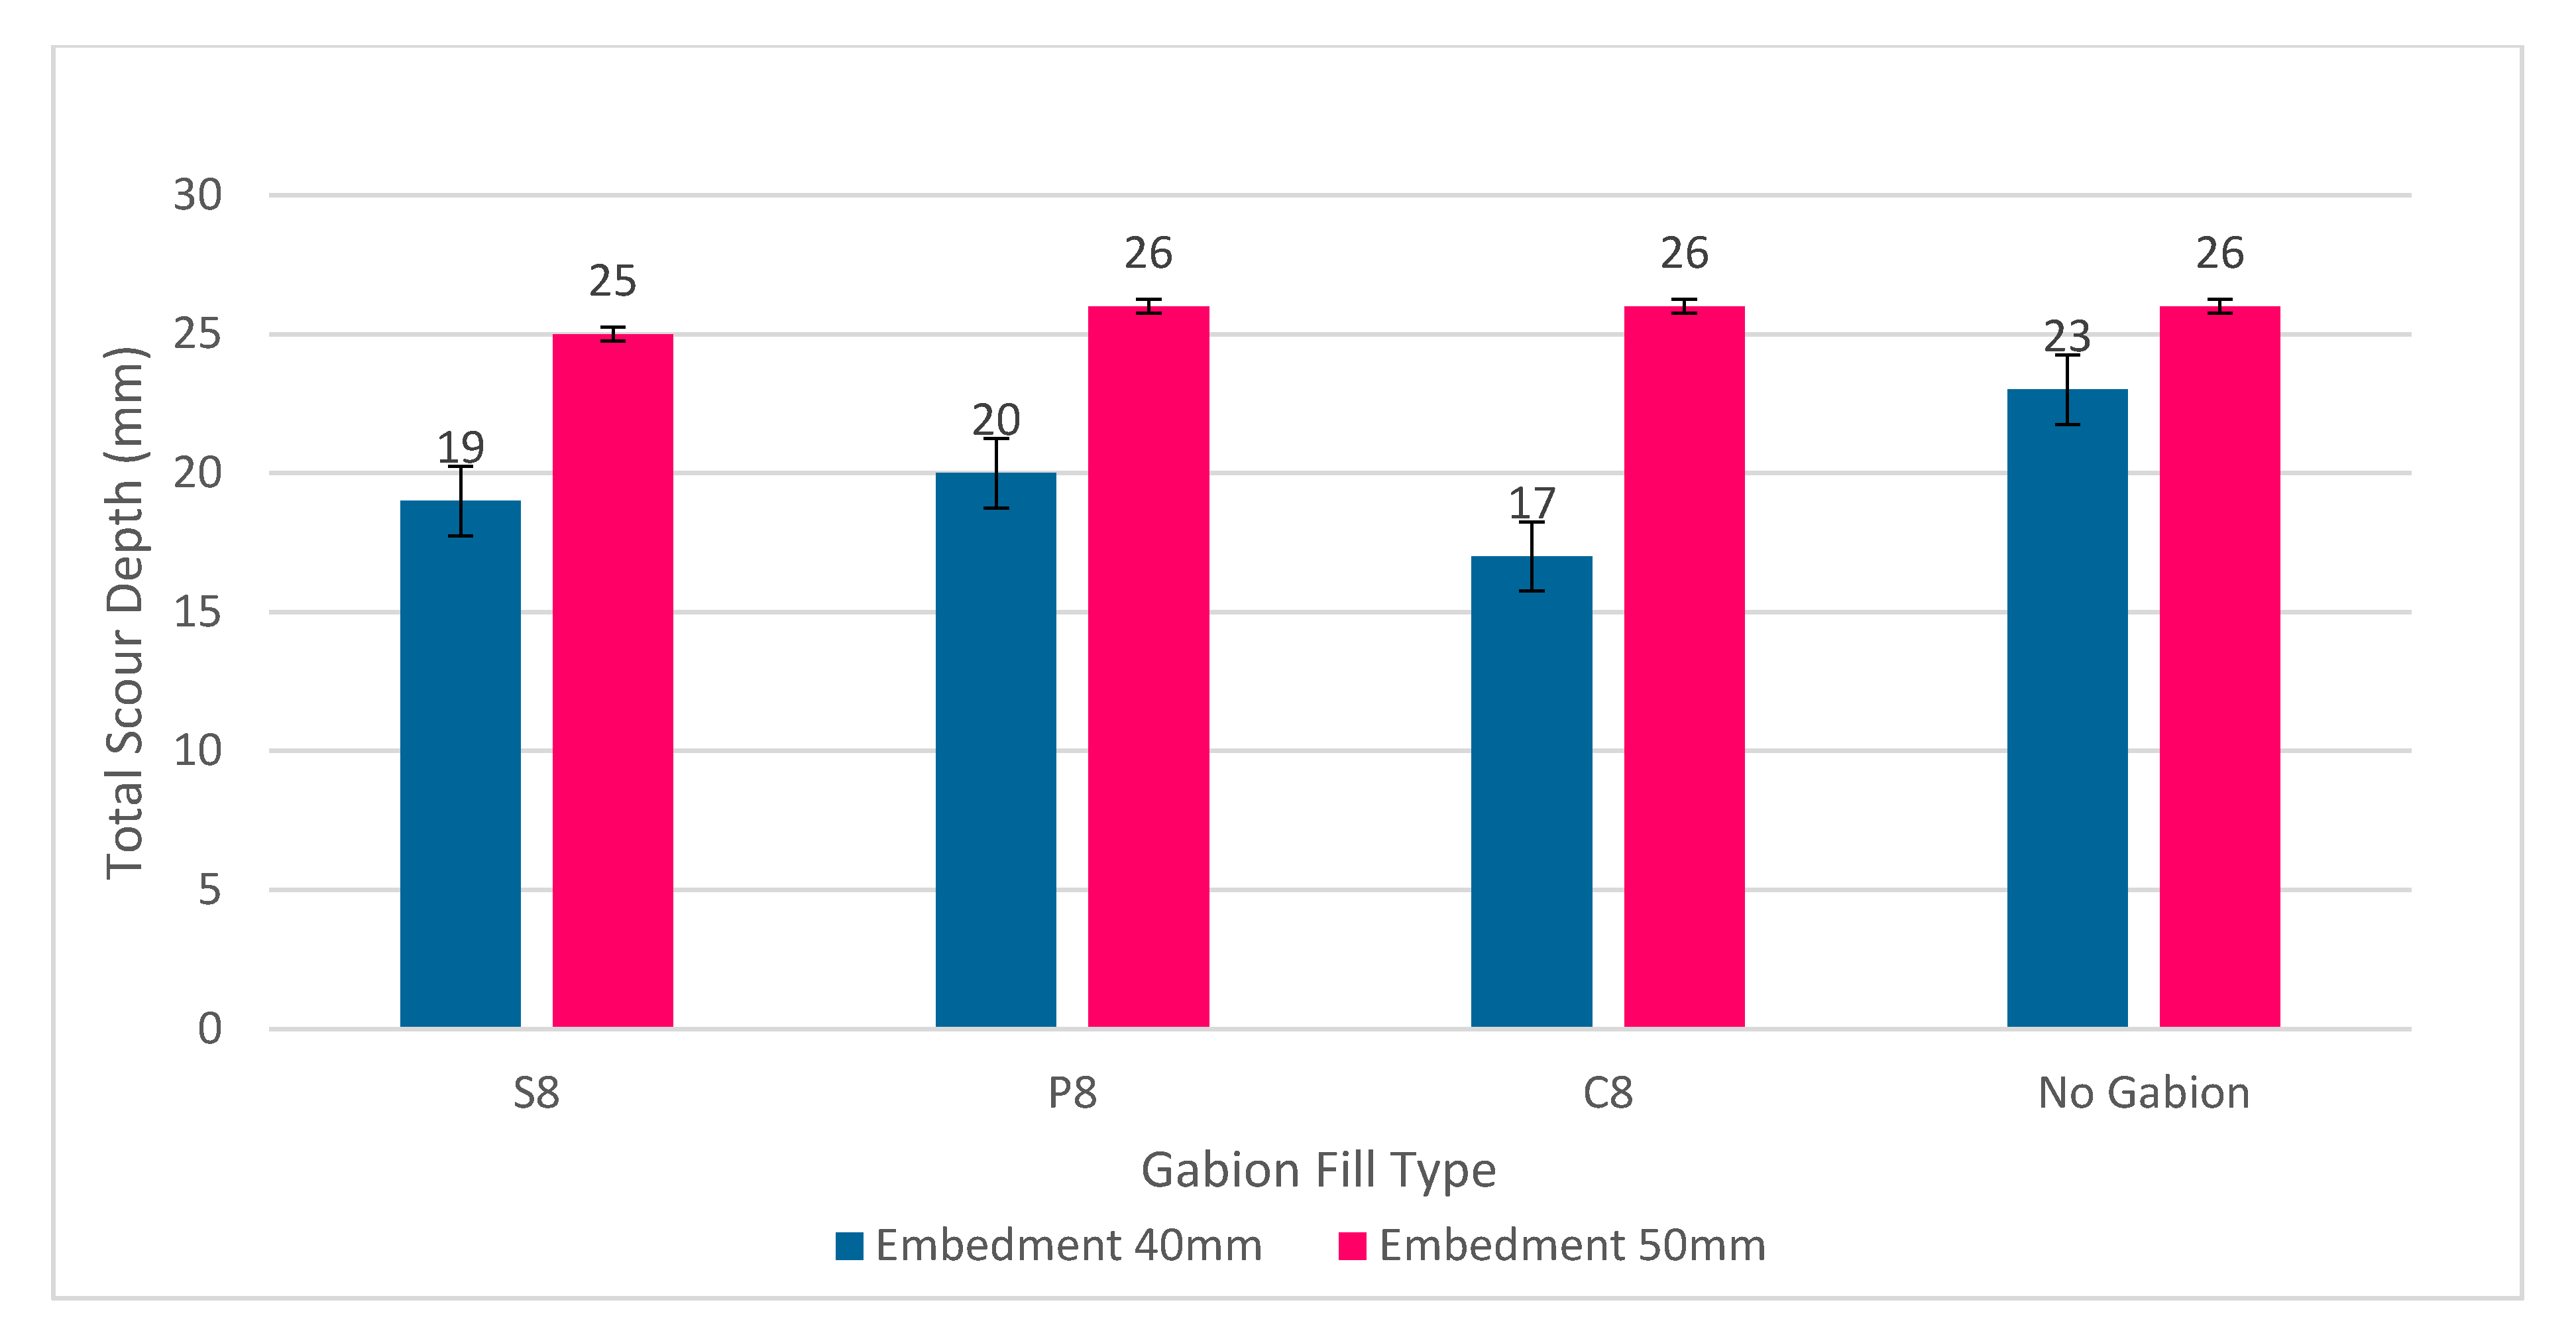
The results from all thicknesses of gabion, as shown in
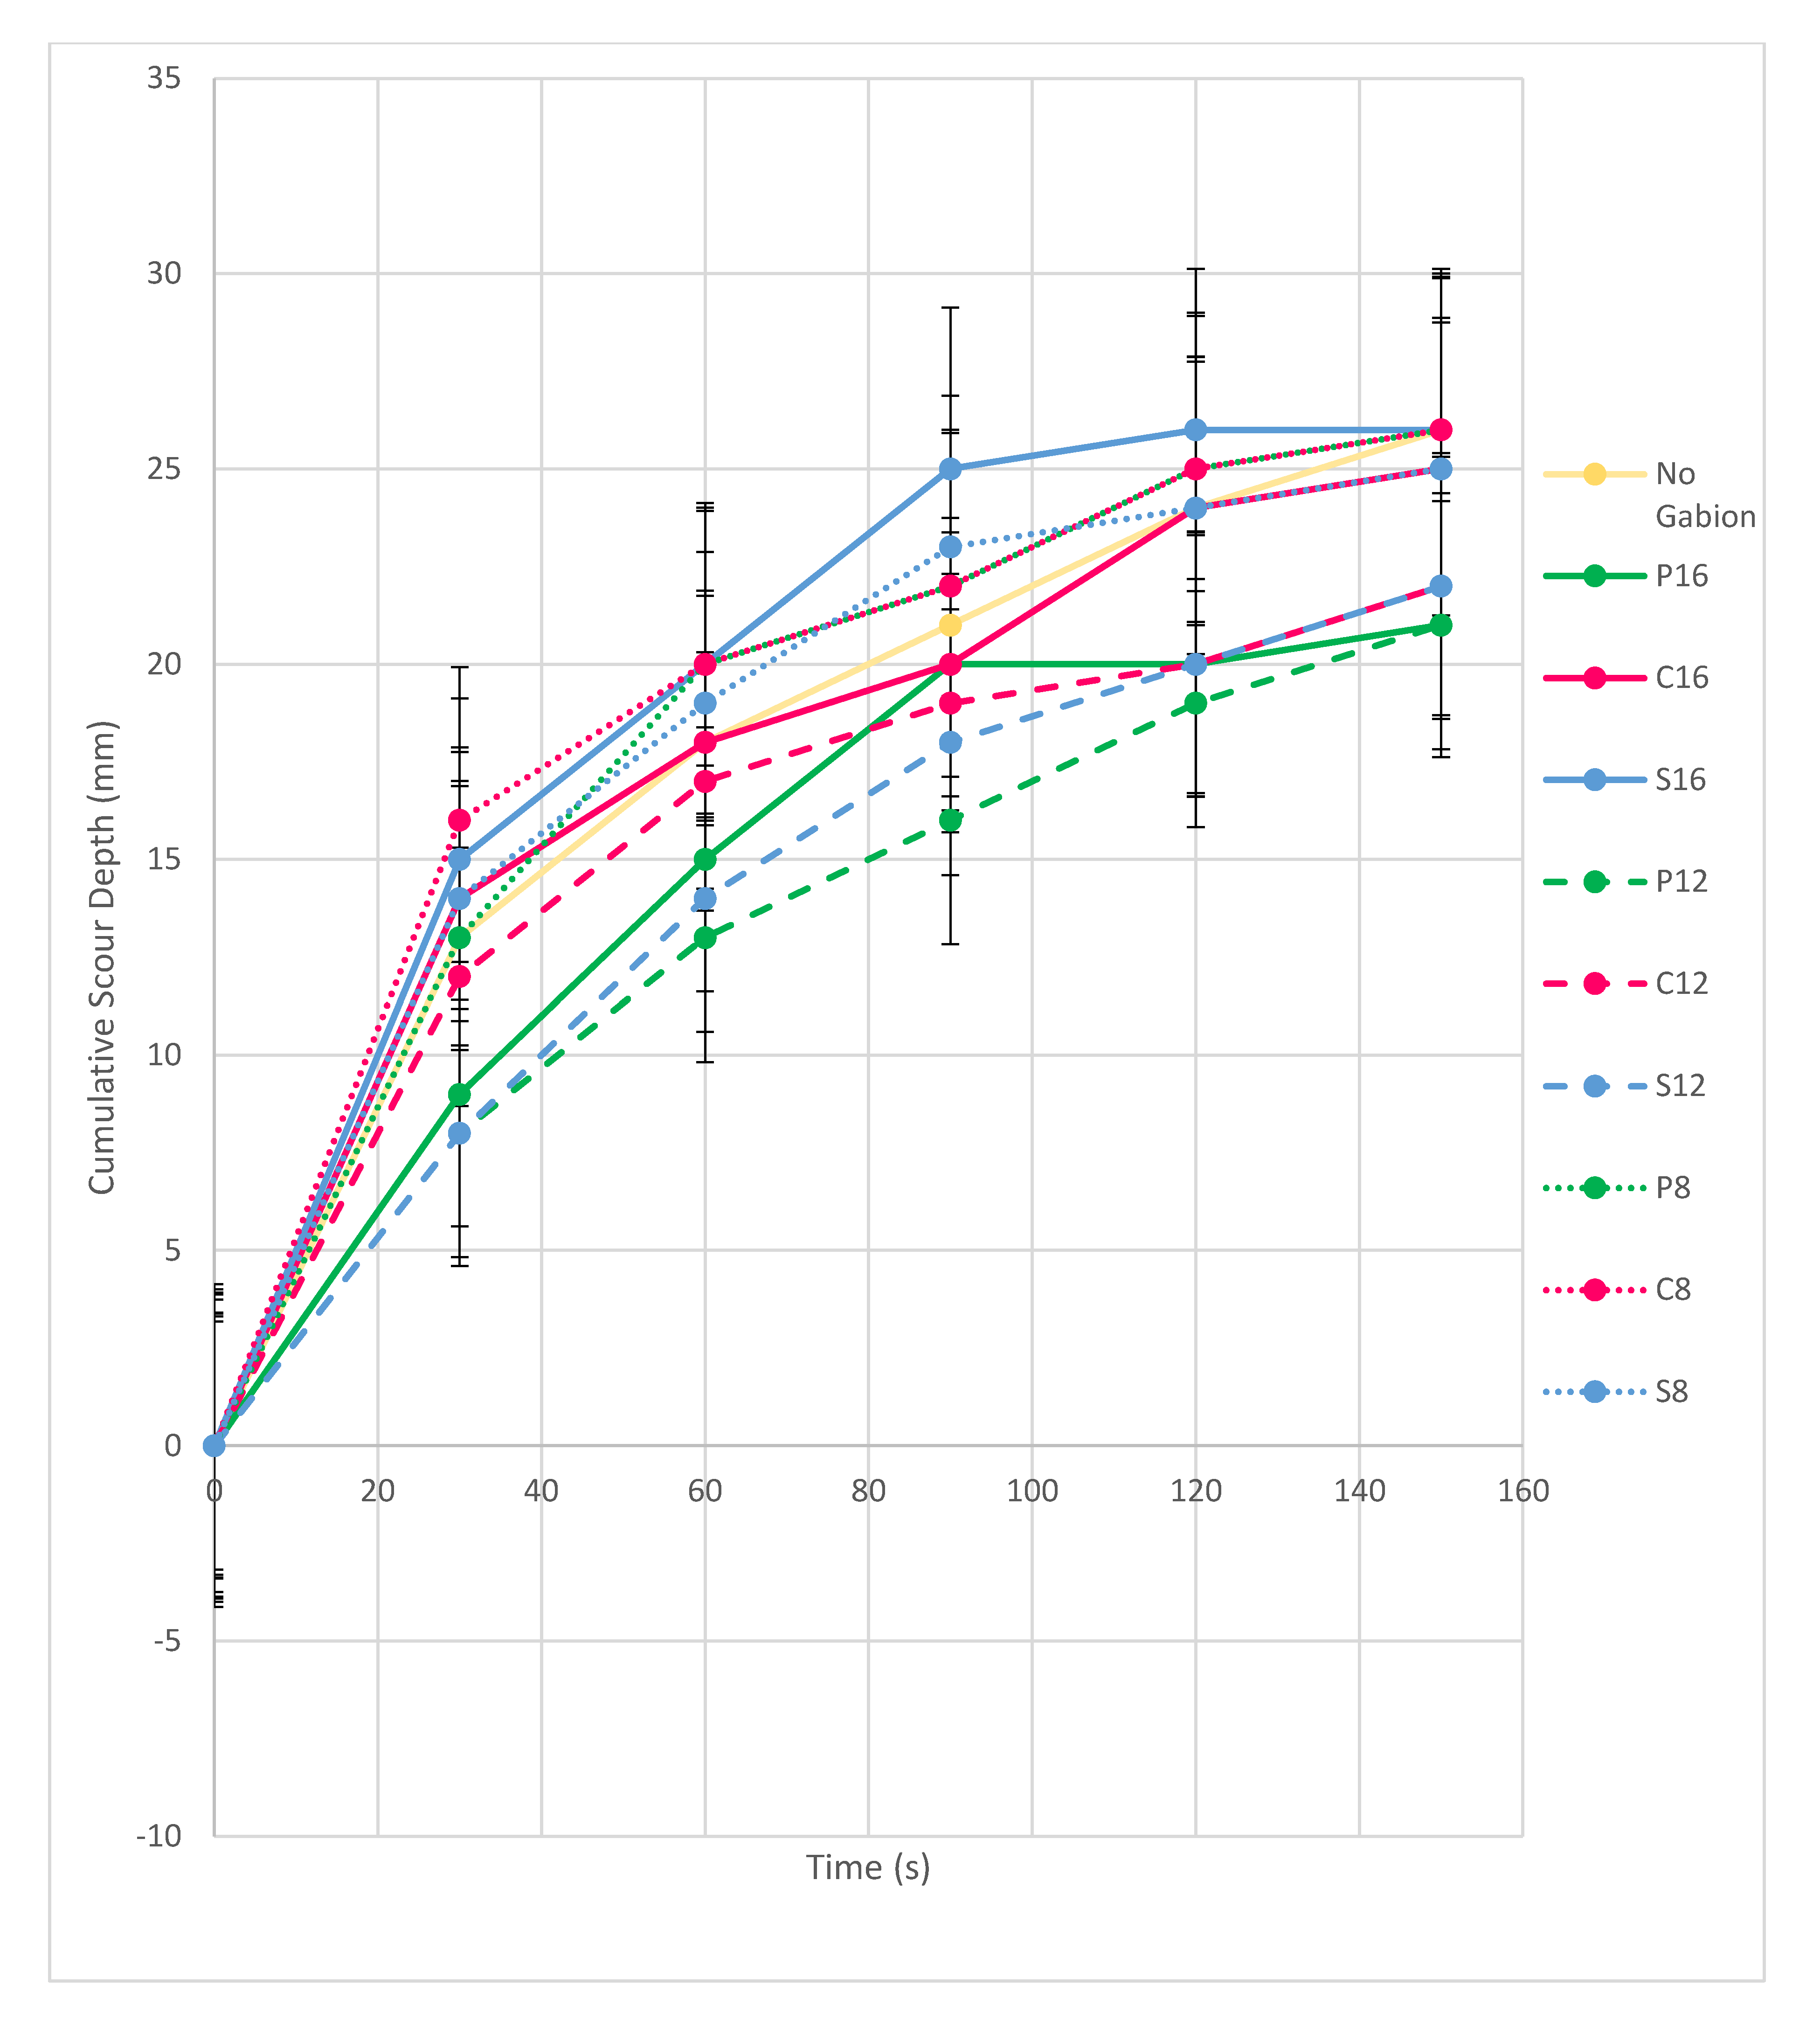
Figure 13, generally show that the fill of the gabion models is largely irrelevant in the reduction of scour when the sediment depth of the sand sediment was 50 mm. This is evident when the thickness of the gabion models was 8 mm (C8, S8, P8), which resulted in the three different materials all following the same trendline as when the experiment was performed with no scour countermeasure surrounding the bridge pier.
When the gabion models were at a thickness of 16 mm, the trendline of the graph (C12, S12, P12) again closely resembles that of the no gabion experiment, except for P16, which appears to be an anomalous result, considering the drastic reduction of the scour depth (4 mm less than C16), when compared to P16 and S16. Furthermore, if plastic was the most effective material in the gabions at reducing scour, then this result would be expected to be replicated at gabion thicknesses 8 mm and 12 mm. Whilst P12 does produce the lowest total scour depth in the materials tested, it is only by 1 mm, which is a fine margin and therefore inconclusive. The results of C12, P12 and S12 follow the same trendline as when the no gabion model test was conducted, however, there was a much more significant reduction in the total scour depth when compared to the 8 mm thickness gabion models.
At 8 mm thickness, the gabions were not successful at reducing bridge pier scour, as both P8 and C8 contributed to no reduction in the scour depth, and the effectiveness of the gabion models was not advantageous. In two out of three cases, no scour reduction was observed when compared with the original experiment when conducted with no scour countermeasures enabled. At 12 mm thickness, the gabion models led to a reduced total scour depth. The results were, however, not as effective as when the gabions were at a 40 mm sediment depth, as the percentage reduction in scour was less than 20% for all cases of varied fill types when compared to results higher than 34.8%. Increasing the thickness of the gabion models from 8 to 12 mm led to a reduction in scour; for example, increasing the thickness of the stone gabion model from 8 to 12 mm led to a further 26.1% reduction in the total scour depth. At 16 mm thickness, the total scour depth was similar to the results gathered from when no scour countermeasure was installed, excluding P16, which remained the same total scour depth as P12 (a decrease of 15.4%) and C16 which decreased by 3.8%.
The increase in thickness of the gabion models were also not as effective at reducing bridge pier scour; this can be seen in the similarities between S16 and S8, and C16 and C12. Both gabion models increased in thickness, which would indicate a better capacity to prevent scour; however, in the case of S16, the total scour increased by 1 mm to 26 mm, and C16 obtained the same total scour depth of 25 mm. The exception to this, once the anomaly P16 is excluded, is the 12 mm thick gabion models, all of which performed better than their respective material types in the 8 mm and 16 mm thick gabion models.
Time also impacts the cumulative scour depth, as in all but four cases (P16, S12, P12 and no gabion), and the majority of scour accumulated in the first 30 s of the experiment. In each model tested, there was no additional deposition of sand sediment into the developing scour hole, as can be seen from
Figure 13; all models led to an increase, or maintenance of scour depth. Overall, the type of gabion fill used at a sediment depth of 50 mm sand sediment was largely irrelevant in the reduction of the total scour depth surrounding bridge piers. All types of fill and thicknesses performed relatively poorly in the reduction of total scour depth, with the highest reduction of scour 19.2%, being obtained when using plastic material at thicknesses 12 and 16 mm. Although plastic material does appear the most effective material at reducing scour, the result of P16 must be disregarded, as its results differ drastically from that of C16 and S16 and the results are inconclusive.
3.5. Effect of Gabion Fill—40 mm Sediment Depth
The placement depth of the gabions was decreased by 10 mm and set to 40 mm sediment depth.
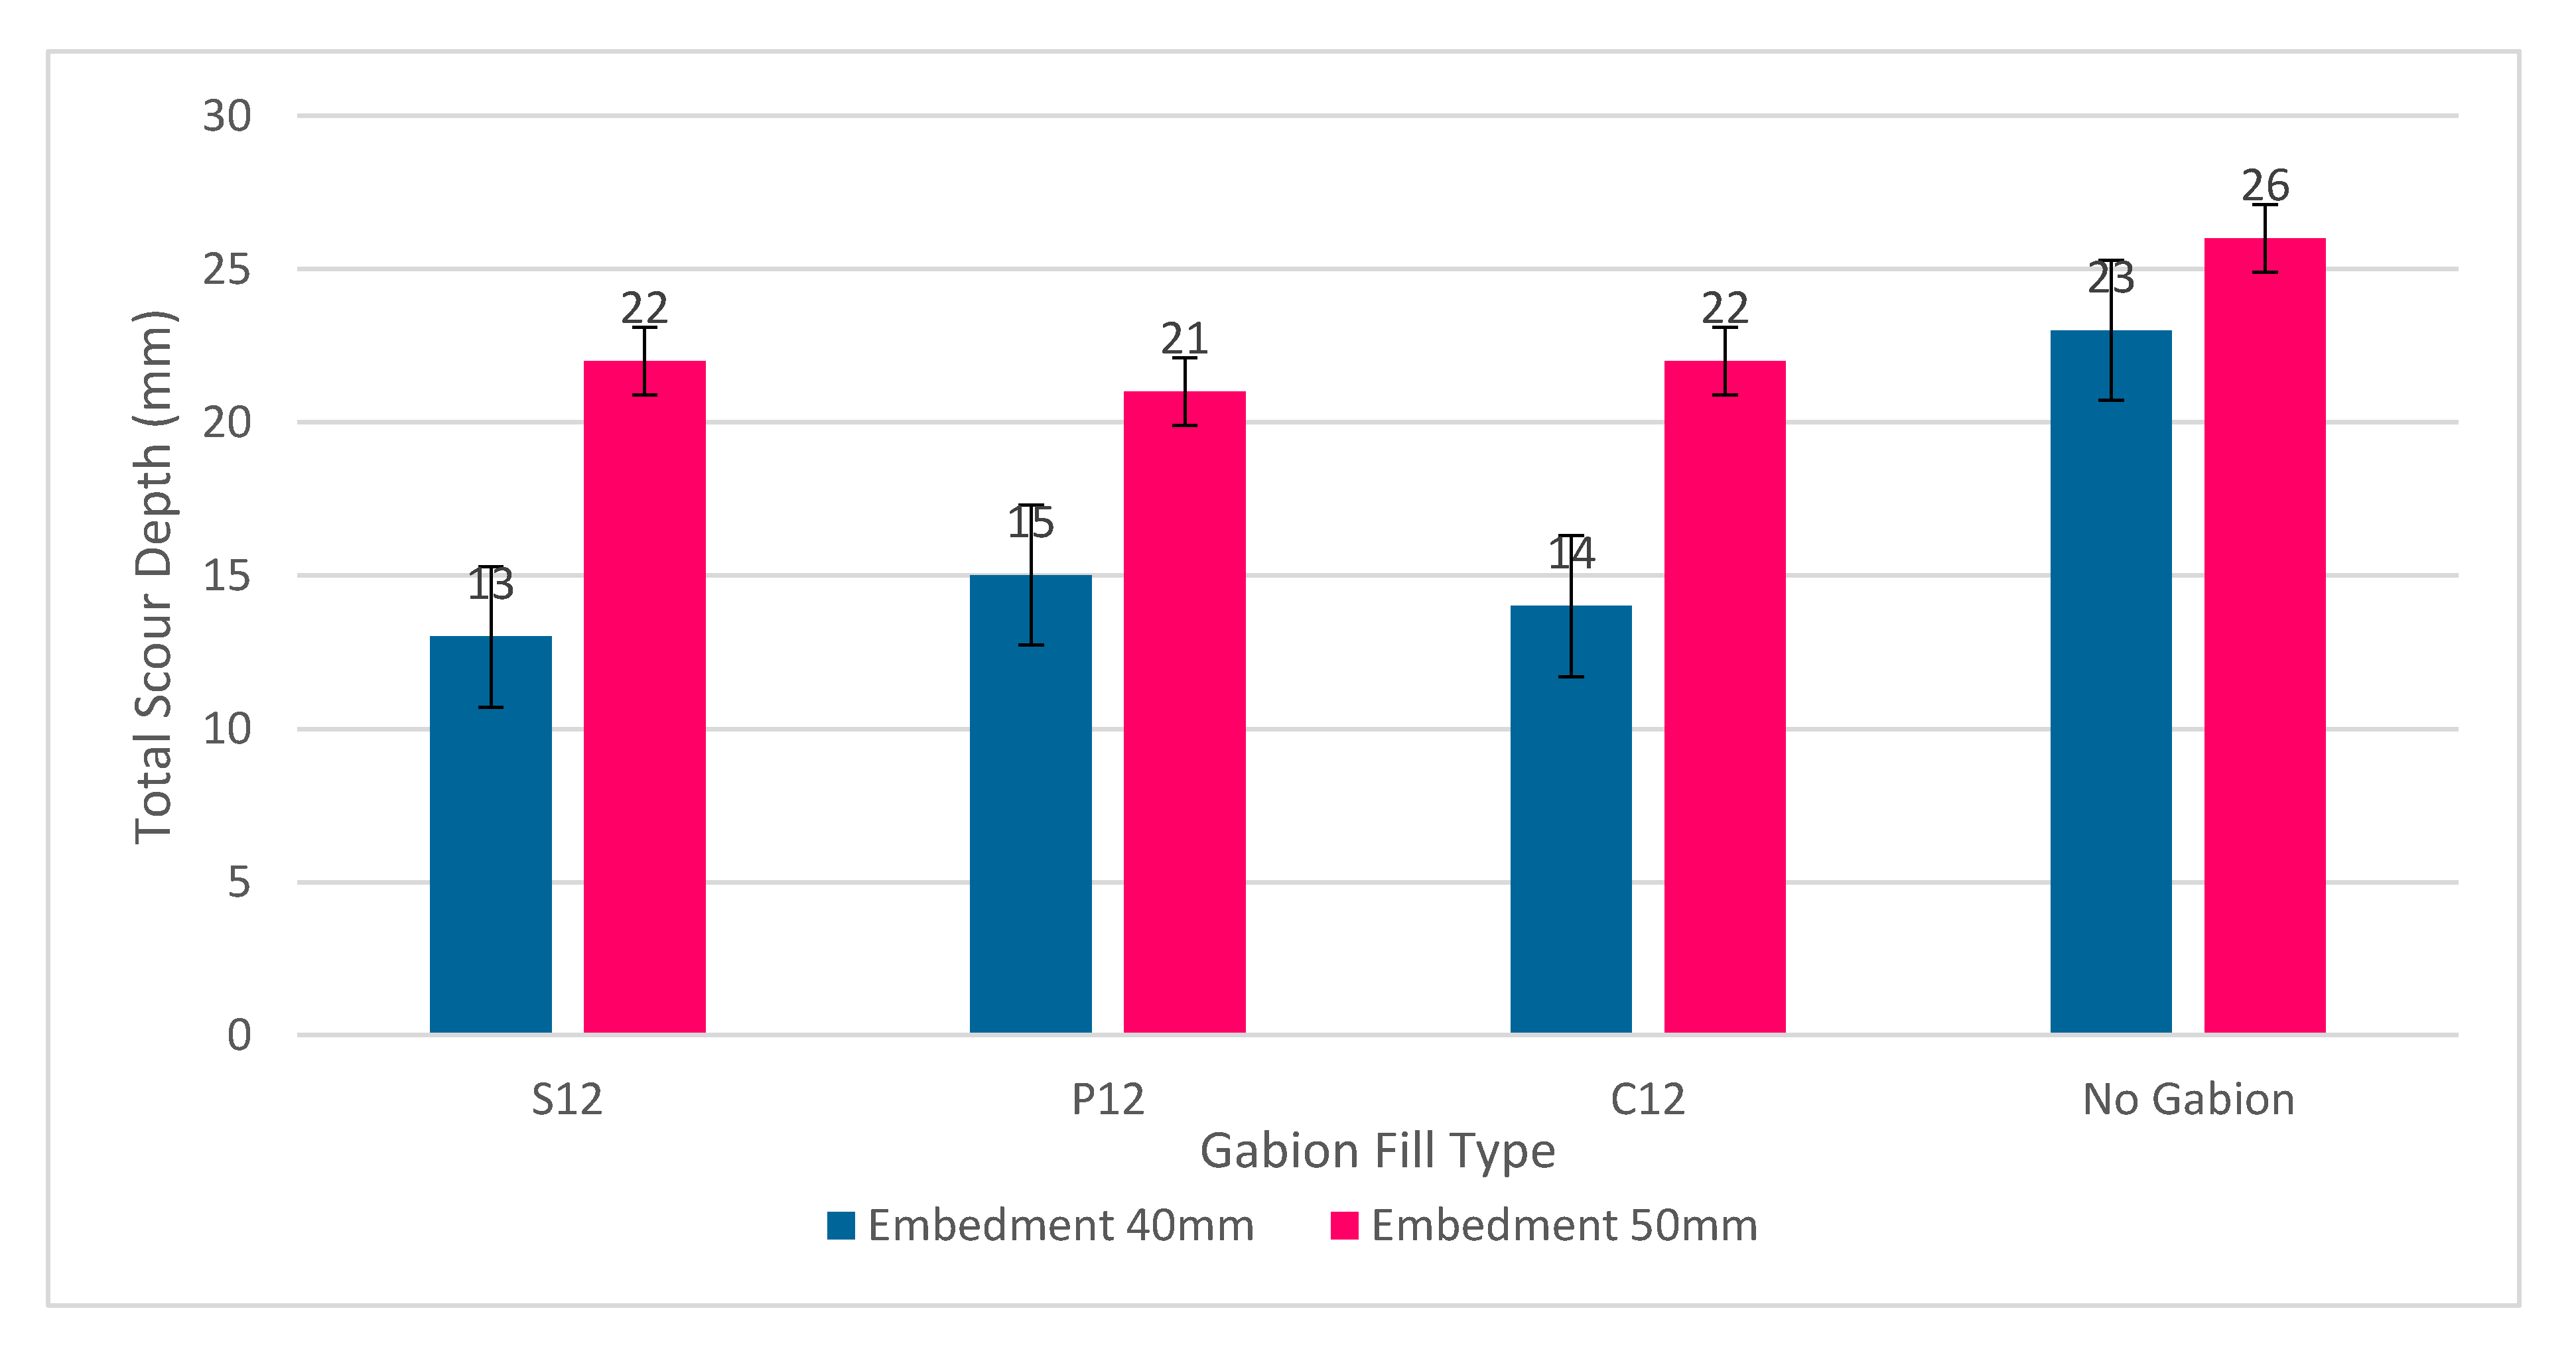
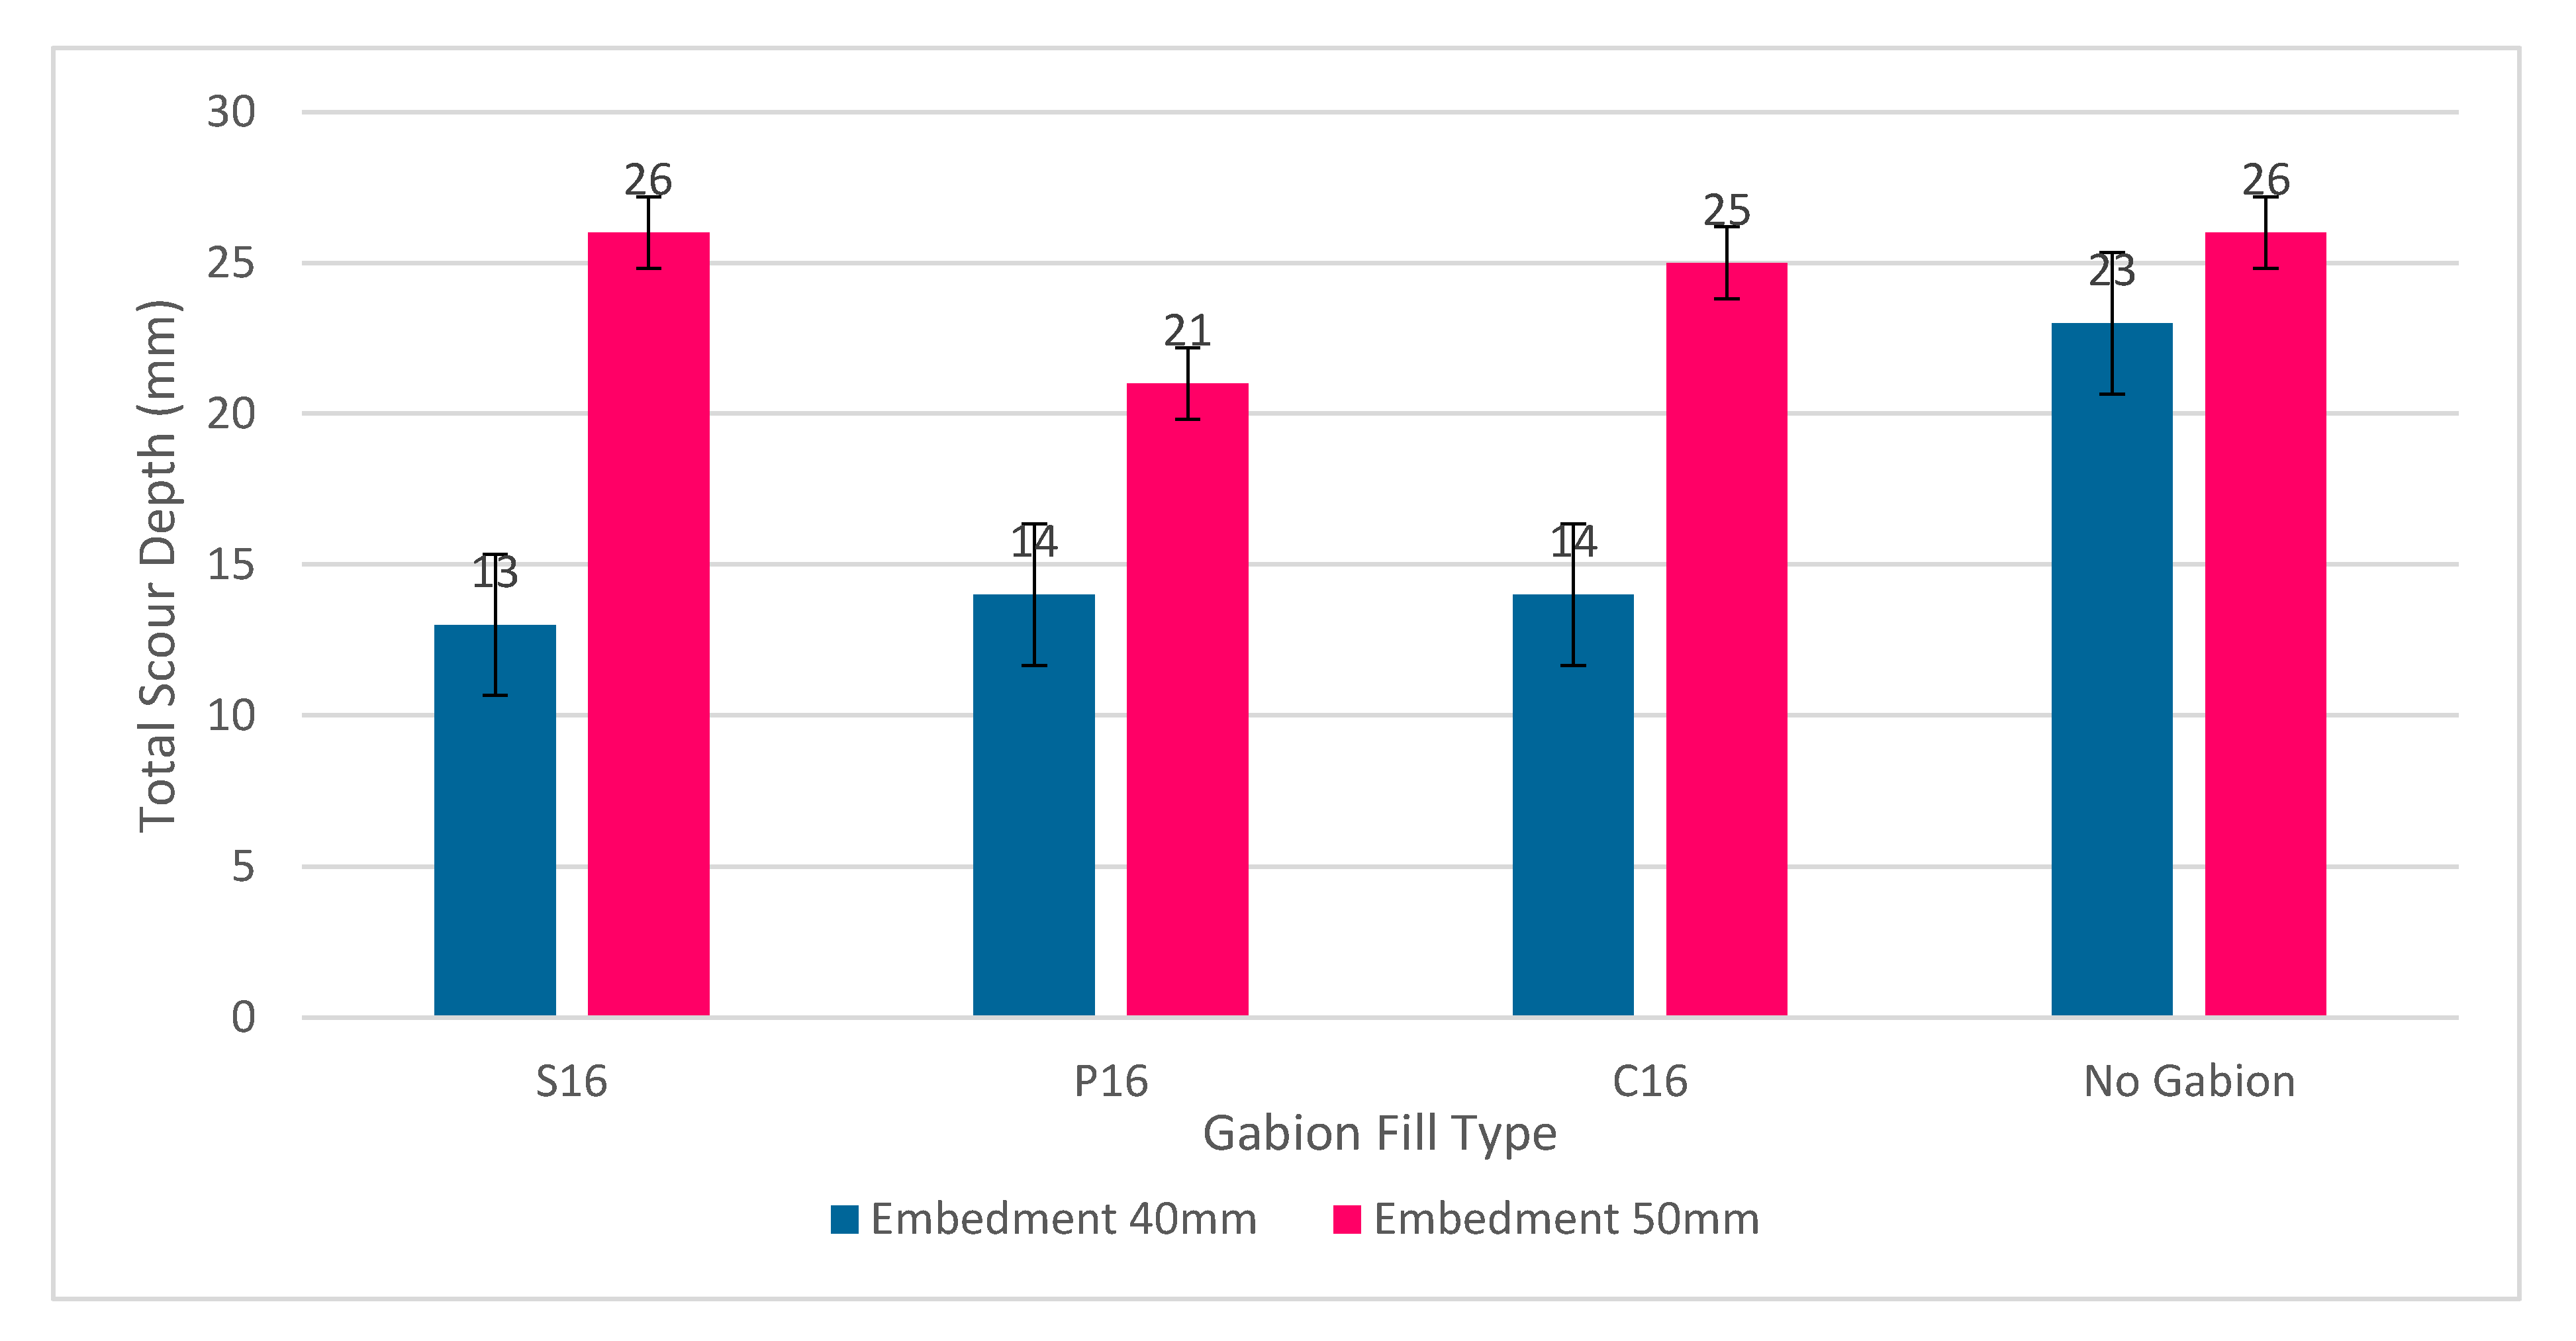
Figure 14 summarises all results at a 40 mm sediment depth.
The results of all gabion thicknesses and their various fills, as shown in
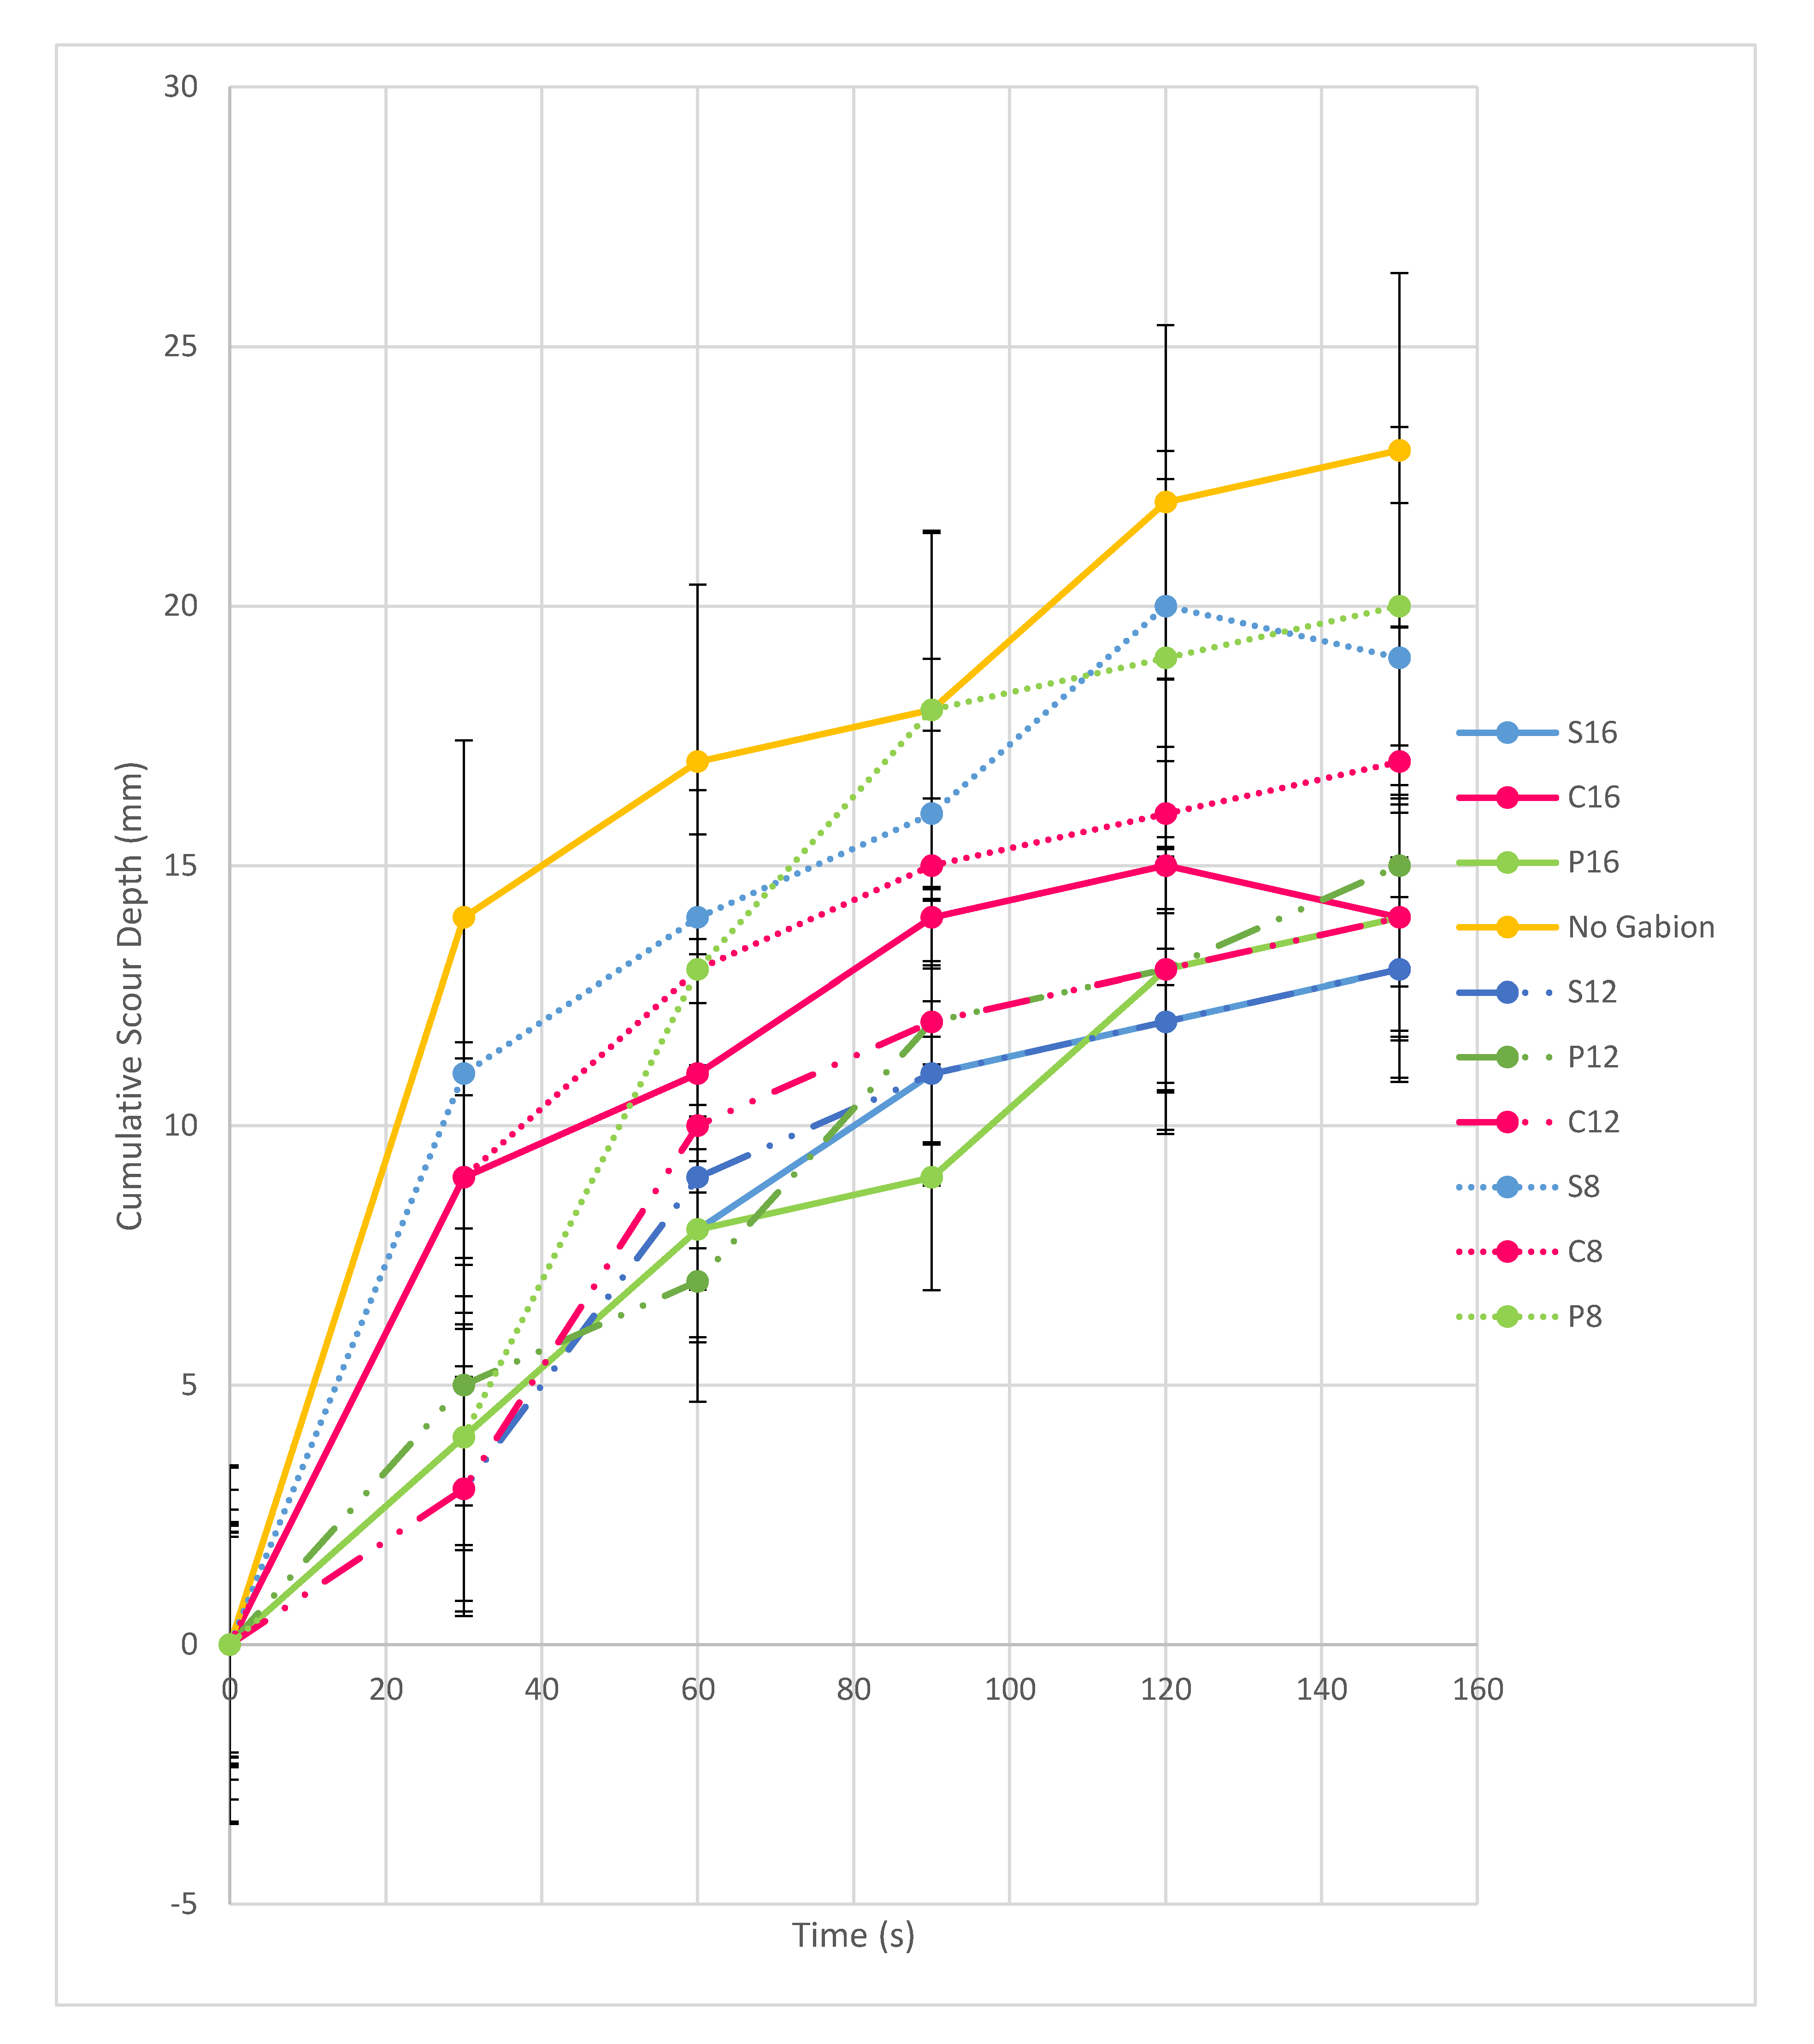
Figure 14, show that at a sediment depth of 40 mm, the effect of gabion fills and their thicknesses are much more effective than when the same models were installed beneath a level of 50 mm. The most effective fill type of the gabions in reducing local scour was the stone and plastic filled gabions, both of which have an average scour depth of 15 mm, which meant an average reduction of 28.57% when comparing to the original experiment undertaken with no scour countermeasure present. The results conclude that the plastic gabions were the least effective material at reducing pier scour, with an average of 16.3 mm, or a total scour reduction of 22.38%. However, the percentage reduction between the three different types of fill is relatively small, as stone and clothing are 6.2% more effective than the plastic filled gabions at reducing scour. At 12 and 16 mm thicknesses, the gabion models which were most effective were the stone aggregate filled gabions, although the results are very similar to both plastic and clothing at these thicknesses. At 8 mm thickness (C8, S8, P8), the reduction in scour was largest for C8, the gabion filled with clothing, as it had a 26.1% reduction in scour hole depth from the original experiment conducted, followed by the stone filled gabion, S8, which reduced bridge pier scour by 17.4%.
The plastic gabion, P8, reduced the scour depth surrounding the bridge pier, but was not as successful as S8 and C8. At 12 mm thickness (C12, S12, P12), the use of a gabion model as a scour countermeasure was effective, as the percentage reduction of scour was higher than 34.8% for each fill type used within the gabions. The stone filled gabion, S12, was most effective at reducing scour depth when it had a greater thickness of gabion, although there is not much deviation from the results, with P12 and C12 results only having a larger scour depth by 2 and 1 mm, respectively. At 16 mm thickness (C16, S16, P16), the total scour depth results are almost identical to the 12 mm thickness gabions, except for P16, which reduced by 1 mm. Therefore, the percentage reduction of scour remained the same, apart from P16, which increased by 4.3%. Again, the thickness of the gabion models used also impacted the development of scour. At 8 mm thickness, in the worst-performing value of P8, the scour depth increased by 42.86% when compared to P16. There are, however, close similarities between the results of 12 and 16 mm gabion models. The 12 mm gabions had an average scour depth of 14 mm, whereas the 16 mm gabion models had an average scour depth of 13.67 mm, proving that an increase in the thickness of a gabion affects scour. Time appears to have an impact on the cumulative scour depth. At 60 s, all gabion models had accumulated most of the scour depth (with exception to P12). For gabions S8 and C12, the cumulative scour depth decreased slightly between 120 s and 150 s; this is due to the deposition of sand sediment into the developing scour hole, therefore decreasing the total scour depth formed.
