1. Introduction
Regular physical activity induces beneficial cardiovascular adaptations. It improves myocardial efficiency and reduces morbidity associated with hypertension and cardiovascular disease [
1]. In athletes, long-term training produces characteristic structural and functional cardiac changes collectively referred to as the athlete’s heart [
2]. These changes are physiological and reversible, distinguishing them from the pathological hypertrophy seen in hypertension and cardiomyopathies [
3,
4].
However, the distinction between physiologic and pathologic cardiac remodeling remains a diagnostic challenge, particularly in populations where hypertension and structural heart disease are prevalent [
4,
5]. For instance, physiological and pathological remodeling may coexist, producing hybrid phenotypes that are difficult to classify [
6]. Ethnic variation remains a major area of controversy. Black/African athletes demonstrate a higher prevalence of increased LV wall thickness and repolarization changes, which may mimic cardiomyopathy. While ethnicity-specific interpretation is recommended, defining appropriate reference limits without risking misclassification remains challenging [
7,
8]. Again, despite general agreement on diagnostic overlap, there is no universally accepted cut-off for LV wall thickness that definitively distinguishes physiological from pathological hypertrophy. Wall thickness values between 12–15 mm may be observed in both athlete’s heart and early hypertrophic cardiomyopathy (HCM), limiting the diagnostic utility of fixed thresholds [
6].
Currently, screening athletes for HCM and other conditions uses “ethnic-adjusted” norms, based on the assumption that Black athletes exhibit greater left ventricular wall thickness [
9,
10]. However, the existing data on “Black athletes” comes from elite or collegiate cohorts in Europe and North America [
10,
11], with young amateur Black athletes in Africa remaining severely underrepresented in sports cardiology research [
10].
Furthermore, limited access to advanced imaging modalities, such as echocardiography and cardiac magnetic resonance imaging (MRI), in many African sports medicine facilities restricts accurate characterization of these adaptations. This gap poses both diagnostic and public health concerns, as misinterpretation of physiologic hypertrophy as pathological may lead to unnecessary sports disqualification, while underdiagnosis of true pathology increases the risk of exercise-related cardiac events. Moreover, given that hypertension prevalence is disproportionately higher in African populations [
11], there is a compelling need to understand how these hemodynamic factors affect cardiac structure among young amateur African athletes.
Therefore, this study aimed at using transthoracic echocardiography and electrocardiography (ECG) to assess the structure and function of the heart among university students in Ghana, including amateur athletes. The main objective was to ascertain the impact of physical activity on the structure and function of their hearts and to determine average cardiac dimensions in different physical activity levels.
2. Materials and Methods
2.1. Study Design and Setting
A comparative cross-sectional study was conducted among young adult student athletes and non-athletes at an African university to assess the impact of varying levels of physical activity on cardiac structure and function. The study adhered to the principles of the Declaration of Helsinki and obtained ethical approval from the institutional review board prior to participant recruitment.
Setting and dates: The study was conducted at Kwame Nkrumah University of Science and Technology (KNUST), Kumasi, Ghana. Recruitment and data collection occurred between July 2024 and September 2024.
2.2. Participants
Participants were recruited during a university athletic competition event. Student athletes participating in the competition and student spectators attending the event were approached by the study team and informed about the ongoing study. Those who expressed interest in participating were screened for eligibility and were subsequently given scheduled appointments to attend the University laboratory for further assessment. At the laboratory visit, participants completed the study questionnaire and underwent anthropometric measurements, blood pressure assessment, resting 12-lead electrocardiography, and transthoracic echocardiography. Participants were then categorized into four physical activity groups based on their self-reported daily duration and intensity of physical activity in the preceding six months:
Level 1: Individuals who did not regularly engage in physical activity.
Level 2: Individuals who engaged in less than 30 min of moderate exercise daily.
Level 3: Individuals who engaged in 30 min to 1 h of moderate exercise daily.
Level 4: Individuals who engaged in vigorous exercise for more than 1 h daily.
Levels 3 and 4 included participants with higher habitual activity levels, including student athletes.
All participants were apparently healthy. For the purpose of this study, “apparently healthy” was operationally defined using a pre-enrolment screening assessment that included self-reported medical history, a basic physical examination, and resting blood pressure. Participants were eligible if they had no known physician-diagnosed cardiovascular or metabolic disease; no history of smoking, congenital or structural heart disease, cardiomyopathy, arrhythmia, diabetes mellitus, or chronic hypertension; no current cardiorespiratory symptoms; and no long-term medication use likely to affect cardiac structure or function. Blood pressure and ECG findings obtained during the study were recorded and classified for analysis; clinically relevant incidental abnormalities were reviewed by a cardiologist and considered in eligibility and interpretation of findings.
2.3. Variables
Exposure included self-reported daily physical activity duration, categorized into four levels. Outcomes included echocardiographic measures of cardiac structure and function and electrocardiographic parameters. Potential confounders considered included age, sex, body size (e.g., BMI/BSA), and blood pressure.
2.4. Bias
To minimize measurement bias, standardized protocols were used for anthropometry and blood pressure. ECG interpretation was independently reviewed by a cardiologist, and echocardiography was performed by a certified cardiac sonographer following ASE/EACVI guidance [
12].
2.5. Study Size
The study size was estimated using the G*Power software version 3.1.9.7. Using F tests as the test family, test variables included effect size (f), alpha value, desired statistical power, and number of groups. The effect size used was 0.25, the alpha value was 0.05, the statistical power was 0.80, and the number of groups was 4, representing the levels of physical activity. The estimated sample size obtained was 180. Hence, a minimum of 180 participants were required. However, due to the dropout rate, a total of 174 participants (aged 18–30 years) were enrolled using stratified random sampling.
2.6. Quantitative Variables
Continuous variables were summarized as means ± standard deviation (SD) and categorical variables as counts and percentages. Physical activity was analyzed as an ordinal exposure using the predefined four activity levels.
2.7. Data Sources and Measurements
Anthropometric and Hemodynamic Measurements
Participants’ height and weight were measured using a calibrated stadiometer and digital weighing scale, respectively, with participants barefoot and in light clothing. Body mass index (BMI) was calculated as weight (kg) divided by height (m
2). BMI categorization was as follows: underweight (<18.5 kg/m
2), normal (18.5–24.99 kg/m
2), overweight (25–29.99 kg/m
2) and obese (>30 kg/m
2). Body surface area (BSA) was estimated using the DuBois formula. Blood pressure was measured using a validated automated sphygmomanometer (Omron
® HEM series, Omron Healthcare Co. Ltd., Kyoto, Japan), following a 5 min rest period, and classified according to the American Heart Association (AHA) guidelines [
13]. Systolic BP categorization was as follows: normal (<140 mmHg), stage 1 (140–159 mmHg) and stage 2 (160–179 mmHg). Diastolic BP was categorized as normal (<90 mmHg), stage 1 (90–99 mmHg) and stage 2 (100–109 mmHg). Heart rate (HR) was measured from the sphygmomanometer.
2.8. Electrocardiography Assessment
Resting electrocardiography (ECG) was performed on all study participants using a standard 12-lead ECG machine following established international guidelines [
14]. Participants included athletes and non-athletes and were assessed under similar conditions. Prior to ECG acquisition, participants were instructed to abstain from vigorous physical activity, caffeine, and stimulant use for at least 24 h. Recordings were obtained with participants in the supine position after a minimum of 5 min of rest in a quiet environment.
Standard electrode placement was used, and ECGs were recorded at a paper speed of 25 mm/s and a calibration of 10 mm/mV. The ECG tracings were analyzed for heart rate, rhythm, frontal QRS axis, PR interval, QRS duration, and ST-T wave morphology. Cardiac chamber enlargement and hypertrophy were assessed using established voltage criteria, including Sokolow–Lyon, Cornell, and R wave amplitude in aVL for left ventricular hypertrophy, as well as criteria for atrial enlargement and right ventricular hypertrophy.
All ECGs were independently reviewed by a cardiologist to identify conduction abnormalities, arrhythmias, repolarization patterns, and other electrocardiographic variants. Findings such as sinus bradycardia, early repolarization, and first-degree atrioventricular block were interpreted with consideration of physiological adaptations to physical activity. ECG parameters were categorized and analyzed according to participants’ level of physical activity to compare athletes and non-athletes.
2.9. Echocardiographic Assessment
Comprehensive transthoracic echocardiography (TTE) was performed using a 2.5–3.5 MHz phased array transducer on a Siemens Acuson 700 ultrasound system (Siemens Medical Solutions, Malvern, PA 19355, USA). Echocardiographic imaging and measurements were initially obtained by a certified cardiac sonographer and independently verified by a cardiologist before final measurements were recorded. This process was intended to minimize measurement error and improve the accuracy of the recorded values. Measurements and analyses adhered to the American Society of Echocardiography (ASE) and European Association of Cardiovascular Imaging (EACVI) guidelines [
12].
2.10. Left Ventricular Structure
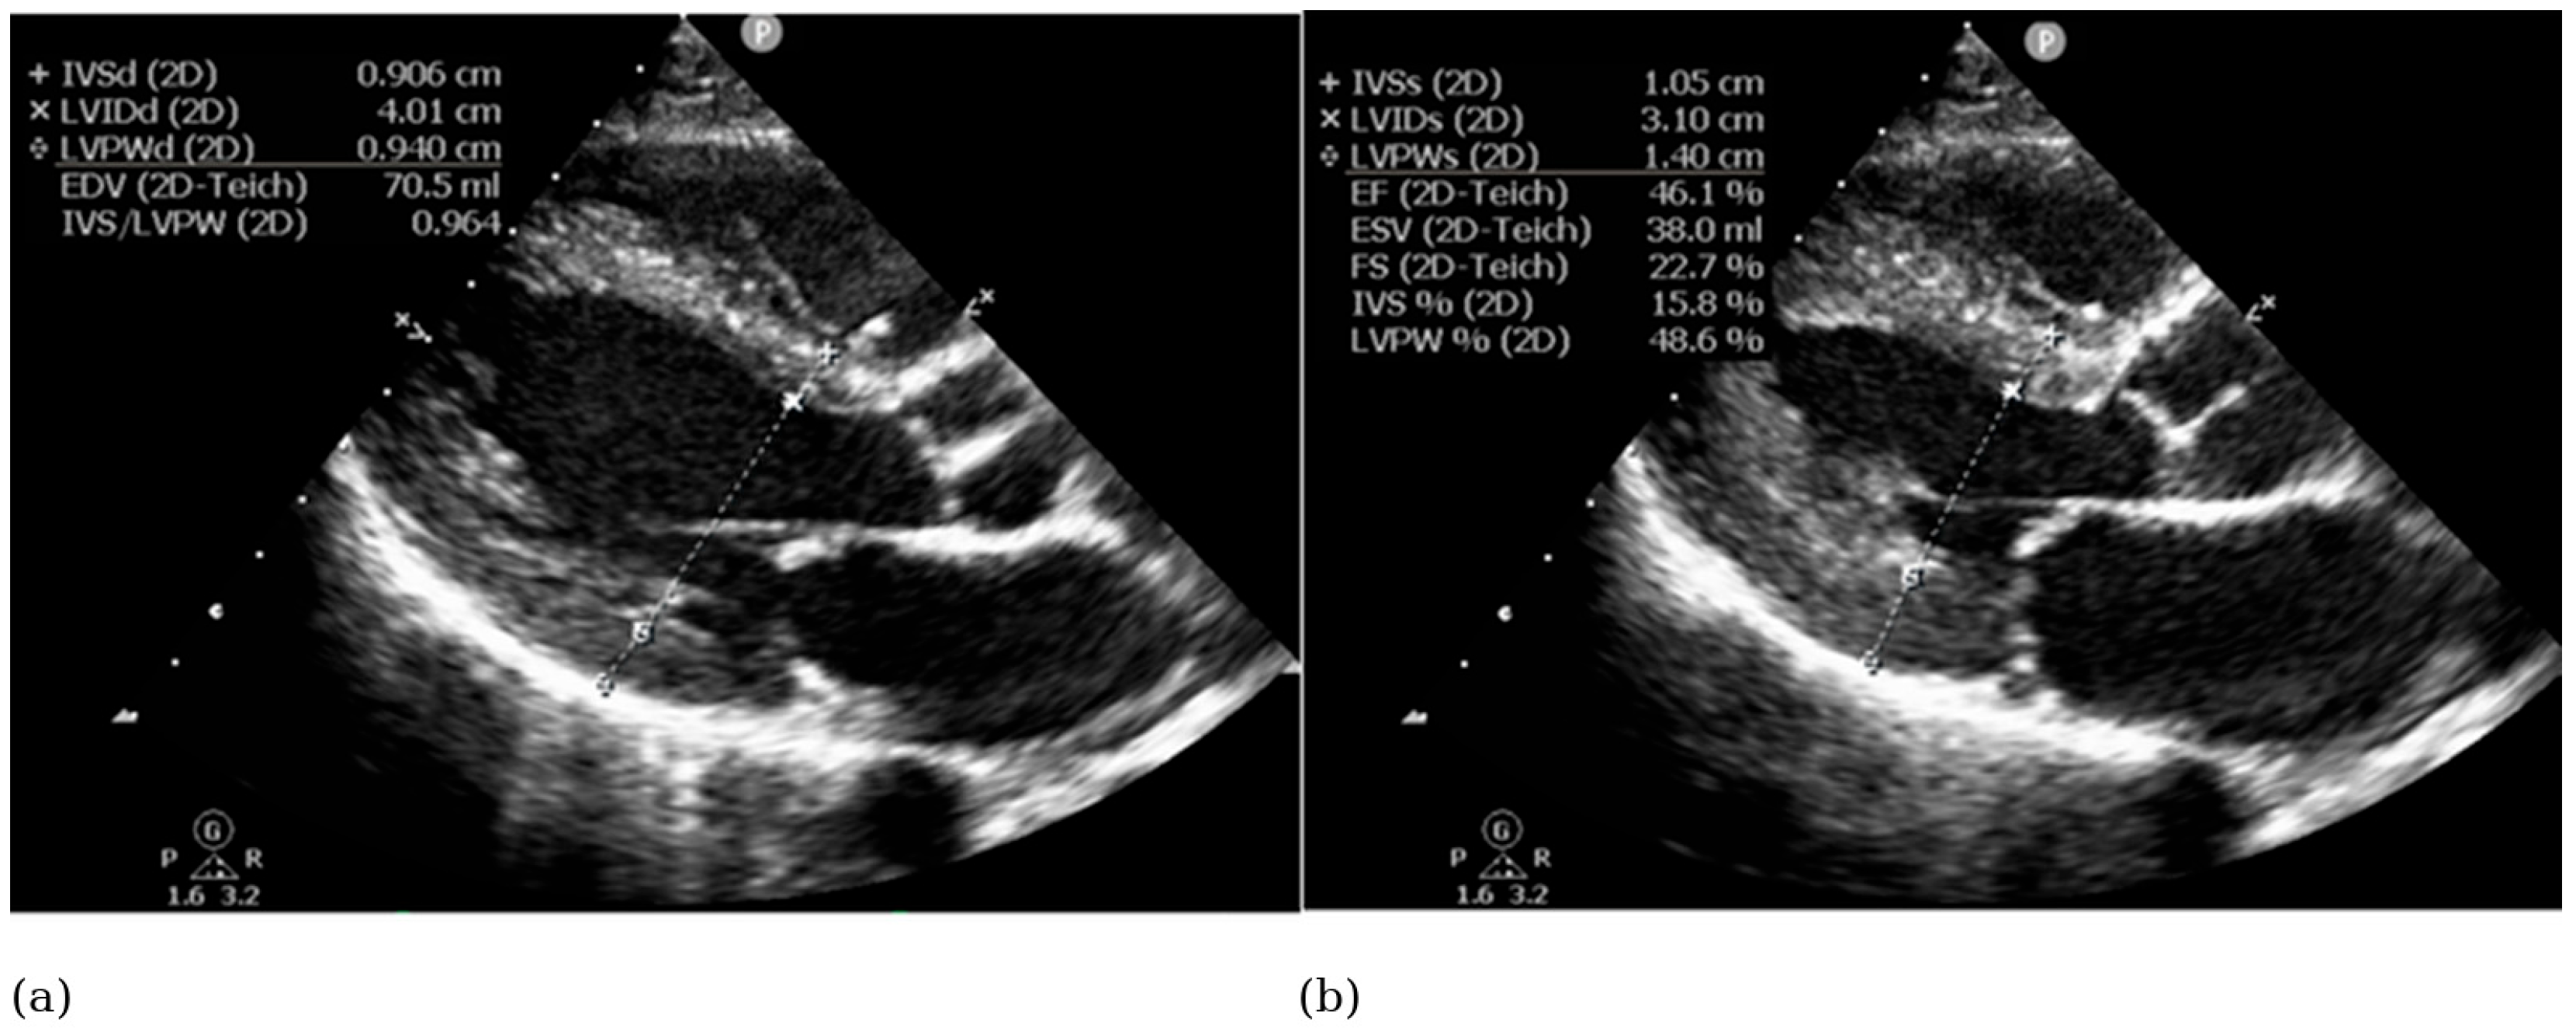
The following two-dimensional parameters were measured from the parasternal long-axis view:
Interventricular septal thickness in diastole and systole (IVSd and IVSs).
Left ventricular internal diameter in diastole and systole (LVIDd and LVIDs).
Left ventricular posterior wall thickness in diastole and systole (LVPWd and LVPWs).
Left ventricular mass (LVM) was calculated using the ASE-corrected cube formula, and relative wall thickness (RWT) was derived as follows: [(PWTd + IVSd)/LVIDd].
2.11. Left Ventricular Function
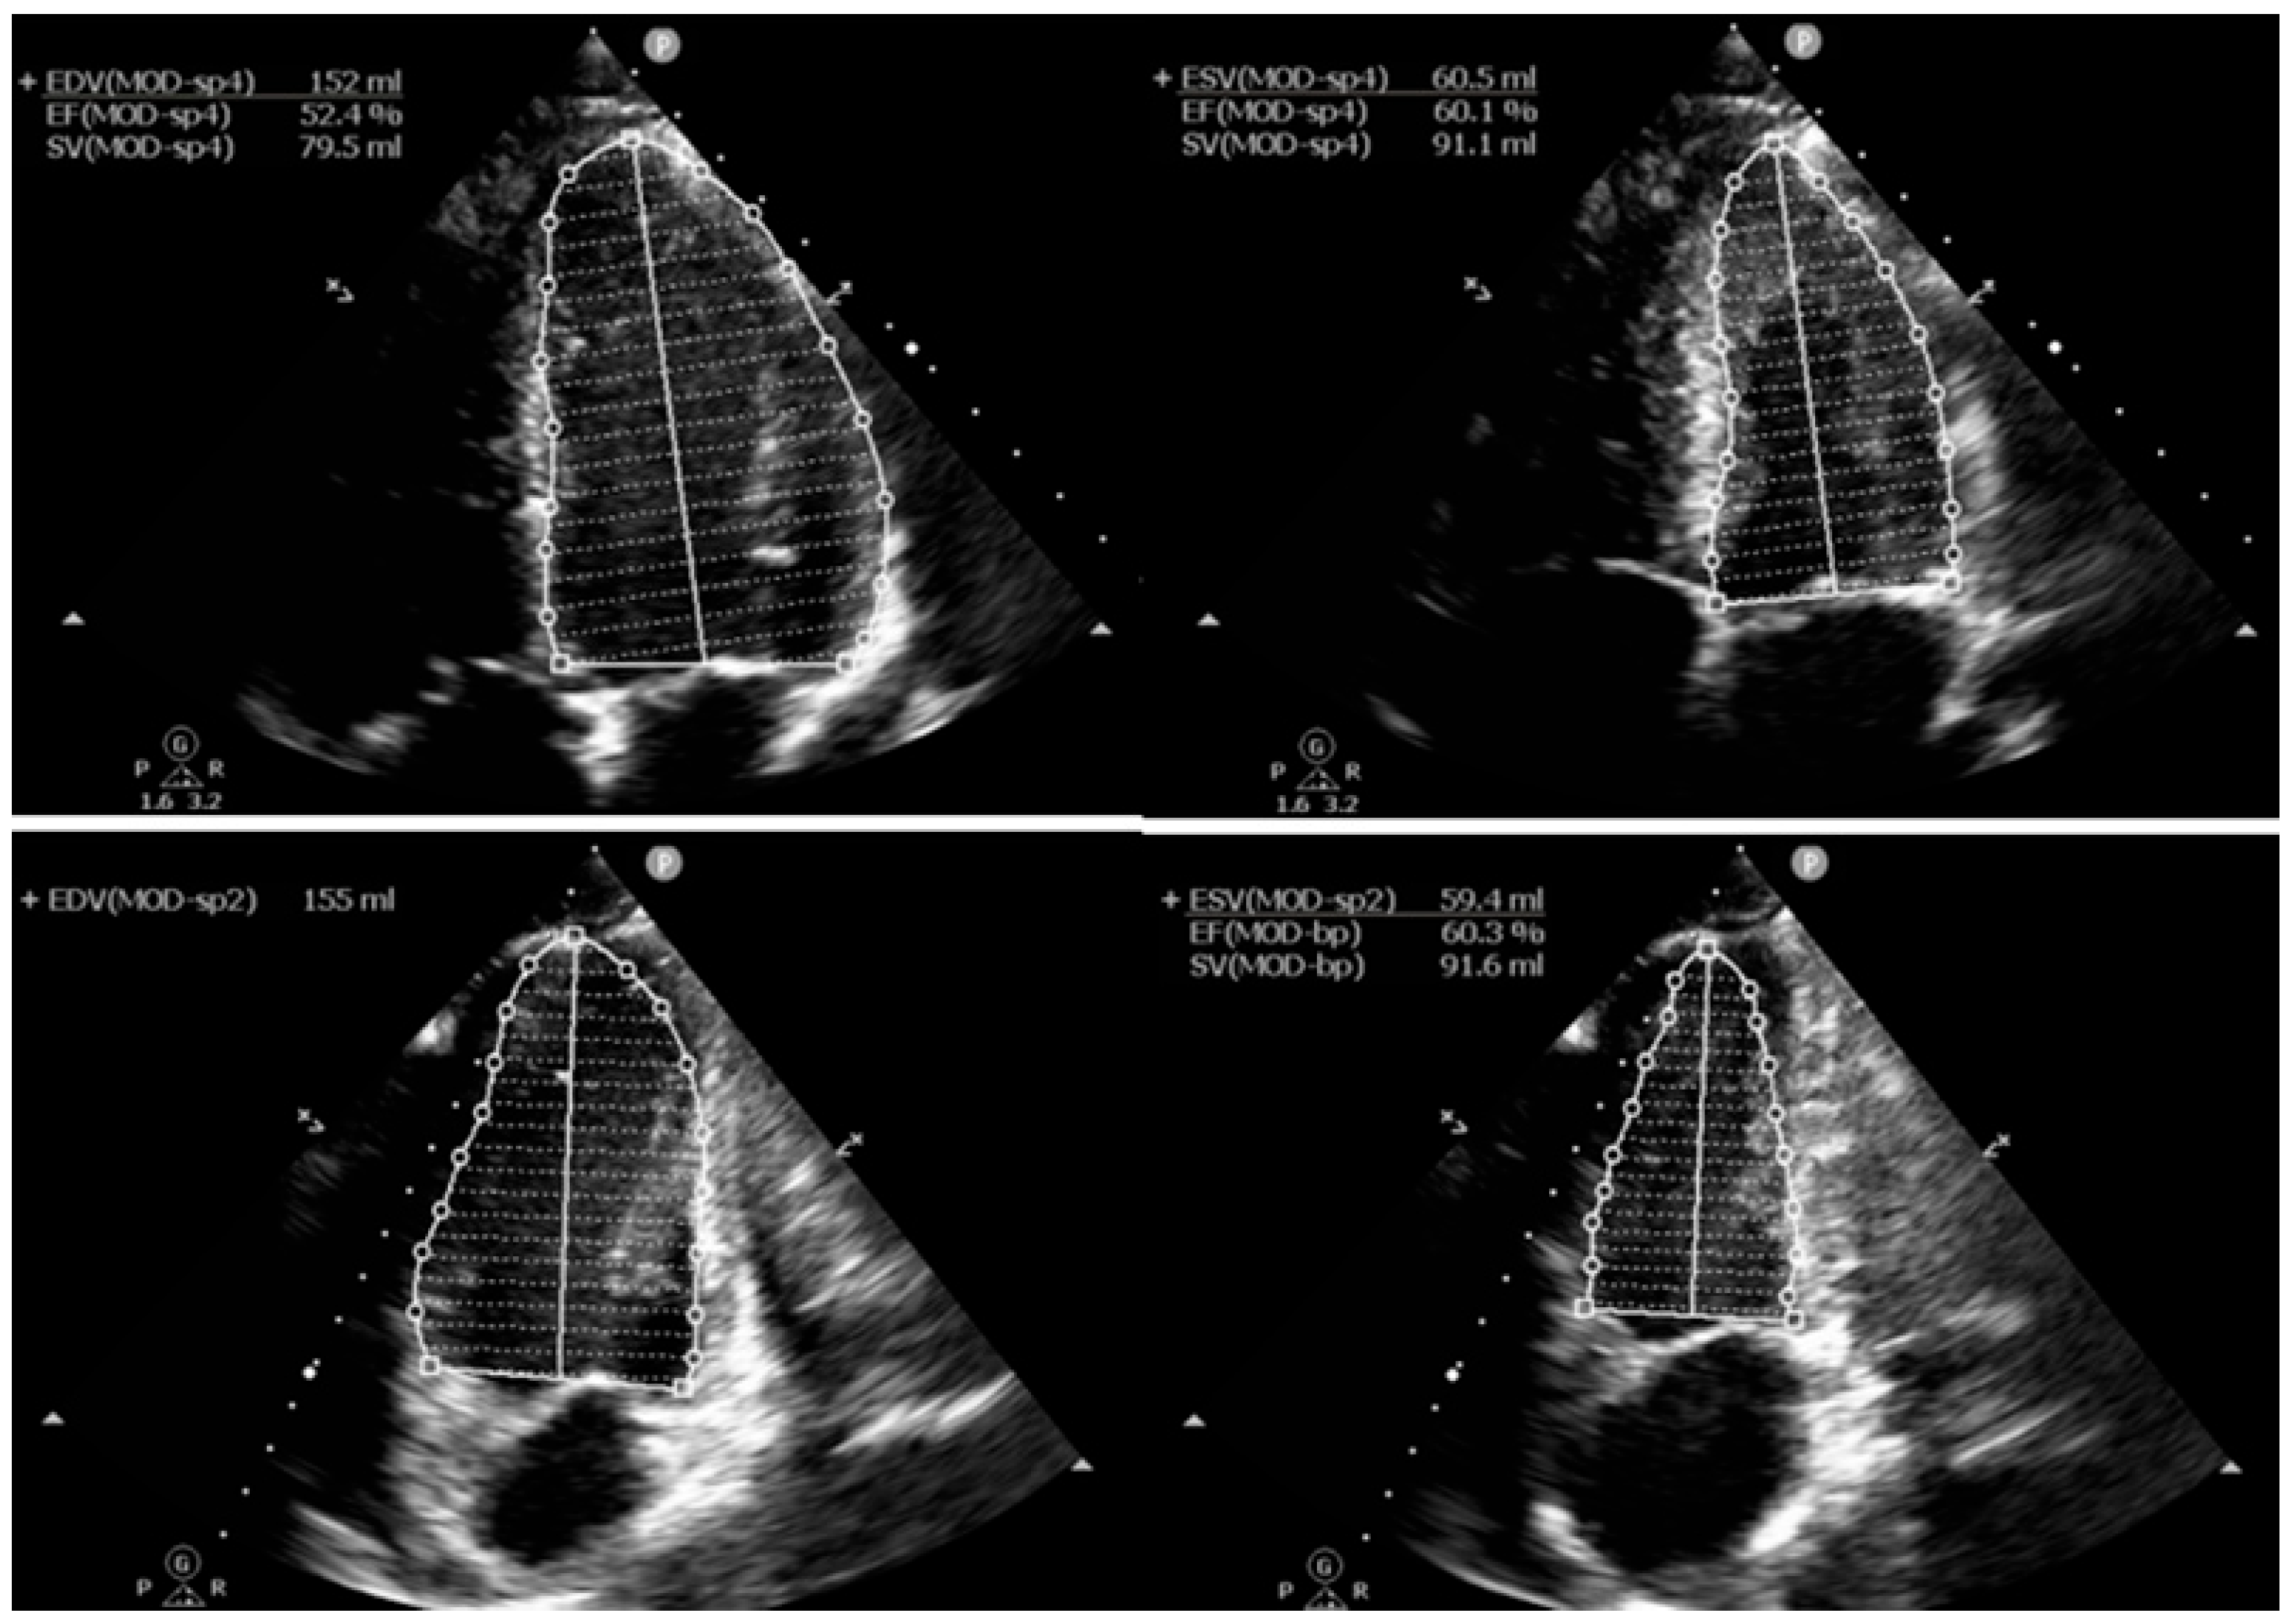
Systolic function was evaluated using fractional shortening (FS), Simpson’s biplane ejection fraction (EF), stroke volume (SV), cardiac output (CO), and cardiac index (CI). Normal LV systolic function was defined as preserved Simpson’s biplane EF within accepted sex-specific reference limits, with EF ≥ 52% in males and ≥54% in females.
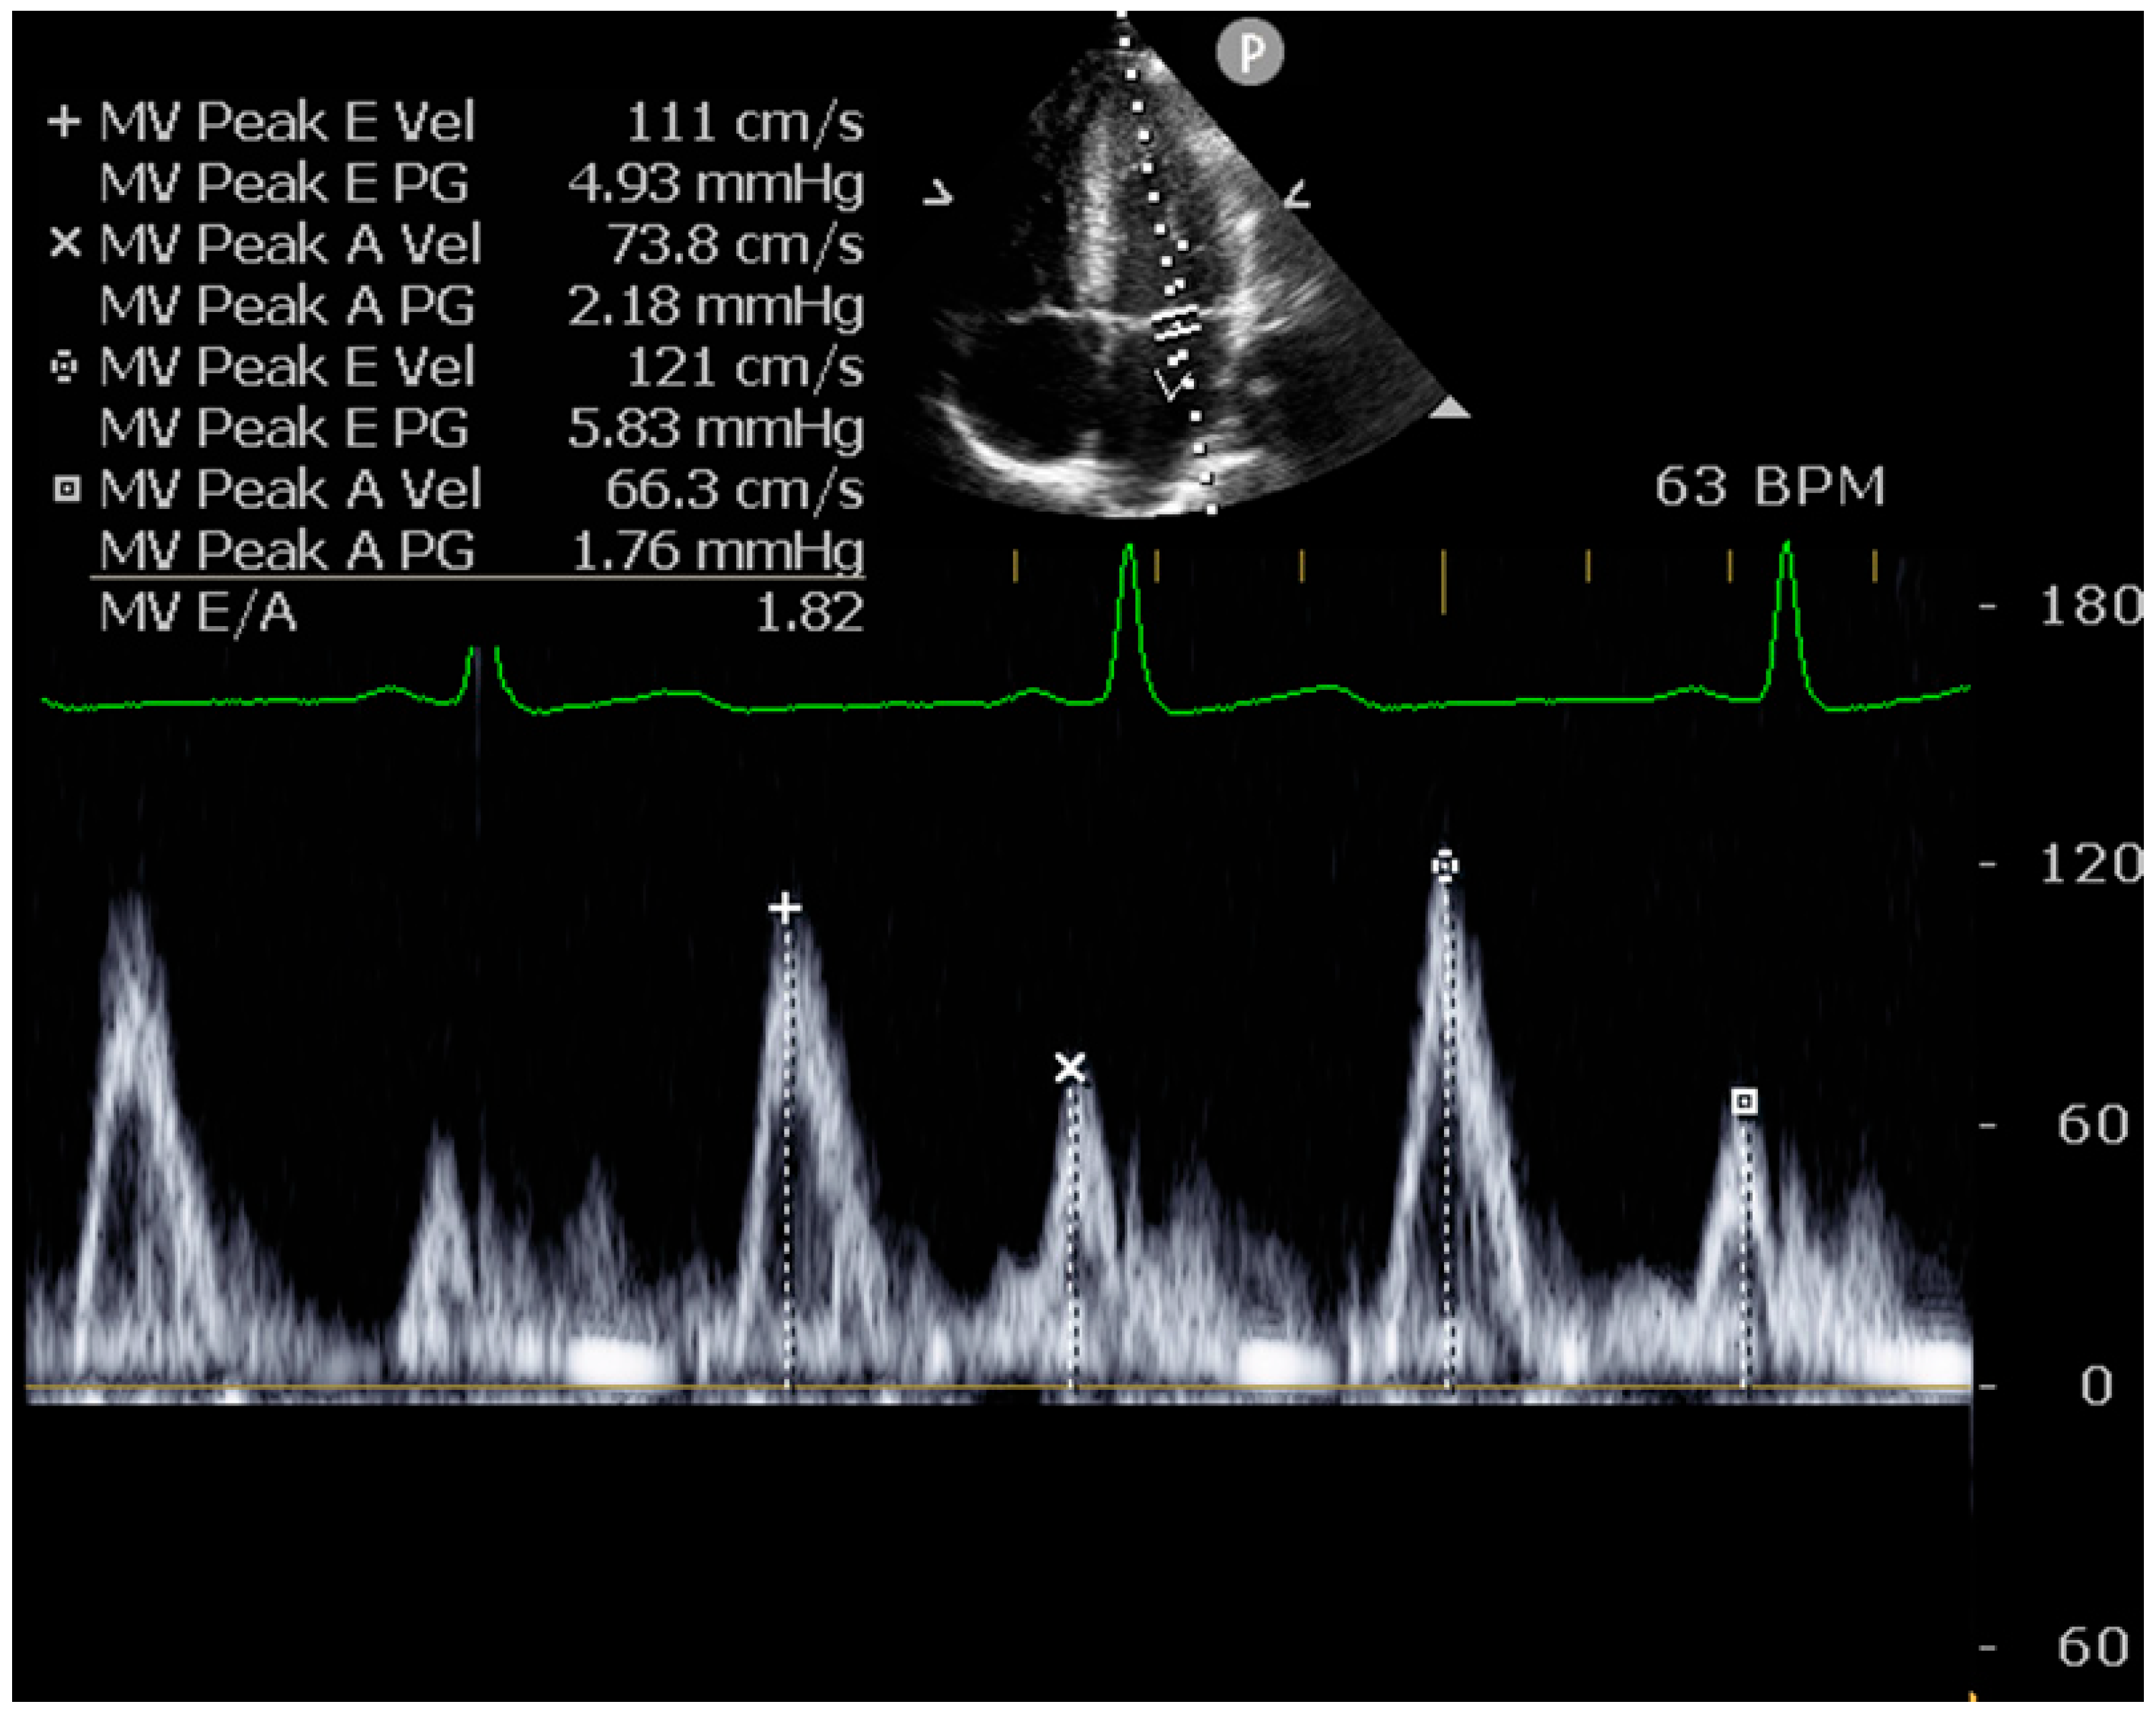
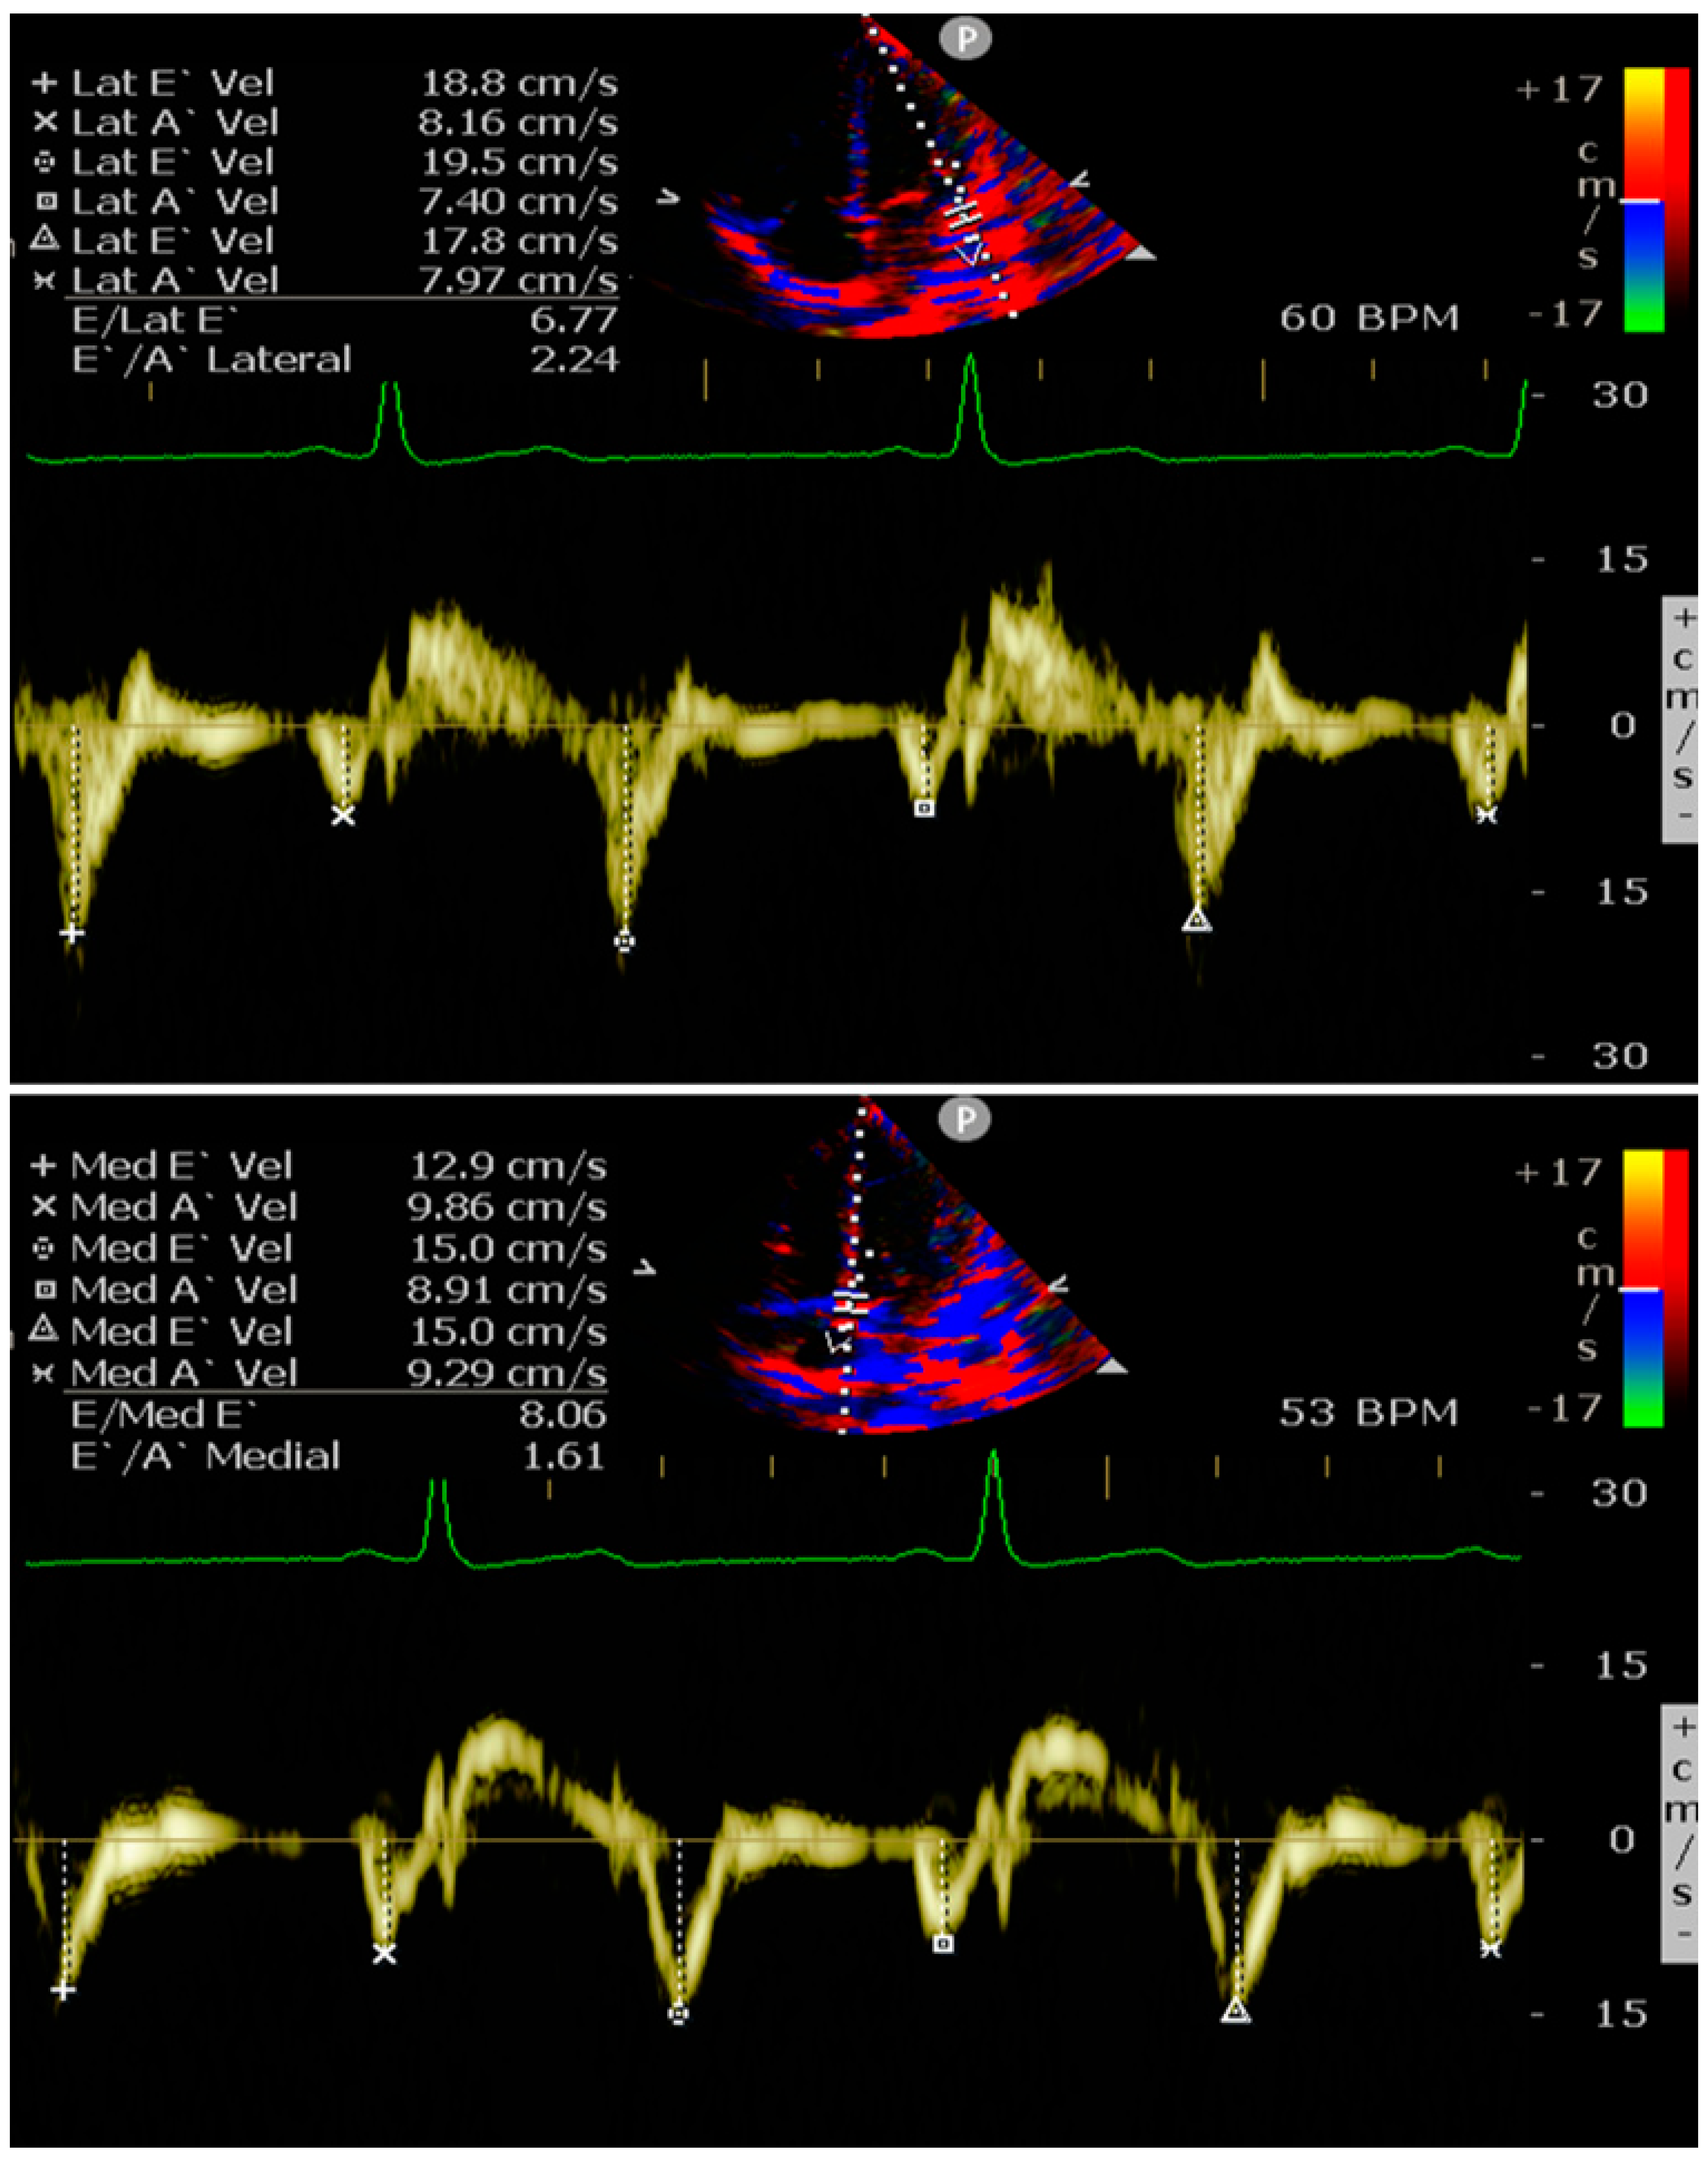
Diastolic function was assessed using pulsed-wave Doppler at the mitral valve leaflet tips to record peak early (E) and late (A) filling velocities, E/A ratio, and deceleration time (Dec T). Tissue Doppler imaging (TDI) at the lateral mitral annulus measured early (E′) and late (A′) myocardial velocities, from which E/E′ and E′/A′ ratios were derived.
2.12. Right Ventricular Structure and Function
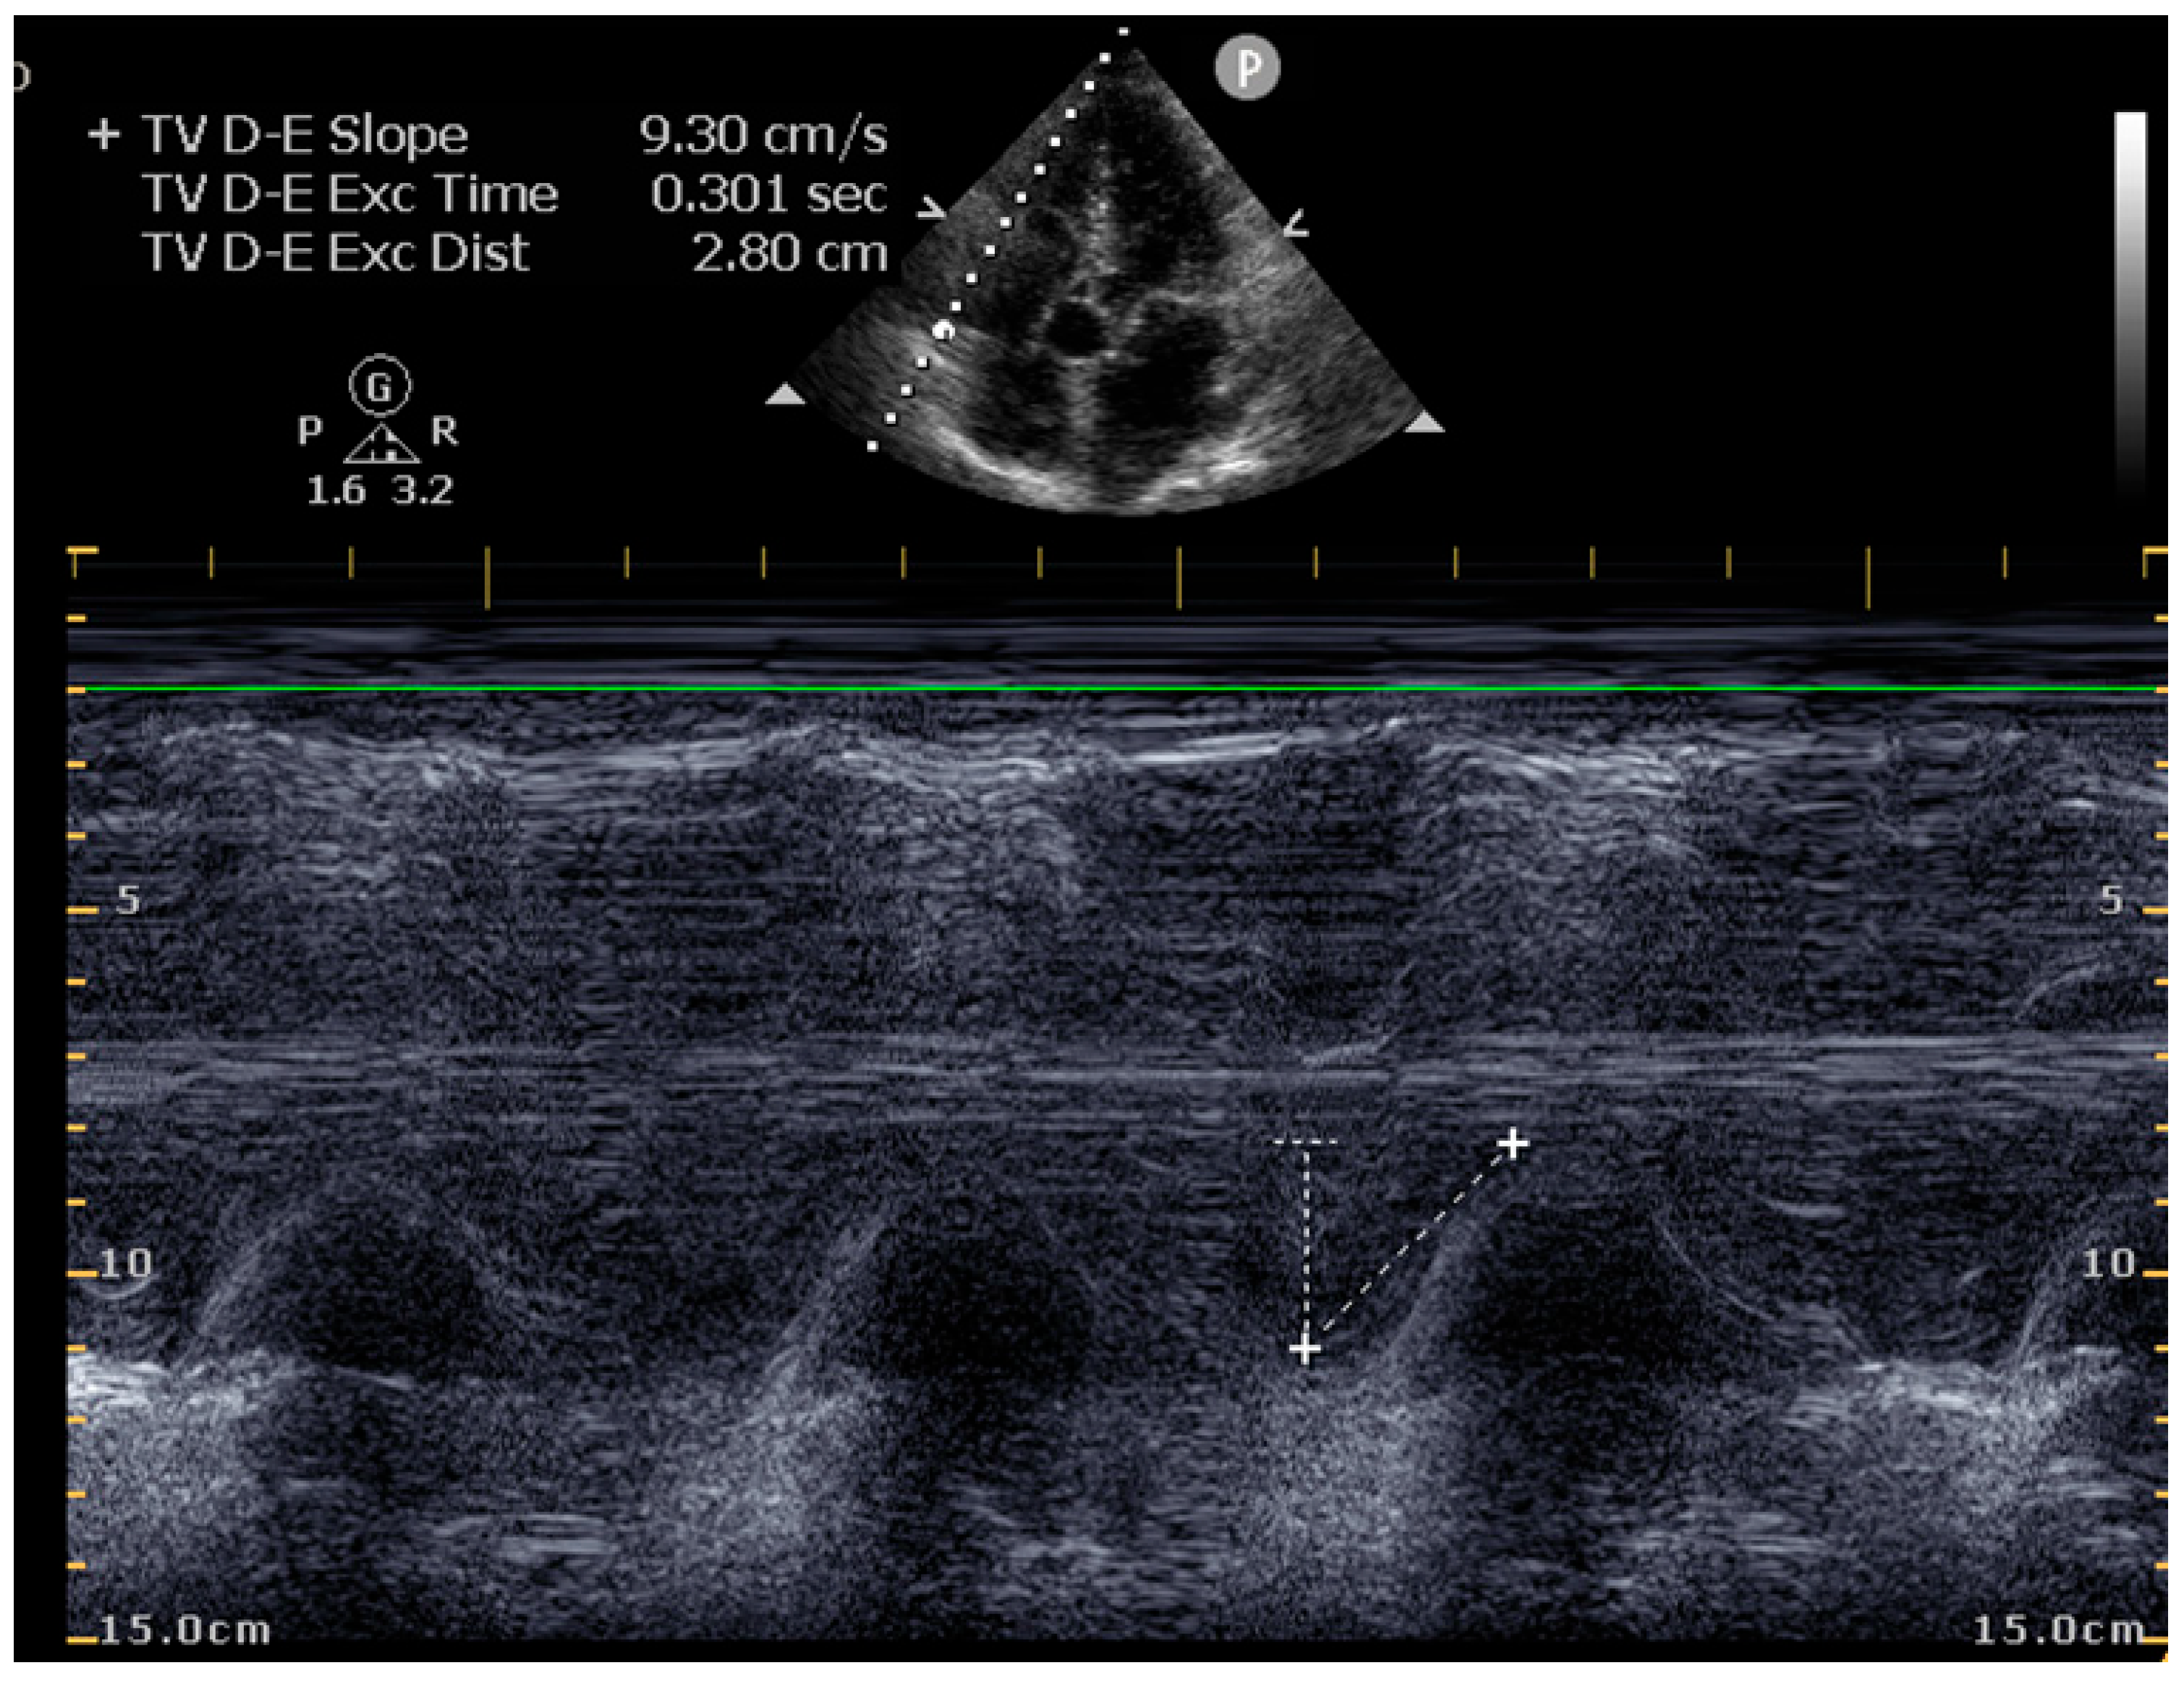
The right ventricular internal diameter in diastole (RVIDd) and right ventricular outflow tract diameter (RVOTd) were measured in the parasternal long-axis and subcostal views. Tricuspid annular plane systolic excursion (TAPSE) was used to assess right ventricular systolic performance. Normal RV systolic function was defined as TAPSE > 17 mm. Peak early (TV E) and late (TV A) tricuspid inflow velocities, as well as the TV E/A ratio, were obtained using pulsed-wave Doppler.
2.13. Atrial Measurements
The left atrial diameter (LAsd) was obtained from the parasternal long-axis view at end-systole, while the left atrial area (LAA) was measured using planimetry from the apical four-chamber view.
2.14. Statistical Analysis
Data were analyzed using IBM SPSS Statistics version 25.0. Descriptive statistics are expressed as means ± standard deviation (SD) for continuous variables and as frequencies and percentages for categorical variables. Normality of distribution was tested using the Kolmogorov–Smirnov test, with a p-value of less than 0.05 demonstrating non-parametric data and vice versa.
Comparisons among the four physical activity groups were conducted using:
The Kruskal–Wallis test for non-parametric variables.
Welch’s ANOVA for parametric variables.
The Dwass–Steel–Critchlow–Fligner and Games–Howell post hoc tests for pairwise comparisons.
Associations between participants’ characteristics and cardiac parameters were explored using Spearman’s correlation for non-parametric variables or Pearson’s correlation coefficient for parametric variables. Univariate and multivariate linear regression analyses were performed to identify independent predictors of cardiac dimensions and function. Statistical significance was set at p < 0.05. Covariates were included in the regression analysis based on a prior correlation analysis. Only statistically significant variables (p < 0.05) were included. In a multicollinearity analysis, variance inflation factor (VIF) diagnostics were run on all predictors. Initially, anthropometric parameters including height (VIF = 35.51), weight (VIF = 215.60), BMI (VIF = 24.65) and BSA (VIF = 253.30) showed severe multicollinearity. To address this, height and weight were later excluded from the final model, leading to a VIF of less than 1.70 for all predictors.
2.15. Sensitivity Analyses
No formal sensitivity analyses were performed. The primary analyses were conducted as prespecified.
2.16. Missing Data
Missing data were minimal and included the tricuspid valve E and A velocities of 12 participants. No imputation was performed; analyses were based on complete observations for the variables included in each model.
2.17. Sampling Strategy
Participants were enrolled using stratified random sampling. Analyses compared outcomes across the four physical activity levels.
4. Discussion
4.1. Summary of Principal Findings
This study examined the effect of physical activity on cardiac structure and function in 174 African university students with a mean age of 22.3 years. The main findings were that higher physical activity, especially the practice of more than one hour of active exercise daily, was associated with larger left ventricular chamber dimensions and greater ventricular wall thickness, including higher IVSd, LVIDd, LVPWd, LVM, IVSs, ESV, and EDV. However, conventional indices of left ventricular systolic and diastolic function remained largely preserved across activity categories, with no significant differences in EF or E/A ratio. Ventricular wall thickness findings in this cohort also appear modest and likely physiological. The overall mean IVSd was 9.13 mm and mean LVPWd was 9.63 mm, increasing to 9.87 mm and 10.1 mm respectively in the vigorous activity group. Right-sided adaptation was less marked. Taken together, these findings are most consistent with activity-related cardiac remodeling rather than overt pathological change in this young adult population. On ECG there were higher rates of bradycardia, repolarization and longer PR interval in the most physically active cohort.
The observed dose–response pattern, especially between lowest versus highest physical activity levels, supports the concept that training load influences cardiac remodeling.
4.2. Comparison with Other Studies
The larger ventricular wall thickness and chamber size in the most physically active group, compared with those with lower activity levels, align closely with patterns reported in previous studies. Engvall et al. [
15] reported that moderately trained athletes exhibited a significantly increased LV wall thickness and chamber dimensions compared with sedentary peers yet preserved global systolic and diastolic function. The stepwise remodeling pattern with rising physical activity level supports the concept of a dose–response relationship between exercise intensity and cardiac adaptation.
Similarly, Corsi et al. [
10] highlighted in their systematic review that left ventricular hypertrophy and repolarization variants are common physiologic adaptations among highly trained athletes, particularly those of African ancestry. The present findings extend this evidence by demonstrating comparable remodeling trends within a non-elite but ethnically homogeneous Ghanaian university cohort. However, the magnitude of LV wall thickening in our population was modest (mean IVSd ≈ 9.87 mm), well below the upper physiologic limit (>12 mm) reported in elite athletes.
In contrast to some earlier ethnic-based interpretations of “Black athlete’s heart,” our results reinforce the growing consensus that geographic ancestry and physical-training exposure, rather than ethnicity per se, better explain observed variations in cardiac morphology.
The absence of disproportionate wall thickening in our participants underscores that physiologic remodeling in African populations follows the same adaptive continuum described in the global sports cardiology literature. To the best of our knowledge, this study is the first of its kind that compares cardiac remodeling effects on different levels of physical activity in a young adult population that includes non-professional athletes. Ngabea et al. [
16], Pambo et al. [
17] and Bibou et al. [
18] conducted their study among professional footballers in Nigeria, Ghana, and Cameroon respectively, and they all found physiologically increased left ventricular hypertrophy among these professional athletes using electrocardiogram and echocardiogram.
The ECG finding on the prevalence of sinus bradycardia in higher levels of physical activity confirms a common finding among athletes. Some studies attribute sinus bradycardia to a change in cardiac autonomic balance, while others attribute it to a reduction in the sinus node firing frequency [
19], but it is generally considered to be multifactorial [
20]. The higher rate of repolarization among those who exercise more confirms previous studies in black athletes. For instance, Haïssaguerre et al. [
21] reported that 13% of black athletes showed early repolarization compared to 4% of black sedentary controls. Our findings also affirm those of Rawlins et al. [
22], who reported greater left ventricular hypertrophy and higher prevalence of repolarization changes in black female athletes. Again, the longer PR interval among higher-level athletes compared to the less active groups agrees with Abela et al. [
23], who noted a similar finding in young athletes.
4.3. Relevance to Clinical Practice
From a clinical standpoint, these findings have several implications. First, the observed echocardiographic reference ranges among physically active African young adults can inform context-specific normal limits, reducing misclassification of physiologic hypertrophy as cardiomyopathy during pre-participation or occupational screening. Second, recognition that even moderate physical activity promotes favorable cardiac remodeling supports public health recommendations advocating regular exercise for cardiovascular health. Finally, our results highlight the importance of interpreting echocardiographic findings using fitness-level-adjusted criteria rather than rigid ethnic-based norms, consistent with the equity-focused recommendations proposed by Corsi et al. [
10]. The findings of this study suggest that in highly active young adults, mild increases in wall thickness or mass should not be interpreted in isolation but alongside chamber size, functional indices, and overall training exposure. By contrast, in less active individuals, echocardiographic hypertrophy should raise concern for grey-zone or pathological remodeling, especially when chamber sizes are normal, and prompt further evaluation. Nevertheless, clinical context, including patient symptoms, family history, ECG findings and physical activity level, should be considered alongside wall-thickness thresholds when assessing possible pathological hypertrophy in African cohorts.
4.4. Strengths and Limitations
The strength of the present study is that it adds useful data from an underrepresented African population and suggests that modest increases in chamber size and wall thickness with increasing activity can occur, while conventional ventricular function remains normal. Nevertheless, some limitations merit consideration. Physical activity was primarily self-reported, introducing possible recall bias. Underestimation or overestimation of physical activity can influence the observed associations between physical activity and cardiac remodeling. However, if more active participants systematically overreported activity, or if some participants were incorrectly classified into higher activity categories, the association between physical activity and cardiac remodeling may have been exaggerated or distorted. It is also worth stating that participants were classified by overall activity level rather than by specific exercise modality. Although exercise type may influence cardiac adaptation, many participants in higher-level activity engaged in multiple exercise types, whereas those in the lower activity groups often reported irregular or no structured activity. Another potential limitation is lifestyle differences. Although smoking was part of the exclusion criteria, some lifestyle exposures, such as dietary patterns, could not be measured and could potentially affect cardiac dimensions. Lastly, the unequal number of participants across activity categories is a limitation of this study. As this was a cross-sectional study, participants were categorized according to reported activity level rather than recruited into equal-sized strata. Level 4 contained the largest number of athlete participants, while levels 1 and 2 were largely composed of non-athletic or minimally active individuals and, when combined, were comparable in size to level 4. The level 3 category represented intermediate activity, with the highest potential risk of misclassification bias. Unequal group sizes may influence the precision of estimates and the power to detect differences between groups, particularly for smaller categories. Therefore, the findings should be interpreted in the context of these limitations.
4.5. Implications for Future Research
Future studies should employ longitudinal and experimental study designs to monitor the temporal evolution of cardiac remodeling with sustained training and detraining. Incorporation of advanced echocardiographic parameters, such as global longitudinal strain and three-dimensional LV volumes, would enhance sensitivity to subtle functional changes. Comparative analyses involving elite and recreational athletes from different African regions could further elucidate the relative influence of genetic background, training type, and environmental factors on cardiac adaptation.



 ,
,