Article

Analysis of the Dynamic Response of a Proton Exchange Membrane (PEM) Fuel Cell Under Variable Load Scenarios


by
Milena L. Zambrano Hernández
1,2,
Manuel Calderón Godoy
3,
Antonio José Calderón Godoy
3,
Juan Félix González González
4,
José Rogelio Fábrega Duque
1,2,5,6,* and
Jorge Serrano Reyes
1,7
1
Campus Víctor Levi Sasso, Technological University of Panama, Carretera Centenario, Ancón, Panama City P.O. Box 0819-07289, Panama
2
Center for Hydraulic and Hydrotechnical Research, Technological University of Panama (UTP), El Dorado, Panama City P.O. Box 0819-07289, Panama
3
Department of Electrical Engineering, Electronics and Automation, University of Extremadura, Avenida de Elvas, s/n, 06006 Badajoz, Spain
4
Department of Applied Physics, University of Extremadura, Avenida de Elvas, s/n, 06006 Badajoz, Spain
5
National Research System (SNI for Its Acronym in Spanish), Technology and Innovation Panama (SENACYT), Panama City 06001, Panama
6
Center for Multidisciplinary Studies of Engineering Sciences and Technology (CEMCIT-AIP for Its Acronym in Spanish), El Dorado, Panama City P.O. Box 0819-07289, Panama
7
Center for Agroindustrial Production and Research, Technological University of Panama (UTP), El Dorado, Panama City P.O. Box 0819-07289, Panama
*
Author to whom correspondence should be addressed.
Electrochem 2026, 7(3), 19; https://doi.org/10.3390/electrochem7030019
Submission received: 18 September 2025 / Revised: 11 November 2025 / Accepted: 12 May 2026 / Published: 16 July 2026

Abstract

The dynamics and transient response of fuel cell systems are critical aspects, especially in commercial applications where an immediate response to fluctuating power demands is required. This study presents experimental results obtained from evaluating the dynamic behavior of a 1.2 kW Ballard Nexa fuel cell, subjected to various operational disturbances, including startups, shutdowns, step load increases, irregular and constant loading, and system purging operations. The variables analyzed include voltage, current, and temperature, both in individual cells and in the entire system. The results indicate that the temperature exhibits an attenuated response with an arc-like evolution, but with an upward trend correlated with the increase in the demanded current. Meanwhile, when multiple load steps are applied, the system exhibits rapid responses in both cell and stack voltages, with transient overshoot and undershoot peaks whose magnitudes increase proportionally with the applied current. Regarding the purge system, tests show that its activation improves operational efficiency, resulting in approximately 0.3 V of voltage increase per operation. Furthermore, it is observed that the purge frequency increases with higher external load levels, suggesting a direct interaction between energy demand and active waste gas management in the system.

1. Introduction

In December 2023, COP28 was held in Dubai, United Arab Emirates (UAE), representing a significant advance in global climate governance by conducting the first Global Stocktake of the Paris Agreement. This agreement urges countries to move toward a fair and equitable energy transition and to transition away from fossil fuels in energy systems in a just, orderly and equitable manner, in line with the Global Stocktake outcomes [1].
Within the framework of these global commitments, it is imperative to study and incorporate alternative, sustainable energy sources to help meet climate objectives. In this context, the so-called hydrogen economy [2] gains relevance. This energy is understood as a system based on the use of hydrogen as a marketable energy carrier, with the potential to represent a significant share of countries’ energy mixes and services, particularly for those committed to decarbonization and climate resilience. One of the fundamental advantages of hydrogen (H2) in this context is its ability to be generated from various primary energy sources—including renewable ones—and stored for later use, enabling it to meet energy demand when other sources, such as solar energy, are unavailable [3]. However, hydrogen alone is not a direct source of electricity; converting its chemical energy into electrical energy requires a fuel cell, an electrochemical device that enables this conversion through an oxidation–reduction reaction. In these cells, hydrogen serves as the fuel and is introduced at the anode (negative electrode). At the same time, an oxidizing agent, usually oxygen or air, is continuously supplied to the cathode (positive electrode). Within this category, proton exchange membrane fuel cells (PEMFCs) are of particular interest due to their operational efficiency and low emissions. These cells use hydrogen and oxygen as inputs and produce only water as a byproduct, making them a highly clean and sustainable alternative within the energy transition [4]. Within the operation of proton exchange membrane fuel cells (PEMFC), one of the fundamental aspects for their electrochemical and energetic analysis is the relationship between the output voltage and the current density. This relationship allows us to identify the mechanisms that originate internal energy losses in different operating regimes. At low current densities, the cell voltage is mainly influenced by electrochemical activation losses, which decrease exponentially due to kinetic barriers associated with the electrode reactions [5]. As the current density increases to intermediate levels, ohmic losses—due to the system’s internal resistance, both in the membrane and the electrodes—become dominant, resulting in a linear voltage drop. Finally, at high current densities, cell performance is limited by mass transport constraints, as more reactant is required at the electrode surface. In this regime, the voltage is determined by the diffusivity of the reactant gas (mainly oxygen) in the material’s pores, which can be compromised by the accumulation of liquid water at the cathode. This phenomenon, known as flooding, blocks the pores of the gas diffuser (GDL) and the electrode, hindering oxygen access to the active reaction zone [6].
It should be noted that these systems can operate in steady-state mode, that is, under conditions of constant current flow or demand over time. However, they can also operate under dynamic regimes, in which the current flow between the cell terminals experiences disturbances or abrupt transitions between different charge levels. In the latter case, a transient response of the system occurs, characterized by complex charge redistribution phenomena, adaptation of reactant concentrations, and variations in the thermal and humidity profiles within the cell [7].
During both operating modes, multiple complex and interrelated phenomena occur in fuel cell operation, including mass/heat transport, electrochemical reactions, and ionic/electronic conduction, which govern energy conversion and efficiency, and which must be taken into account when applying them to electrical power generation [8].
Fuel cells are remarkably versatile, with applications in a wide range of sectors, including residential use, portable electronic devices such as mobile telephony, and industrial and transportation applications, where they are becoming established as a viable alternative to conventional fossil fuels [9].
In applications where loading conditions vary over time, i.e., under dynamic regimes, fuel cell behavior is influenced by a series of transient phenomena, including the charge/discharge of the electrochemical double layer at the reaction interface, diffusion of gaseous reactant in GDL (Gas Diffusion Layer), MPL (Microporous Layer), CL (Catalytic Layer), and membrane water dynamics, including diffusion, electroosmosis drag, and liquid storage, phase change, and drainage [8]. These factors affect their durability and efficiency, which is why they constitute significant barriers to the wider commercial use of PEM fuel cells [10].
Therefore, a thorough understanding of the processes and operations of these systems during dynamic response operations is required to prolong their lifespan and to optimize materials, structures, and control methods to improve working conditions within fuel cells [11].
Most studies on PEM fuel cells are oriented toward steady-state behavior, but increasingly, studies are being conducted under dynamic loading conditions, including startup and shutdown stages. Dynamic behavior is a crucial aspect of fuel cell operation, enabling a close approximation of real-world operating conditions, such as in transportation and portable applications, where understanding dynamic behavior is vital since electrical power demand varies over time [12].

2. Previous Works

Dynamic operation is responsible for deterioration processes within PEMFCs. It is the underlying cause of the typical hygrothermal events and voltage cycling that occur during startup and shutdown, leading to severe damage to PEMFC catalysts [13].

2.1. Simulation

In this context, Rincón Murcia [14] presents the development of a real-time fuel cell emulator that considers electrical behavior from static and dynamic models. This fuel cell emulator aims to enable new research in this field without a physical system, allowing the study of fuel cell behavior across a wide range of conditions in controlled environments. Meanwhile, Loureiro Nascimento et al. [15] presented the modeling of a proton exchange membrane fuel cell (PEMFC) based on equivalent electrical circuits to represent steady-state and transient operation, accounting for major electrochemical losses. Simulations under different load conditions and electrical configurations were validated using experimental data from the literature, showing good model performance.
Qi et al. [16] developed a model for a polymer electrolyte fuel cell (PEFC) system that can characterize transient behavior using the control volume method. Three different cases are explicitly discussed based on different mass transfer assumptions in the cathodic channel, i.e., considering the presence of (1) oxygen only, (2) oxygen and nitrogen, or (3) oxygen in addition to nitrogen and water vapor in the cathode control volume. The analysis illustrates that the developed model adequately predicts the dynamic behavior of a PEFC system.
Nascimento et al. [15] presented an experimentally validated PEM fuel cell model in PSCAD (Power Systems Computer Aided Design)/EMTDC (Electromagnetic Transients in DC Systems), highlighting its behavior in dynamic operation. Tests were performed under load variations over short and long intervals, showing that the model accurately reproduces the transient responses of voltage, temperature, and internal resistances.

2.2. Evaluation of Degradation

Moving forward in deterioration prediction, Tang et al. [17] propose a fusion model based on an LSTM neural network [18] and a driving-cycle degradation rate model to more accurately predict degradation characteristics and estimate the health status of fuel cell stacks. The results show that the proposed fusion model can not only predict the overall performance decline trend of PEM fuel cells, but also capture the fuel cell’s dynamic characteristics.
Start-stop operations, as well as load transitions—when the system goes from low to high consumption (boost) or from high to low (buck)—are especially critical for cell performance, due to the occurrence of undesirable phenomena that result in exacerbated cell degradation with a consequent progressive voltage drop and an increase in internal resistance [19].

2.3. Strategies of Predictions

Wang et al. [20] developed a model of fuel cell degradation under dynamic operating conditions. The proposed approach is validated using data from a long-term accelerated-stress test of a vehicle-oriented PEMFC. The results show that the degradation mechanism model can be used to identify degradation rates under dynamic operating conditions.
J. Almingol Estrada [21] focuses on the dynamic operation of PEM fuel cells, using a nonlinear model representative of their transient behavior. This model is linearized and discretized with a 10 ms sampling time, allowing the simulation and analysis of system performance under variable load conditions. A generalized predictive controller (GPC) is implemented that incorporates measurable disturbances—such as the demanded current—and physical constraints—such as compressor voltage and excess oxygen. Based on this dynamic, three control strategies are evaluated to maximize efficiency, prevent starvation, and track a desired output voltage.

2.4. Evaluation of Dynamic Behavior

Yuan et al. [22] studied the transient characteristics of a proton exchange membrane (PEM) fuel cell. They used fixed-frequency impedance as an indicator of dynamic response performance, along with voltage. This model describes the trends in proton transfer loss and charge transfer loss. Based on this, they investigated the effects of different step currents, air stoichiometry, back pressure, humidity, and temperature on the dynamic response of the PEM fuel cell. They thus observed a close relationship among voltage, internal hydration state, and oxygen transfer.
Goshtasbi et al. [23] used experimental data on the transient response of a fuel cell to validate a 2D transient model that accounts for the microstructural characteristics of various cell layers. They investigated the impact of operating temperature and relative humidity on the transient response of this fuel cell. The model enables analysis of transport phenomena and could help evaluate temperature, potential, and species distributions within the cell, thereby optimizing its design and material selection.
Y. Shi et al. [24] analyzed the transient behavior of a PEFC using dynamic tests with different load profiles. They observed that higher current change rates intensified voltage overshoots and undershoots, which disappeared without a hold time. Although the average pressure drop did not vary significantly, the study confirmed that dynamic testing is key to understanding water-handling and electrical responses under transient conditions.
P. Herreros Carmona [25] models a hydrogen fuel cell using experimental data and an OSI algorithm in Matlab-Simulink (version R2023b). Dynamic testing allows the model to be tuned in real time and evaluates its response to rapid changes, validating its usefulness for energy management systems in electric vehicles.

2.5. Vehicle Application

As reviewed in the literature, dynamic testing of proton exchange membrane (PEM) fuel cells is gaining momentum, driven by the development of fuel cells for automotive applications [26,27,28].
Cheng et al. [29] explore the impact of slew rate and PEMFC operating points on hydrogen consumption at the real system level. In this paper, a dynamic model of the PEMFC system is established and experimentally verified. The model can capture the dynamic response of PEMFCs across a range of operating points and slew rates.
Liu, Zhang, and Xu [30] successfully designed and implemented a combined air-pressure and mass-flow control strategy to an 80 kW automotive fuel cell system. The proposed approach was shown to satisfy the system’s power demand requirements while providing adequate dynamic response and maintaining stable steady-state operation across a range of operating conditions. Under appropriate air-supply conditions, the fuel cell system exhibited satisfactory dynamic behavior and steady-state performance. Additionally, consistency analysis based on the coefficient of variation of cell voltage indicated improved voltage uniformity and overall system consistency during dynamic load changes.
Tang et al. [31] investigate the dynamic performance of a hybrid system in a series of laboratory and on-road tests combining a 2 kW air-blown proton exchange membrane fuel cell (PEMFC) and a lead-acid battery pack for a light-duty cruise vehicle. Specifically, the cell current and voltage are investigated during dynamic operation due to load variations. The dynamic responses of other operating parameters, such as anode operating pressure and inlet and outlet temperatures, are also investigated. The results show that such a hybrid system is capable of dynamically meeting the vehicles’ energy demands.
Salazar Nájera et al. [32] demonstrate, through dynamic simulations, that EMPC enables efficient energy management, adapts to demand variations, and reduces hydrogen consumption by up to 14%. This approximation serves as a relevant precedent for studies of dynamic analysis and performance testing in hybrid electric vehicles.
Ruiz Sicilia et al. [33] Using dynamic simulations performed on a hybrid traction model, they demonstrate the effectiveness of predictive control (MPC) for energy management in industrial vehicles. Using a driving profile composed of acceleration, constant speed, and braking phases, the system’s behavior is evaluated under different power demands.
Sampietro et al. [34] proposed a propulsion system that integrates a hydrogen fuel cell as the primary power source, along with batteries and supercapacitors for energy storage. The study focuses on evaluating various predictive control strategies (economical and robust) compared with dynamic programming to optimize energy use and extend component life. A key aspect of the work is the implementation of dynamic tests using real driving cycles, such as the Buenos Aires Driving Cycle (BADC) and the Manhattan Driving Cycle. These profiles enable the simulation of real urban conditions and the evaluation of the system’s behavior under speed variations, acceleration, and braking.
Toalombo-Vargas et al. [35] presented a study on the energy balance of a fuel cell-based hybrid vehicle, which analyzes the interaction between the combustion engine, the electric motor, and the energy storage systems (batteries). The work highlights the importance of electronic management to optimize the use of each energy source according to the vehicle’s operating conditions. Although the primary focus is conceptual and technical, the study also includes an analysis of system behavior under different load and power-demand conditions. This approach involves dynamic testing, which enables validation of system efficiency and its ability to reduce fuel consumption and pollutant emissions.
Silva Garrido et al. [36] developed a study aimed at the design and validation of a hybrid propulsion system based on hydrogen fuel cells (PEMFC) and batteries, intended for CAEX mining trucks at the Los Pelambres Mine (Chile). In this work, they propose a detailed set of dynamic tests under real-life mining operating conditions, including startup tests, nominal and maximum power, dynamic response, efficiency, and sensitivity to variables such as temperature, humidity, and pressure. These tests aim to validate system behavior under representative power demands, advancing the technological maturity level (TRL) of the proposed solution.
Anderson et al. [37] presented the design, implementation, and experimental validation of a second-order sliding mode controller (Super-Twisting) applied to a hybrid power generation system composed of a fuel cell and supercapacitors. The system was evaluated on an experimental platform that emulates the power demand of an electric vehicle operating under a standardized urban driving cycle (EPA IM240), which constitutes a representative dynamic test.
Mayorga Aedo [38] develops and evaluates an electric vehicle propulsion system based on a hybrid architecture composed of a fuel cell as the primary power source and a supercapacitor bank as the secondary power source. The study includes complete powertrain sizing, selection of electrical components, design of DC-DC 279 converters, and implementation of an energy control strategy.

2.6. Humidification

Yang, Cha, and Kim [39] investigate the impact of reactant flow directions in the anodic and cathodic channels on the dynamic responses of PEMFC fuel cells. They analyze the dynamic responses of cell voltages and local transfer currents with abrupt increases in current density. They find that, in general, for PEMFCs without humidification, the counterflow cell is preferred due to its higher performance and stability.
Cecilia et al. [40] present the design and implementation of a high-gain observer with a self-tuning dead zone to estimate liquid water saturation in PEM fuel cells. The study addresses one of the main challenges in the efficient operation of these fuel cells: water management, which cannot be directly measured online with conventional sensors. The proposed observer is validated through simulations and dynamic experimental tests using an H-100 model PEM fuel cell installed in a controlled environment.
J. Almingol Estrada [41] focuses on the design and implementation of electronic control systems for open-cathode PEM fuel cells, highlighting the use of dynamic testing as a key tool in performance optimization.

2.7. Test on Single Cell

Z. Penga et al. [42] use a segmented single-cell PEM to evaluate dynamic behavior under current and potential ramps, as well as under the NEDC (New European Driving Cycle) protocol. The tests include dry, partially humidified, and fully humidified reagents in a counterflow configuration. The results of the analyses indicate that operation with dry and partially humidified reactants is primarily affected by the pause duration, resulting in distinct polarization curves and pronounced hysteresis during forward and reverse polarization.

2.8. DC/DC

H. Duan et al. [43] analyzed the dynamic and transient behavior of low-consistency fuel cells in series and parallel configurations, without the use of DC/DC converters. Aspects such as adaptive power allocation and output stability are investigated. The results reveal that, in series systems, the voltage and its variations (overshoots and undershoots) increase with load, exacerbating poor performance.
Quispe Cuba [44] presents the design and validation of a boost DC-DC converter to improve the performance of a hydrogen fuel cell. The study focuses on stabilizing the fuel cell output voltage to enable more efficient energy delivery to the load. To this end, simulations were performed under different load conditions to evaluate the converter’s dynamic behavior under current and voltage variations. The results show that, even with abrupt load changes, the converter maintains an output voltage close to 48 V and an average efficiency greater than 99.9%.

2.9. Electric Generator Application

J. J. Caparrós Mancera [45] presents a comprehensive experimental approach to optimizing renewable microgrids using hydrogen technologies and supercapacitor integration. In this work, multiple dynamic tests were performed on both a medium-sized PEM electrolyzer and a high-voltage DC microgrid to evaluate the system’s behavior under short- and long-duration transients. Their results validated the system’s efficiency, its response to start-stop cycles, and the supercapacitors’ ability to mitigate voltage drops and current surges.

2.10. Other Applications

Guillermo Hernández Lorente [46] develops a test bench for hybrid propulsion systems in aircraft, integrating a PEMFC fuel cell with lithium-ion batteries. The author highlights dynamic testing as a tool to evaluate the joint behavior of cells and batteries, optimize hydrogen consumption, and improve energy management—fundamental aspects that guarantee the viability and efficiency of these systems in aeronautical applications.
In aviation [47], as well as the requirement to reduce the size of battery packs in cars. Dynamic testing enables detailed analysis of the behavior of key variables in system operation, facilitating the development of more robust and efficient control strategies. This is achieved by integrating strategically located sensors, actuators, and electronic components to optimize overall system performance [48].
This study analyzes the voltage dynamics and transient response in a fuel cell composed of 47 cells connected in series, considering this analysis a fundamental requirement for optimizing energy efficiency and extending the lifespan of such devices [49]. Unlike most previous studies, which focused on single-cell configurations, modeling approaches, or system-level dynamic simulations, the present work offers a comprehensive experimental analysis of a 47-cell series-connected PEM stack operating under realistic transient conditions. The study simultaneously examines voltage dynamics at both the stack and individual cell levels, identifying non-uniform behavior and localized phenomena that are typically averaged out in stack-scale analyses. Furthermore, by coupling this electrical characterization with the evaluation of the thermal response under varying loads and incorporating the dynamic behavior of the blowdown process, the study provides a comprehensive view of the electrical, thermal, and operational mechanisms governing the transient performance of PEM stacks. This multidimensional approach constitutes a novel contribution, bridging the gap between single-cell experimental studies and full-scale system models and providing valuable insights to improve energy efficiency, thermal management, and durability in real-world applications.
The sections of this work first present the methodology employed and the experimental system. Second, the results for the transient responses of voltages and temperatures, and the purge process of the system, are presented and analyzed under various external load conditions and operating sequences of our experimental equipment.

3. Experimental Equipment

In this paper, experimental data were obtained from an acquisition system [50] consisting mainly of three manufactured by National Instruments, Austin, Texas, United States [1,2] DAQs (NI USB-6225, NI USB-6218, and NI USB-6008) to measure analog signals of cell voltages, HTB-100 current sensors, and LM 35 temperature sensors. The fuel cell used is a 1.2 kW air-cooled Nexa module that includes a stack of 47 cells connected in series, an electronic board, and auxiliary equipment. The cells used are proton exchange membrane (PEM—Polymer Electrolyte Membrane) type, using a membrane polymer as the electrolyte, specifically Nafion 115 commercialized by DuPont and is currently manufactured and marketed by Chemours with a thickness of 120 cm2. This stack can provide up to 1200 W of power at a nominal output voltage of 26 VDC. Figure 1 shows the stack’s composition scheme.
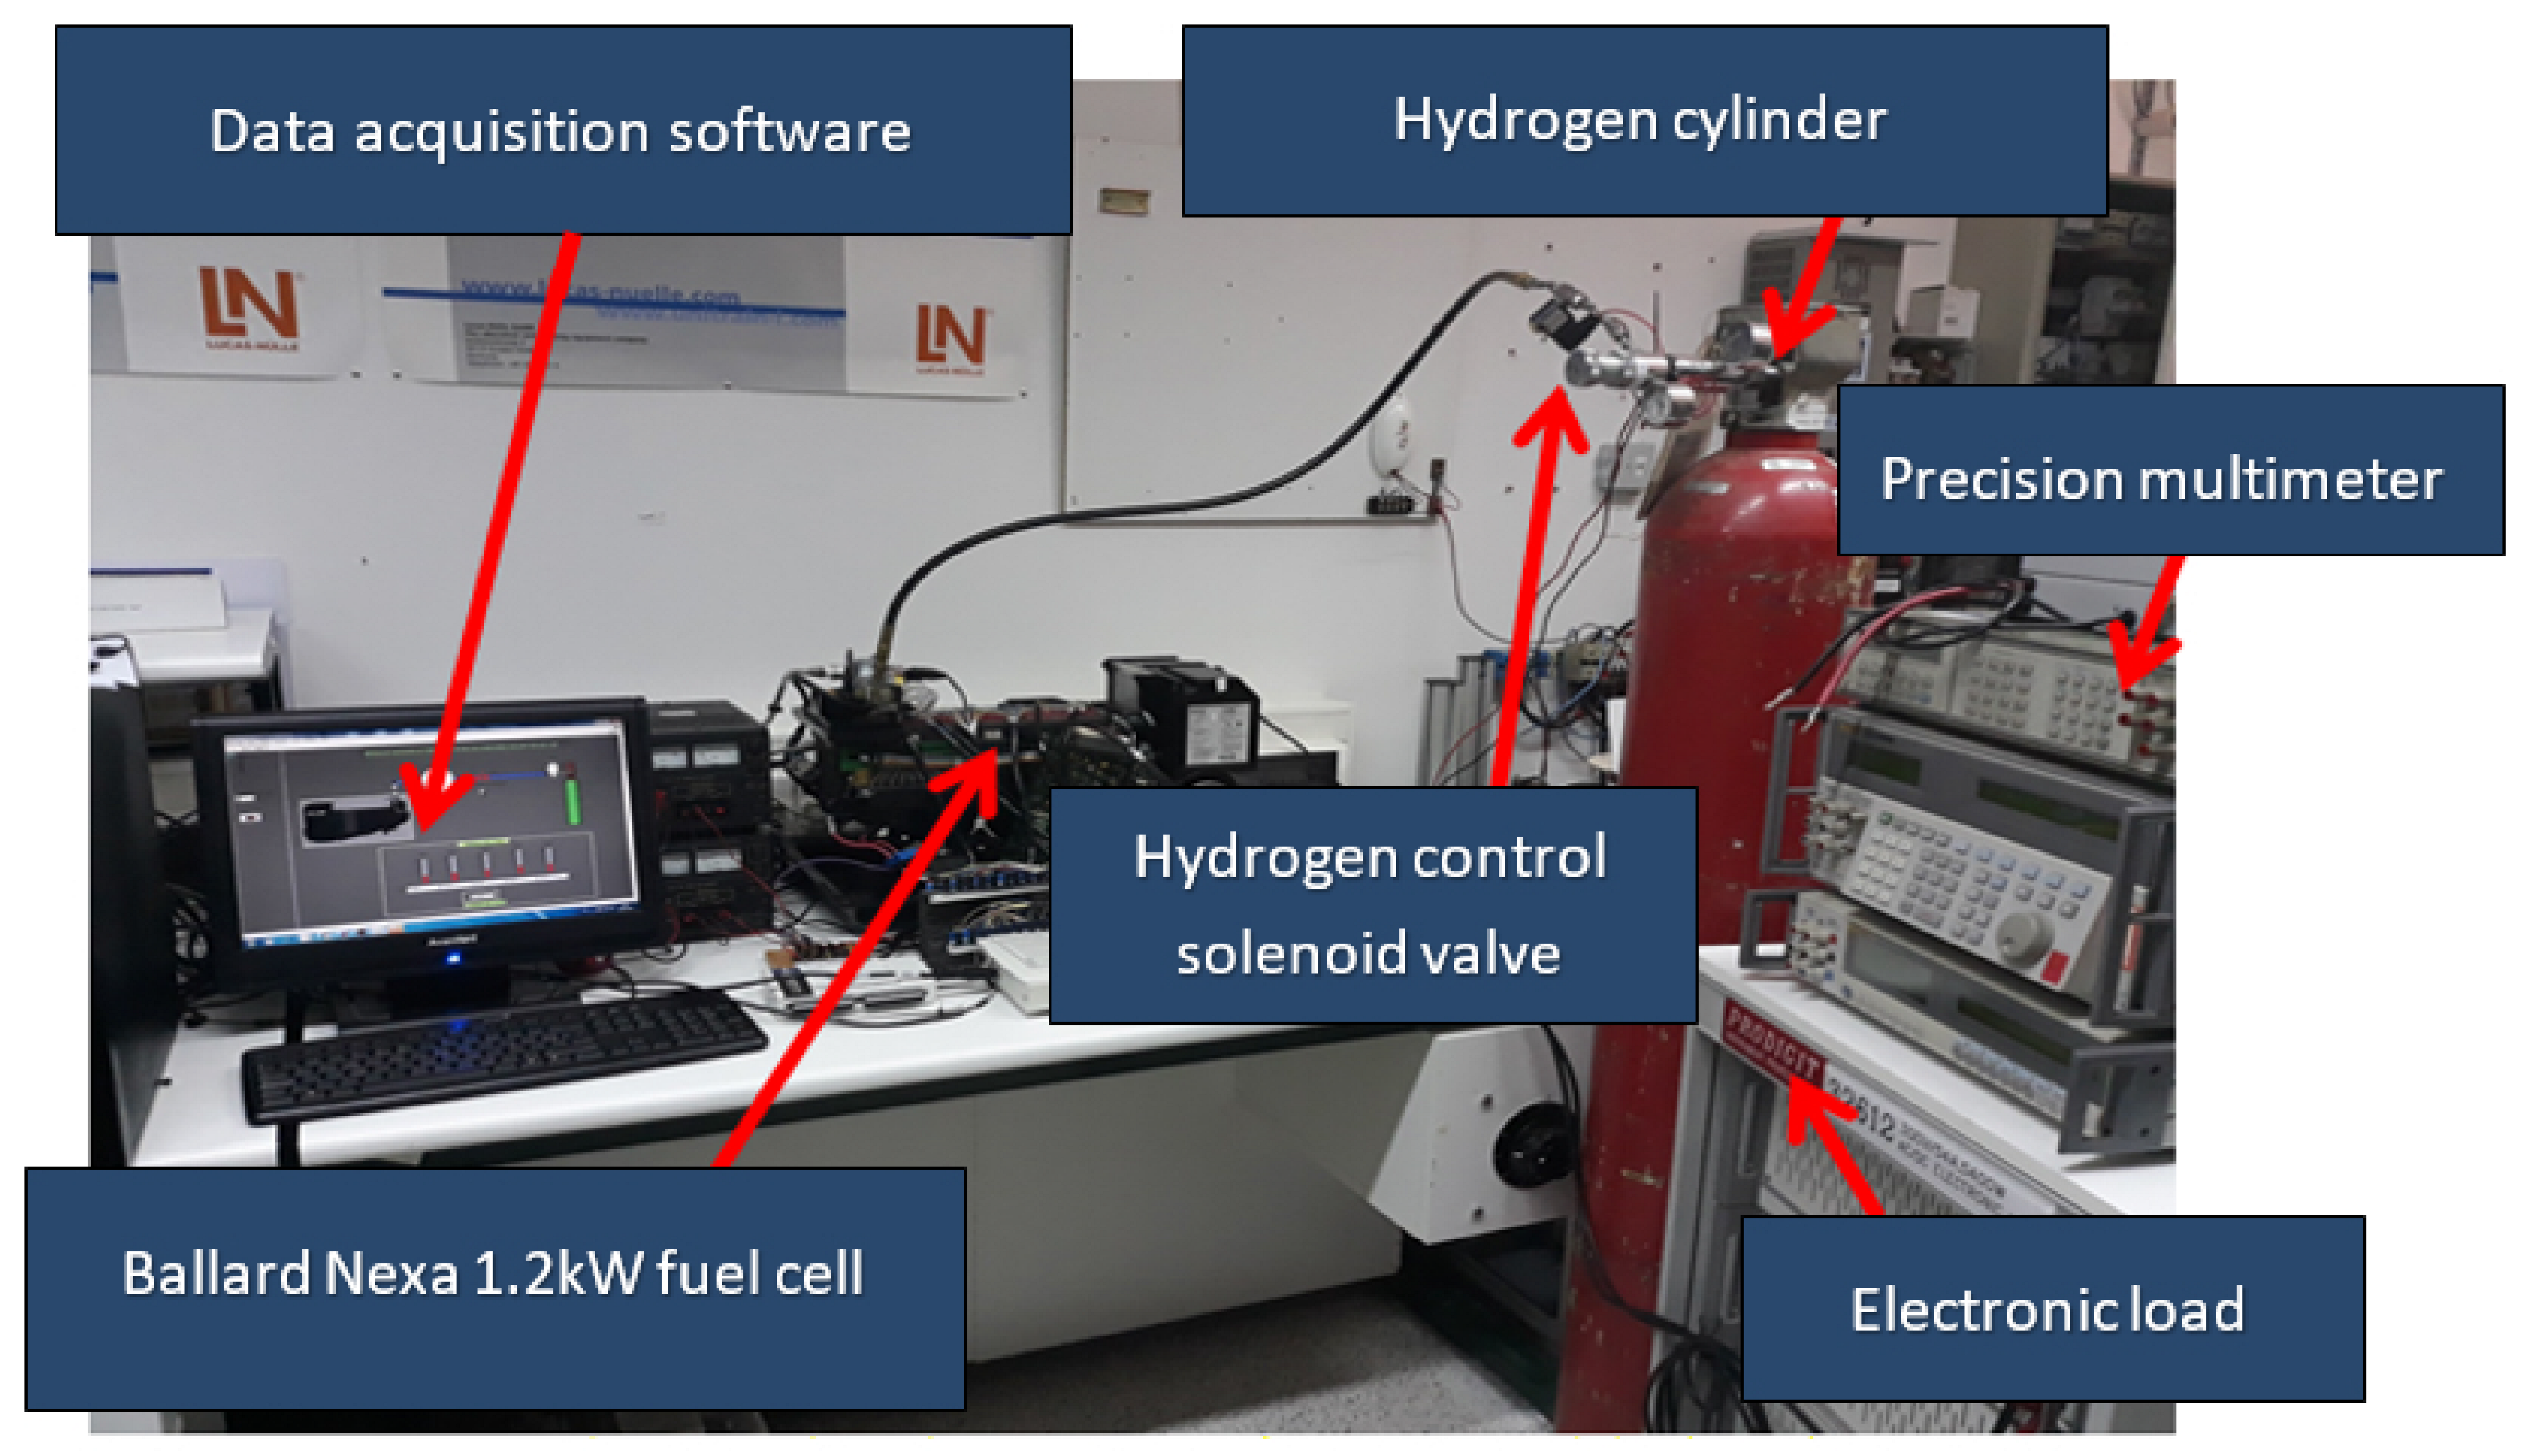
To carry out the tests, it was necessary to have a laboratory composed of the following equipment: hydrogen storage tank, Ballard Nexa PEM 1200 W fuel cell which, as mentioned, is an integrated module of 47 fuel cells connected in series and auxiliary components such as the air compressor, cooling fan, humidifier, purge valve, pressure regulator and microprocessor control as described in [4]. In addition, two computers, two power supplies, a precision multimeter, and a hydrogen cylinder were available (Figure 2).
For the investigation of dynamic behavior, the Prodigit 3260 series module was used as an external load, allowing for a series of experiments under different operating conditions. The experimental process consisted of five stages: startup, shutdown, load ramp, regular load variation at multiple levels, and irregular load variation. The main objective of this study was to identify the dynamic performance at each stage and characterize the system’s transient response to varying loads.

4. Dynamic Behavior Experiments

To analyze the dynamic behavior of the fuel cell, various experimental tests were designed and executed under diverse operating conditions. The experimental protocol structure included five main stages: startup, shutdown, load ramp-up, load regulation at different levels, and irregular load variation. The implementation of these phases enabled evaluation of the system’s dynamic performance under each condition and characterization of the most representative transient responses to external load applications, providing key information for system modeling and control. The variables analyzed included stack and individual cell voltages, cell temperatures, stack temperature, and purge signals.
In these experiments, both individual fuel cells and the complete stack are analyzed, as each level of study provides complementary insights critical to understanding and optimizing system performance. The stack-level analysis focuses on the system’s overall behavior, particularly the total voltage and the voltage of each cell in the stack. This is essential for evaluating operational stability and identifying potential performance degradation. A single cell operating at lower efficiency—due to membrane damage or uneven distribution of reactants—can significantly impact the performance of the entire stack.
During the experiments, the hydrogen pressure (Hydrogen control solenoid valve) was set to 2.5 bar, and the ambient temperature to 25 °C. The external charging current was progressively applied in each test until the stack reached thermal equilibrium, defined as a constant temperature. For the startup and shutdown tests, the battery operating status code was used: 0 corresponds to the standby state, 1 to the startup sequence, and 2 to normal operation (Running).

4.1. Transient Response Under Different Loading Conditions at Constant Scale

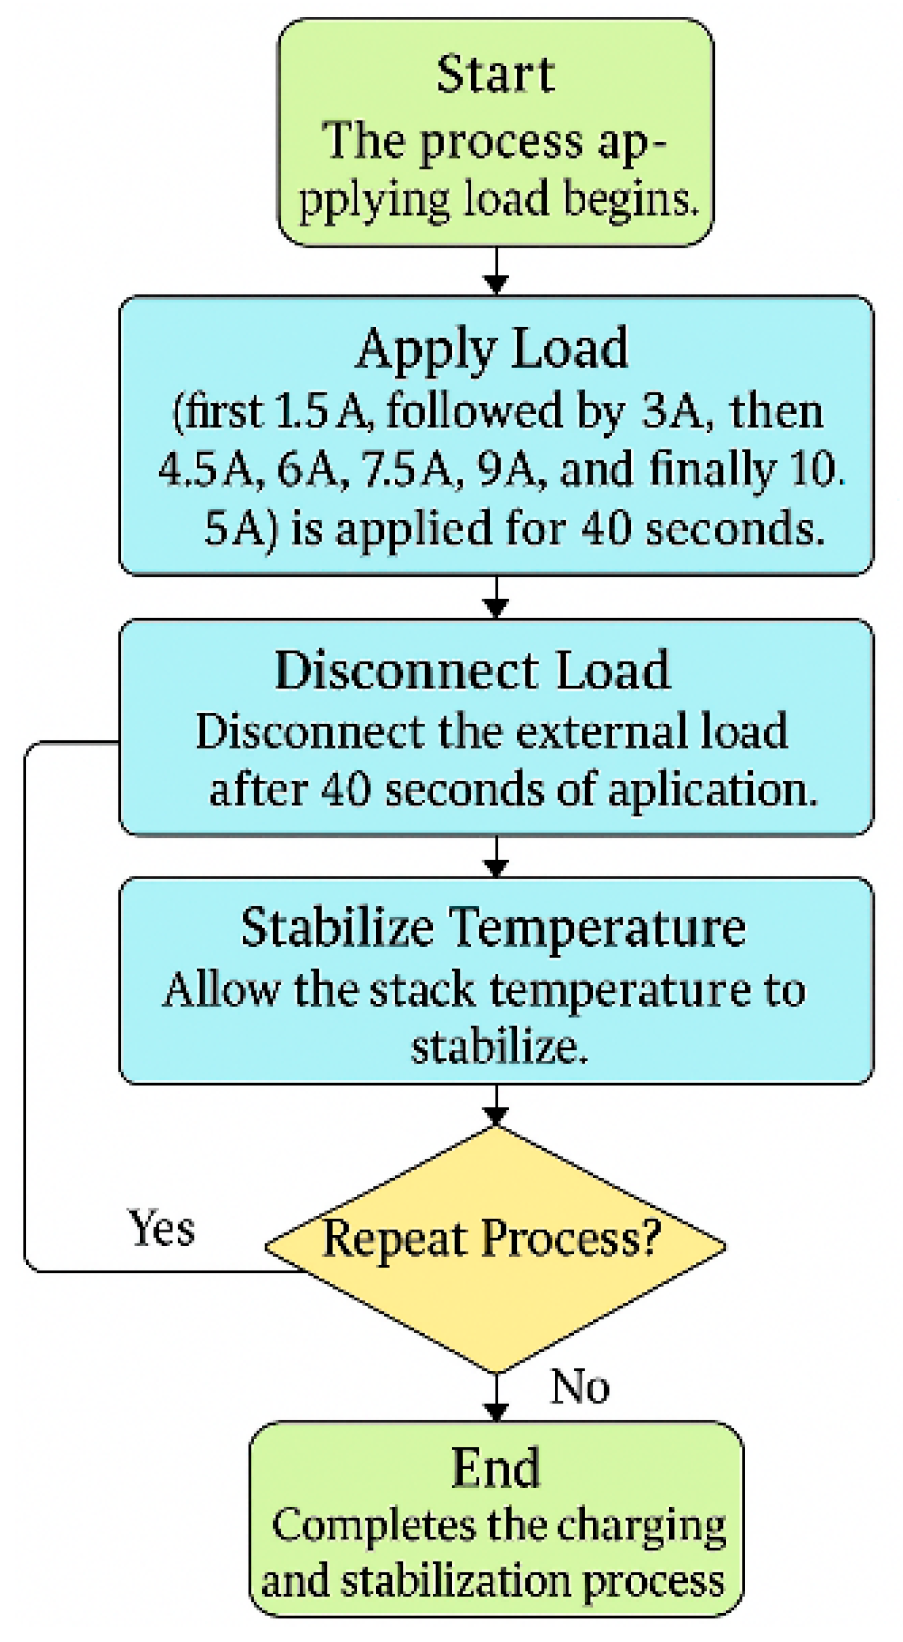
Constant-scale transient tests were designed to analyze the fuel cell stack’s response dynamics to current pulses of fixed magnitude and controlled duration. To achieve this, an external electronic load configuration was used, tuned to specific current ranges: 1.5 A, 3 A, 4.5 A, 6 A, 7.5 A, 9 A, and 10.5 A (Figure 3). Each load level was applied for 40 s, after which the external load was disconnected to allow the stack to thermally stabilize before proceeding to the following sequence. This experimental protocol allowed evaluating the transient responses of voltage and temperature, the system’s bleed dynamics under controlled conditions, and comparing the electrochemical system’s behavior at different load levels in a stepped operating regime.

4.2. Transient Response Under Different Load Conditions at Variable Scale and Continuous Load Variation

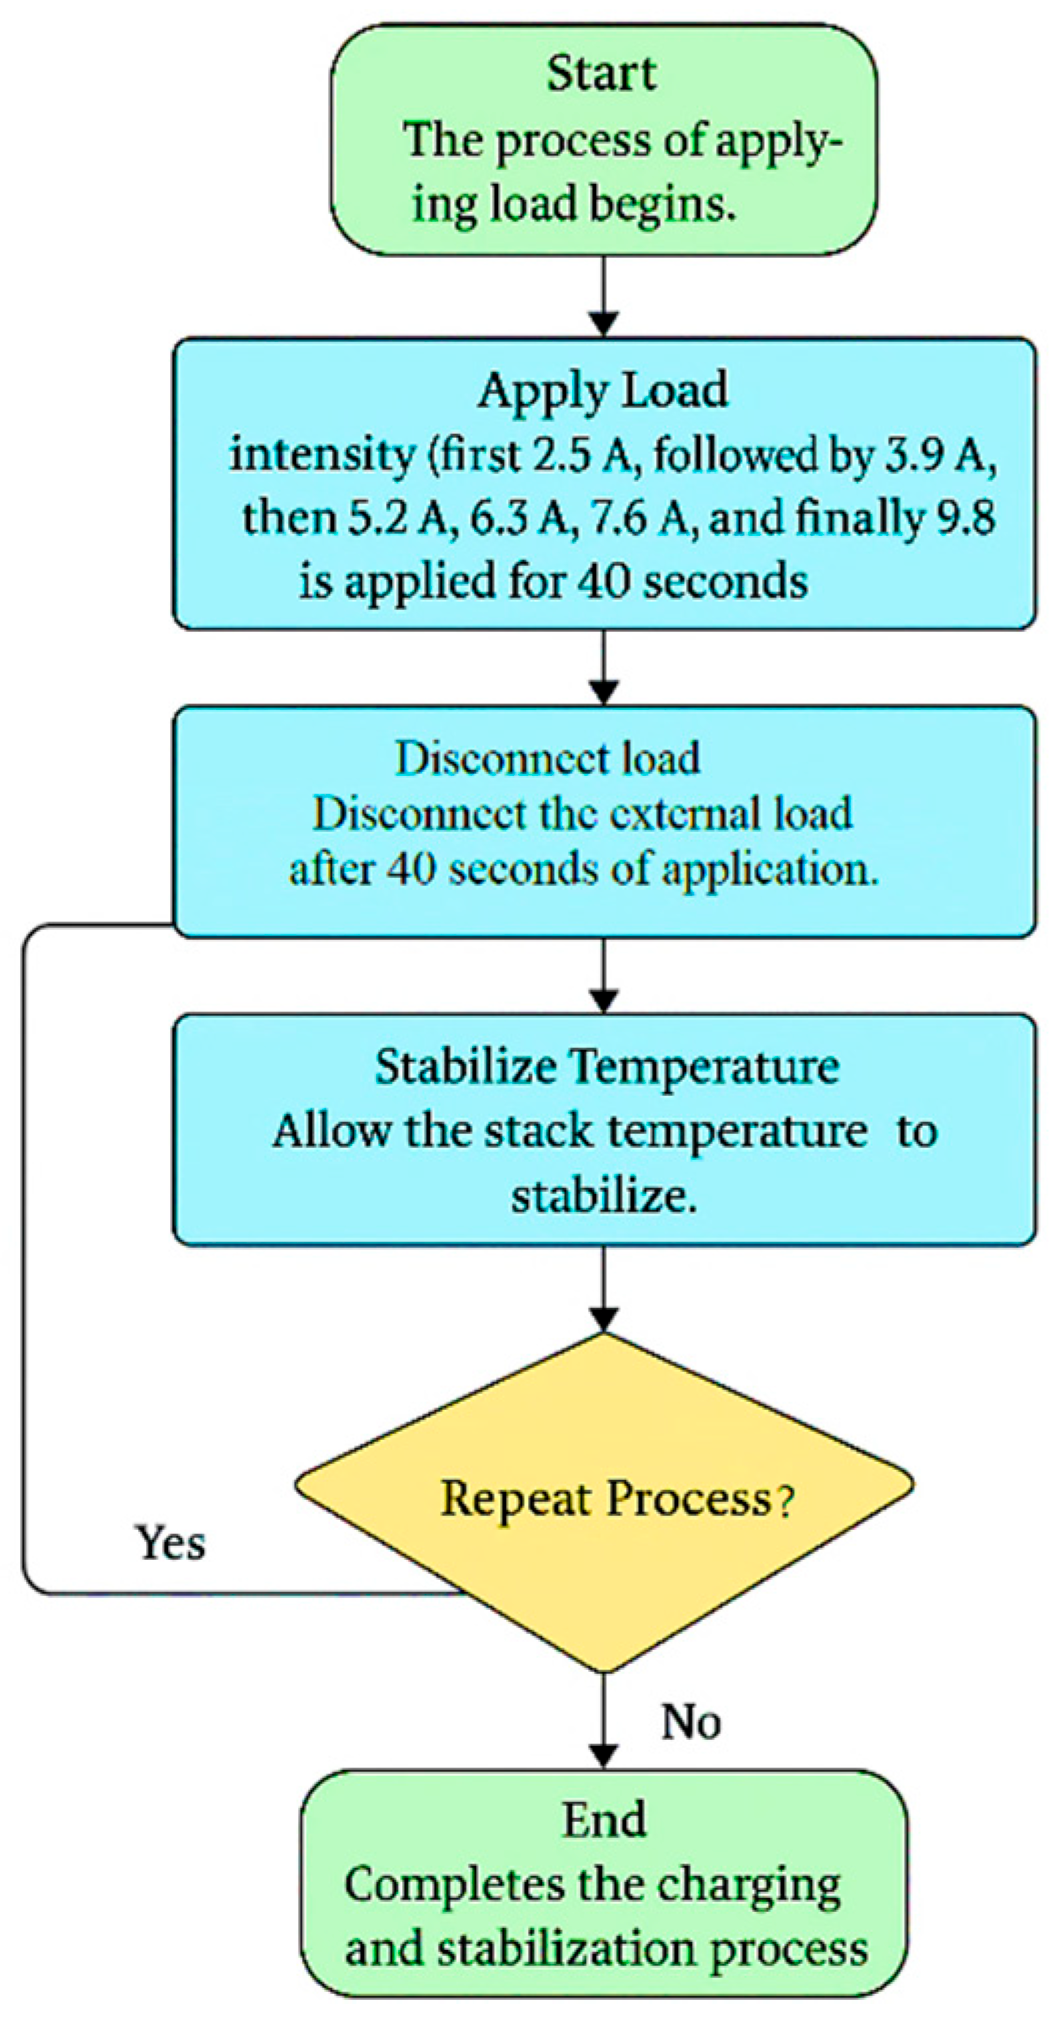
Steady-scale transient tests are designed to investigate the dynamics or behavior of the stack under different fixed-interval current pulses. These intervals are obtained by adjusting the external electronic load to intervals of 2.5 A, 3.9 A, 5.2 A, 6.3 A, 7.6 A, 8.6 A, and 9.8 A (Figure 4). Each load intensity level was applied for 40 s, after which the external load was disconnected to allow the stack to thermally stabilize before the next application. To evaluate the system’s transient response during continuous operation, variable load steps ranging from 0 to 20 A were applied, with no interruptions between load levels. This continuous experimental strategy made it possible to analyze the dynamic behavior of the stack under abrupt current transitions, emulating real-life operating conditions under fluctuating electrical demands.

4.3. Transient Response of Stack Voltage and Current During the Stack Startup and Shutdown Sequence

Tests conducted under controlled conditions evaluate the system’s transient response during startup and shutdown processes. The hydrogen supply pressure (cylinder controller) was set at 2.5 bar, and the ambient temperature at the start of the test was 25 °C. During the startup phase, a constant current of 5 A was applied until the stack reached thermal equilibrium, defined as a stable temperature condition.
During the tests, the stack status code was used, defined as: 0 = Standby, 1 = Startup, and 2 = Normal Operation (Running). This coding enabled the identification of transitions between the system’s different operating modes. To analyze the shutdown sequence, an external load of 20 A was applied for approximately 590 s, after which the load was removed, allowing observation of the voltage and current response dynamics during the shutdown and return-to-standby processes.

5. Results and Discussion

5.1. Transient Response of Stack Voltage and Current During the Stack Startup Sequence

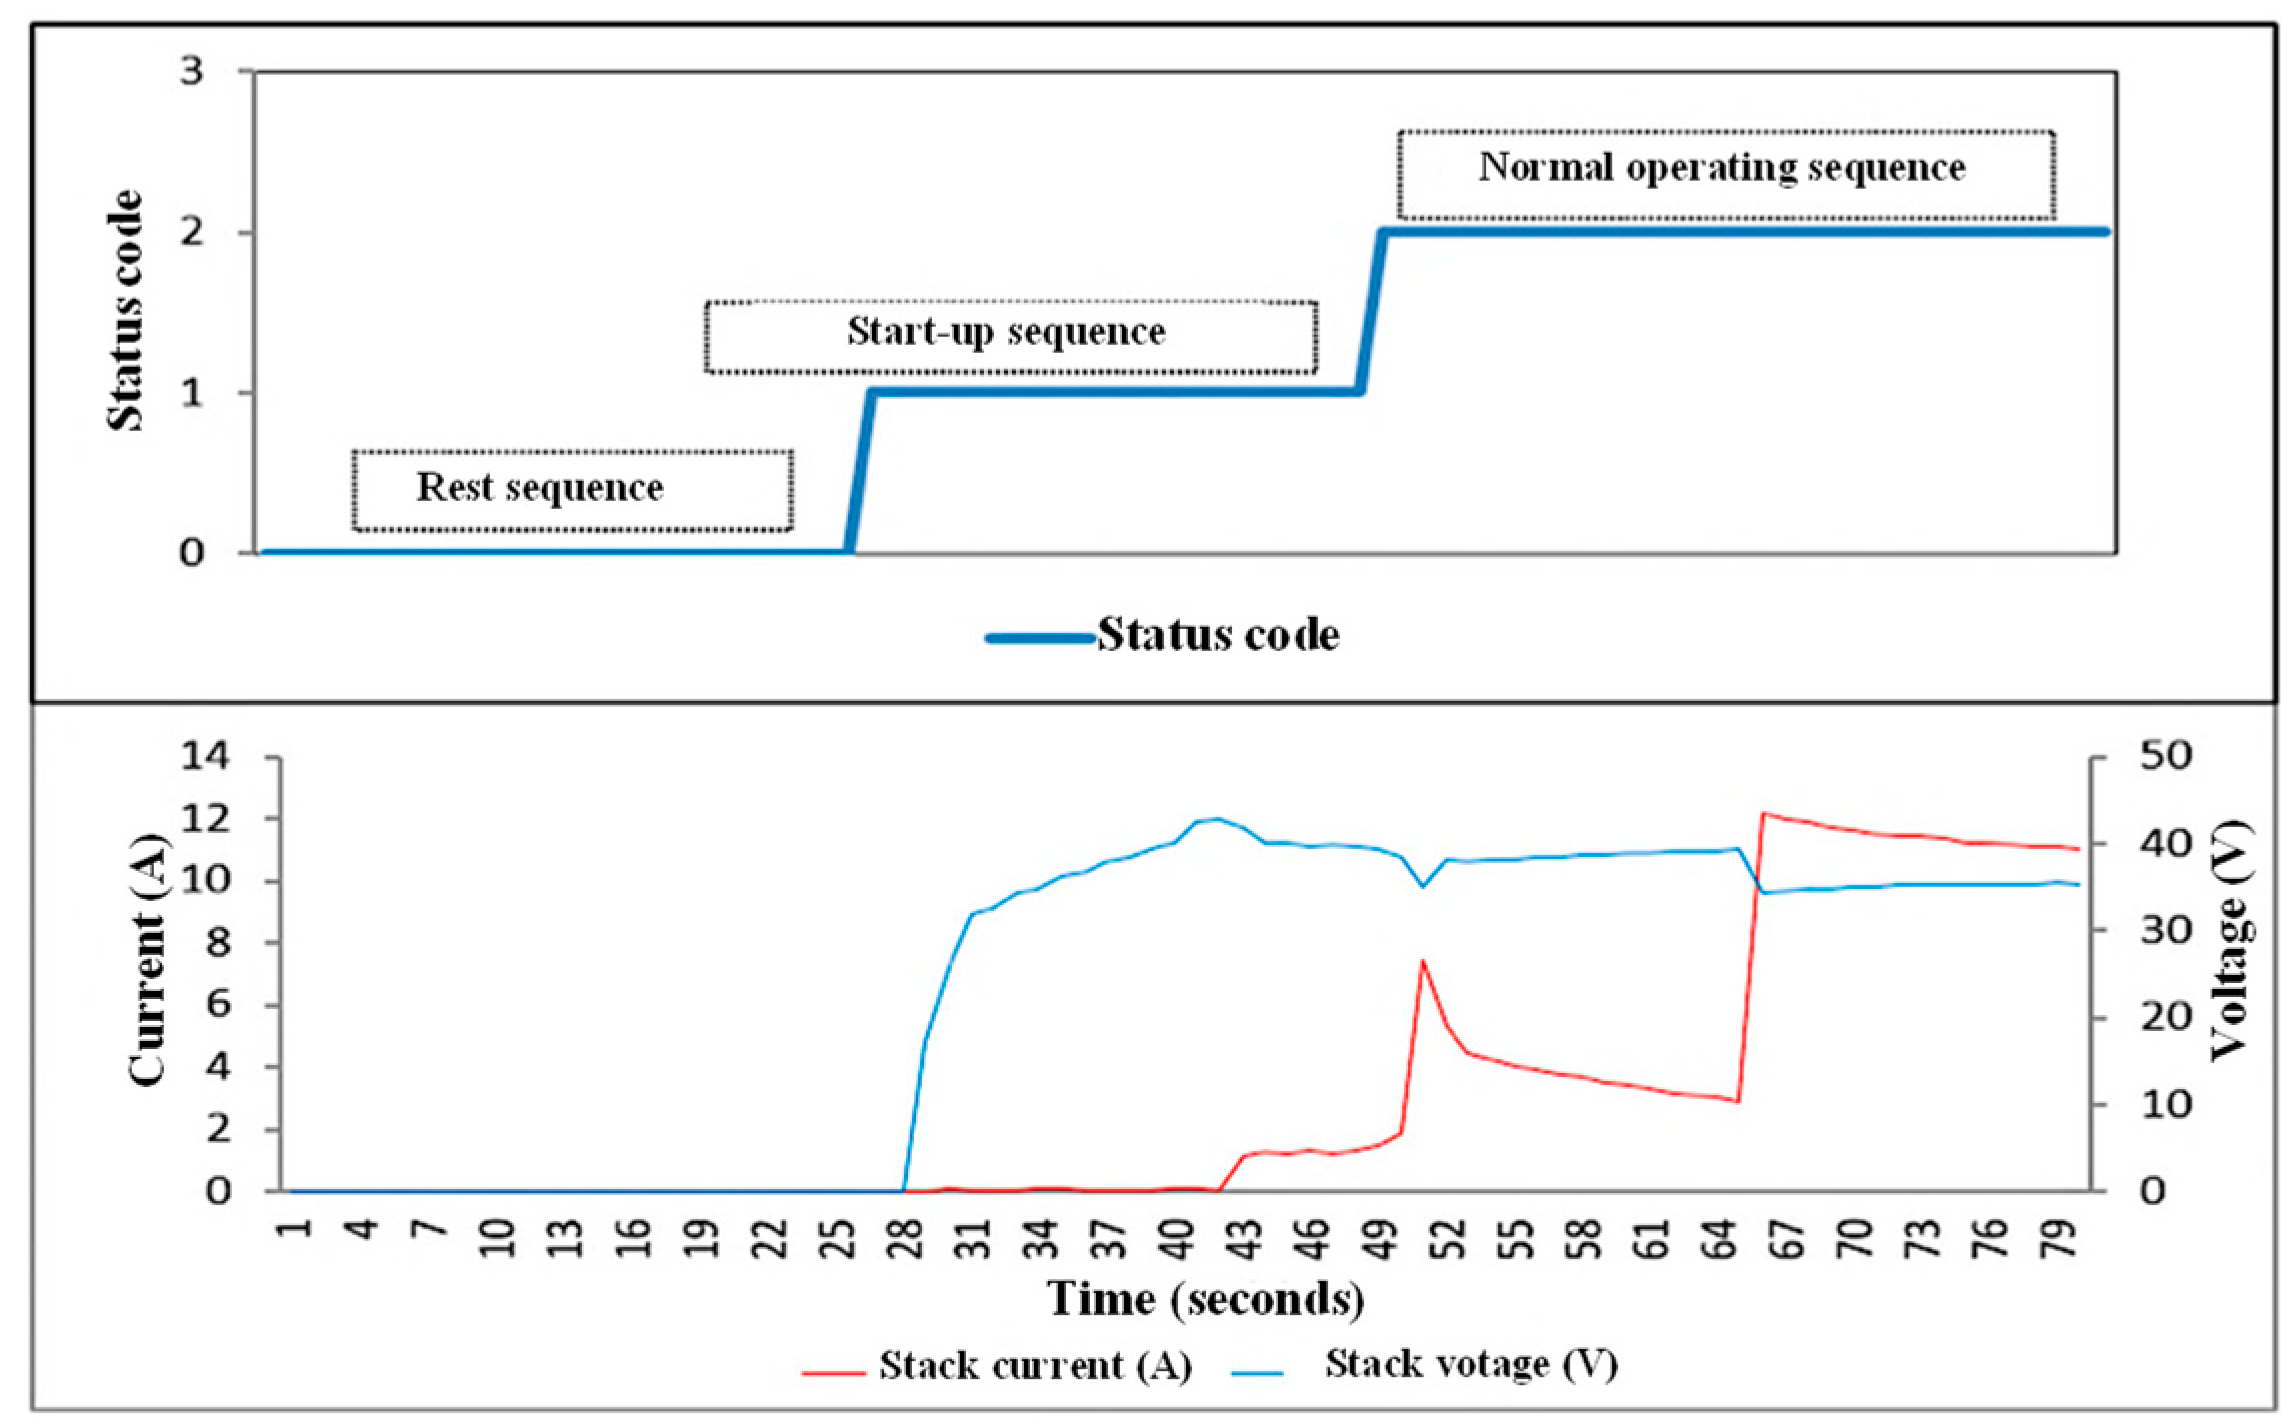
Figure 5 illustrates the transient behavior of current and voltage during the fuel cell system’s startup process, which lasts 79 s. This analysis provides a deeper understanding of the electrochemical activation dynamics and the internal processes involved in the transition from a quiescent state to a steady-state operating regime.
During the first 25 s, the system remains quiescent, with little electrochemical activity. Starting at second 25, the startup process begins. The voltage begins to increase 3 s into this sequence, suggesting stabilization of the cell’s internal conditions, including the establishment of concentration gradients and the maintenance of adequate internal temperatures. The voltage reaches the open-circuit voltage (OCV), approximately 43 V, at second 13. This behavior indicates that the cell has reached baseline operating conditions without any charging demand yet. Subsequently, at second 15, a current of 1.34 A is recorded, which can be interpreted as an initial stage in which the energy generated by the battery begins to be used by the auxiliary systems responsible for regulating the physical and chemical conditions necessary for the system’s operation, such as temperature control, gas supply, and membrane humidification. Finally, starting at second 65, an external load is applied that induces a sharp increase in the current demand, which rapidly rises until it stabilizes at approximately 12 A. This change is accompanied by a drop in the output voltage to around 35 V, typical behavior in electrochemical systems due to the internal resistance of the battery and the transient effects associated with reagent consumption. The controlled voltage drop, together with stabilized current, indicates that the system responds adequately to a sudden transition to real operating conditions, demonstrating adequate capacity for dynamic load management.
These results identify the different functional states during startup: idle, unloaded activation, preload, and loaded operation. This characterization is essential for designing safe and efficient startup strategies, as well as for avoiding early degradation due to abrupt load fluctuations or uncontrolled humidification conditions.

5.2. Transient Voltage Response of 47 Cells in the Startup Sequence

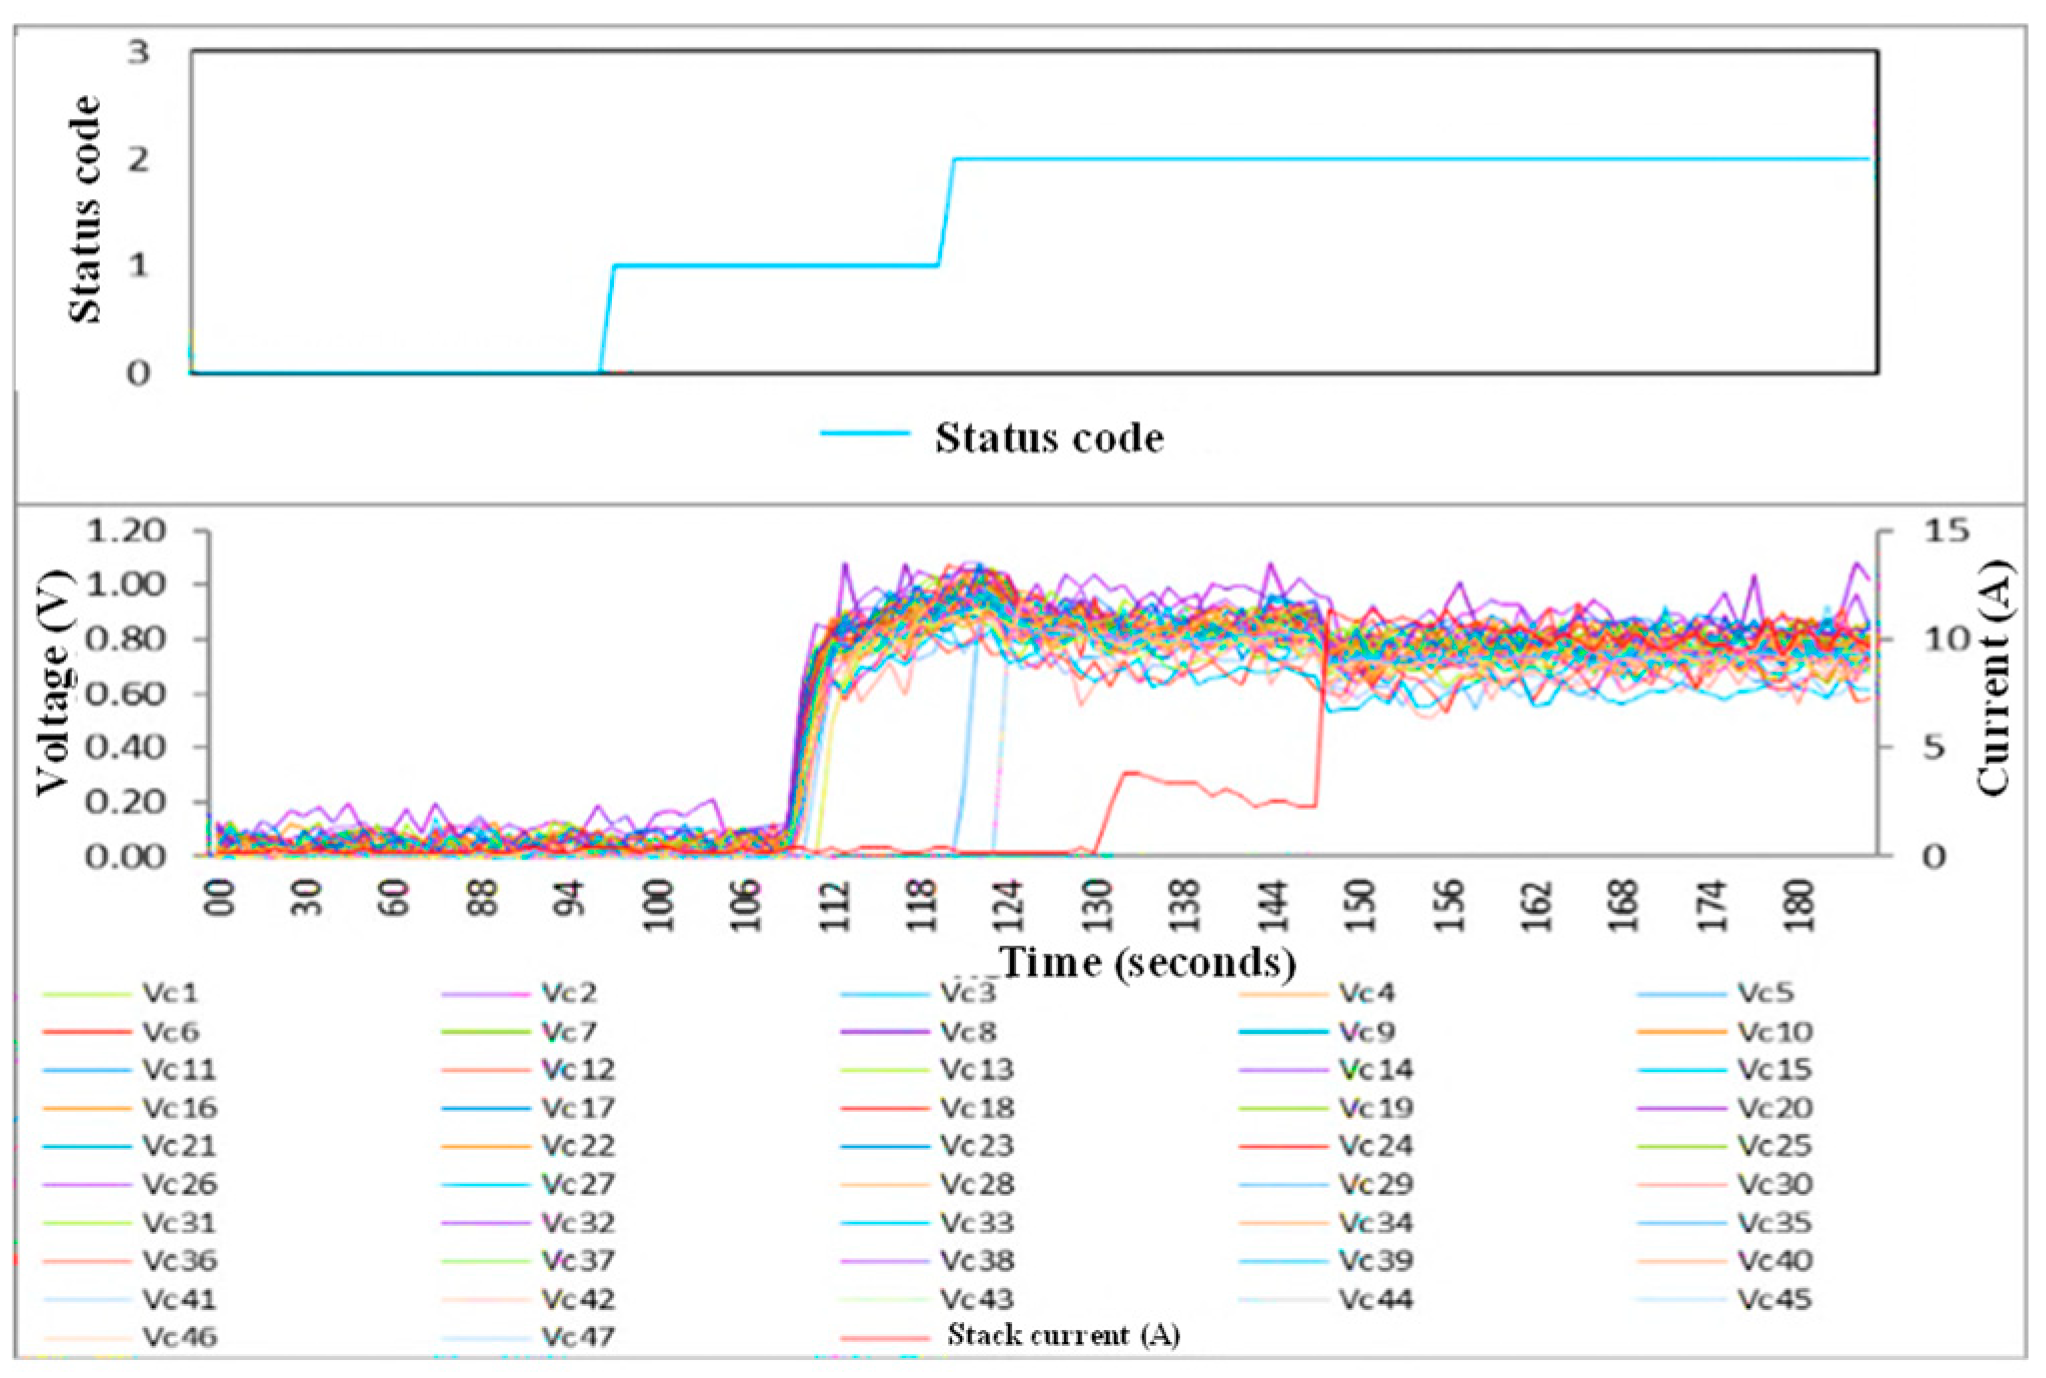
Figure 6 presents the transient behavior of current and voltage at the individual-cell level during a 184 s startup cycle, revealing dynamics virtually identical to those observed in the analysis of the entire stack. This parallelism in the activation profiles confirms that the fundamental processes governing the fuel cell system’s initial response are consistent at both the array and single-cell levels.
After an initial 96 s rest phase, the system enters its startup phase. Eleven seconds into this new phase, the voltage across the cells begins to increase, reaching an open-circuit voltage (OCV) of approximately 1.02 V at 13 s. This behavior, identical to that observed in the stack, occurs upon establishing optimal internal electrochemical conditions in the absence of load and reflects the stabilization of potentials in each cell as a result of progressive humidification, temperature control, and reactant distribution.
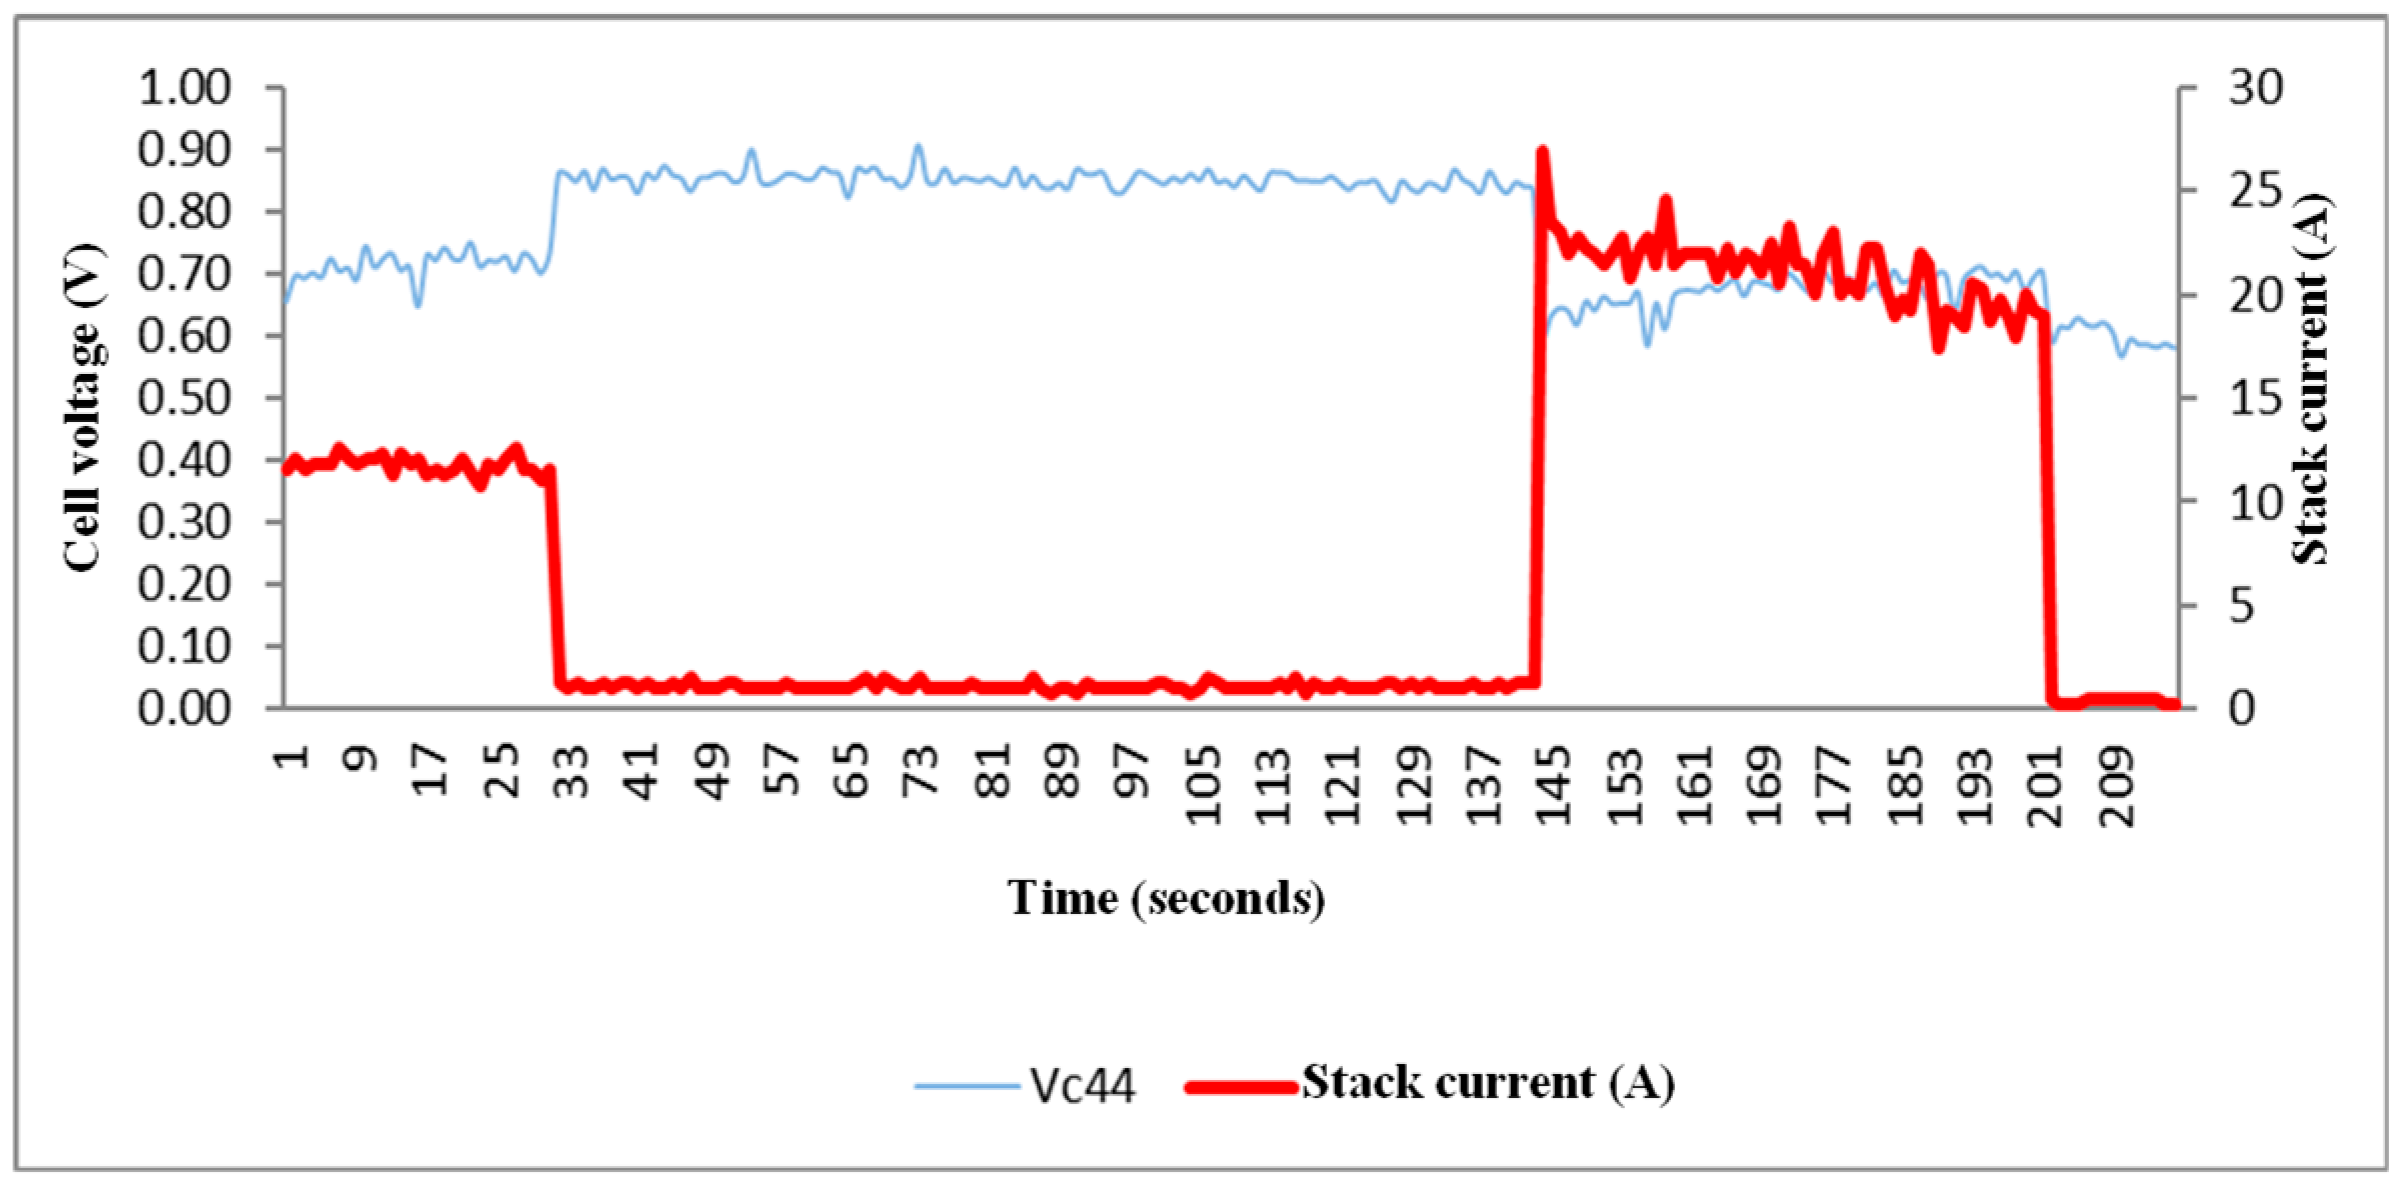
Subsequently, at second 18, a current of 3.8 A is detected, indicating a transition phase toward active operating conditions. This stage was also observed in the stack, where a preliminary current was anticipated during the application of a real load associated with the auxiliary systems. Finally, at 148 s, an external load is applied, causing a rapid transition to a steady-state operating regime. The current increases sharply, then stabilizes at approximately 10 A, while the cell voltage drops to approximately 735 mV. This behavior is entirely consistent with that observed at the stack level, where a controlled voltage drop (below the OCV) reflects the balance between load demand, each cell’s internal resistance, and the system efficiency under real load.

5.3. Transient Voltage and Current Response During the Battery Shutdown Sequence

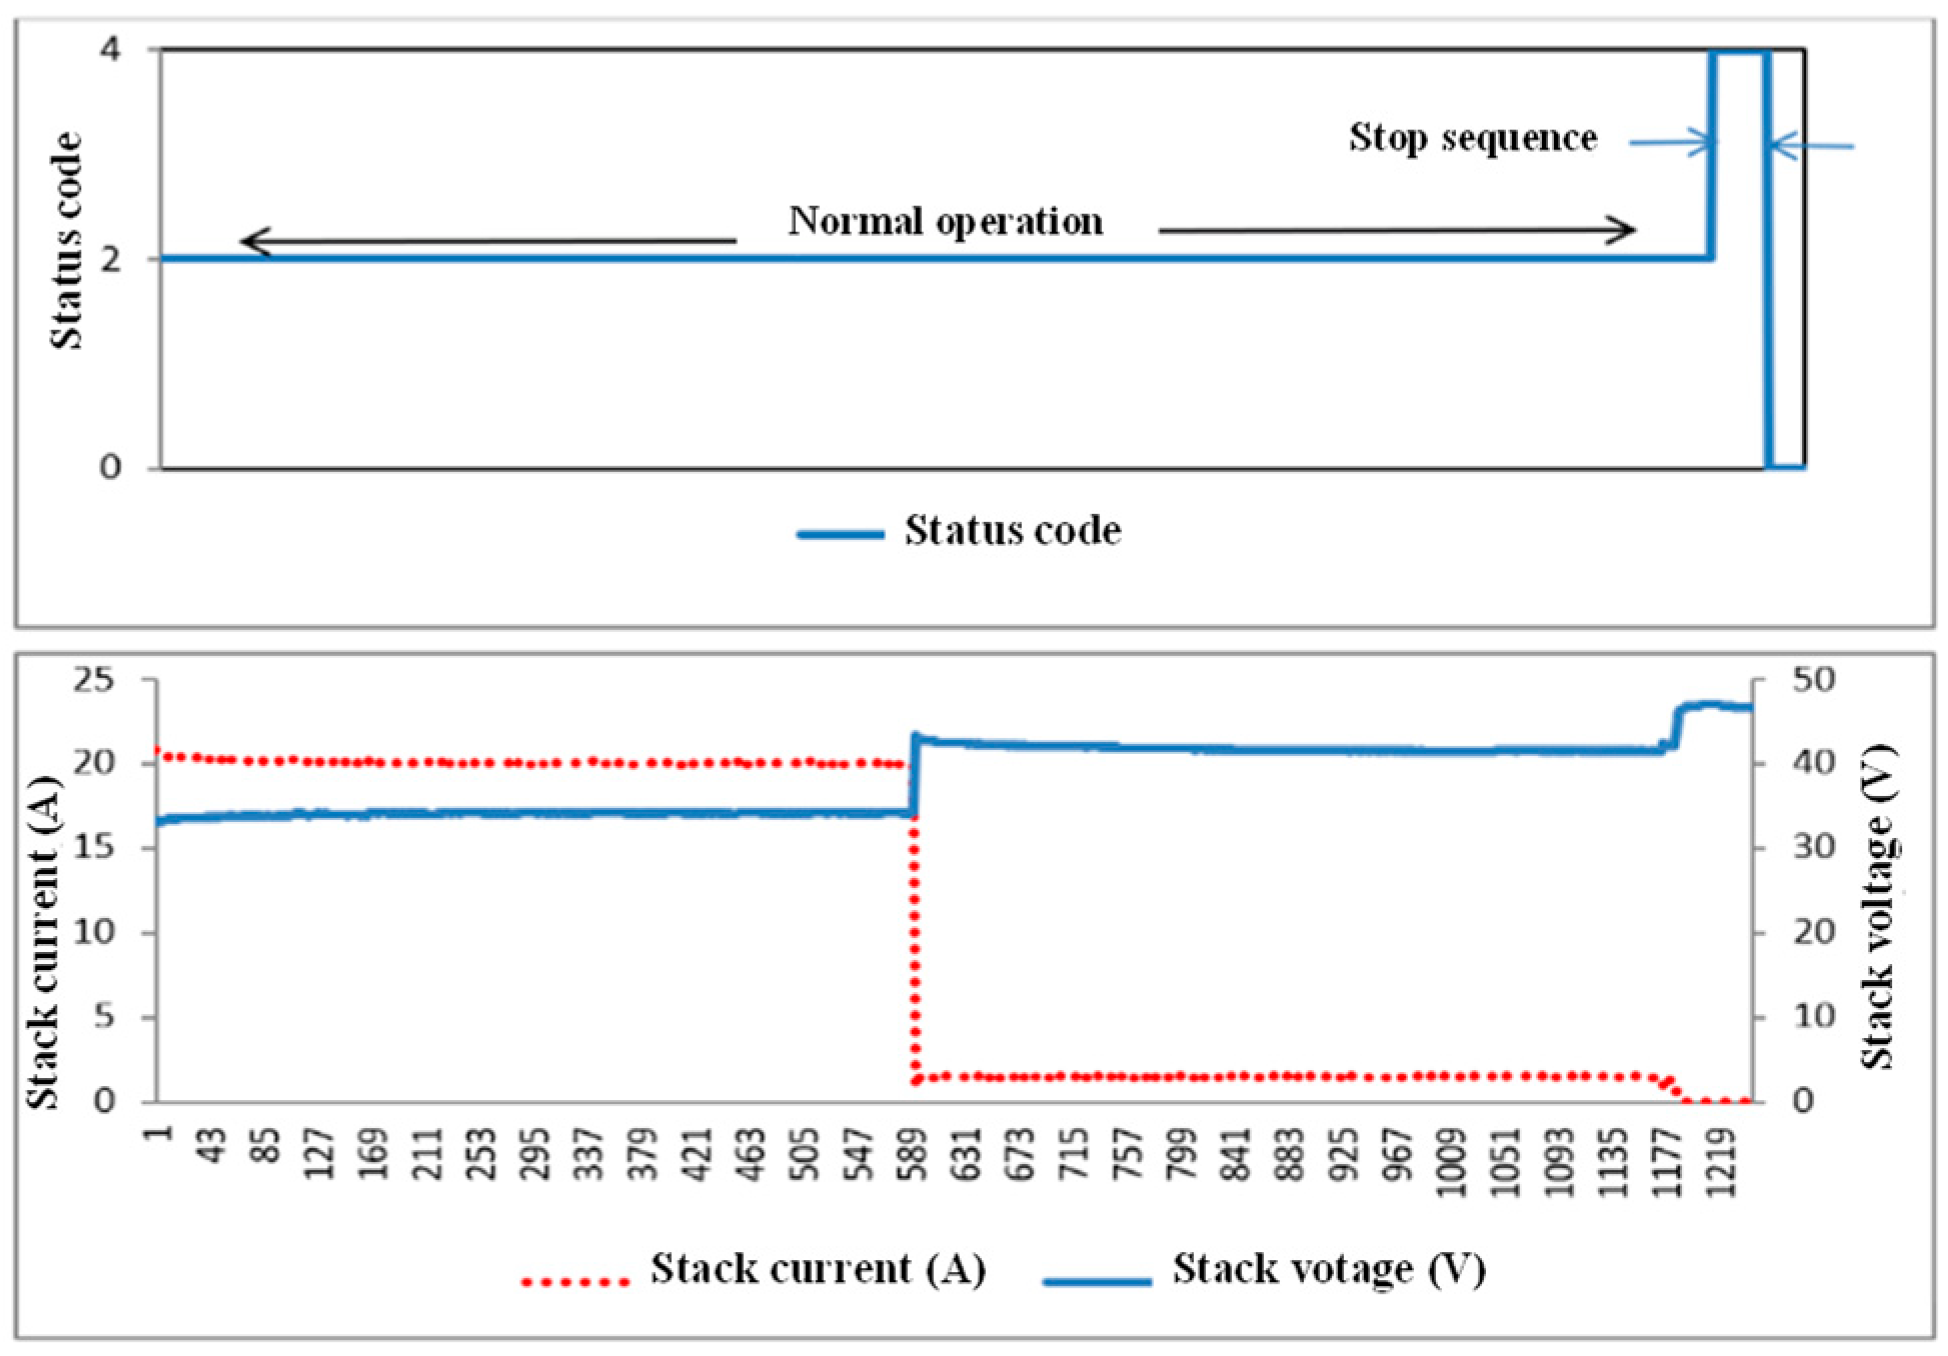
Figure 7 illustrates the dynamic behavior of the fuel cell system during the shutdown sequence. Initially, a constant external load of 20 A is maintained for approximately 590 s, after which the load is abruptly removed. This change induces a progressive increase in the output voltage, which stabilizes around 43 V, reflecting an open-circuit operating state under relative quiescent conditions. Subsequently, when the system shutdown button is manually activated at second 1177, a further increase in voltage is observed, reaching a maximum value close to 47 V. This response can be attributed to the interruption of the current demand and the recovery of the open-circuit potential, combined with possible transient effects related to the thermal and electrochemical inertia of the system. The shutdown sequence itself lasts approximately 50 s, after which the cell enters a complete quiescent state, indicated by the system falling to a condition of no electrical activity (sequence 0). This behavior highlights the need for controlled shutdown management, not only to avoid unwanted transients but also to ensure safe discharge and protect the integrity of the system’s electrochemical and auxiliary components.

5.4. Transient Voltage Response of 47 Cells in the Shutdown Sequence

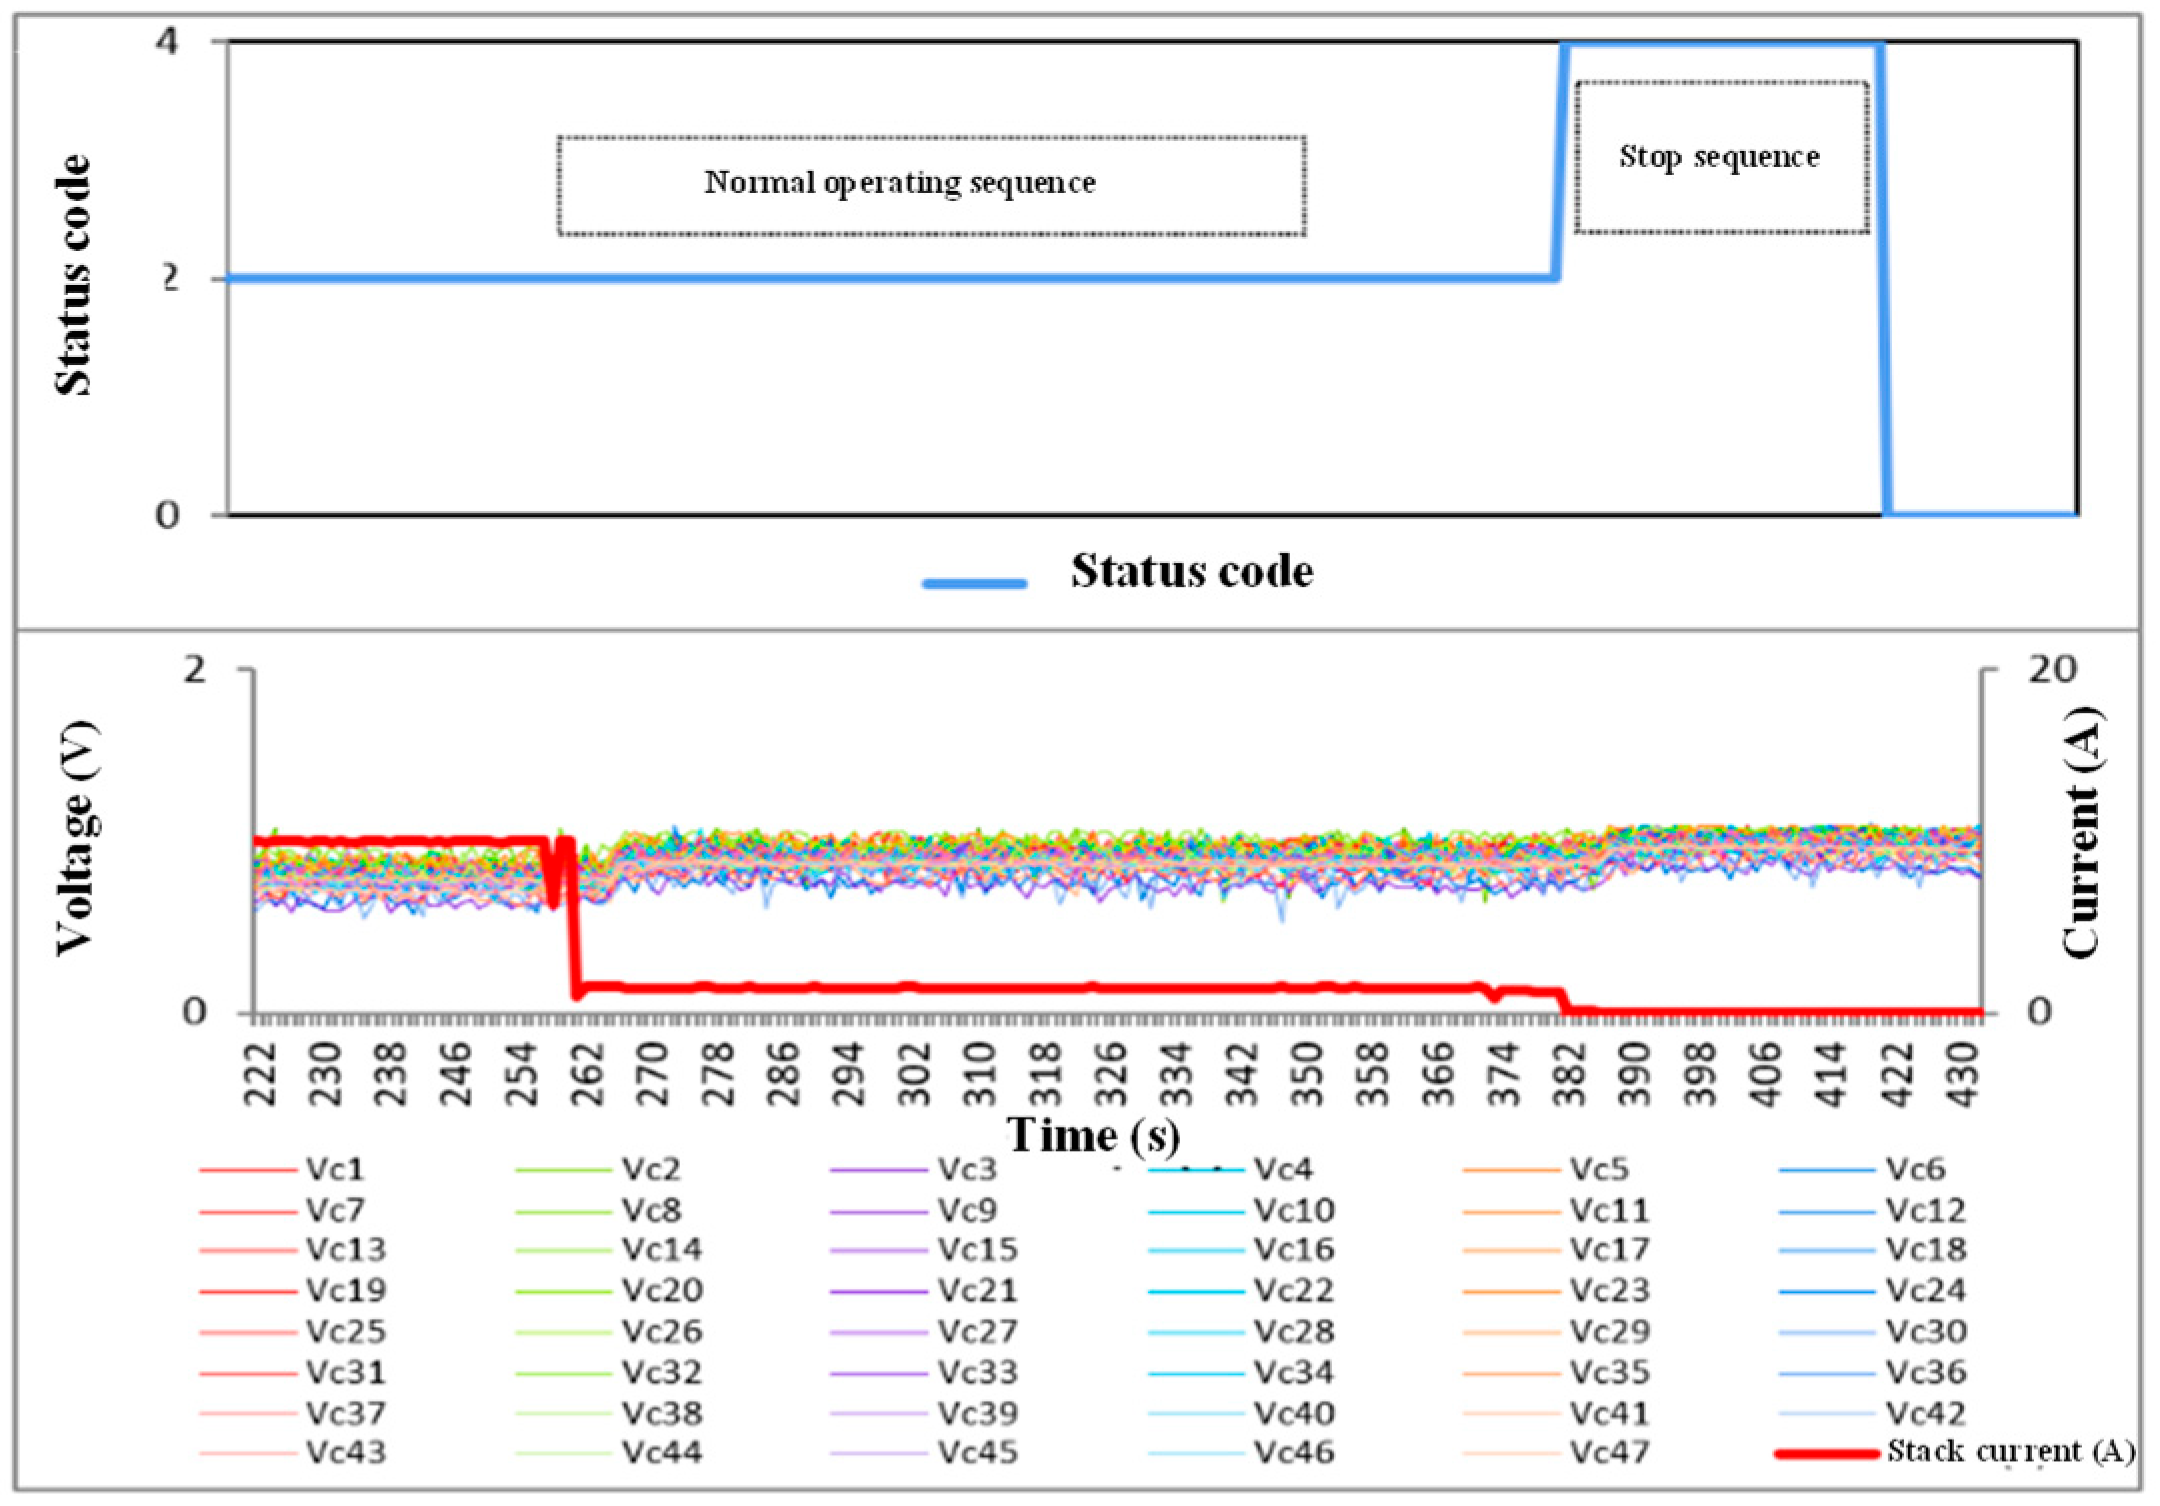
Figure 8 shows the individual voltage behavior of the 47 cells comprising the fuel cell stack during the shutdown sequence. Initially, a 10 A load is applied for approximately 40 s, representing an active operating condition under external demand. When the load is removed, the voltage of all cells increases rapidly until it stabilizes near 1 V, reflecting the return to an open-circuit condition. This behavior is characteristic of the transition from a power generation phase to a relative standby phase, where energy consumption by auxiliary systems is reduced to practically zero.
The uniformity of the cell response suggests good stack performance homogeneity, with no significant variation between individual cells. At 160 s, the system shutdown command is activated, which produces a further voltage increase in all cells, reaching a value close to 1.09 V. This increase can be explained by the definitive disconnection of the charge control systems and a temporary recomposition of the internal electrochemical conditions, such as the redistribution of species or the progressive cooling of the cell. Finally, the shutdown sequence lasts 40 s, after which state zero, associated with sleep mode, is reached. This stage is critical to ensuring operational safety and avoiding electrochemical stress on components, so careful shutdown management contributes significantly to prolonging the system’s useful life and improving the stability of its transient responses.

5.5. Transient Response of the Stack Voltage to Variations in Charging Current

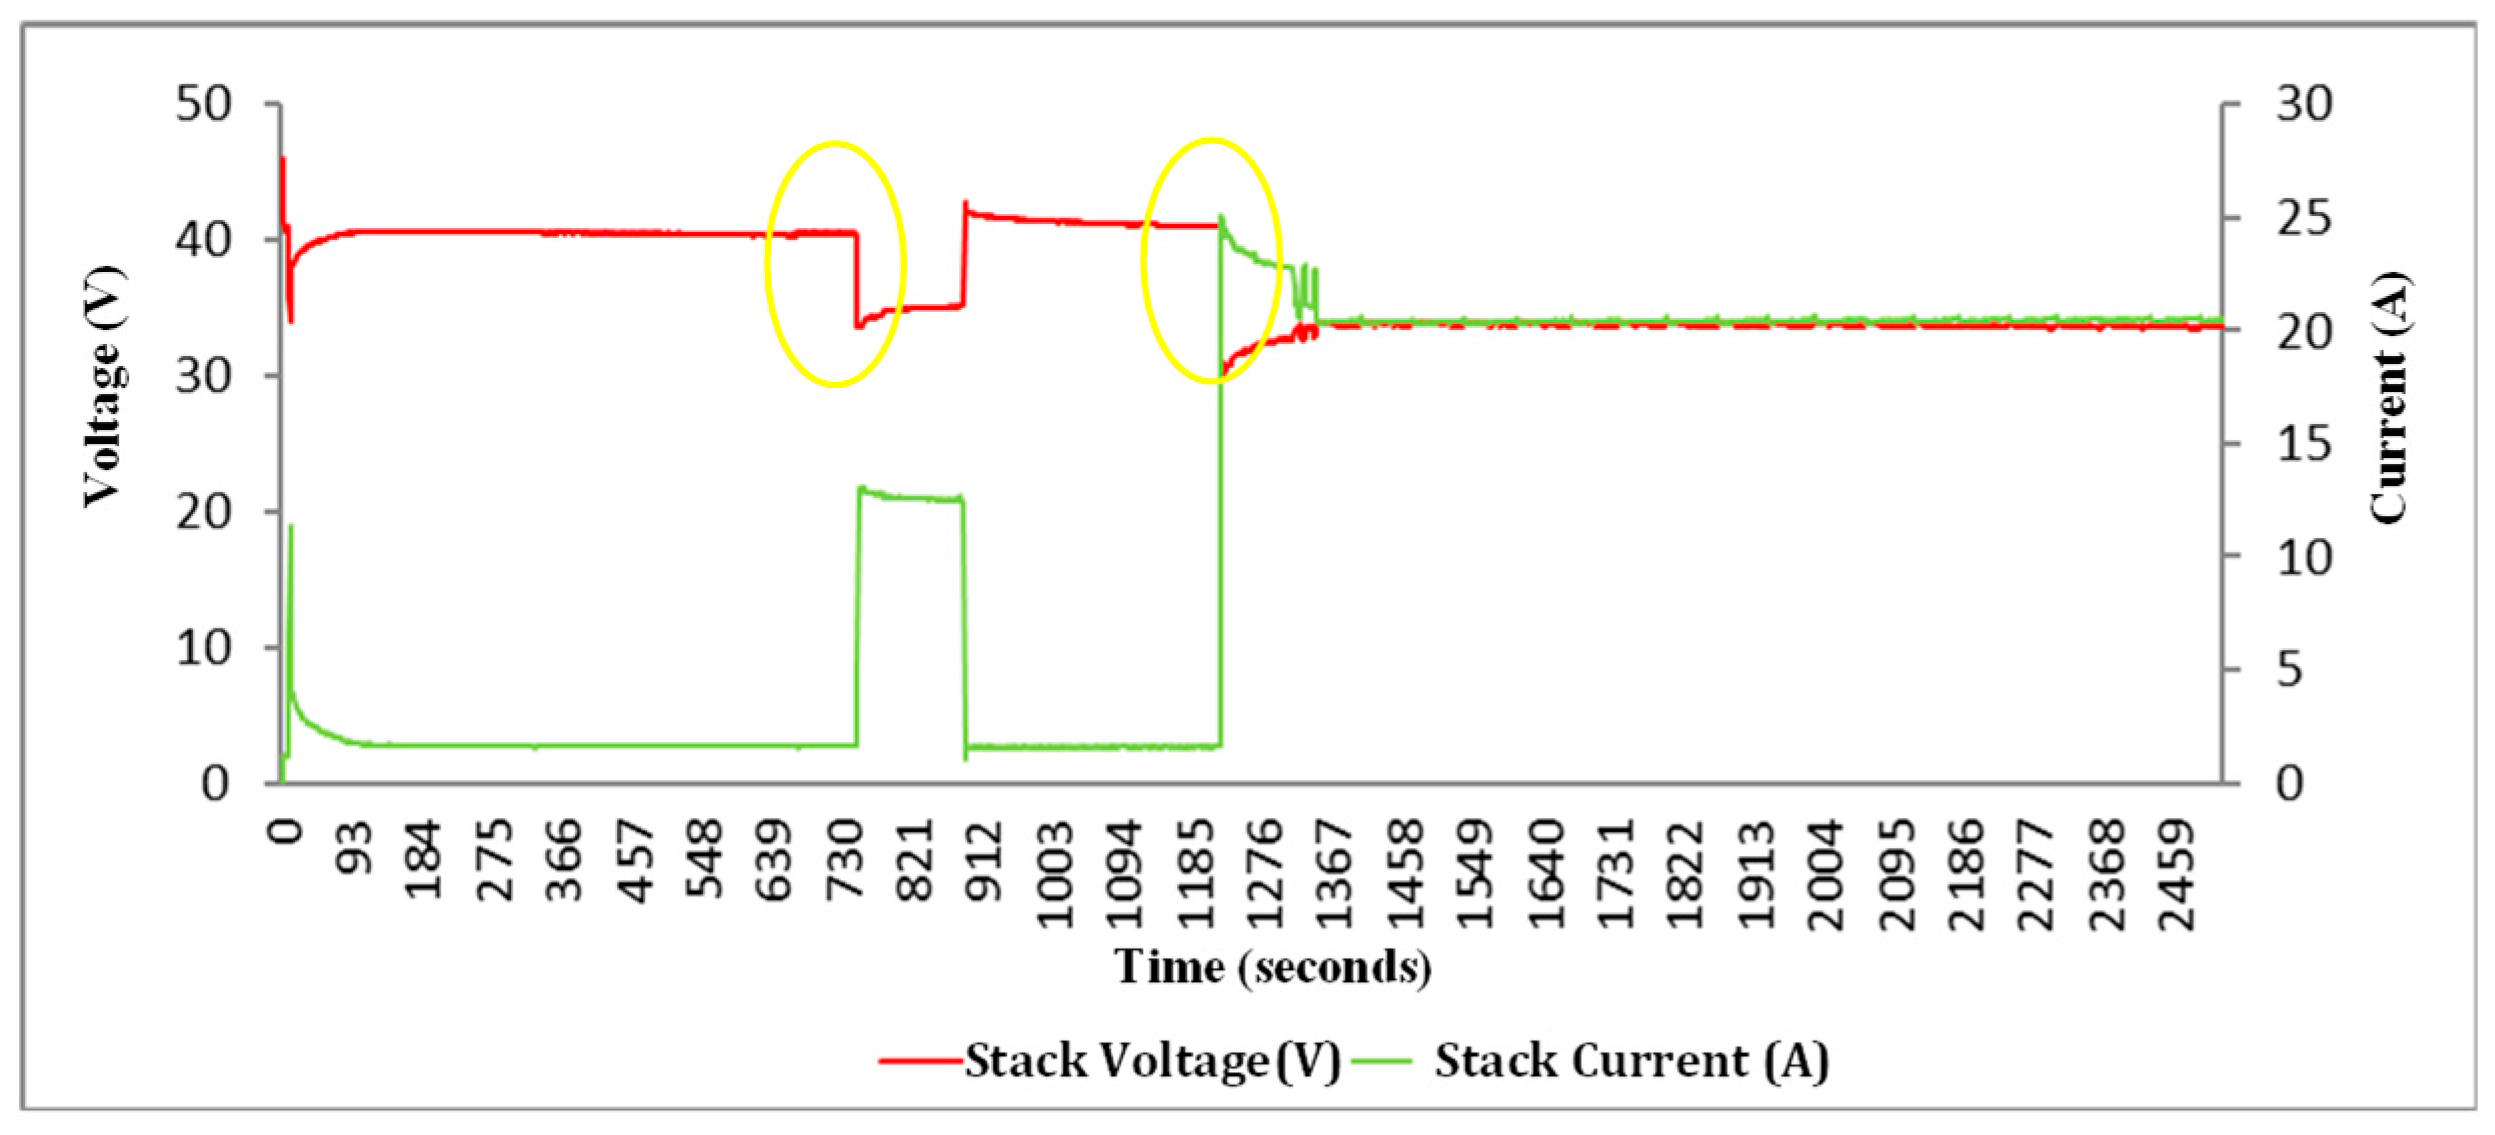
Figure 9 presents the dynamic response of the system voltage following the application of two external load steps of 12.5 A and 22.5 A. At each transition, the voltage signal displays a transient spike or dip, reflecting the system’s immediate response to abrupt changes in current demand. These transients result from temporary limitations in the physicochemical processes within fuel cells. Specifically, the rates of electrochemical reactions and the transport of species such as hydrogen, oxygen, and water become temporarily misaligned with the new load conditions. This effect is particularly significant in flow channels and gas diffusion layers, where reactant concentration and velocity profiles require a brief period to adjust after a load change.
Furthermore, this transient behavior can be explained by the presence of double-layer capacitances [51,52,53] at the electrode-electrolyte interface.
These capacitances arise from the accumulation of electrical charges on the contact surfaces, generating electrical potentials that respond with temporal inertia to changes in charge. The charging and discharging dynamics of these capacitive layers significantly shape the observed voltage pulse.
Together, these results highlight the importance of considering both mass transport phenomena and internal capacitive effects when modeling and controlling the transient response of PEM fuel cells, especially under dynamic loading conditions.
Stack current most directly affects the mass-transport phenomena that determine access to new operating regimes (as demonstrated by increasing the load steps) in a hydrogen fuel cell, as it is directly related to the reactant consumption rate. As the current increases, the rate of electrochemical reactions increases, resulting in greater consumption of hydrogen at the anode and oxygen at the cathode.

5.6. Transient Response of Cell Voltage to Load Current Variations

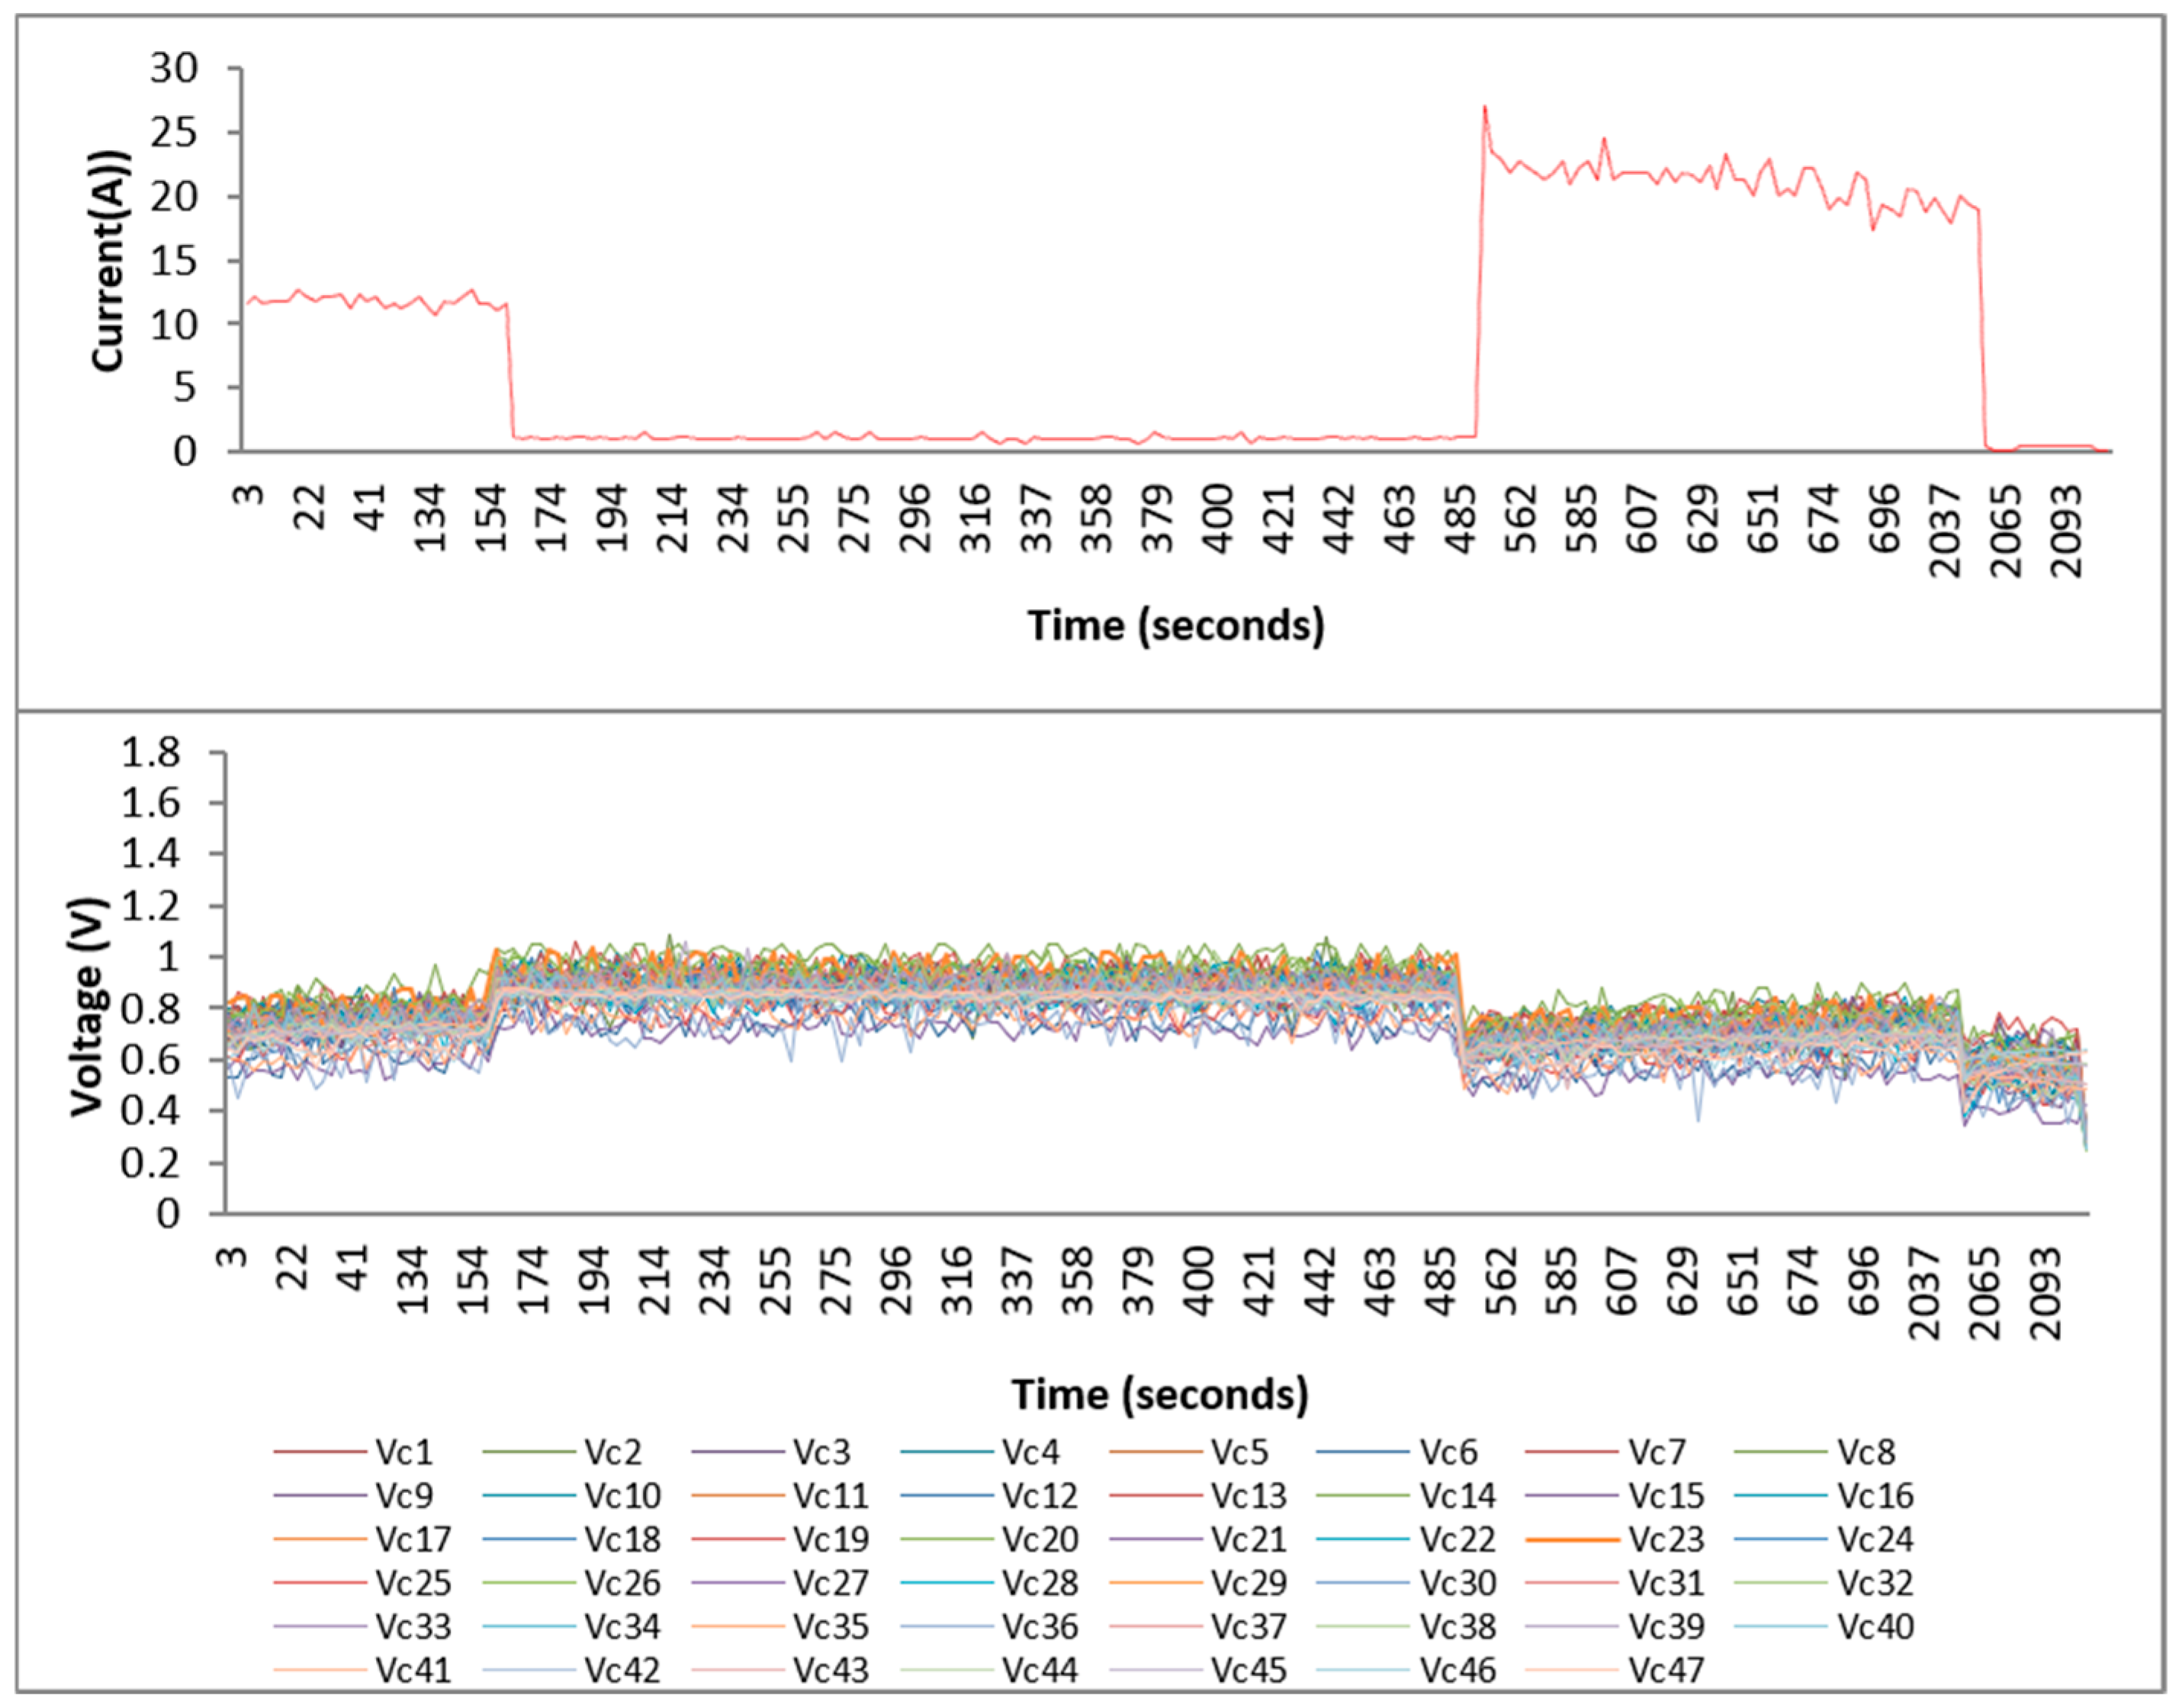
Figure 10 shows the time evolution of the individual voltages in the 47 cells of the stack after applying two external load steps, of 10 A and 20 A, respectively. It is observed that, after each step, the voltages of all cells respond quickly and immediately to the increase in current demand, then stabilize towards a new operating regime. This behavior indicates good uniformity in the stack’s dynamic response, suggesting a homogeneous distribution of reactants, temperature, and operating conditions across the cells.
The initial transient response is characterized by an instantaneous voltage drop, attributable to the abrupt current demand and the inertia of the electrochemical and transport processes. Subsequently, the system reaches a steady state, in which the voltages remain constant, indicating that the internal mechanisms for supplying hydrogen, oxygen, and humidification have adapted to the new loading conditions.
Furthermore, this rapid, synchronized response at the cell level is consistent with observations at the entire stack level (see Figure 7), confirming that the collective behavior of the assembly faithfully reflects the dynamics of its individual components. This type of analysis is essential for validating dynamic fuel cell models and for developing control strategies that ensure system stability and efficiency in real-world applications with variable load profiles.
Figure 11 clearly illustrates the proportional relationship between the magnitude of the applied current and the voltage drop observed in an individual cell in the stack. Upon applying an initial step of 12.5 A, the average cell voltage drops from 861 mV (no-load operating condition) to 138 mV. Subsequently, at a current of 20 A, the voltage drop increases to 260 mV, which is practically twice the initial reduction.
This behavior demonstrates a nearly linear voltage response to increasing current under dynamic conditions, which is consistent with the electrochemical theory of fuel cell operation. The internal resistance of the system, both ohmic and due to activation and concentration polarization, plays a key role in this relationship. As the current increases, overpotential losses increase, resulting in a proportional decrease in the observed voltage.

5.7. Transient Response of Stack Temperature to Charging Current Variations

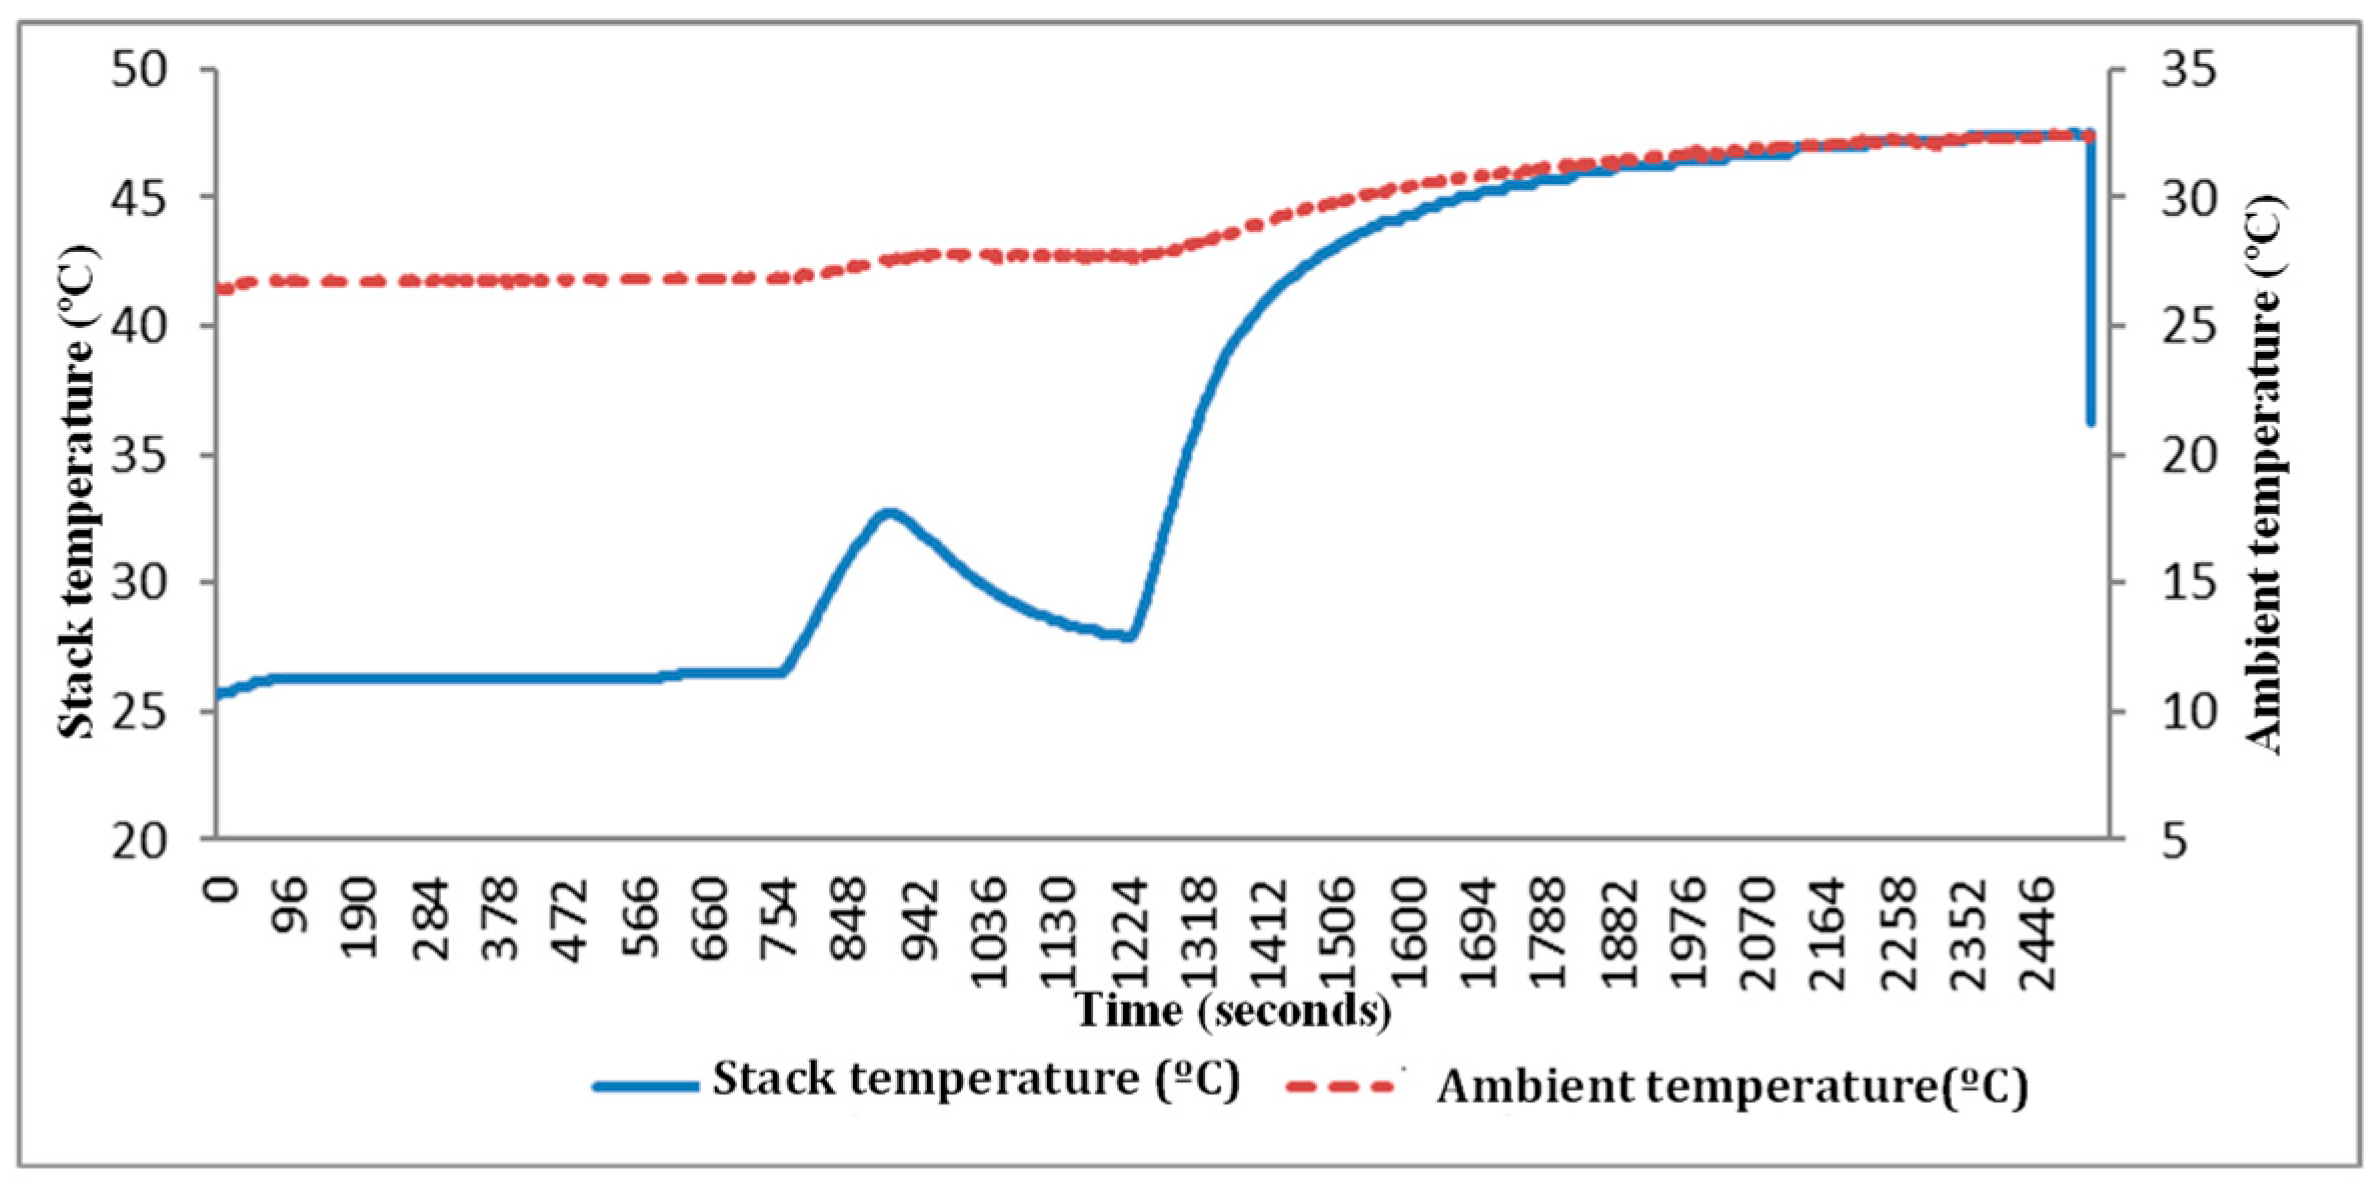
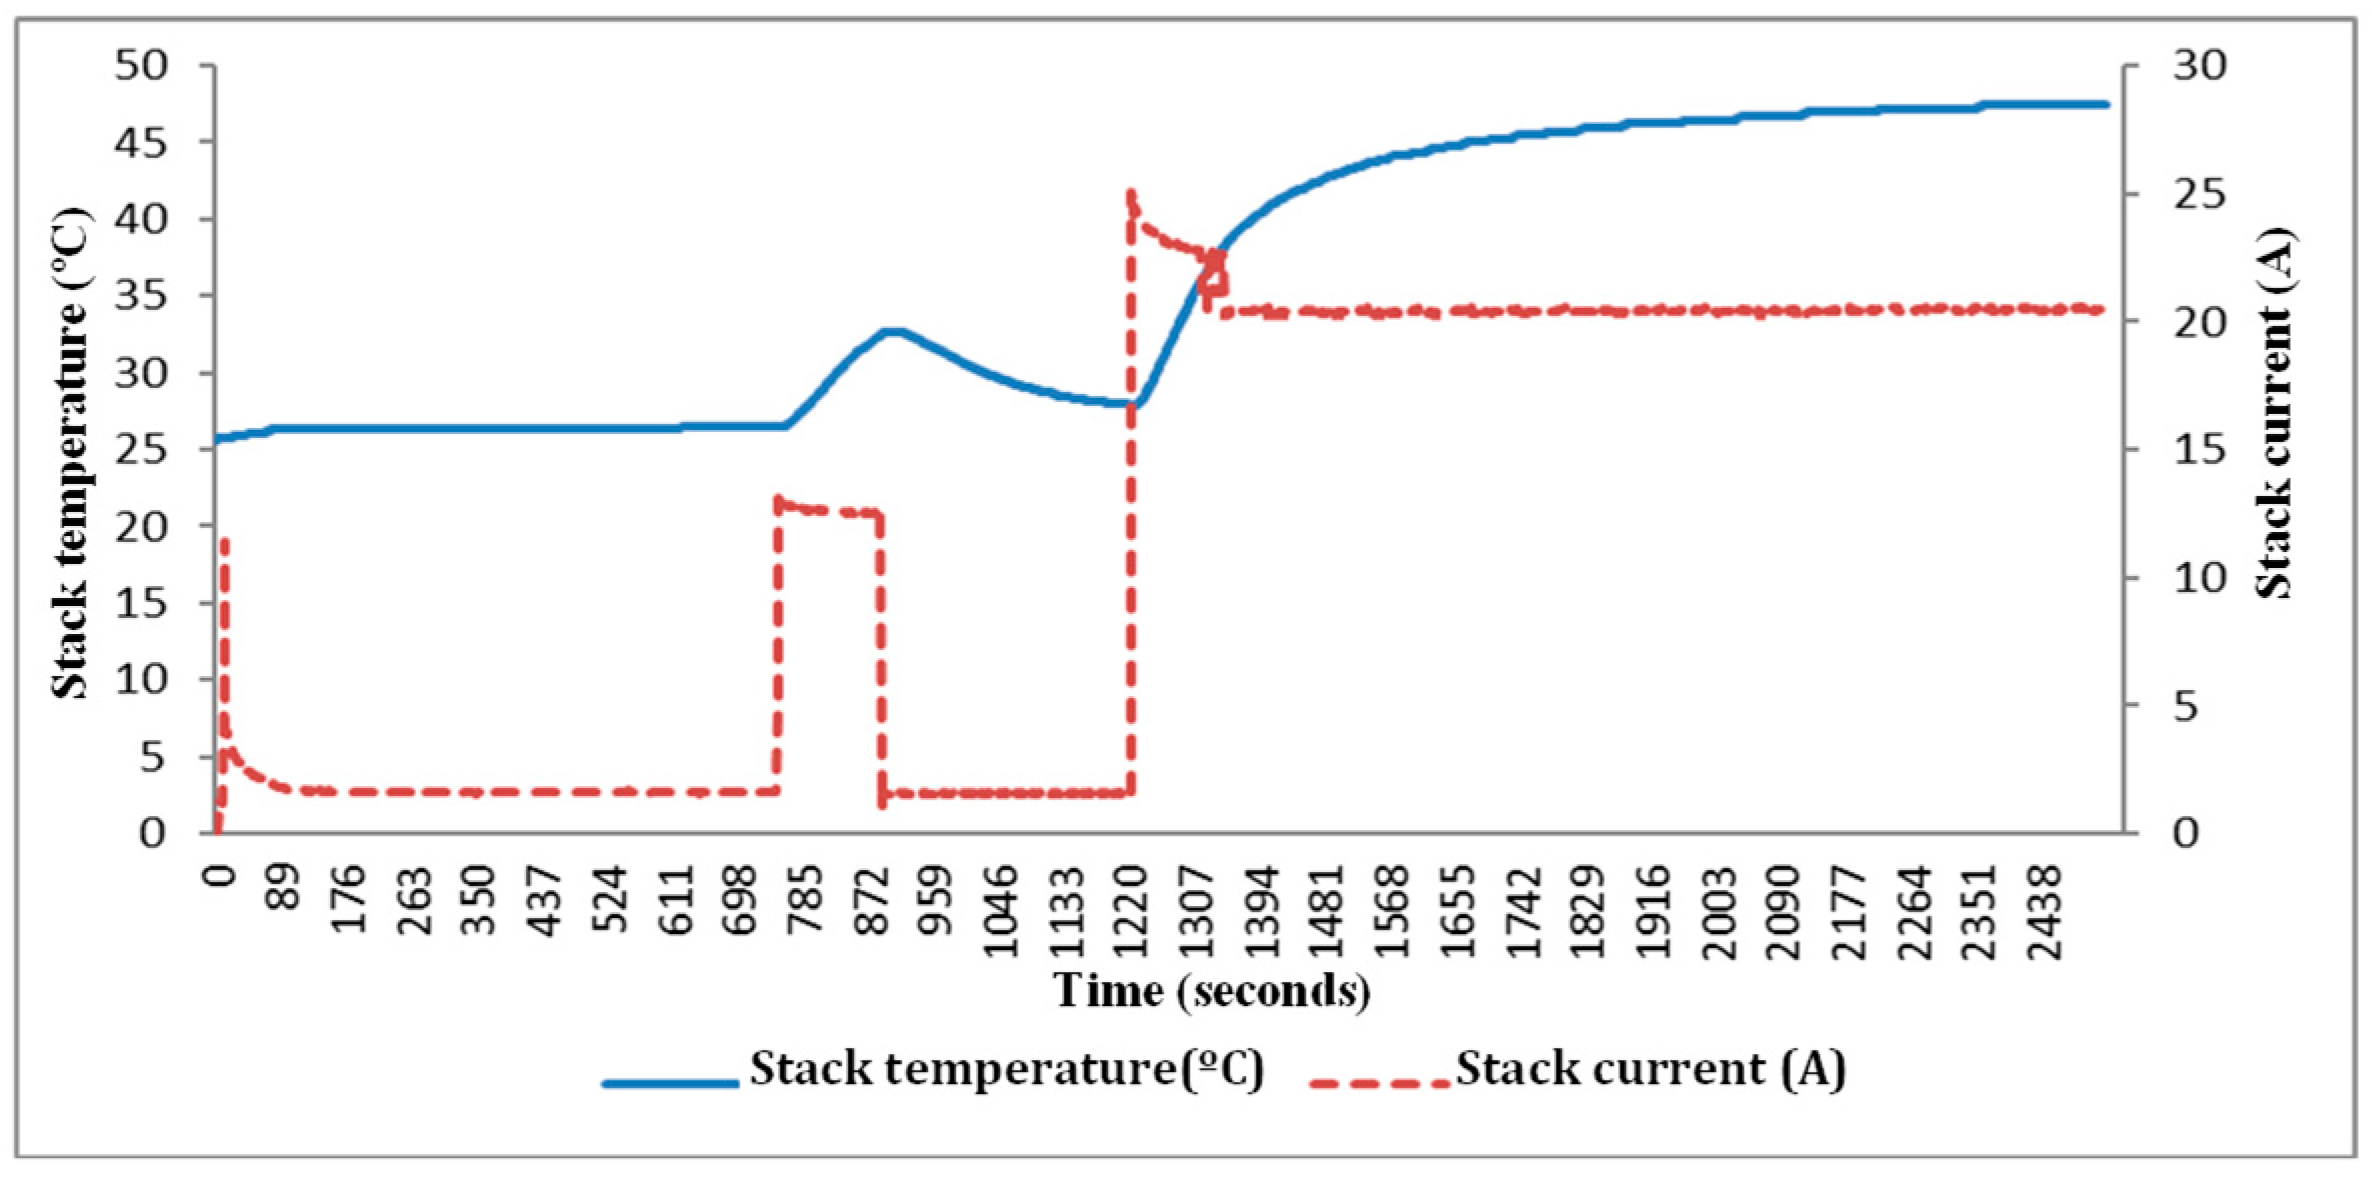
The application of 13 A and 23 A current steps increases the stack temperature, as shown in Figure 12 and Figure 13, for stack-specific temperature values and a test bench described in [50]. This thermal increase is associated with the increased energy demand imposed by the load. However, unlike the transient responses observed in electrical variables such as voltage and current, the temperature evolution does not exhibit abrupt peaks or significant transient fluctuations in response to such load changes. This behavior suggests greater thermal inertia of the system and a more stable response to rapid variations in current demand and load changes.

5.8. Stack Temperature Response to Load Steps (5 and 10 A)

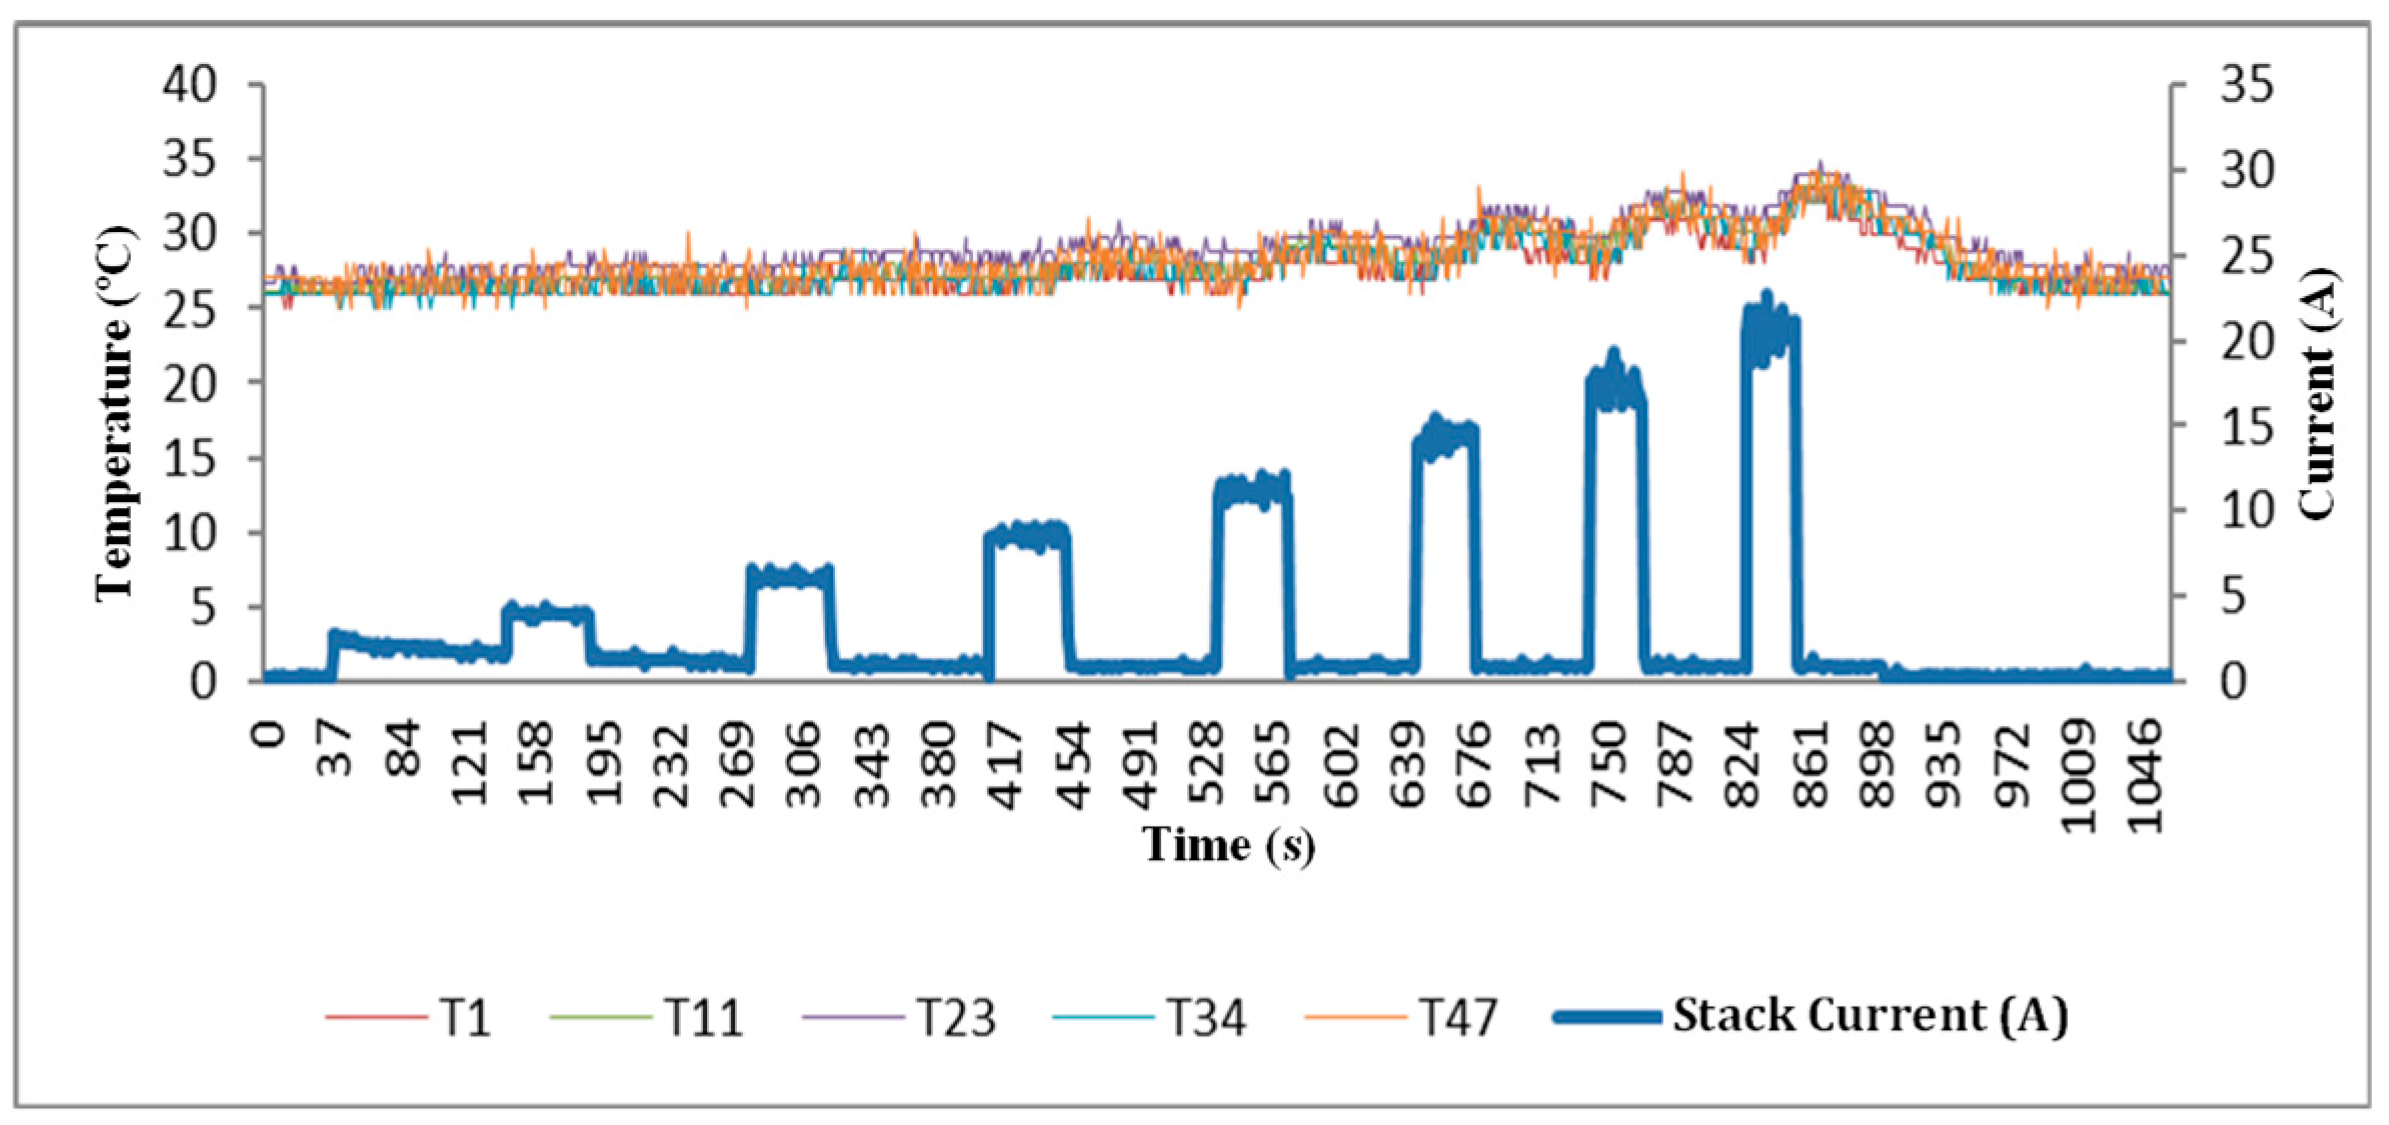
Figure 14 shows the temperature evolution in the cells in response to seven charging current steps: 1.5, 3, 4.5, 6, 7.5, 9, and 10.5 amps. A proportional and attenuated thermal response is observed, without extreme oscillations, in contrast to the voltage behavior, which responds more abruptly to current increases. This moderate thermal response can be attributed to the progressive increase in internal electrochemical reactions required to meet the power demand, which in turn leads to a gradual rise in cell temperature. This thermal increase enhances the ionic conductivity of the polymer membranes, thereby enabling greater efficiency in current delivery. It is important to note that the total load managed by the fuel cell corresponds to both the external load imposed by the Prodigit electronic load and the demand from its auxiliary systems.

5.9. Transient Response of Stack and Cell Voltage to Step Load Increases

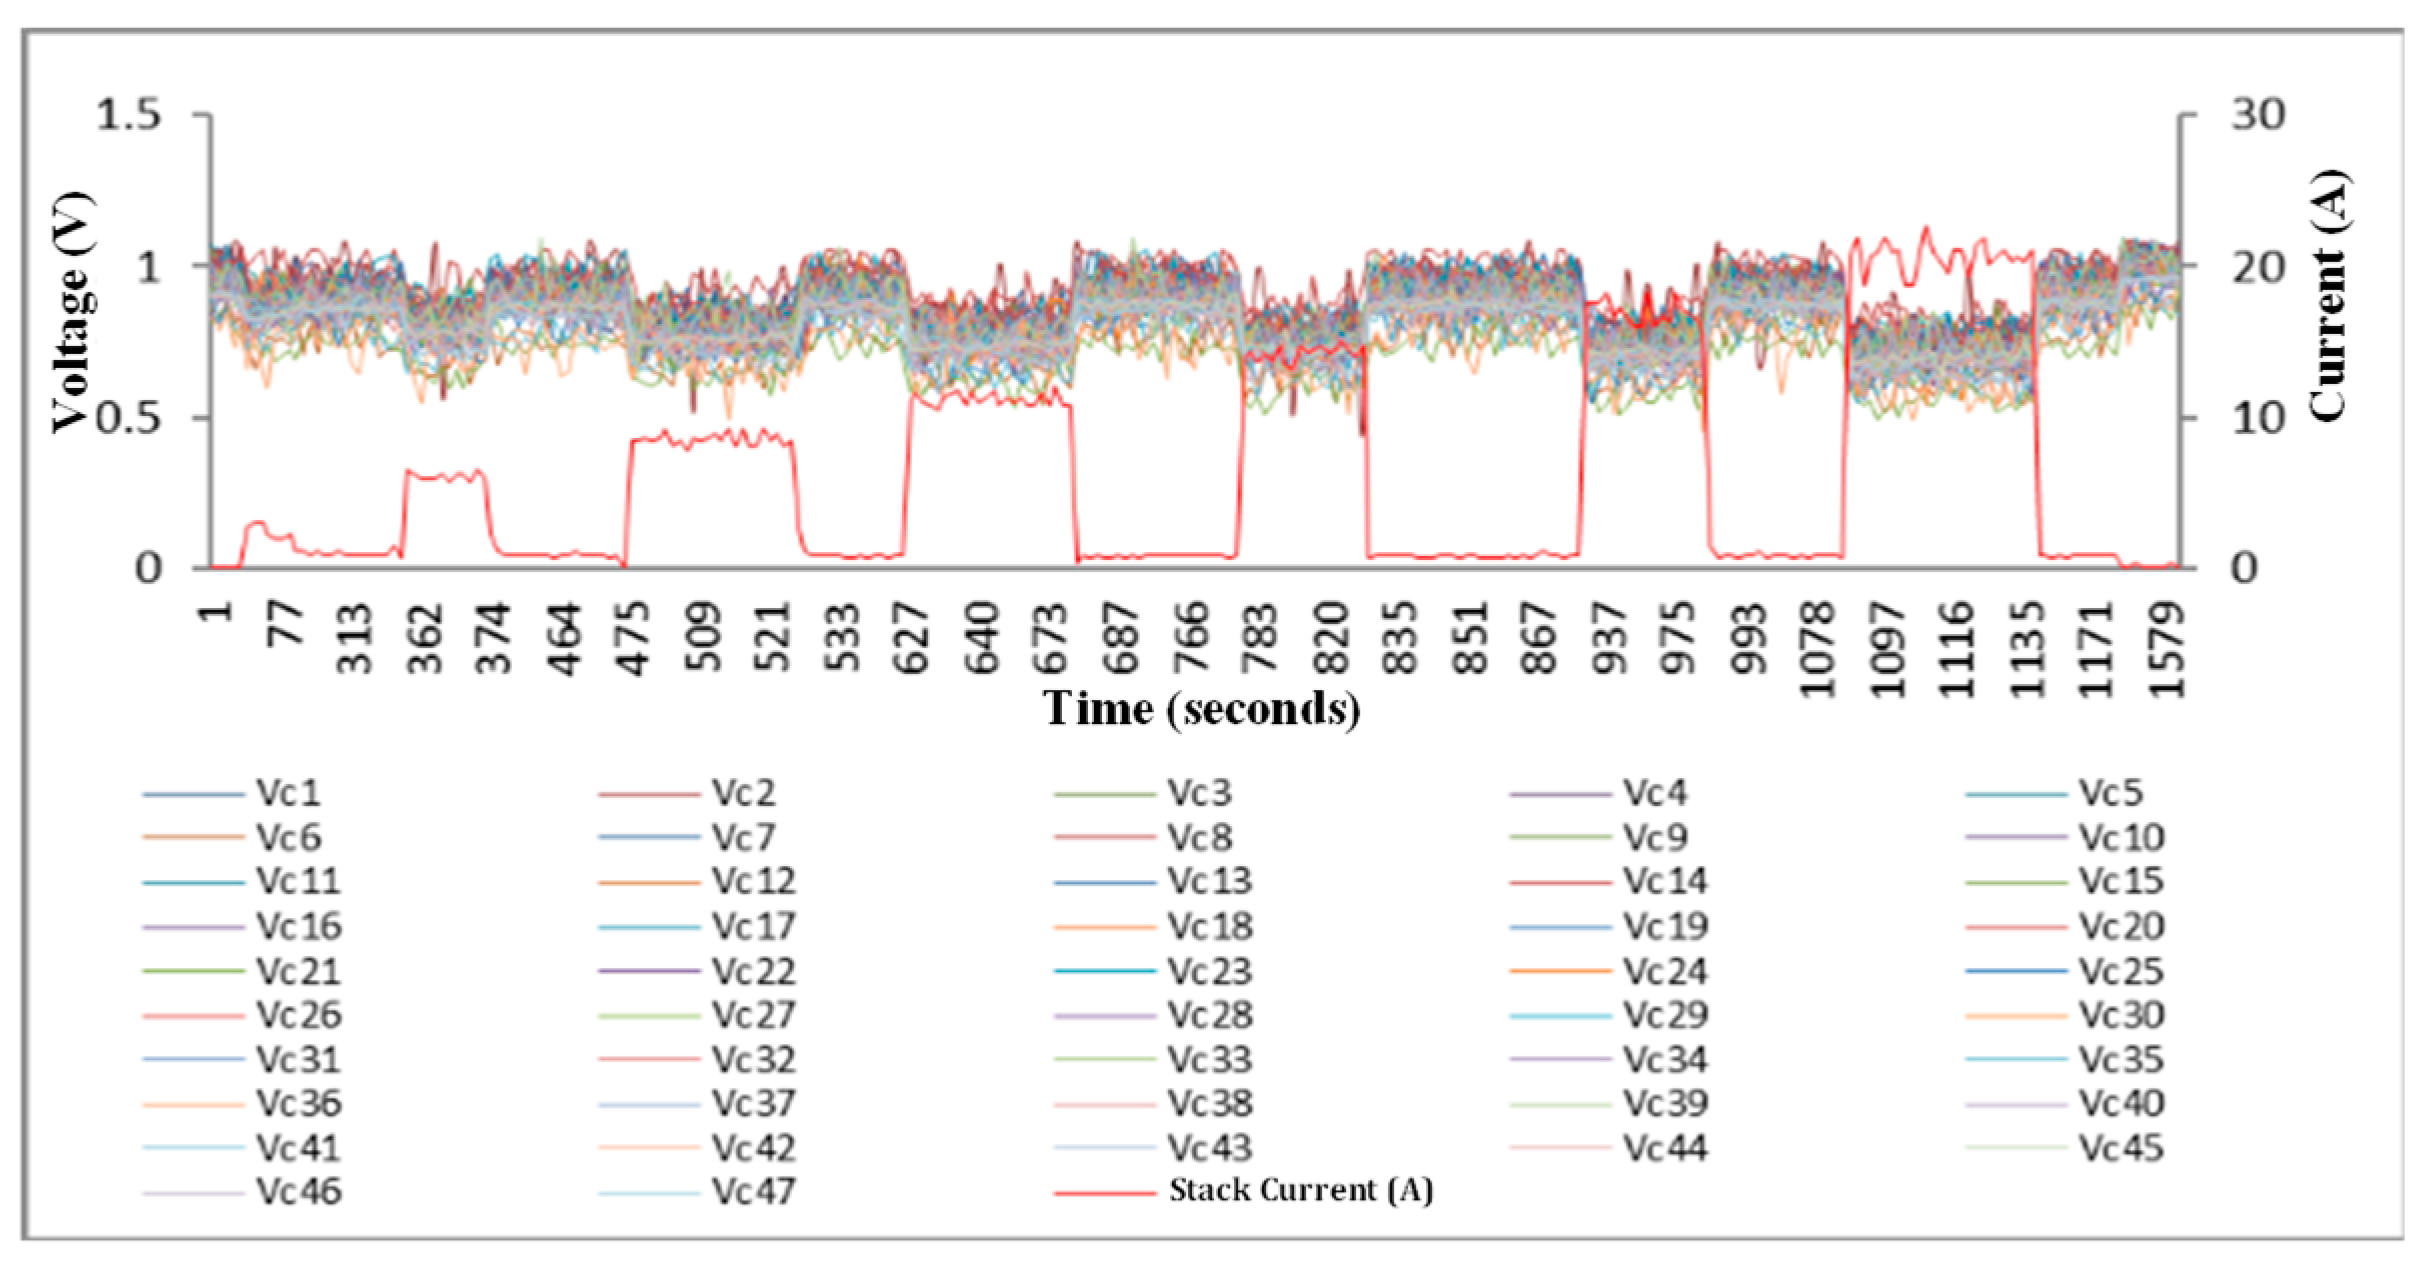
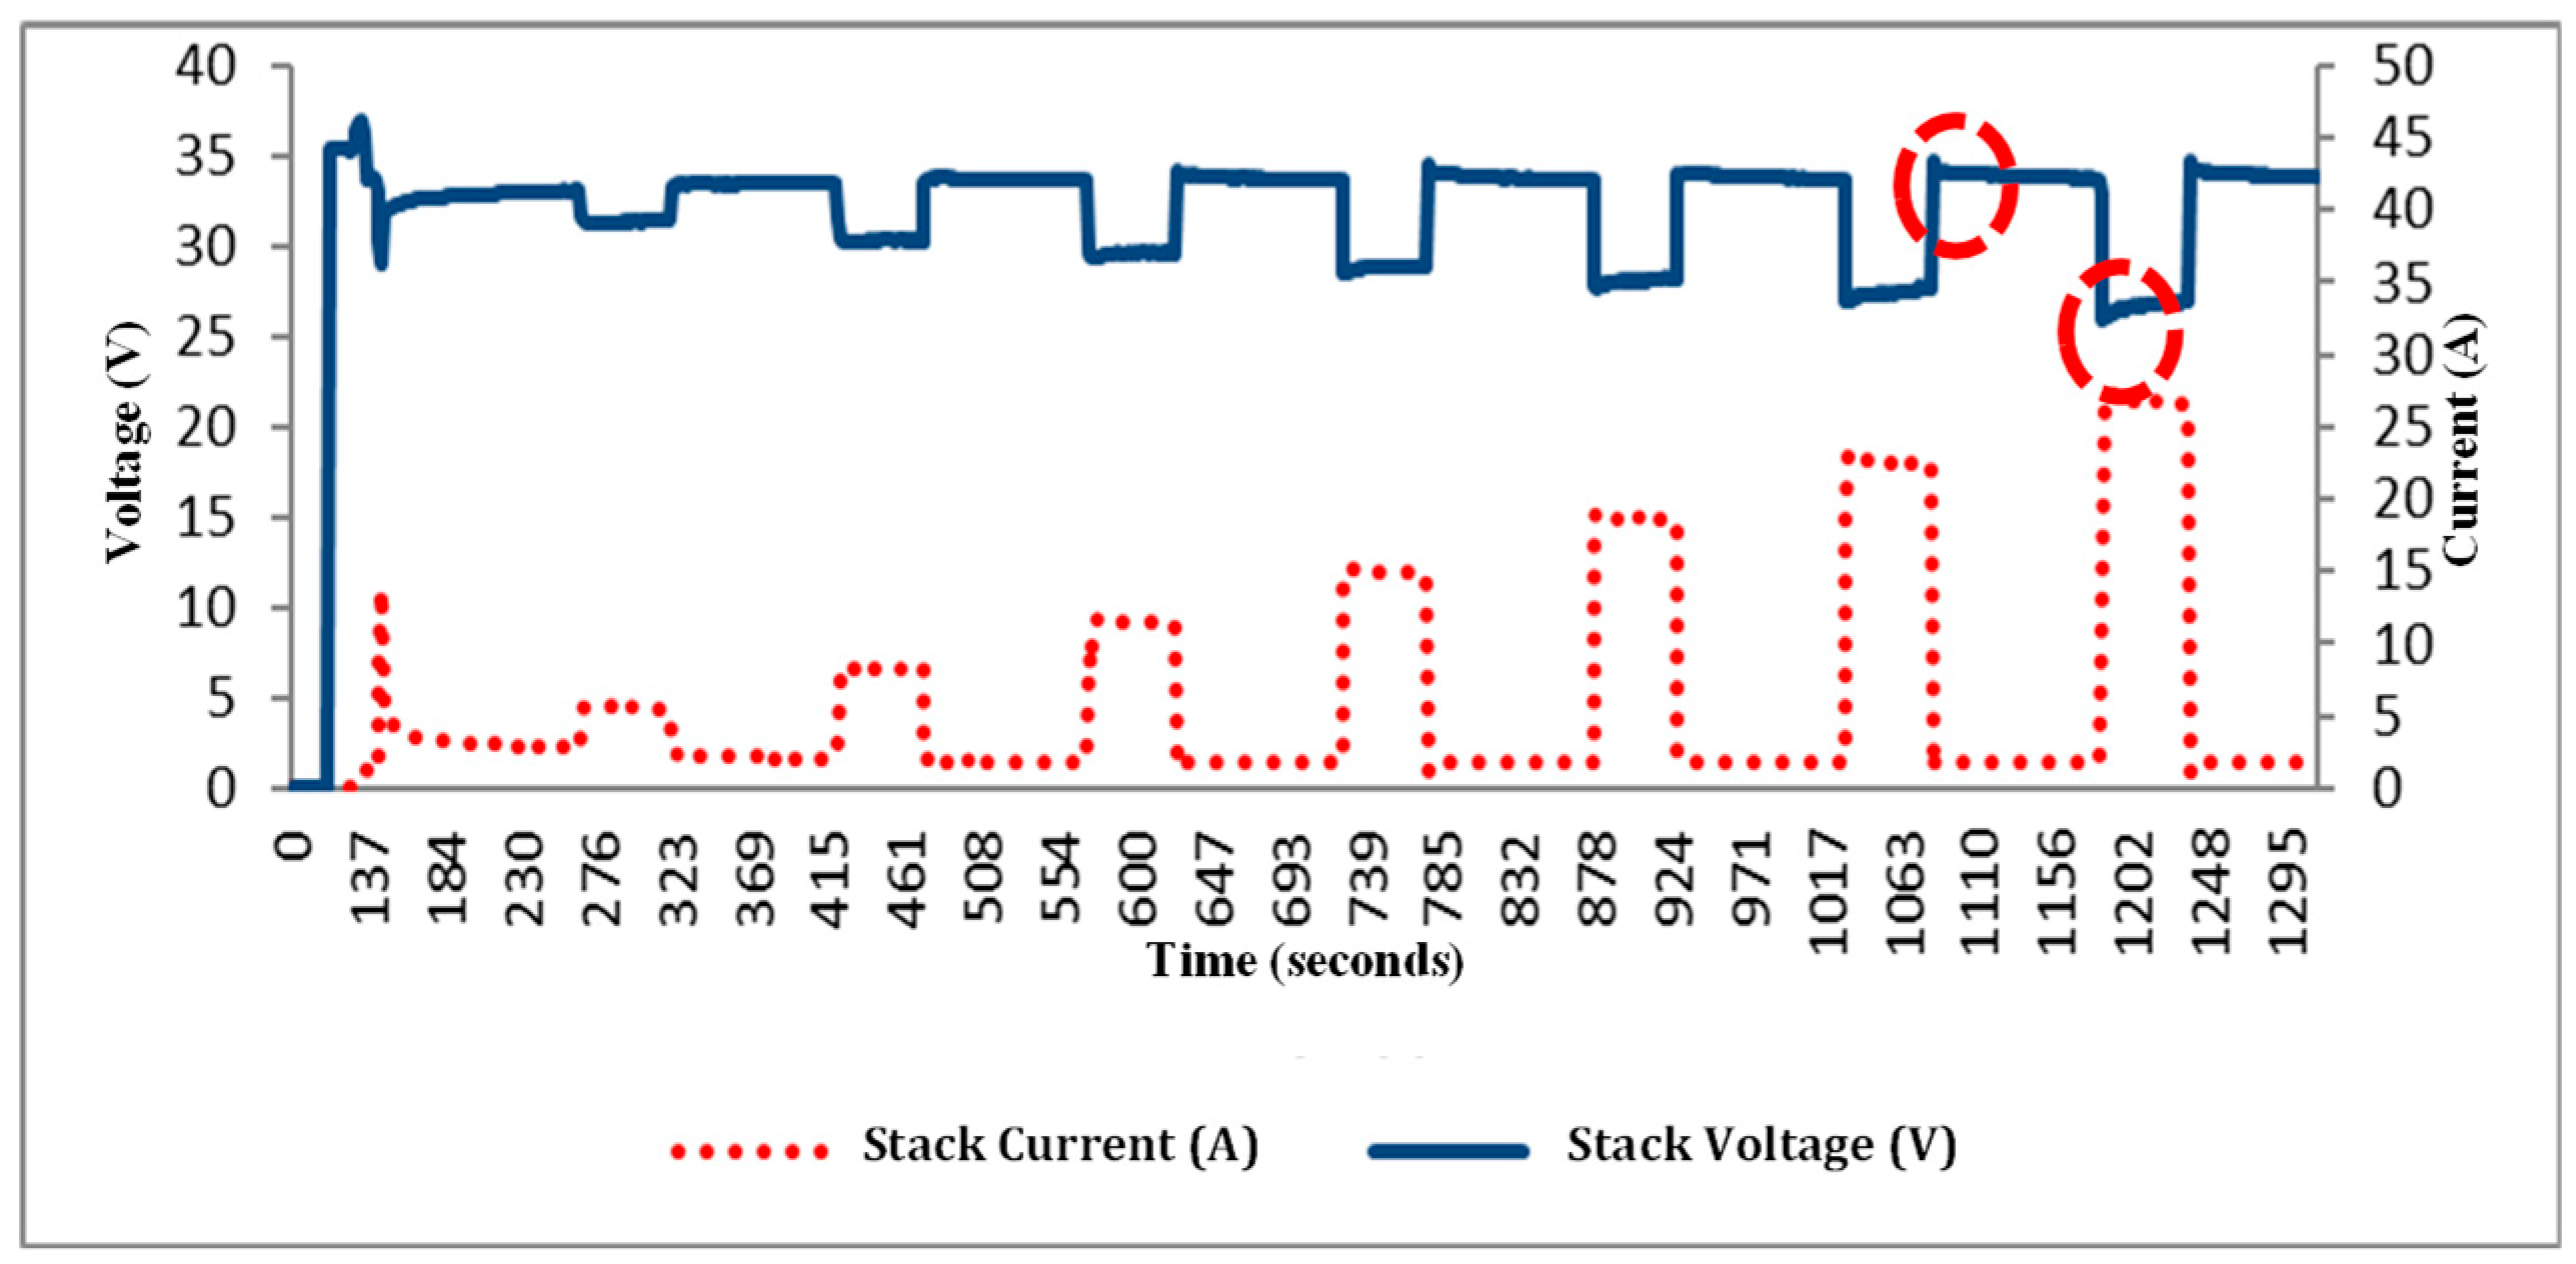
Figure 15 shows a rapid voltage response to variations in the current demand of the system. This response is characterized by a proportional decrease in voltage as the current requested from the cell increases, confirming an inverse relationship between both parameters under dynamic load conditions. Additionally, an initial overvoltage is observed, followed by a voltage drop when abrupt current changes are applied. This phenomenon is more pronounced at higher-intensity steps, suggesting that both the magnitude of the overvoltage and the subsequent drop are directly related to the amplitude of the current change. Likewise, a transient peak is identified at the beginning of the process, coinciding with the activation of the purge system. This transient behavior suggests a possible interaction between the electrical dynamics induced by the load variation and the physical effects derived from the gas management system and purge operation, which must be considered for a comprehensive interpretation of the fuel cell response.
It is noteworthy that the 47 cells comprising the analyzed set exhibit coherent and consistent behavior, demonstrating similar voltage dynamic responses to current variations (Figure 16). These results reinforce the validity of the analysis and suggest that the cells exhibit homogeneous electrochemical performance under stepped-load conditions.

5.10. Transient Response of Voltage and Current During Continuous Load Variation, Without Stops

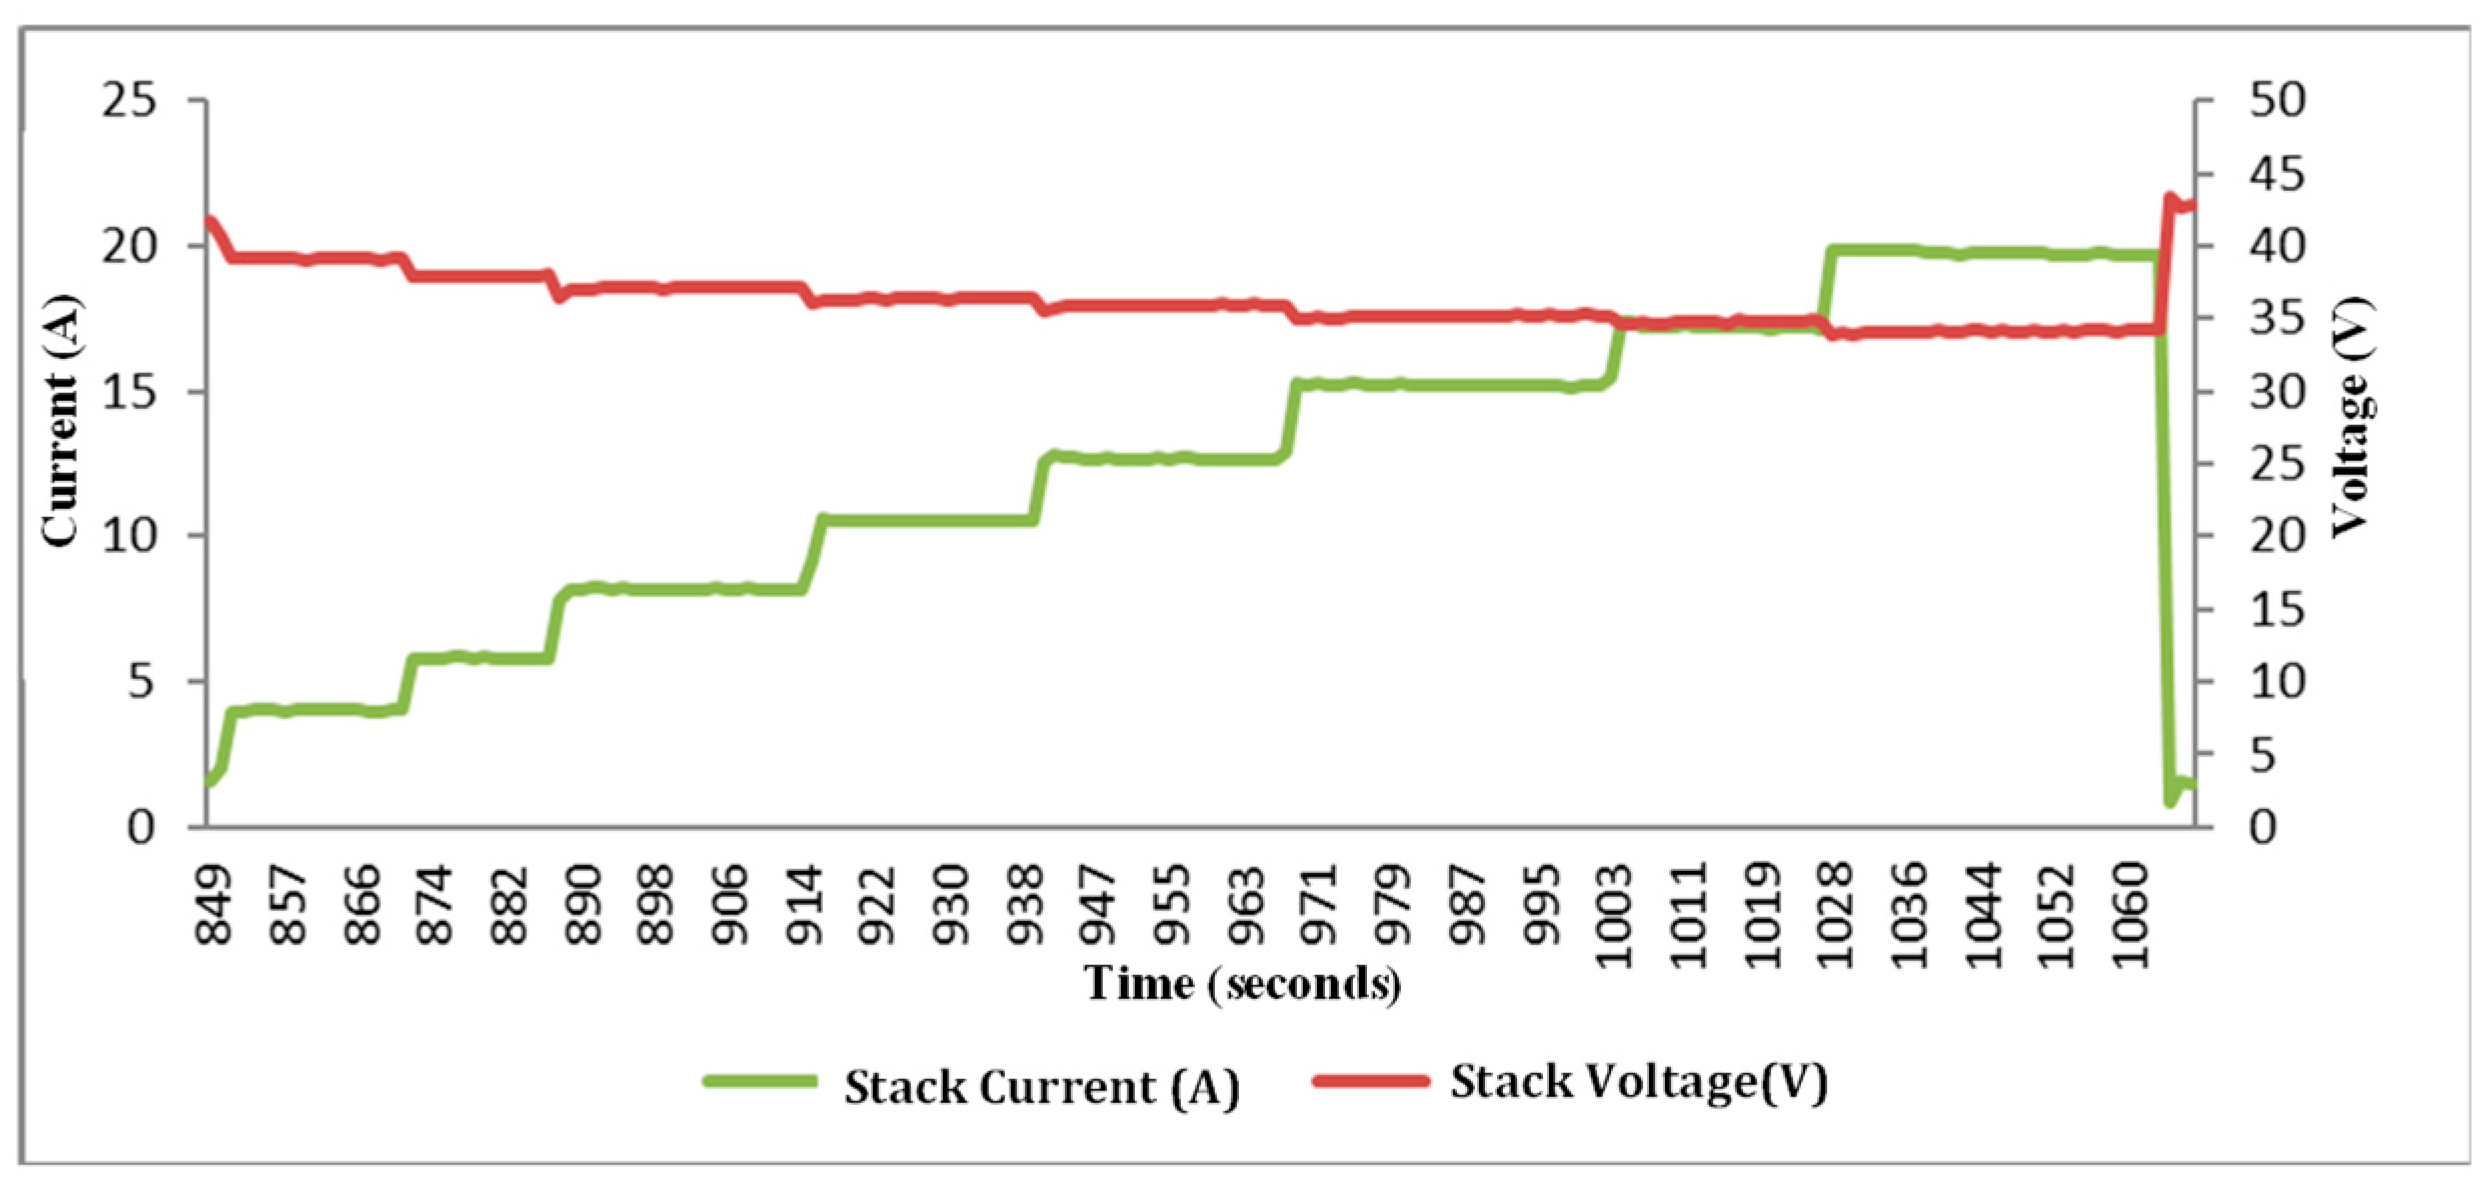
Comparing the results shown in the graphs in Figure 15 and Figure 17, it is observed that applying a constant load variation, without intermediate interruptions caused by the load change system (Prodigit), produces a more attenuated voltage response. Under these conditions, no abrupt voltage peaks are recorded, which is attributed to the progressive increase in load, which allows the air compressor to adjust its speed gradually. This behavior favors greater stability in the electrochemical reactions within the cells, avoiding significant disturbances in the system.

5.11. Transient Response of Voltage, Current and Bleed Status During Step Load Variation

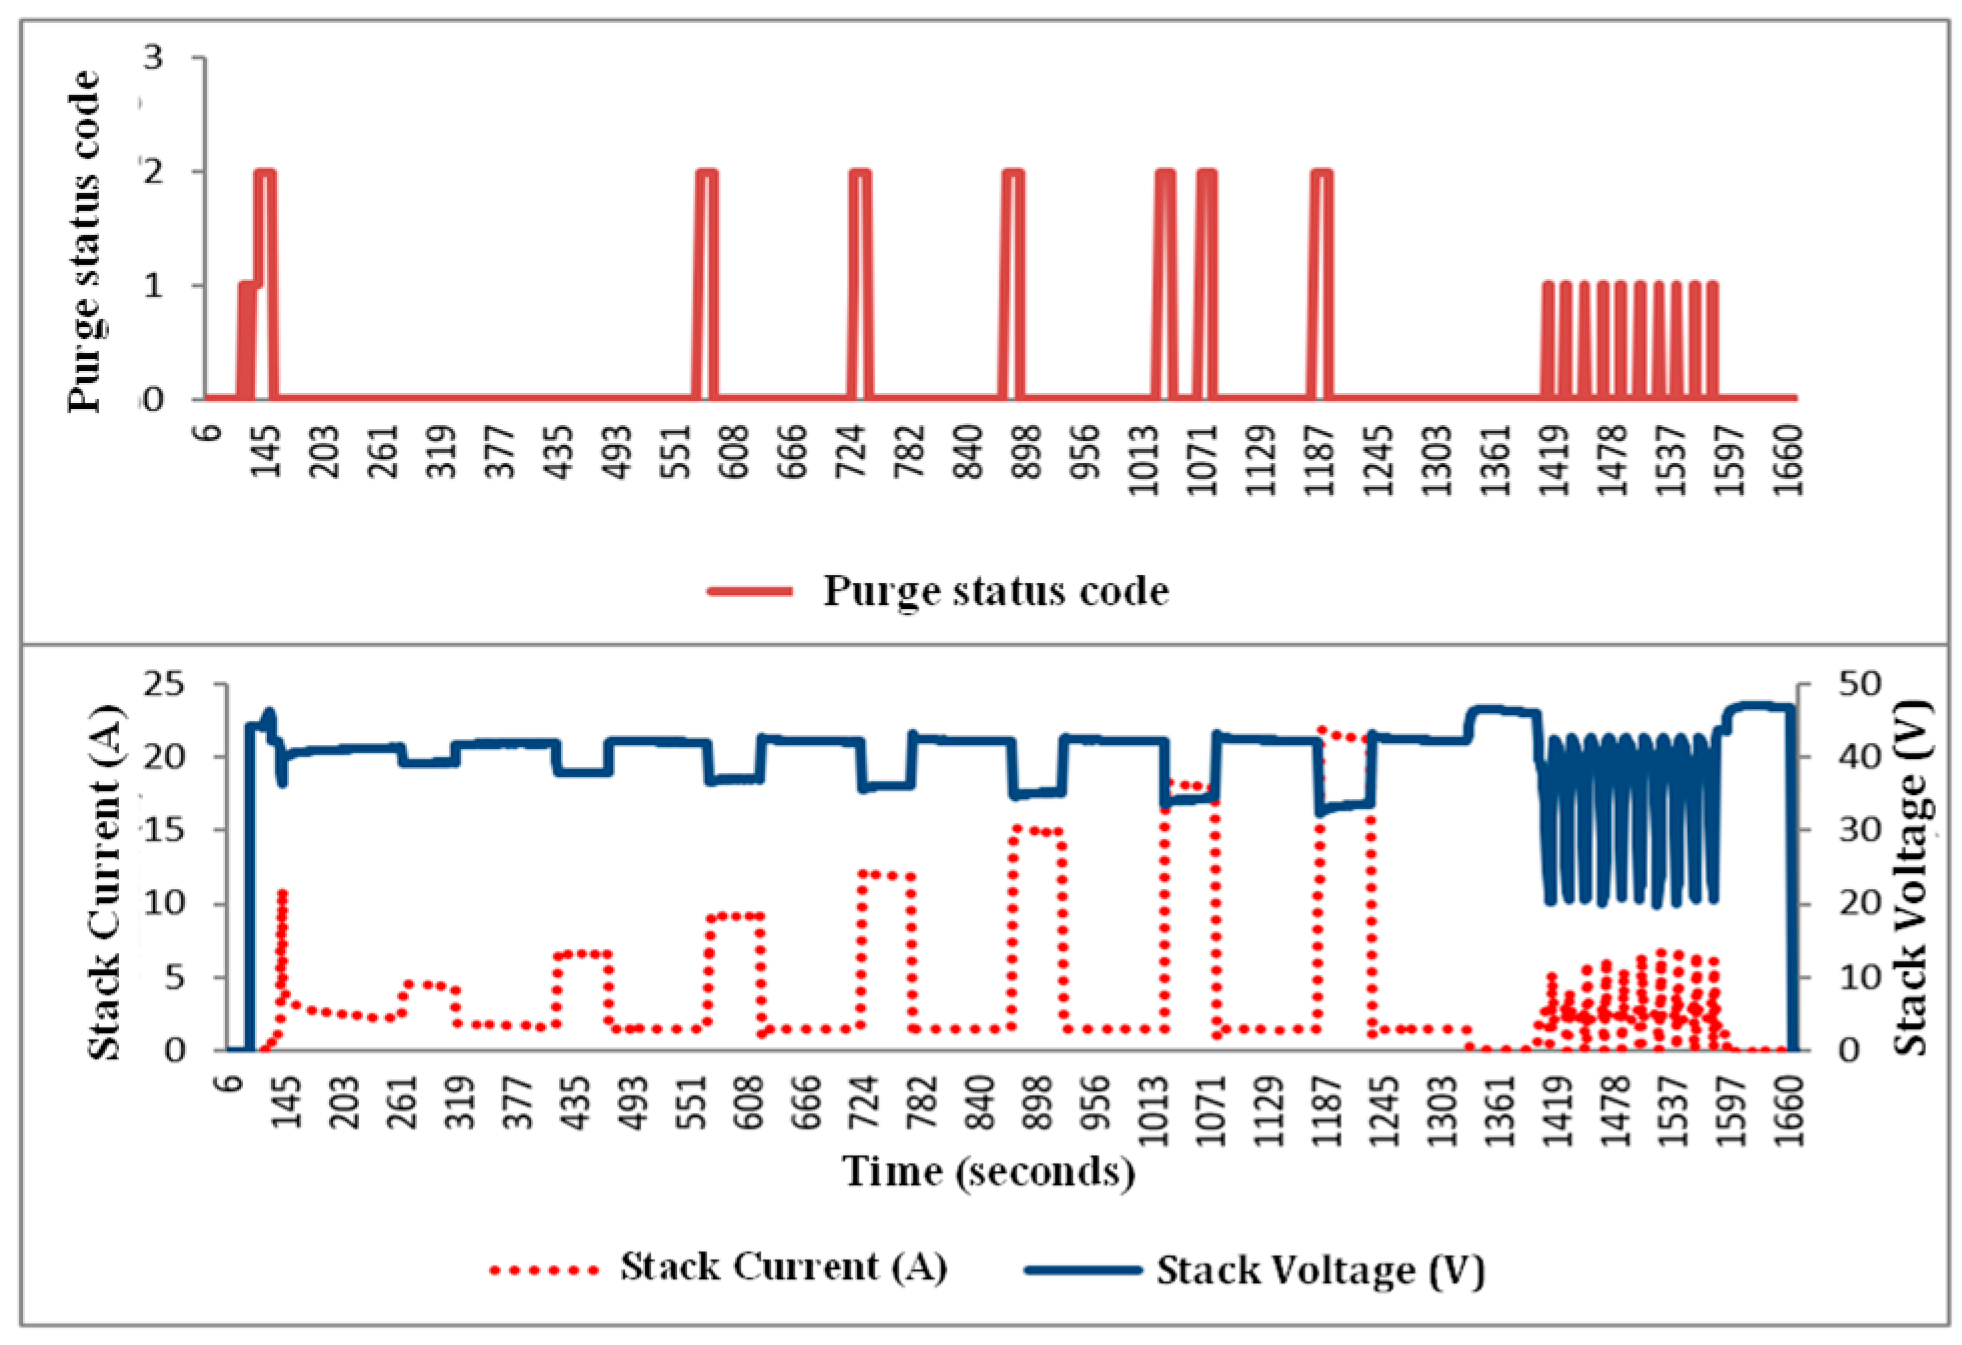
Figure 18 shows the evolution of voltage and current during the system purge operations over a total period of 1660 s. The purge status codes are: (0) closed, (1) open, (2) disabled. At approximately 130, the first purge activation (state 1), is observed, which aims to fill the stack with hydrogen. During the loading steps, the purge valve remains deactivated (state 2) and no openings are recorded. However, between minutes 1419 and 1597, the valve is activated (open state), executing successive purges to evacuate water residues and gaseous byproducts generated by the electrochemical reactions inherent to the operation.
As shown in the graph, during consecutive purges (state 1), the cell’s output current shows small variations but remains generally stable. This occurs because the electronic control system automatically adjusts the energy flow to maintain a constant current to the load, even when momentary changes occur within the cell during the purge. In contrast, the voltage exhibits much more noticeable fluctuations. This is because the voltage directly depends on what happens inside the cell: the chemical reactions between hydrogen and oxygen, and the conductivity of the polymer membrane that transports protons. When a purge is performed, accumulated gases (such as water vapor or nitrogen) are removed, which changes the pressure and humidity inside the anode. These variations affect the membrane’s conductivity and the movement of protons, causing transient changes in voltage.
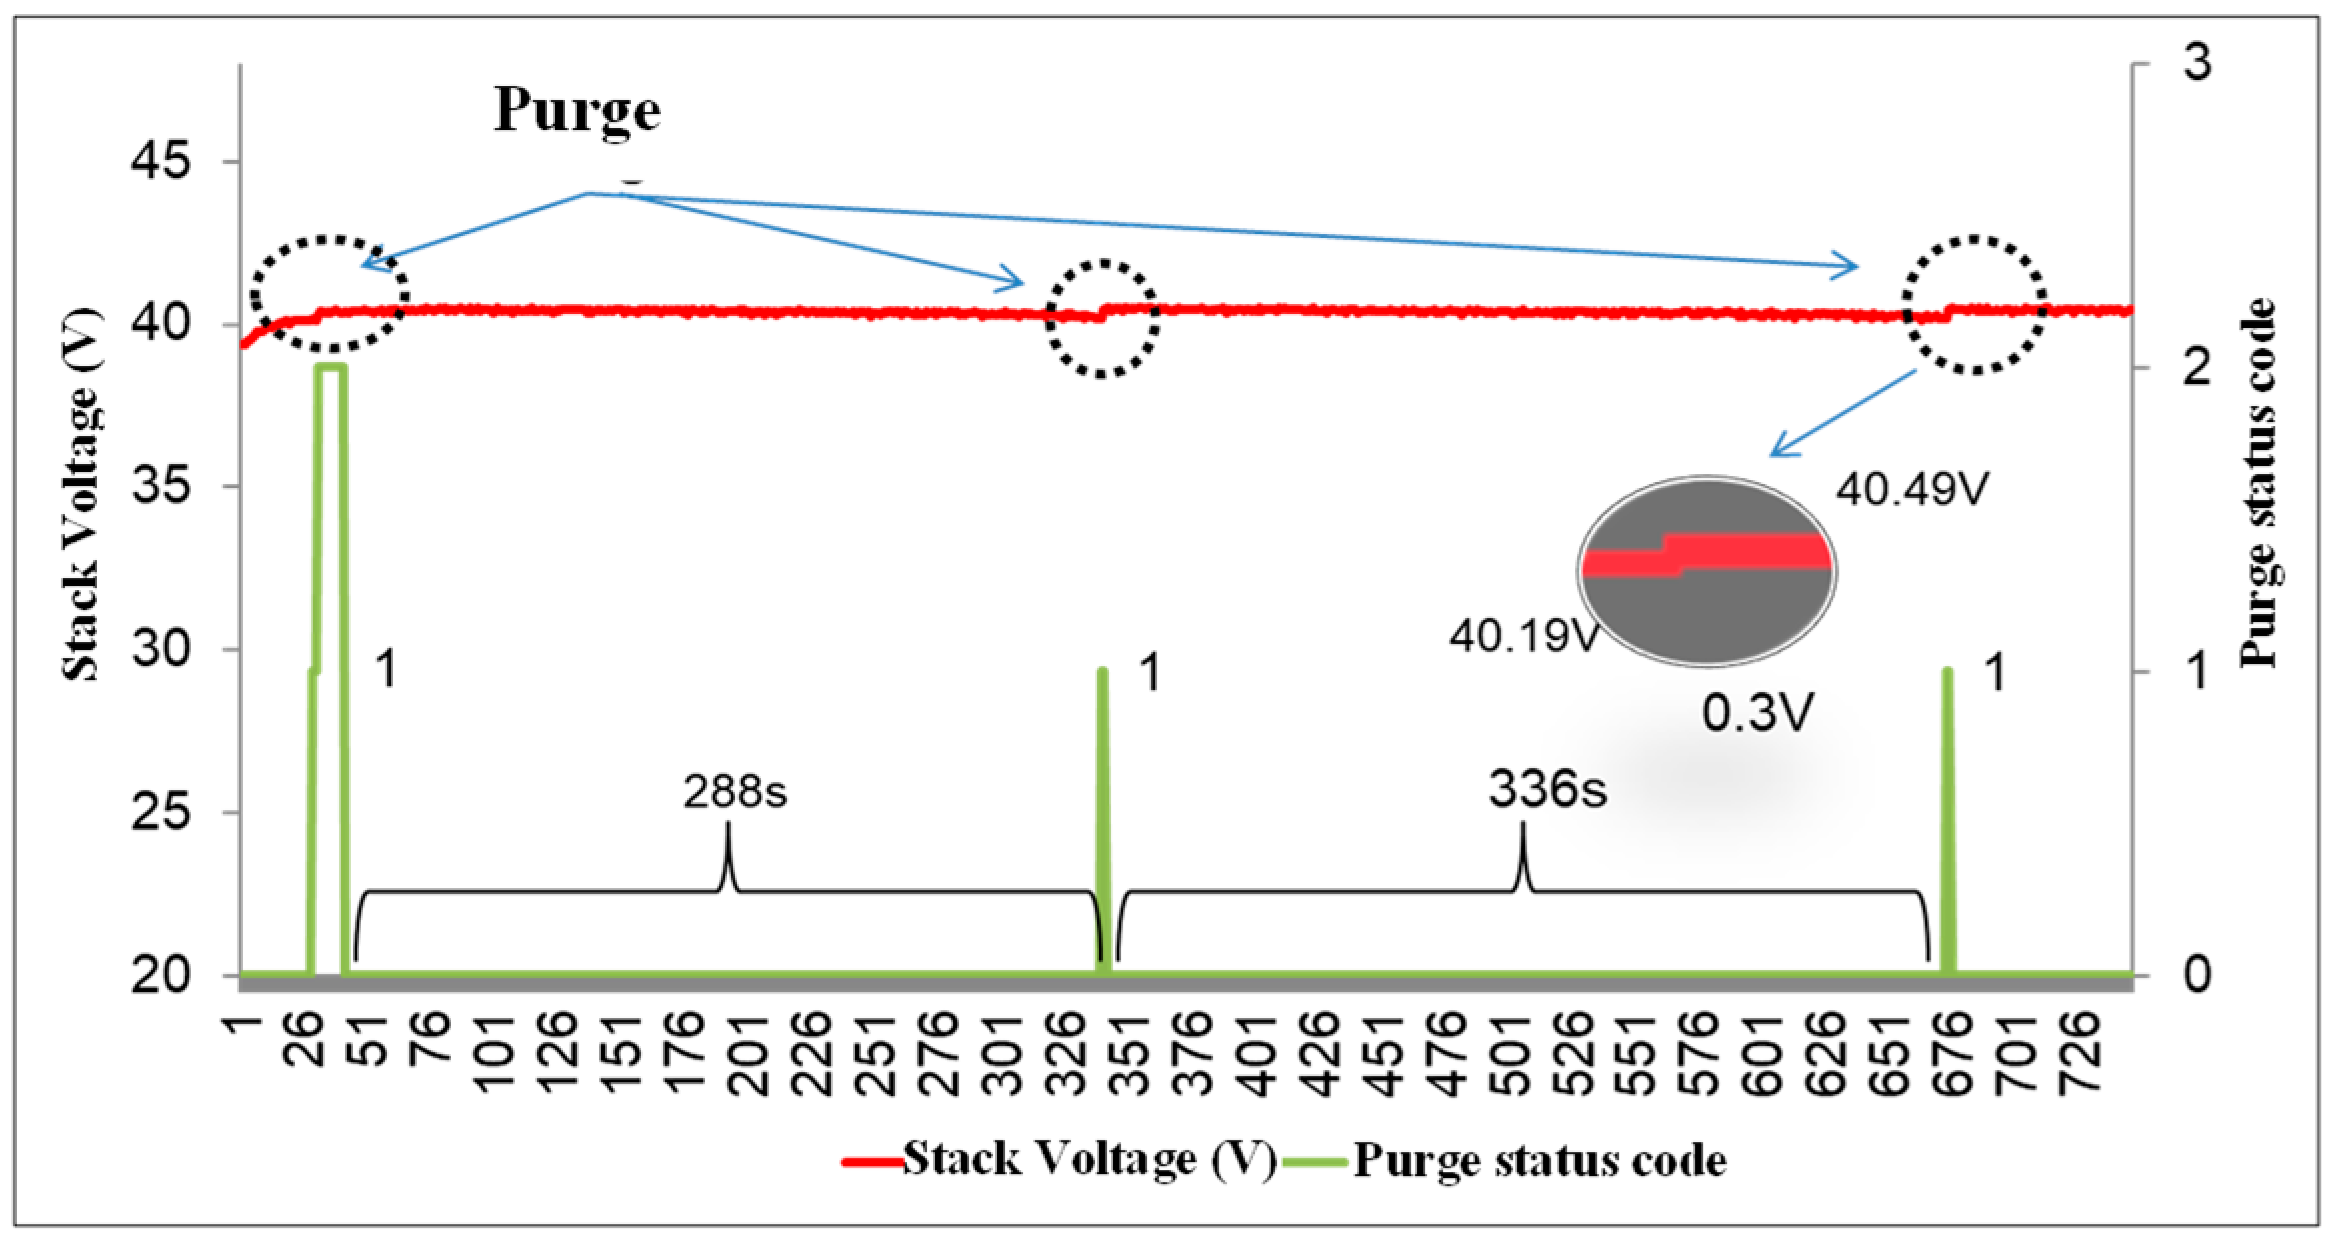
Figure 19 shows the effect of the purge operation on the stack voltage under a constant load condition of 2 A. It is observed that after the purge, the voltage improves from 40.19 V to 40.49 V (0.3 V). The greater voltage stability observed during purging is mainly due to improved water management within the PEM fuel cell. During each purge, excess water accumulated in the anode channels is removed, preventing flooding and allowing a more uniform hydrogen flow toward the membrane. This improves reactant distribution and reduces local variations in voltage. In addition, the purge frequency is related to the applied current or load: at higher currents, more electrochemical reactions occur, producing more water at the cathode. This increased water production requires more frequent purges to maintain proper membrane hydration and stable system operation.

6. Conclusions

A comprehensive study of the dynamic and thermal behavior of a 47-cell PEM fuel cell, connected in series, identified key response patterns under different operating conditions. A directly proportional relationship was observed between the applied current and the increase in stack temperature, attributed to increased electrochemical reactions and higher internal conductivity during energy demands. Start-up and shutdown transitions showed characteristic response times of approximately 13 s and 35–40 s, respectively, accompanied by transient voltage spikes associated with internal transport phenomena and gas dynamics in the flow channels.
During load application, a rapid, proportional voltage response was observed at both the cell and stack levels, with transients more pronounced at high currents. The purge operation, both during start-up and continuous operation, demonstrated a voltage-stabilizing effect by facilitating the removal of accumulated water and residual gases, thereby improving electrochemical efficiency under constant-load conditions.
Together, these findings provide valuable information for the design of thermal and electrical control strategies and for the efficient monitoring of fuel cell performance in real-world applications. In larger systems, or those with similar geometric and operational configurations, comparable effects tend to appear both during the purge process and in the transient response of the variables analyzed. This behavior is due to the transport and electrochemical mechanisms that govern the process—such as mass and heat transfer, gas flow distribution, and double-layer capacitances.

Author Contributions

Conceptualization, M.L.Z.H., M.C.G., A.J.C.G. and J.F.G.G.; methodology, M.L.Z.H., M.C.G., A.J.C.G. and J.F.G.G.; software, M.L.Z.H.; validation, M.L.Z.H.; formal analysis, M.L.Z.H., M.C.G., A.J.C.G. and J.F.G.G.; investigation, M.L.Z.H., M.C.G.; resources, J.F.G.G.; writing—original draft preparation, M.L.Z.H.; writing—review and editing, M.L.Z.H., M.C.G., A.J.C.G., J.R.F.D., J.F.G.G. and J.S.R.; visualization, M.L.Z.H.; supervision, M.C.G., A.J.C.G. and J.F.G.G.; project administration, J.R.F.D. and J.F.G.G.; Funding acquisition, J.R.F.D., J.F.G.G. and J.S.R.; All authors have read and agreed to the published version of the manuscript.

Funding

The authors thank the SNI (Sistema Nacional de Investigación-Panamá) SNI-27-2022, Ministry of Science, Innovation and Universities, the State Research Agency for financing the reference project EQC2019-005372-P, and the Junta de Extremadura and the European Regional Development Fund for financing the aid to reference groups GR21139.

Institutional Review Board Statement

Not applicable.

Informed Consent Statement

Not applicable.

Data Availability Statement

The raw data supporting the conclusions of this article will be made available by the authors on request.

Conflicts of Interest

The authors declare no conflict of interest.

References

  1. UNFCCC. Outcome of the First Global Stocktake. Available online: https://unfccc.int/topics/global-stocktake/about-the-global-stocktake/outcome-of-the-first-global-stocktake (accessed on 16 July 2025).
  2. Zuriaga, I.G. Retos del hidrógeno verde. Econ. Aragonesa 2021, 103–129. Available online: https://dialnet.unirioja.es/servlet/articulo?codigo=8017764 (accessed on 16 July 2025).
  3. European Commission. A Hydrogen Strategy for a Climate-Neutral Europe, COM (2020) 301 Final, Brussels, Belgium, July 2020. Available online: https://eur-lex.europa.eu/legal-content/EN/TXT/?uri=CELEX:52020DC0301 (accessed on 1 February 2024).
  4. Hernández, M.L.Z. Análisis del Comportamiento de Celdas de Combustible (MEAs) Durante Diferentes Regímenes de Operación y Ante Variaciones de Parámetros de Funcionamiento y Perturbaciones Externas, Para Pilas de Combustible de Intercambio Protónico (PEM). Doctoral Dissertation, Universidad de Extremadura, Cáceres, Spain, 2021. [Google Scholar]
  5. Calderón, M. Estudio, Diseño y Optimización de un Sistema Integrado de Gestión Energética Para una Instalación Autónoma Fotovoltaica/Eólica con Apoyo de Hidrógeno. Ph.D. Thesis, University de Extremadura, Badajoz, Spain, 2010. Available online: https://dialnet.unirioja.es/servlet/tesis?codigo=180867 (accessed on 3 October 2019).
  6. Iranzo, A. Desarrollo y Validación Experimental de un Modelo Computacional de Pilas de Combustible Tipo PEM y su Aplicación al Análisis de Monoceldas. Doctoral Dissertation, University de Sevilla, Sevilla, Spain, 2011. [Google Scholar]
  7. Escobedo Hernández, E.; Zamora Campos, L.A. Dynamic Modeling of Fuel Cells. M.S. Thesis, Centro Nacional de Investigación y Desarrollo Tecnológico (CENIDET), Cuernavaca, Mexico, 2006. [Google Scholar]
  8. Wang, Y.; Seo, B.; Wang, B.; Zamel, N.; Jiao, K.; Adroher, X.C. Fundamentals, materials, and machine learning of polymer electrolyte membrane fuel cell technology. Energy AI 2020, 1, 100014. [Google Scholar] [CrossRef] [Scilit]
  9. Pavón Delgado, M.; Iranzo Paricio, J.A. Sistemas de Diagnóstico en Pilas de Combustible en Aplicaciones de Transporte. Bachelor’s Thesis, University Politécnica de Valencia, Valencia, Spain, 2021. [Google Scholar]
  10. Yue, M.; Li, Z.; Roche, R.; Jemei, S.; Zerhouni, N. A feature-based prognostics strategy for PEM fuel cell operated under dynamic conditions. In Proceedings of the 2020 Prognostics and Health Management Conference (PHM-Besançon), Besancon, France, 4–7 May 2020; pp. 122–127. [Google Scholar]
  11. Li, X.; Han, K.; Song, Y. Dynamic behaviors of PEM fuel cells under load changes. Int. J. Hydrogen Energy 2019, 45, 20312–20320. [Google Scholar] [CrossRef] [Scilit]
  12. Page, M.P. Estudio del Comportamiento Estacionario y Dinámico de una Pila de Combustible Tipo PEM de 300 W Operando en los Modos de Operación de Ánodo Cerrado o Dead-End y Ánodo Abierto. Doctoral Dissertation, University Politécnica de València, Valencia, España, 2012. [Google Scholar]
  13. Thiele, P.; Gouveia, L.; Ulrich, O. Optimization of Realistic Accelerated Stress Tests for PEM Fuel Cells Using Standardized Automotive Driving Cycles. Electrochem. Soc. Meet. Abstr. 2023, 244, 1847. [Google Scholar] [CrossRef] [Scilit]
  14. Rincón Murcia, S.D. Diseño e Implementación de un Emulador del Comportamiento Eléctrico de una Pila de Combustible PEM. Bachelor’s Thesis, Universidad Santo Tomás, Manila, Philippines, 2022. [Google Scholar]
  15. Nascimento, A.L.; Yahyaoui, I.; Fardin, J.F.; Encarnação, L.F.; Tadeo, F. Modeling and experimental validation of a PEM fuel cell in steady and transient regimes using PSCAD/EMTDC software. Int. J. Hydrogen Energy 2020, 45, 30870–30881. [Google Scholar] [CrossRef] [Scilit]
  16. Qi, Y.; Espinoza, M.; Thern, M.; Andersson, M. Polymer Electrolyte Fuel Cell System Level Modelling and Simulation of Transient Behavior. eTransportation 2019, 2, 100030. [Google Scholar] [CrossRef] [Scilit]
  17. Tang, X.; Zhang, Y.; Xu, S. Degradation Characteristics Prediction for Vehicle PEM Fuel Cell Stack Using a Fusion Prognostic Approach. In Proceedings of the 10th Hydrogen Technology Convention; Springer: Berlin/Heidelberg, Germany, 2024; pp. 175–181. [Google Scholar] [CrossRef] [Scilit]
  18. Arana, C. Redes Neuronales Recurrentes: Análisis de Los Modelos Especializados en Datos Secuenciales; Serie Documentos de Trabajo, no. 797; Universidad del CEMA: Buenos Aires, Argentina, 2021; Available online: https://hdl.handle.net/10419/238422 (accessed on 16 July 2025).
  19. Raya, A.; Tutor, A.; Jesús, S.; Herrera, N.; María, G.; González, C. Analysis of the Degradation of a PEM Fuel Cell Subjected to Dynamic Load Cycles. Bachelor’s Thesis, Universidad de Sevilla, Sevilla, Spain, 2024. [Google Scholar]
  20. Wang, C.; Dou, M.; Li, Z.; Outbib, R.; Zhao, D.; Liang, B. A Fusion Prognostics Strategy for Fuel Cells Operating under Dynamic Conditions. eTransportation 2022, 12, 100166. [Google Scholar] [CrossRef] [Scilit]
  21. Arce, A.; del Real, A.J.; Bordons, C. Evaluación de distintas estrategias de control predictivo con restricciones para pilas de combustible. In Proceedings of the XXVII Jornadas de Automática, Almería, Spain, 6–9 September 2006; pp. 846–853. [Google Scholar]
  22. Yuan, H.; Dai, H.; Ming, P.; Zhao, L.; Wei, T.; Wei, X. Understanding dynamic behavior of proton exchange membrane fuel cell in the view of internal dynamics based on impedance. Chem. Eng. J. 2021, 431, 134035. [Google Scholar] [CrossRef] [Scilit]
  23. Goshtasbi, A.; García-Salaberri, P.A.; Chen, J.; Talukdar, K.; Garcia, D.; Ersal, T. Through-the-Membrane Transient Phenomena in PEM Fuel Cells: A Modeling Study. J. Electrochem. Soc. 2019, 166, F3154–F3179. [Google Scholar] [CrossRef] [Scilit]
  24. Shi, Y.; Janßen, H.; Lehnert, W. A transient behavior study of polymer electrolyte fuel cells with cyclic current profiles. Energies 2019, 12, 2370. [Google Scholar] [CrossRef] [Scilit]
  25. Herreros Carmona, P. Fuel Cell Modeling Using Experimental Data. Bachelor’s Thesis, Universitat Politècnica de Catalunya, Barcelona, Spain, 2024. [Google Scholar]
  26. Alcalá Fazio, E.A.; López Martínez, J.M.; Flores Holgado, N.; Álvarez Sánchez, J.Á.; Ramos García, I.; Urosa Rubio, J.U. Dimensionamiento de un vehículo híbrido con baterías de tracción y pila de combustible para aplicación aeroportuaria. An. Ing. Mecánica 2025, 1, 1–10. [Google Scholar] [CrossRef] [Scilit]
  27. Clemente Pinto, J.L. Diseño de un Sistema Dual Solar-Hidrógeno Para Abastecimiento del Parque Automotor Eléctrico en la Ciudad de Móstoles. Bachelor’s Thesis, Universidad Rey Juan Carlos, Móstoles, Madrid, Spain, 2024. [Google Scholar]
  28. Gilabert Malonda, E. Análisis Comparativo de Sistemas de Tracción Para Vehículos Eléctricos e Híbridos. Master’s Thesis, Universitat Politécnica de Catalunya, Barcelona, Spain, 2024. [Google Scholar]
  29. Cheng, S.; Hu, D.; Hao, D.; Yang, Q.; Wang, J.; Feng, L.; Li, J. Investigation and analysis of proton exchange membrane fuel cell dynamic response characteristics on hydrogen consumption of fuel cell vehicle. Int. J. Hydrogen Energy 2022, 47, 15845–15864. [Google Scholar] [CrossRef] [Scilit]
  30. Liu, Z.; Zhang, B.; Xu, S. Research on air mass flow-pressure combined control and dynamic performance of fuel cell system for vehicles application. Appl. Energy 2022, 309, 118446. [Google Scholar] [CrossRef] [Scilit]
  31. Tang, Y.; Yuan, W.; Pan, M.; Wan, Z. Experimental investigation on the dynamic performance of a hybrid PEM fuel cell/battery system for lightweight electric vehicle application. Appl. Energy 2011, 88, 68–76. [Google Scholar] [CrossRef] [Scilit]
  32. Salazar Nájera, M.J.; Sampietro Saquicela, J.L. Sistema de propulsión para un vehículo eléctrico híbrido con almacenamiento de energía mediante frenado regenerative. Sapienza Int. J. Interdiscip. Stud. 2022, 3, 39–57. [Google Scholar] [CrossRef] [Scilit]
  33. Ruiz Sicilia, Á.; Escachx Estévez, B.; Costa-Castelló, R. Control robusto de la actitud de un multirrotor empleando una arquitectura de control. In Proceedings of the XLIV Jornadas de Automática, Zaragoza, Spain, 2023; pp. 358–363. [Google Scholar] [CrossRef] [Scilit]
  34. Sampietro, J.L. Control del sistema de propulsión de un vehículo eléctrico híbrido con motor de hidrógeno, usando baterías y supercapacitores. MASKAY 2022, 12, 1–14. [Google Scholar] [CrossRef] [Scilit]
  35. Toalombo-Vargas, V.M.; Negrete Costales, J.H.; Borja Mayorga, D.F. Balance energético para un vehículo híbrido basado en pila de combustible y ventajas en la seguridad de usuarios. Pol. Con. 2022, 7, 353–385. [Google Scholar]
  36. Silva Garrido, V.E. Diseño de un Piloto de Celdas de Combustible de Hidrógeno Como Fuente de Energía Para Camiones CAEX. Bachelor’s Thesis, Universidad de Chile, Santiago, Chile, 2022. [Google Scholar]
  37. Anderson, A.J.L.; Moré, J.J.; Puleston, P.F.; Roda, V.; Costa-Castelló, R. Implementación y validación experimental del control de un sistema híbrido basado en pilas de combustible para vehículos eléctricos. In Proceedings of the 27° Congreso Argentino de Control Automático AADECA, Buenos Aires, Argentina, 28–30 October 2020; pp. 313–318. [Google Scholar]
  38. Mayorga Aedo, C.S. Dimensionamiento e Implementación de Banco de Supercondensadores Como Fuente Secundaria en Sistemas de Tracción Eléctricos Basados en Pila de Combustible. Bachelor’s Thesis, Universidad de Concepción, Concepción, Chile, 2023. [Google Scholar]
  39. Yang, W.; Cha, D.; Kim, Y. Effects of flow direction on dynamic response and stability of no humidification PEM fuel cell. Energy 2019, 185, 386–395. [Google Scholar] [CrossRef] [Scilit]
  40. Cecilia, A.; Costa-Castelló, R. Observador de alta ganancia con zona muerta ajustable para estimar la saturación de agua líquida en pilas de combustible tipo PEM. Rev. Iberoam. Automática Informática Ind. 2020, 17, 169–180. [Google Scholar] [CrossRef] [Scilit]
  41. Almingol Estrada, J. Diseño e Implementación de Los Sistemas Electrónicos de Control Para Refrigeración y Humidificación Por Cortocircuitos en una Pila PEM de Cátodo Abierto. Master’s Thesis, Universidad de Zaragoza, Zaragoza, Spain, 2021. [Google Scholar]
  42. Penga, Ž.; Radica, G.; Tolj, I.; Barbir, F. Experimental investigation of dynamic performance of PEM fuel cell using a segmented single-cell. In Proceedings of the 2019 4th International Conference on Smart and Sustainable Technologies (SpliTech), Split, Croatia, 18–21 June 2019; pp. 1–6. [Google Scholar] [CrossRef] [Scilit]
  43. Duan, H.; Zhang, C.; Wang, G.; Chen, Y.; Liu, Z.; Xie, X.; Shuai, Q. Experimental study of the dynamic and transient characteristics of sub-health fuel cell multi-stack systems without DC/DC. Energy 2022, 238, 122007. [Google Scholar] [CrossRef] [Scilit]
  44. Quispe Cuba, A. Diseño de Convertidor DC/DC Para Mejorar el Rendimiento de una Pila de Hidrógeno. Bachelor’s Thesis, Universidad Nacional del Centro del Perú, Huancayo, Peru, 2023. [Google Scholar]
  45. Caparrós Mancera, J.J. Análisis e Implementación de Tecnologías de Hidrógeno, Para la Optimización de Microrredes Renovables, Integrando Supercondensadores. Doctoral Dissertation, Universidad de Huelva, Huelva, Spain, 2024. [Google Scholar]
  46. Hernández Lorente, G. Realización de una Bancada de Ensayos Para Propulsión Híbrida de Aeronaves con Baterías y Pila de Combustible. Bachelor’s Thesis, Universidad de Sevilla, Sevilla, Spain, 2020. [Google Scholar]
  47. Bautista García, P. El Hidrógeno en la Aviación. Bachelor’s Thesis, Universitat Europea de Madrid, Madrid, Spain, 2024. [Google Scholar]
  48. Fernández Cides, J. Sistema Autónomo de Producción y Gestión de Energía Eléctrica Utilizando Hidrógeno Controlado Mediante Tecnología IoT. Bachelor’s Thesis, Universitat Politècnica de Catalunya, Barcelona, Spain, 2024. [Google Scholar]
  49. Pei, F.; Chen, F. Transient response research on proton exchange membrane fuel cells based on a fully validated dynamic multi-phase model. Int. J. Energy Res. 2022, 46, 1108–1125. [Google Scholar] [CrossRef] [Scilit]
  50. Zambrano H, M.L.; Calderón, A.J.; Calderón, M.; González, J.F.; Pinzón, R.; Fábrega Duque, J.R. Design, development and testing of a monitoring system for the study of proton exchange fuel cells and stacks. Sensors 2023, 23, 5221. [Google Scholar] [CrossRef] [Scilit] [PubMed]
  51. Lochner, T.; Perchthaler, M.; Hnyk, F.; Sick, D.; Sabawa, J.P.; Bandarenka, A.S. Analysis of the capacitive behavior of polymer electrolyte membrane fuel cells during operation. ChemElectroChem 2021, 8, 96–102. [Google Scholar]
  52. Amphlett, J.C.; Mann, R.F.; Peppley, B.A.; Roberge, P.R.; Rodrigues, A. A model predicting transient responses of proton exchange membrane fuel cells. J. Power Sources 1996, 61, 183–188. [Google Scholar] [CrossRef] [Scilit]
  53. Abd El Monem, A.A.; Azmy, A.M.; Mahmoud, S.A. Effect of process parameters on the dynamic behavior of poly-mer electrolyte membrane fuel cells for electric vehicle applications. Ain Shams Eng. J. 2014, 5, 75–84. [Google Scholar] [CrossRef] [Scilit]
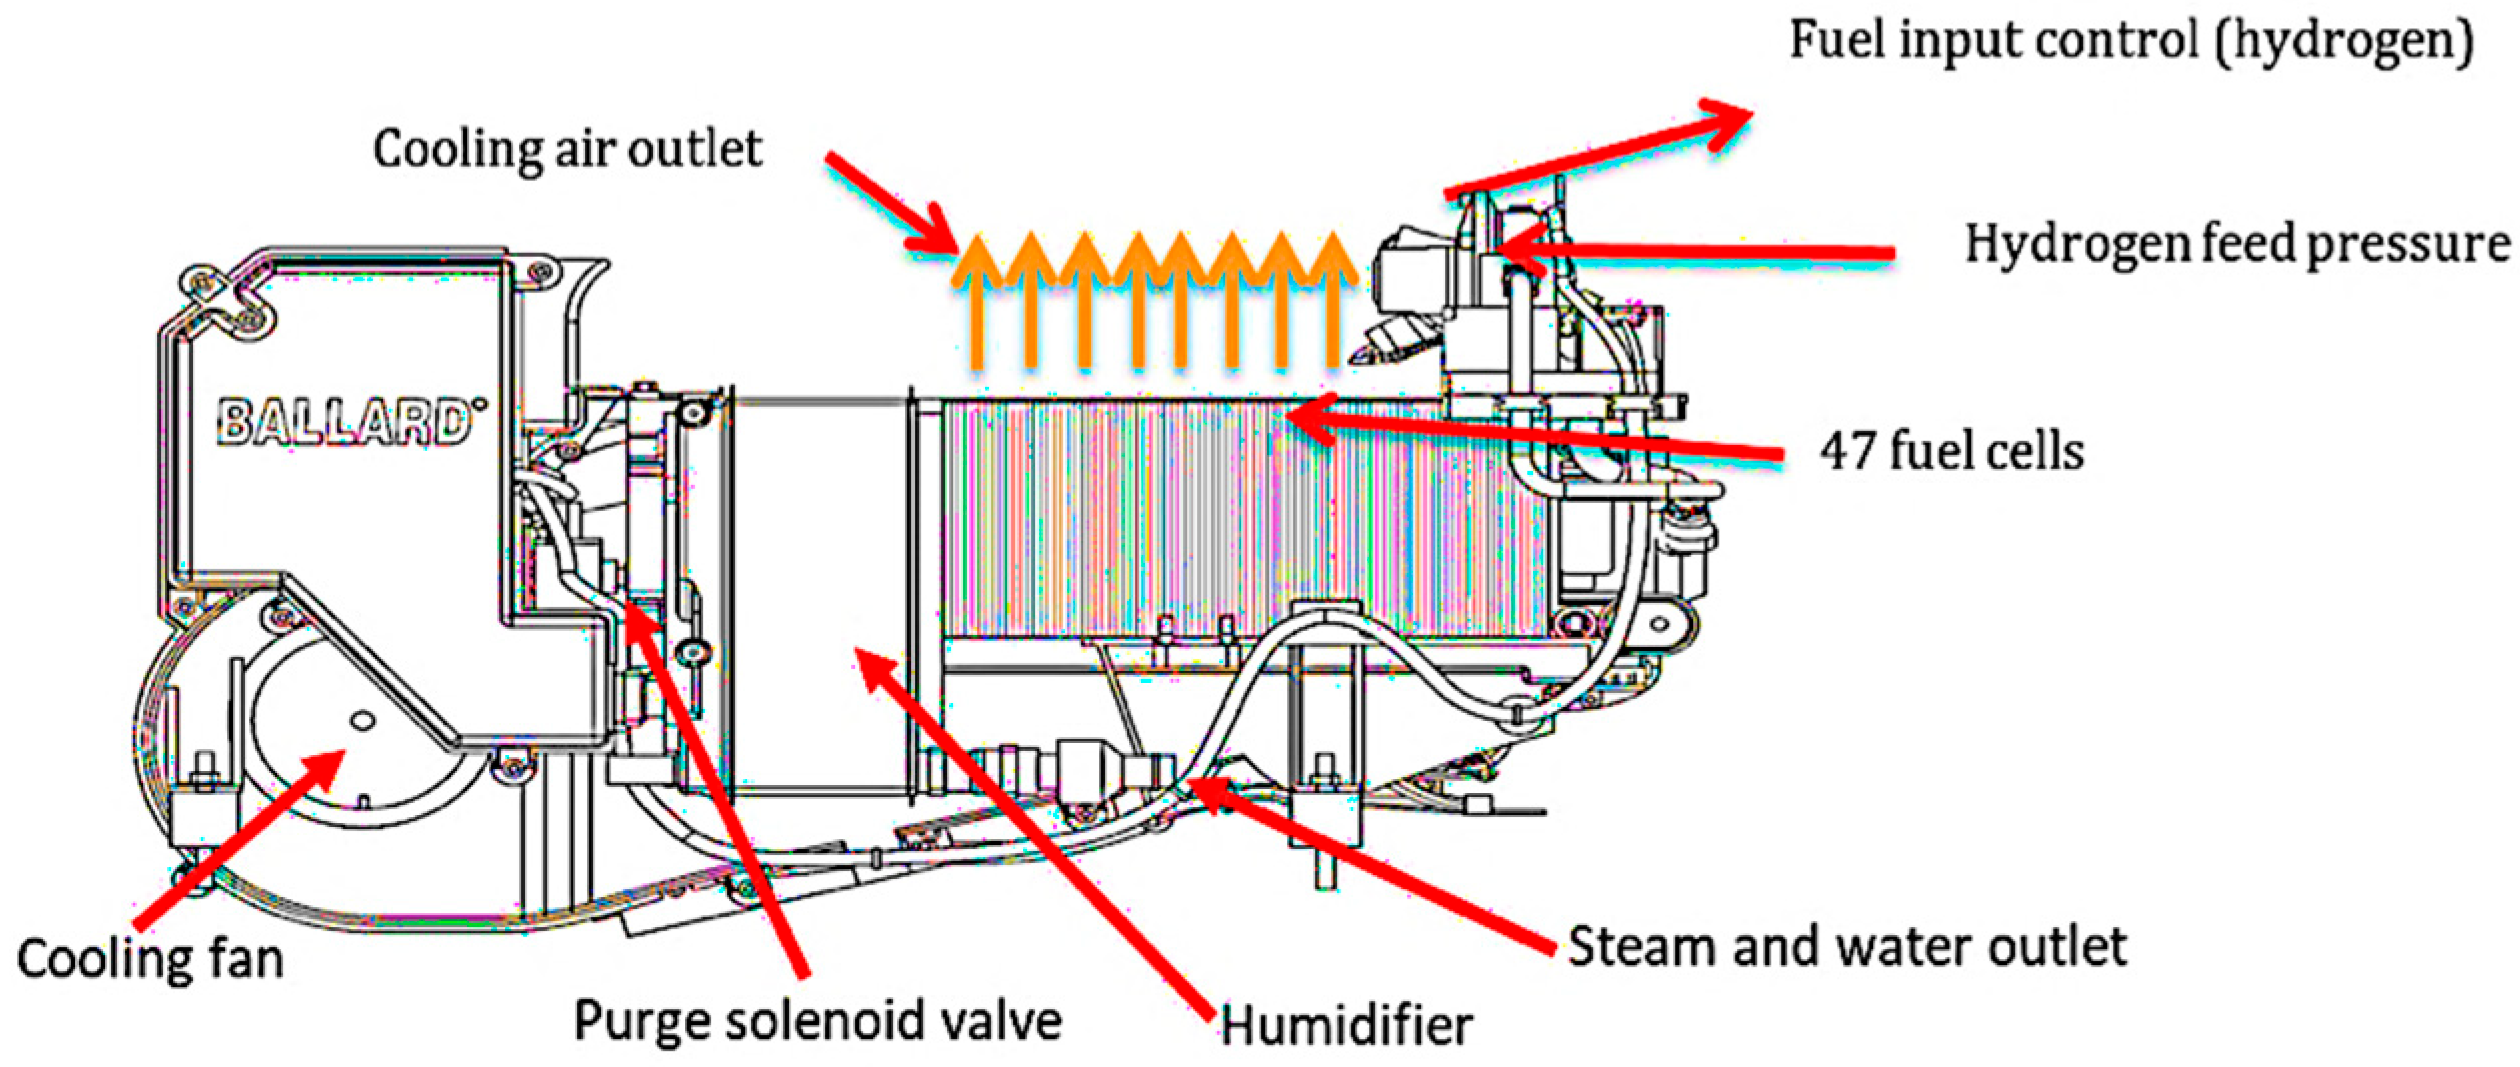
Figure 1. Main parts of the hydrogen fuel cell module.
Electrochem 07 00019 g001
Figure 2. Testing laboratory used for the experiment.
Electrochem 07 00019 g002
Figure 3. Flowchart of an experiment with constant scale loads.
Electrochem 07 00019 g003
Figure 4. Flowchart of experiment with variable step loads.
Electrochem 07 00019 g004
Figure 5. Transient response of the stack current and voltage in the start-up sequence (status codes: 0 (idle); 1 (start-up); 2 (normal operation).
Electrochem 07 00019 g005
Figure 6. Transient response of current and voltage (Vc) in 47 cells, for the start-up sequence (status codes: 0 (idle); 1 (start-up); 2 (normal operation)).
Electrochem 07 00019 g006
Figure 7. Stack voltage and current behavior in the stack shutdown sequence (2-normal operation, 4-stop sequence, 0-sleep).
Electrochem 07 00019 g007
Figure 8. Voltage and current behavior of each of the 47 cells during the battery shutdown sequence. (2-normal operation, 4-stop sequence, 0-idle).
Electrochem 07 00019 g008
Figure 9. Transient response of the stack voltage and current when applying two load steps (12.5 and 22.5 A) The yellow circle highlights the transient voltage spike associated with the charging and discharging of the double-layer capacitances at the electrode–electrolyte interface.
Electrochem 07 00019 g009
Figure 10. Transient voltage response in each of the 47 cells of the Nexa Ballard 1.2 kW battery for 10 and 20 A steps.
Electrochem 07 00019 g010
Figure 11. Transient voltage response in a cell when applying 5 and 10 A steps.
Electrochem 07 00019 g011
Figure 12. Monitoring stack and ambient temperatures when applying two load steps (13 and 23 A).
Electrochem 07 00019 g012
Figure 13. Stack temperature response to load steps (13 and 23 A).
Electrochem 07 00019 g013
Figure 14. Temperature response in stack cells to load steps. It is represented in the graph as (T1, T11, T23, T2, T34 and T47) which corresponds to the number or position of the cell in the stack.
Electrochem 07 00019 g014
Figure 15. Transient voltage response in cells when applying 7 load steps. The red circle highlights the transient overvoltage and subsequent voltage drop that occur immediately after a sudden increase in current demand.
Electrochem 07 00019 g015
Figure 16. Transient voltage response in cells applying 7 load steps. It is represented in the graph as (vc1 to vc47) which corresponds to the number or position of the cell in the stack.
Electrochem 07 00019 g016
Figure 17. Stack voltage and current behavior under load variation without stops.
Electrochem 07 00019 g017
Figure 18. Transient response of current, stack voltage and purge status in non-stop charging operation.
Electrochem 07 00019 g018
Figure 19. Effects of purge on stack voltage during constant load (2 A). The gray circle indicates the voltage increase after the purge operation, from 40.19 V to 40.49 V, reflecting a temporary improvement in fuel cell performance due to the removal of accumulated water and impurities.
Electrochem 07 00019 g019
Disclaimer/Publisher’s Note: The statements, opinions and data contained in all publications are solely those of the individual author(s) and contributor(s) and not of MDPI and/or the editor(s). MDPI and/or the editor(s) disclaim responsibility for any injury to people or property resulting from any ideas, methods, instructions or products referred to in the content.