Article

Insights into the Interpretation of the Electrochemical Results in HLM||Graphite Lithium-Ion Cells and Understanding of the Degradation Mechanisms


by
Imanol Landa-Medrano
1,*,
Ane Muguruza-Sánchez
1,2,
Khryslyn Arano
3,
Galyna Kvasha
1,
Pamela C. Smecellato
1,
Susan Sananes-Israel
1,
Elixabete Ayerbe
1,
Hans-Jürgen Grande
1,4,
Irina Profatilova
3 and
Iratxe de Meatza
1
1
CIDETEC, Basque Research and Technology Alliance (BRTA), 20014 Donostia-San Sebastian, Spain
2
Department of Organic and Inorganic Chemistry, University of the Basque Country (UPV/EHU), 48080 Bilbao, Spain
3
CEA, LITEN, DEHT, University Grenoble Alpes, 17 Ave des Martyrs, F-38000 Grenoble, France
4
Advanced Polymers and Materials: Physics, Chemistry and Technology Department, University of the Basque Country (UPV/EHU), 20018 Donostia-San Sebastian, Spain
*
Author to whom correspondence should be addressed.
Electrochem 2026, 7(3), 18; https://doi.org/10.3390/electrochem7030018
Submission received: 25 May 2026 / Revised: 2 July 2026 / Accepted: 13 July 2026 / Published: 15 July 2026

Abstract

High lithium and manganese oxides (HLMs), also known as lithium- and manganese-rich oxides (LMR), are an alternative to the state-of-the-art (SoA) cathode materials for Li-ion battery cells due to their high specific capacity, working potential, and potential elimination of cobalt from their composition. Nevertheless, they are claimed to undergo accelerated capacity and potential fade. In this work, an extensive electrochemical characterization is conducted while revisiting the most relevant literature on HLM. The classical galvanostatic cycling is used to conduct differential voltage and incremental capacity analyses, while impedance spectroscopy and galvanostatic intermittent titration techniques are applied to complement this test. The results are complemented with online electrochemical mass spectrometry and postmortem characterization. Loss of anode active material is identified as the main degradation mechanism, aggravated by potential slippage. Moreover, the hypotheses on degradation mechanisms are further confirmed by changing the voltage cutoffs of the cells, limiting the Li2MnO3 activation. The results are benchmarked with SoA LiNi0.8Mn0.1Co0.1O2-based cells with a promising balance for HLM in some cases. This work serves as a guide to assist in the interpretation (and avoid misinterpretation) of the results with Li-ion batteries consisting of HLM electrodes.

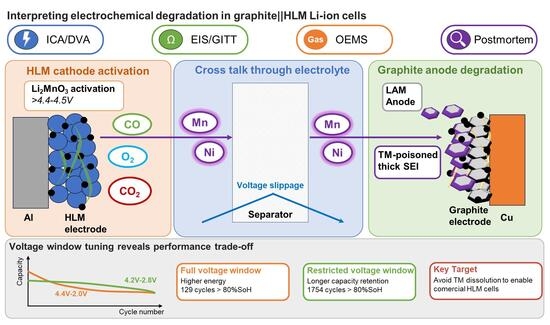
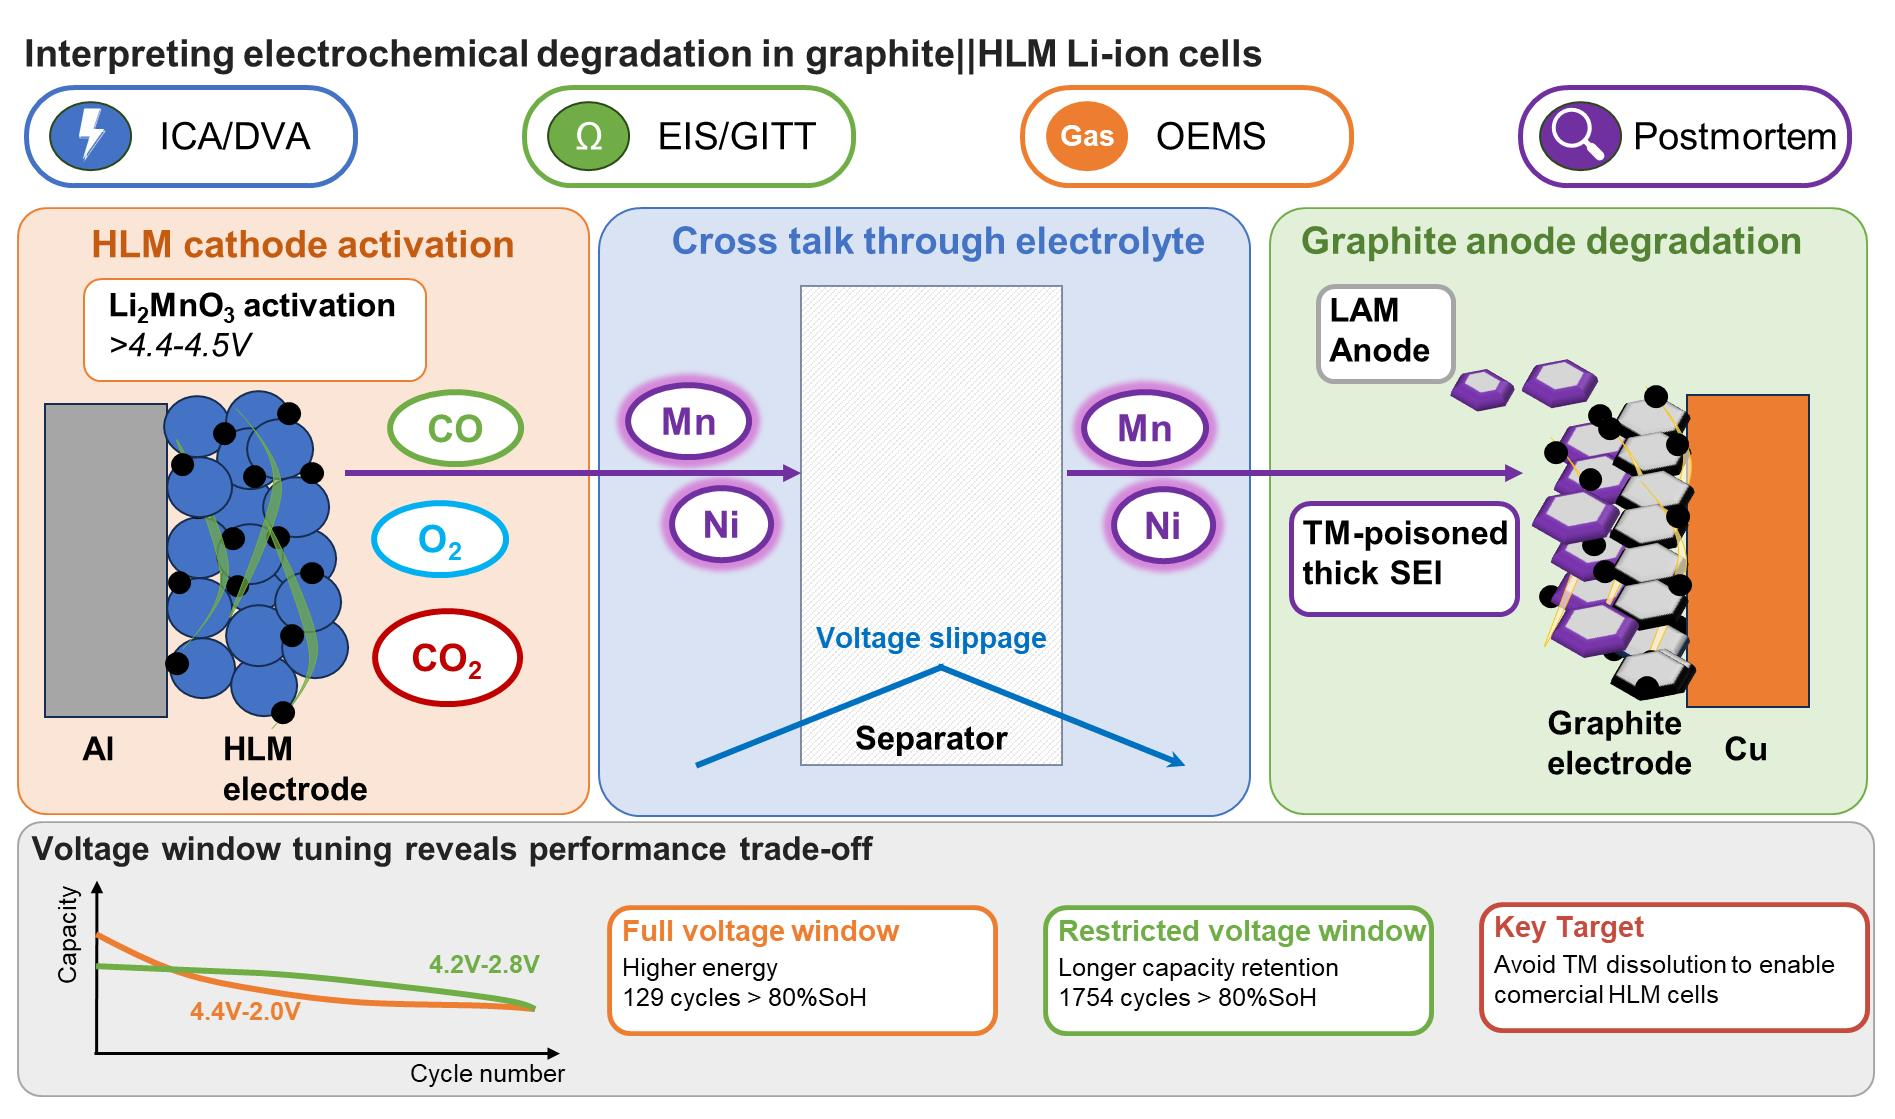
Graphical Abstract

1. Introduction

The development of high-energy-density lithium-ion batteries (LIBs) has facilitated the definitive market reception of electric vehicles [1]. Even though challenges such as low driving range, slow charge, and cost are nowadays less problematic than a few years ago, there is still room for improvement. Currently, most of the electric vehicles in the market are powered by LIBs consisting of LiFePO4 (LFP) or LiNixMnyCozO2 (NMC, x + y + z = 1) cathodes and graphite (plus silicon or silicon suboxide, SiOx) anodes [2,3,4,5]. LFP is a cheap, safe, and robust material; it provides extraordinarily stable cycling performance, and its use has grown significantly in recent years [5]. The main drawbacks are its low electrical conductivity, specific capacity, and working potential [6,7]. In the trade-off between (i) energy density and (ii) cycling stability/safety/cost, LFP is still the first choice of many cell makers and electric vehicle manufacturers [5]. Conversely, NMC can provide higher working voltage and specific capacity, particularly by increasing the Ni fraction in its composition [6,7]. Nevertheless, such an increase in Ni also decreases the cycling stability and safety of NMC [6,7]. Furthermore, despite efforts to minimize its content, NMC still contains Co, which, apart from being a critical raw material, is mined under suspicious ethical conditions [6]. NMC and LFP are the two sides of the same coin: the drawbacks of LFP are the advantages of NMC, and vice versa.
In this context, high lithium and manganese oxide (HLM), also known as lithium- and manganese-rich oxide (LMR) or lithium-rich manganese oxides (LRMOs), emerges as an interesting alternative to NMC. The layered oxide structure of NMC is the baseline for HLM: it consists of a super-structure with Li2MnO3 and the layered LiNixMnyCozO2 subcomponents [8]. In fact, it is usually referred to as LiuNixMnyNizO2, with u > 1 and x + y + z < 1, or aLi2MnO3·bLivNixMnyCozO2, where a and b are the balance between the two subcomponents [8]. This overlithiated composition allows surpassing the specific capacity of NMC, while it also works at a higher potential, therefore providing higher energy density [9,10]. Furthermore, by minimizing the Ni content and avoiding Co, the resulting material can be cheaper (if mass-produced) and more democratic (both in terms of mining ethics and global distribution of Mn). However, all that glitters is not gold: overall, the implementation of HLM has been hindered due to its low cycling stability, high impedance rise, and voltage fade [11,12].
In more detail, Li2MnO3 is activated above the typical working potential of NMC, ideally producing electrochemically active MnO2 [13]. MnO2 is a conversion-type material explored in the literature as an anode in LIBs that can be reversibly reduced to Mn and Li2O between 0.2 V and 0.5 V vs. Li/Li+ [14]. In parallel, the redox activity of the transition metals (TMs) of the layered structure is usually compensated by the lattice oxygen (anionic) redox activity, allowing an extensive lithium extraction during HLM charging [9,15]. However, this activation also promotes irreversible oxygen loss, affecting the structural stability of HLM [9,15]. O2− in the crystal structure is initially oxidized to O2, which ideally is trapped in the voids of the HLM particles and reduced in the subsequent discharge [16]. Nevertheless, the increase in the size of the voids and particle cracking with the number of cycles is promoted, and O2 is stored in these larger voids or released, becoming more difficult to reduce or even electrochemically inactive [16]. Thus, oxygen redox is desirable to boost the capacity of HLM, but it causes oxygen evolution (loss), leading to material degradation, gas formation, electrochemical deterioration, and safety issues. This degradation mechanism accelerates some other mechanisms, such as the transition from a layered to a spinel-like structure, Li/Ni cation mixing, and TM dissolution and migration to the anode due to the Jahn–Teller effect [9,17,18].
Several strategies have been developed up to now to mitigate the degradation reactions. Particle coating [17,19,20] and doping [21,22,23] have been popular routes up to now [24]. Particle surface is a relatively simple and effective strategy to limit the interaction of the electrolyte with the particle defects and minimize the interacting areas, limiting the oxygen evolution, TM dissolution, and the propagation of defects [25]. Conversely, introducing foreign elements (dopants) into the bulk of the HLM can hinder degradation by selecting cations that tend to occupy the tetrahedral sites of the crystal structure, blocking these sites for the TM, and therefore inhibiting the structural modification leading to cation mixing, spinel formation, and oxygen evolution [26]. On the other hand, Yu et al. [10] further elucidated that Li migration from the TM to the Li layers facilitates reversible charge compensation, effectively suppressing structural degradation while maintaining an O2 framework. The degradation in HLM-based cells can also be mitigated by working on the morphology of the cathode active material (CAM). Yang et al. [27] evidenced that the oxygen redox activity and evolution were influenced by the particle morphology when comparing primary and short-rod grained morphologies, which was attributed to the different transport properties. Furthermore, Wei et al. [28] compared the cycling performance of single-crystal (lower surface area) and polycrystalline (higher surface area) HLM, with the former overperforming the latter due to the lower exposure to electrolyte. Zhou et al. [29] deliberately increased the configurational entropy of lithium-rich oxides (LRO), enhancing the overall thermodynamic penalty for in-plane, out-of-plane, and continuous migration of Mn ions. The superstructure loss was mitigated, delaying the local structure degradation upon cycling. Moreover, Qiu et al. [15] evidenced the negative thermal expansion of the oxygen redox-active materials due to dynamic disorder–order transitions. By controlling oxygen redox activity, they could decrease thermal expansion, thus minimizing the structural disorder. In fact, it was possible to restore the initial structure by changing the upper cutoff voltage (UCV) after some galvanostatic cycles.
This work aims to serve as a guide to interpreting the electrochemical results when working with HLM-based cells. A wide range of electrochemical experiments has been coupled with materials characterization, and the results are critically cross-checked with the literature. Loss of anode active material (LAManode) is identified as the main degradation mechanism, even though massive solid electrolyte interphase (SEI) formation and voltage slippage are also detected. The use of different characterization techniques allows for the obtaining of the full picture of the electrochemical reactions and the degradation of the cells. Furthermore, it provides a methodology to avoid misunderstanding of the results. Cycling with limited voltage windows is used to validate the hypotheses, and the electrochemical results are benchmarked against a state-of-the-art (SoA) LiNi0.8Mn0.1Co0.1O2 (NMC811)||graphite cell in terms of total capacity throughput and energy density, highlighting the potentialities of the HLM-based LIBs. The novelty of this work lies in the integration and interpretation of the experimental results obtained by different methods rather than in the methodology itself, and is supported by the literature on HLM electrodes.

2. Materials and Methods

2.1. Electrode Production

All the tasks for the HLM electrode production were conducted inside a dry room with a dew point of −50 °C. In this work, HLM electrodes consisted of 94% Li1.15(Mn0.65Ni0.35)0.85O2 (Cellcore®HLM, Umicore, Brussels, Belgium) as the CAM, 1.9% carbon black (CB, C-NERGY Super C65, IMERYS Carbon & Graphite, Paris, France), and 0.1% of single-wall carbon nanotubes (SWCNT, TUBALL 0.4% in NMP, OCSiAl, Luxembourg) as the conductive additives, and 4% poly-vinylidene fluoride (PVDF, Solef® 5130, Solvay, Brussels, Belgium) as the binder. N-methyl pyrrolidone (NMP, Sharlab, Barcelona, Spain) was used as the solvent. The slurry consisted of 100 g of solids, and the solids-to-liquid ratio was 1/0.91. The slurry was prepared by mixing the components in a Speedmixer® (Hauschild, Hamm, Germany) mixer, and it was coated onto a 15 mm-thick aluminum current collector (Hydro, Oslo, Norway) using a doctor Blade (TQC Sheen, Capelle aan den Ijssel, The Nederlands). The coatings were dried in a convection oven at 110 °C for 30 min. The target loading of the coatings was 4.0 mAh cm−2 based on the estimated specific capacity (220 mAh g−1). The coatings were calendered to 2.5 g cm−3 using a table-top calender machine (DPM solutions, Hebbville, NS, Canada). A micrometer (389–271C, Mitutoyo, Kanagawa, Japan) was used to measure the thickness and calculate the density of the electrodes.
Graphite and NMC811 electrodes were produced by CIDETEC CELLS. These consisted of 94% and 95% active materials, respectively. The loading of the cathode was 4.0 mAh cm−2, calculated using 200 mAh g−1 as a reference for the capacity, while its calendering density was 3.0 g cm−3. Graphite anodes were produced with a loading of 4.4 mAh cm−2 (based on a specific capacity of 355 mAh g−1) and a calendering density of 1.4 g cm−3. Among other alternatives, such as graphite and silicon-based component blends, to simplify the interpretation of the behavior of HLM in a full-cell configuration.

2.2. Cell Assembly

The cells in this study were assembled in a dry room (−50 °C dew point). Following previous optimization works, the half coin cells (HCCs) of this work consisted of a working electrode (a disc of 14 mm diameter cut from a HLM, NMC811, or graphite coating), a 50 mm-thick lithium (Albemarle Corporation, Charlotte, NC, USA) counter electrode (a disc of 18 mm diameter), and two separators (one disc of Whatman GF/A, one disc of Celgard H2010) in CR2032-type (Hohsen, Osaka, Japan) cells. On the other hand, CR2025-type (Hohsen) full coin cells (FCC) were assembled with an HLM or NMC811 working electrode (a disc of 16.6 mm diameter), a counter and reference graphite electrode (a disc of 17.7 mm diameter), and a single separator (one disc of Whatman GF/A). The cell cases (CR2025 or CR2032) were selected considering the total stack height. In all cases, 100 mL of electrolyte per cell was used. In the FCCs with a graphite electrode, the electrolyte formulation was 1 mol L−1 lithium hexafluorophosphate (LiPF6) in a mix of ethylene carbonate (EC) and ethyl methyl carbonate (EMC) of 3:7 in volume fraction, plus 2% of vinylene carbonate (VC) by weight (LP572, E-Lyte). For cells without a graphite electrode (i.e., HLM and NMC811 HCC), the same electrolyte without VC was used (LP57, E-Lyte). All the electrodes were dried at 120 °C under vacuum for 16 h prior to the assembly of coin cells. The cell cases were cleaned with ethanol in an ultrasonic bath for 15 min and dried at 60 °C for 1 h, while the separators were dried at 60 °C in vacuum for 16 h.

2.3. Electrochemical Experiments

The experimental protocols with the different cells of the project have been summarized in Tables S1–S5. Three cells (repetitions) were launched per experiment. The error bars in the figures and the ± values in the tables and text refer to the standard deviation among these three samples. Graphite and NMC811 HCCs were cycled between 1.5 and 0.010 V vs. Li/Li+ and 4.3–2.8 V vs. Li/Li+, respectively. The first cycle of the HLM HCC was carried out between 4.8 and 2.0 V vs. Li/Li+, while the rest of the cycles were conducted between 4.6 and 2.0 V vs. Li/Li+. Cathode (HLM and NMC811) HCCs were subjected to one constant current (CC) cycle at 0.05 C (formation cycle). The rest of the cycles were conducted at 0.25 C CC plus a constant voltage (CV) step (termination criteria of 0.05 C or 10 min). The discharges were carried out at 0.1 C, 0.2 C, 0.5 C, 1 C, 2 C, 3 C, 0.1 C, 1 C, 21 cycles at 0.5 C, 0.1 C, and 1 C CC, also including a CV step with termination criteria of 0.05 C or 10 min in all these discharges. The graphite HCCs were subjected to one cycle at 0.05 C, one cycle at 0.1 C, three cycles at 0.33 C, and one final cycle at 0.05 C. Charges were done in CC, while a CV step was included in the discharges (0.025 C, 0.05 C, 3 × 0.1 C, and 0.025 C termination criteria for the different cycles, respectively). Experiments in HCC were conducted for verification purposes, and only some selected cycles with HLM and graphite are shown or discussed in this manuscript.
NMC811 FCCs were cycled between 4.2 and 2.8 V. In the case of HLM FCCs, unless specified, the formation cycle was conducted between 4.6 and 2.0 V, while the rest of the cycles were done between 4.4 and 2.0 V. The testing protocol consisted of a formation cycle at 0.05 C (with charge CV until 0.025 C) followed by three conditioning cycles at 0.1 C (with charge CV until 0.05 C). Afterwards, sequences of 24 cycles at 1 C (with charge CV until 0.33 C) and checkup (CU) cycles at 0.1 C discharge and charge (with charge CV until 0.05 C) were repeated until 80% state-of-health (SoH) was reached, taking the last conditioning cycle as the reference for the SoH determination. Simple CU cycles, used both in NMC811 and HLM FCCs, consisted of a single cycle at 0.1 C (with charge CV until 0.025 C). Extended CU cycles, used only with HLM FCCs, included the same 0.1 C cycle (with charge CV until 0.025 C), after which galvanostatic intermittent titration technique (GITT), cyclic voltammetry, and electrochemical impedance spectroscopy (EIS) experiments were conducted. For GITT, the cells were fully discharged in 5% state-of-charge (SoC) fractions, allowing the cells to rest for 60 min between the discharge steps. After full discharge, this protocol was repeated for the charge. When the cells were fully charged, EIS analysis was conducted. Afterwards, the cells were discharged at 0.1 C, and EIS measurements were conducted at 3.1 V and 2.0 V, and fully charged at 0.1 C, with EIS measurements at 4.1 V and 4.4 V. Finally, cyclic voltammetry experiments were conducted. In these experiments, scans between 2.0 V and 4.4 V were done at 20, 10, 5, and 2 mV s−1 (three scans per scan rate). The assembled cells were characterized in a Basytec Cell Test System potentiostat at 25 °C ± 1 °C controlled by air conditioning. In addition, EIS and cyclic voltammetry measurements were performed in a Gamry Interface 5000TM Potentiostat/Galvanostat/ZRA. Impedance spectra were fitted using Zview software version 3.5f (Scribner LLC, Southern Pines, NC, USA). The maximum error obtained in the fitting of an individual element of the equivalent circuit was 12.7%. EIS scans were performed between 106 and 10−2 Hz (10 points per decade) with a perturbation amplitude of 10 mV at 25 °C ± 1 °C.

2.4. OEMS Measurements

Gas evolution was investigated using Online Electrochemical Mass Spectrometry (OEMS), based on methodologies established in our previous works [30,31]. Cells were assembled in an argon-filled glovebox employing a commercial EL-CELL equipped with a gas inlet and outlet. The working electrode consisted of a 16 mm HLM cathode, while a partially delithiated 17 mm LiFePO4 (dLFP) electrode served as both counter and reference. All potentials were converted vs. Li metal, considering an LFP potential of 3.42 V vs. Li/Li+. The dLFP electrode capacity was adjusted to ensure it remained within its voltage plateau throughout the measurements. This configuration enables selective analysis of gas evolution originating from the electrode, minimizing contributions from the counter electrode and suppressing low-voltage side reactions. A single-layer Dreamweaver separator (18 mm diameter) was used, and 100 µL of 1.3 M LiPF6 in EC was added as an electrolyte. After sealing, the cell was transferred to the OEMS setup. High-purity argon (Ar 6.0) was continuously supplied as a carrier gas through the gas analysis line and through the cell via the gas inlet. The flow was regulated at 1.2 mL min−1 using a digital mass flow controller (Analyt MTC®, Müllheim, Germany). Gaseous species evolved during cycling were transported by the carrier gas through the gas outlet to a Hiden HPR-20 S1000 mass spectrometer, where species were identified according to their mass-to-charge (m/z) ratios. Signals corresponding to O2 (m/z = 32), CO2 (m/z = 44), and CO (m/z = 28) were monitored. Quantitative analysis was achieved by calibration with standard gas mixtures of known composition. The CO signal at m/z = 28 was corrected for a ~10% contribution arising from fragmentation of CO2.
Electrochemical measurements were performed using a Biologic SP-300 potentiostat. The cell was allowed to rest at open-circuit voltage for 6 h to ensure equilibration and establish a stable gas baseline. For the HLM cathode, galvanostatic cycling was then conducted between 2.0 and 4.7 V vs. Li/Li+ at a 0.05 C rate, calculated based on a theoretical capacity of 220 mAh g−1. This initial cycle was followed by subsequent cycles between 4.5 and 2.0 V vs. Li/Li+, first at a 0.05 C rate and then at a 0.1 C rate. The temperature was maintained at 25 °C throughout the experiment.

2.5. Materials Characterization

After reaching 80% of SoH or after the first CU cycle, FCCs were introduced in an Ar-filled glove box (MBraun, Garching bei München, Germany) and disassembled inside ([O2] < 0.1 ppm, [H2O] < 0.5 ppm). The electrodes were cleaned after cell disassembly using dimethyl carbonate (DMC) prior to their post-mortem characterization. Also, HCCs were assembled with some electrodes harvested from the FCC. In this case, the electrodes were not cleaned with DMC. The morphology of the electrodes before and after the electrochemical experiments was analyzed using a field emission scanning electron microscope (FE-SEM, Apreo 2C HiVac, Thermofisher, Waltham, MA, USA). The same instrument was used to detect the presence of transition metals (Ni, Mn) in the graphite electrodes by means of energy-dispersive X-ray spectroscopy (EDX). The influence of the electrochemical experiments on the HLM and graphite crystal structures was analyzed by means of powder X-ray diffraction (XRD), using a Bruker D8 Discover diffractometer (Cu Kα radiation, λ = 0.154 nm) equipped with a LynxEye PSD detector. The diffractograms were recorded between 2θ = 10° and 85° at 0.003° s−1, while the obtained data were fitted using the FULLPROF program [32].

3. Results and Discussion

3.1. Galvanostatic Cycling, ICA, and DVA

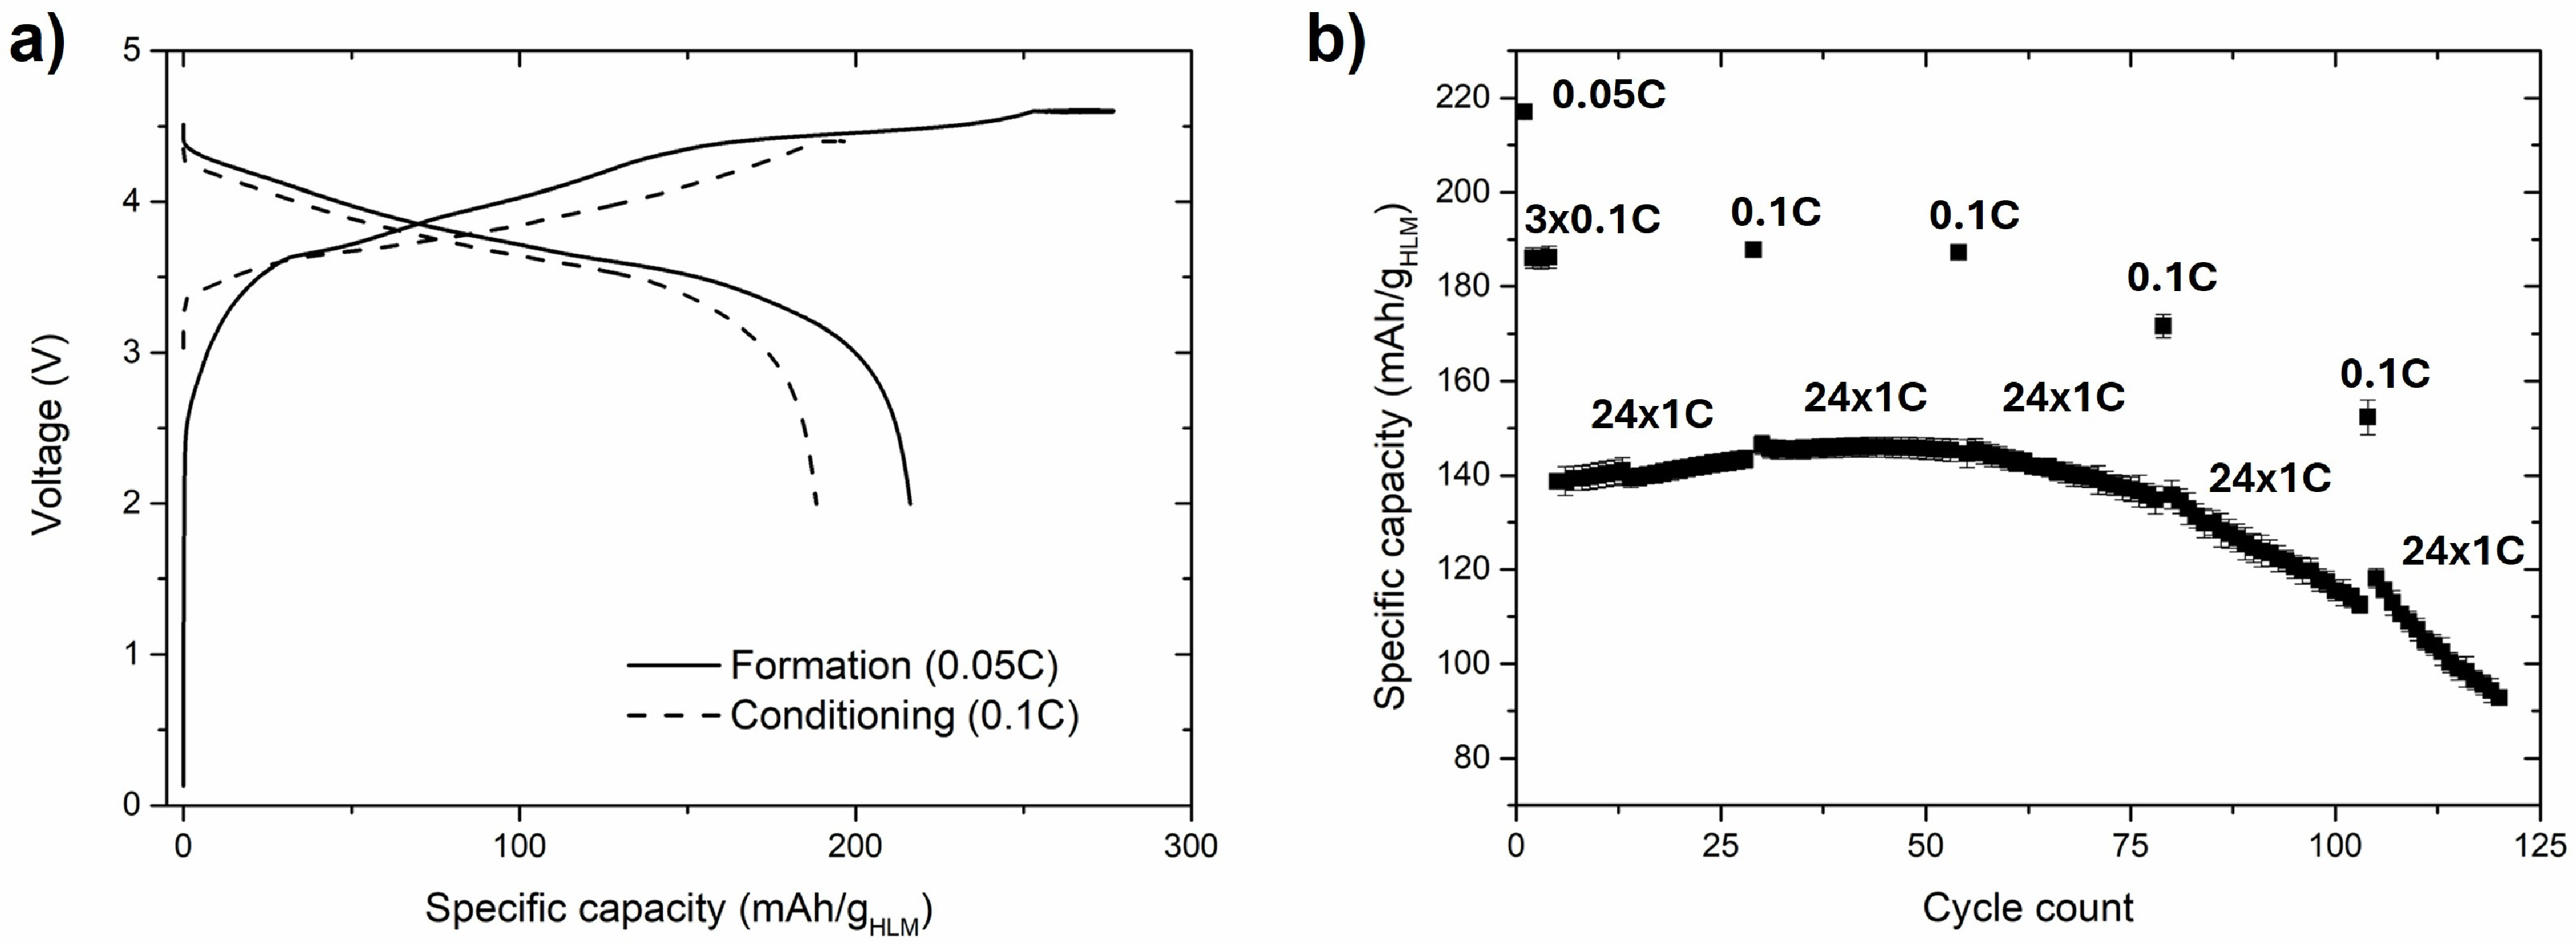
The galvanostatic curves of the formation cycle (0.05 C, 4.6–2.0 V) and the first conditioning cycle (0.1 C, 4.4–2.0 V) are shown in Figure 1a. During the formation, the charge started with a meniscus between 2.5 and 3.5 V, which is attributed to the SEI build-up in the anode, which disappeared in the first conditioning (second overall) cycle. The redox plateaus above this meniscus (between 3.5 and 4.6 V) were dominated by TM redox activity, consisting principally of Ni2+/Ni3+ and Ni3+/Ni4+ redox transitions [12] together with the activation of Li2MnO3 [13]. The lower voltage for these reactions in the first conditioning cycle suggests a successful activation of the HLM material. A decrease in the cell impedance from cycle 2 to cycle 50, as well as a decrease in the lower plateau potential from cycle 3 to cycle 20, was observed by Teufl et al. [33]. This was ascribed to a surface reconstruction of HLM after oxygen release. The charge was finished with a CV step of ~25 mAh g−1HLM for a total first charge capacity of 276.8 ± 1.6 mAh g−1HLM. In the rest of the cycles, the upper cutoff voltage was limited to 4.4 V. Therefore, after the formation cycle, the oxygen redox activity should be avoided (or at least mitigated). The oxygen evolution will be further discussed later in this manuscript. During the discharge, the profile initially showed a sloping plateau down to 3.6 V, followed by a flatter region until 3.1 V. Kipfer et al. [12] evidenced that in the first part of the discharge, the TM redox activity was the dominant process, while the second part increased with increasing Li2MnO3 content of the LMR cathode material. The first discharge delivered 217.0 ± 1.6 mAh g−1HLM, accounting for a first cycle efficiency of 78.4 ± 0.3%. In the second discharge, slight polarization was observed in the discharge, whose origin could be the higher C-rate applied (0.1 C). The discharge capacity decreased to 186 ± 2.2 mAh g−1HLM, and the coulombic efficiency increased to 95.8 ± 0.1%. It is worth mentioning that the cells were charged up to 4.6 V in the formation cycle, while the upper voltage limit was 4.4 V in the conditioning cycles. Both the irreversible reactions and the lower charge voltage limit caused a decrease in the discharge capacity from the formation to the conditioning cycles. The lower efficiency in the first cycle is attributed to the formation of the SEI, which consumes a significant part of the lithium available in the cells, as well as to oxygen evolution and surface reconstruction, which also contribute to irreversible capacity loss. These reactions should occur to a lesser extent in the subsequent cycles. The evolution of the discharge capacity in the cycling tests is represented in Figure 1b. Increasing the C-rate to 1 C resulted in a decrease in the discharge capacity to 138.7 ± 1.5 mAh g−1HLM. Interestingly, the cells exhibited an increase in the discharge capacity at the beginning of life (BoL), reaching a maximum at 1 C of 145.9 ± 2.1 mAh g−1HLM in cycle 45, followed by a stabilization stage and a final abrupt decline in the capacity. At 0.1 C, 187.9 ± 1.5 mAh g−1HLM and 187.3 ± 0.6 mAh g−1HLM were achieved in the first (cycle 29) and second (cycle 54) checkup cycles (see Table S4 for the experimental details). These CU cycles are analyzed in detail in Figure 2.
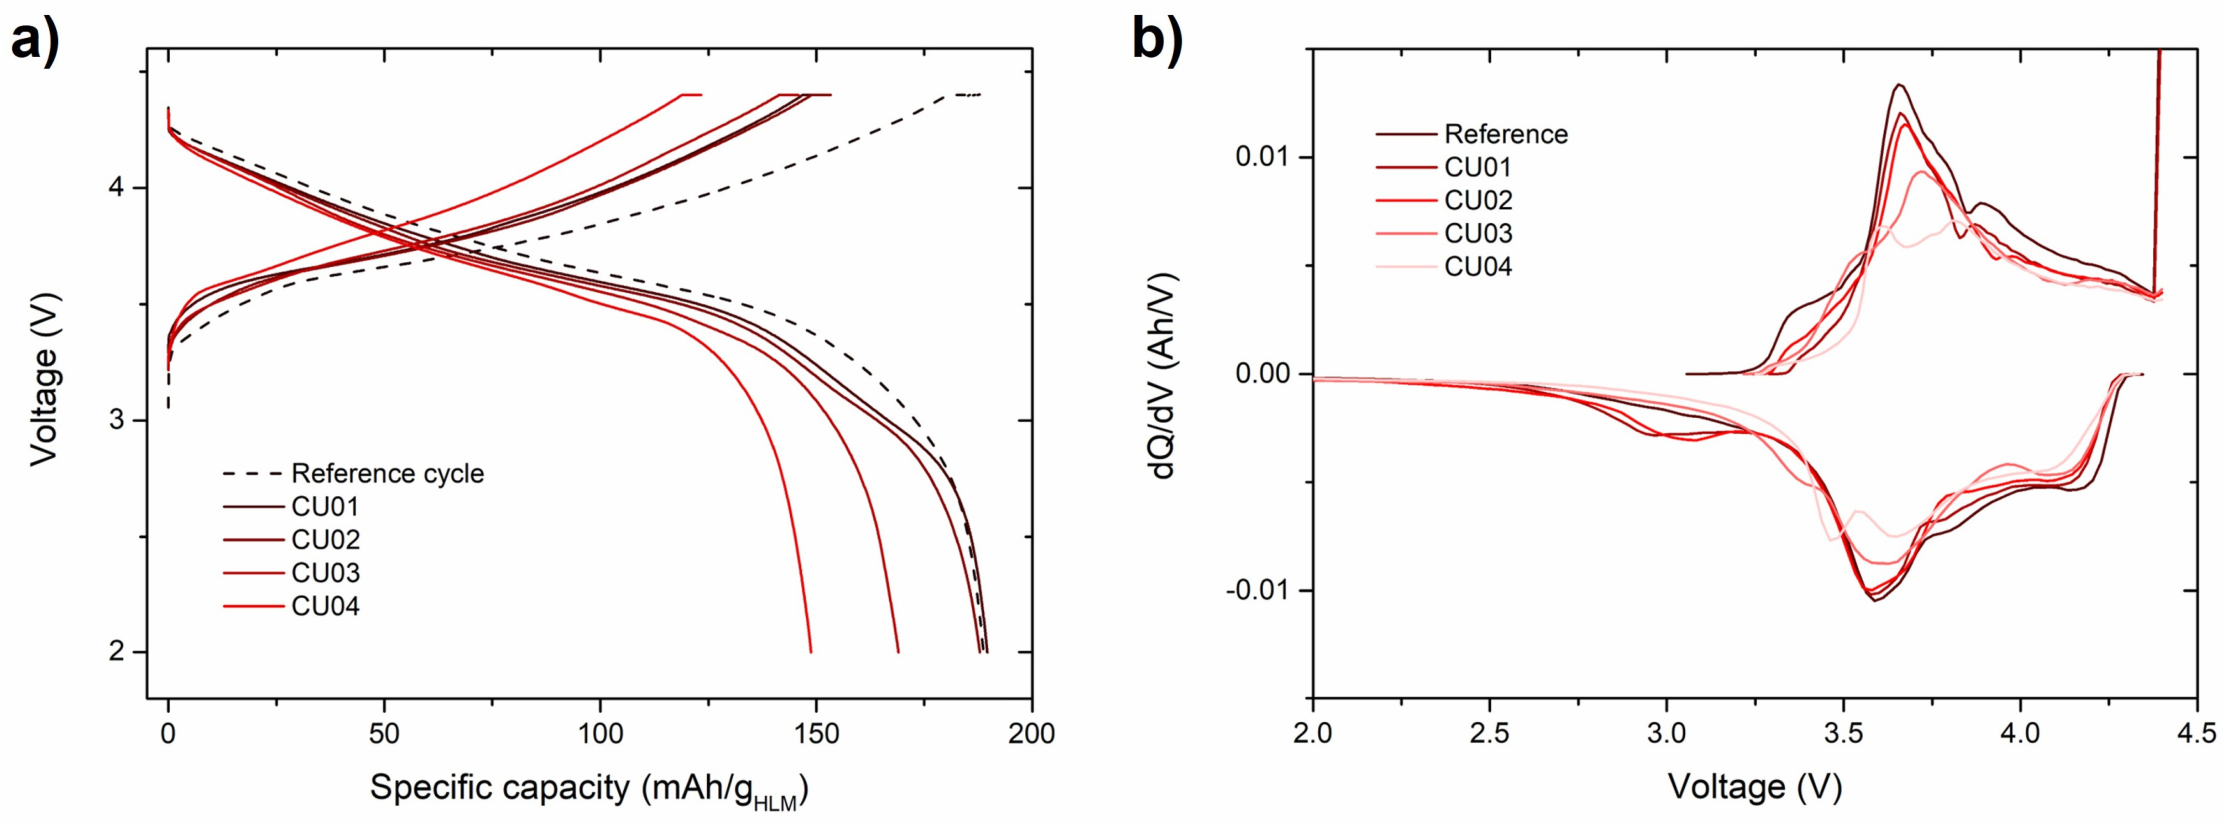
Although the checkup cycles were performed at 0.1 C, the charge capacity was lower than the discharge capacity because they were preceded by a 1 C discharge (Figure 2a). Nevertheless, despite providing a lower capacity, they are more adequate to plot the incremental capacity analysis (ICA) curves in Figure 2b than the 1 C charges because at lower C-rates the polarization effects are minimized. This did not occur for the reference cycle (4th overall cycle, 3rd cycle at 0.1 C in the conditioning stage) because it was preceded by two full cycles at 0.1 C. The main difference in the discharges in Figure 2a is the appearance of an additional meniscus/plateau at ~2.9 V by the end of the discharge for CU01 and CU02, also observed in the HLM HCCs in Figure S1. Thus, it is unequivocally assigned to HLM. Hu et al. [25] reported the activation of the lower-voltage Mn3+/Mn4+ and Co2+/Co3+ due to Li2MnO3 activation. As HLM does not contain any Co, the appearance of this new plateau can be ascribed to the Mn redox activity [13].
Despite the modest increase in polarization with cycling, this additional plateau increased the overall capacity of the cell beyond that in the reference cycle. The plateau at 2.9 V almost disappeared in CU03, while it could not be observed in CU04. This was more noticeable in the ICA of these curves (Figure 2b), with two features in the discharge with a maximum at ~3.0 V for CU01 and CU02, and absent in later CUs. Meanwhile, the main feature in the discharge of the reference cycle, with a maximum at 3.6 V, was kept constant for the first two checkups and decreased in the last two. Conversely, a new feature was observed at 3.3 V and 3.45 V for CU03 and CU04, respectively. The other two main features in the discharge are a peak at 4.2 V and a shoulder at 3.8 V. The shoulder gradually vanished, while the peak was shifted to a lower voltage with an increase in the number of cycles. On the other hand, the ICA curve for the reference charge showed a shoulder at 3.35 V and two peaks with their maxima at 3.65 and 3.85 V. The features at 3.65 V and 3.85 V decreased and were shifted to higher voltages with cycling. The shoulder at 3.35 V disappeared from the reference cycle to CU01, reappeared (with lower intensity) in CU02, and was gradually shifted to higher voltages for CU03 and CU04. Teufl et al. [33] attributed this to the delithiation of the spinel-like structure formed in the surface reconstruction due to oxygen loss.
As mentioned in Section 1, Wei et al. [28] compared the evolution of the capacity fade in single-crystal and polycrystalline LMR by means of ICA. In their work, an increased polarization was observed with cycling. The polarization was lower for the single-crystal LMR due to the mitigated oxygen evolution (loss), leading to a higher capacity retention. However, the ICA curves in that work differ from those in Figure 2b, in which no noticeable polarization is observed at 0.1 C, and the capacity fade was associated with a shortening of the plateaus. The ICA curves of this work are more similar to those reported by Teufl et al. [33], in which the main features remained at almost the same voltage but decreased in intensity, except for the curve of CU04. In this CU04 curve, (i) the shifting of the charge peak originally at 3.35 V to 3.6 V, occupying the area of the main charge peak in the reference cell, and (ii) the shift in the discharge peak originally at 3.0 V to 3.45 V, can give the false idea of the splitting of the main charge and discharge peaks. Thus, the two graphs in Figure 2 can lead to equivocal conclusions, such as the disappearance of the redox activity of Mn after the main discharge plateau or the splitting of the main discharge and charge plateaus if this analysis is limited to comparing only the BoL and the end of life (EoL). To get further information on the degradation mechanism of the cells, the differential voltage analysis (DVA) of HCC and FCC with the HLM cathode is displayed in Figure 3.
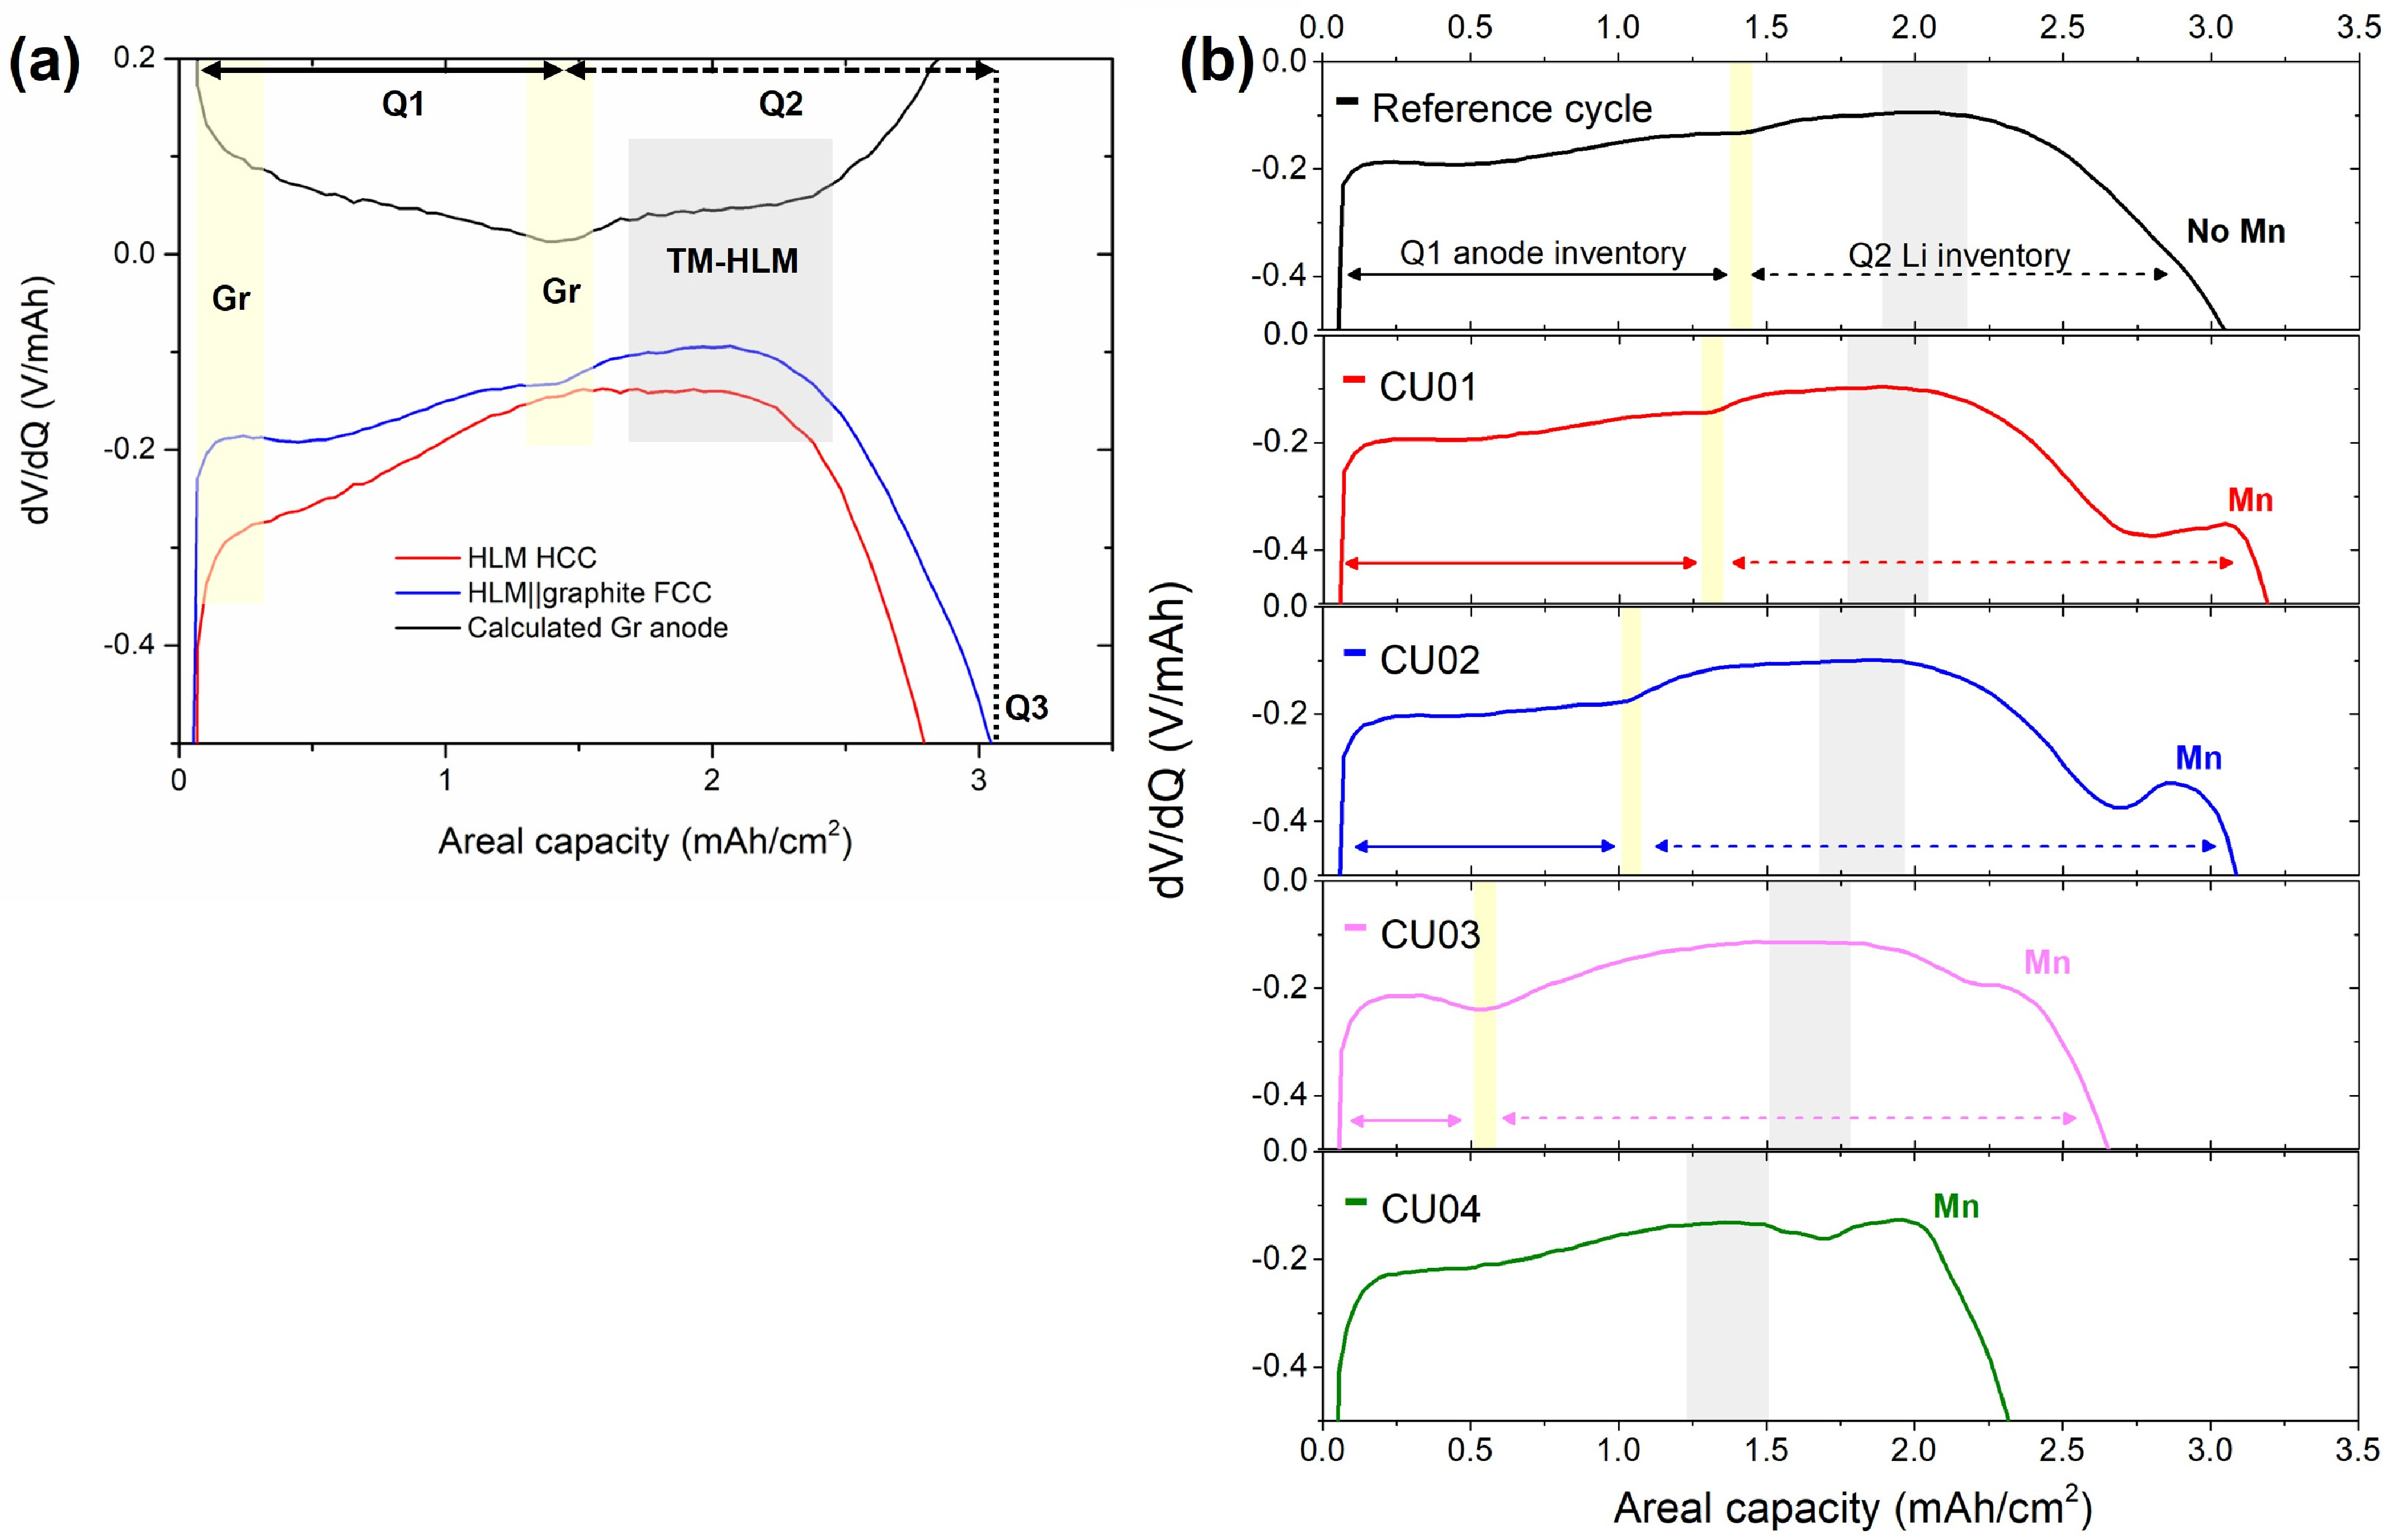
The interpretation of the results has been done based on different works found in the literature [34,35]. Figure 3a compares the DVA of the first 0.1 C discharge in an HLM HCC and an HLM||graphite FCC. The DVA of the graphite anode was calculated by subtracting the curve of the HCC from that of the FCC. The feature at the middle of the discharge of this curve (highlighted in yellow) corresponds to the delithiation of LiC6 to LiC12 and indicates the point at which the anode reaches 50% lithiation. The signal at BoL is also associated with graphite activity. The capacity between 0% SoC and 50% lithiation, labeled as Q1, is ascribed to the anode inventory. The capacity from Q1 to the capacity at the end of the discharge (Q3) is labeled as Q2 and is ascribed to the lithium inventory. Also, a region characteristic of the TM redox contribution is highlighted in gray. Nevertheless, as already mentioned, the curves used for the DVA analysis in Figure 3a correspond to the first 0.1 C discharges, where the redox activity of Mn (labeled as “Mn”) is not yet activated. To illustrate this, Figure S2 compares the DVA of the 1st and the 8th discharge of the same cell, both at 0.1 C. An additional contribution between 2.7 and 3.0 mAh cm−2, ascribed to Mn activity, appeared at the end of the discharge after 8 cycles. The Mn redox activity upon cycling is clearly visible in Figure 3b, where the DVA of the discharges of an HLM||graphite FCC at different stages of the cycle life are compared. As already discussed, the Mn redox activity caused an increase in the discharge capacity at the BoL, but Q3 decreased by the EoL. By analyzing Q1, Q2, and the features ascribed to the HLM cathode and the anode, it is possible to determine the cause of the capacity loss. Mn can be detected after 25 cycles and shifted to lower areal capacities with cycling, while the capacity of this peak remained almost constant until the EoL. Present since the BoL, the TM redox activity was also shifted to lower capacities and consisted of the same total capacity, discarding loss of cathode active material (LAMcathode) as the main degradation mechanism. Furthermore, it suggests that the hypothetical disappearance of the Mn redox activity in Figure 2b is not real, and the new features appearing close to the main discharge feature in this peak were not caused by the splitting of two contributions, but due to the shift in the Mn redox activity to higher voltages: 3.30 V and 3.45 V for CU03 and CU04, respectively. From REF to CU01, there was an increase in Q2 due to the activation of Li2MnO3 (Mn redox activity), leading to an increase in lithium inventory. After this point, it was kept almost constant until the EoL, evidencing negligible variation in the lithium inventory. Conversely, the feature associated with half-lithiation of graphite was shifted to a lower areal capacity and was not detectable in CU04. Q1 was shortened progressively, pointing to LAManode as the dominant degradation mechanism. The feature at low SoC, also ascribed to the anode activity, decreased with the number of cycles. This is in good agreement with the poisoning of the negative electrode with TMs as the cause of the capacity fade of the full cells with HLM cathodes, as evidenced by Peralta et al. [36]. These results have been complemented with the evolution of the voltage after the resting periods after discharge, and the evolution of the galvanostatic profiles at 1 C discharge, as widely discussed in Figure S3.

3.2. OEMS

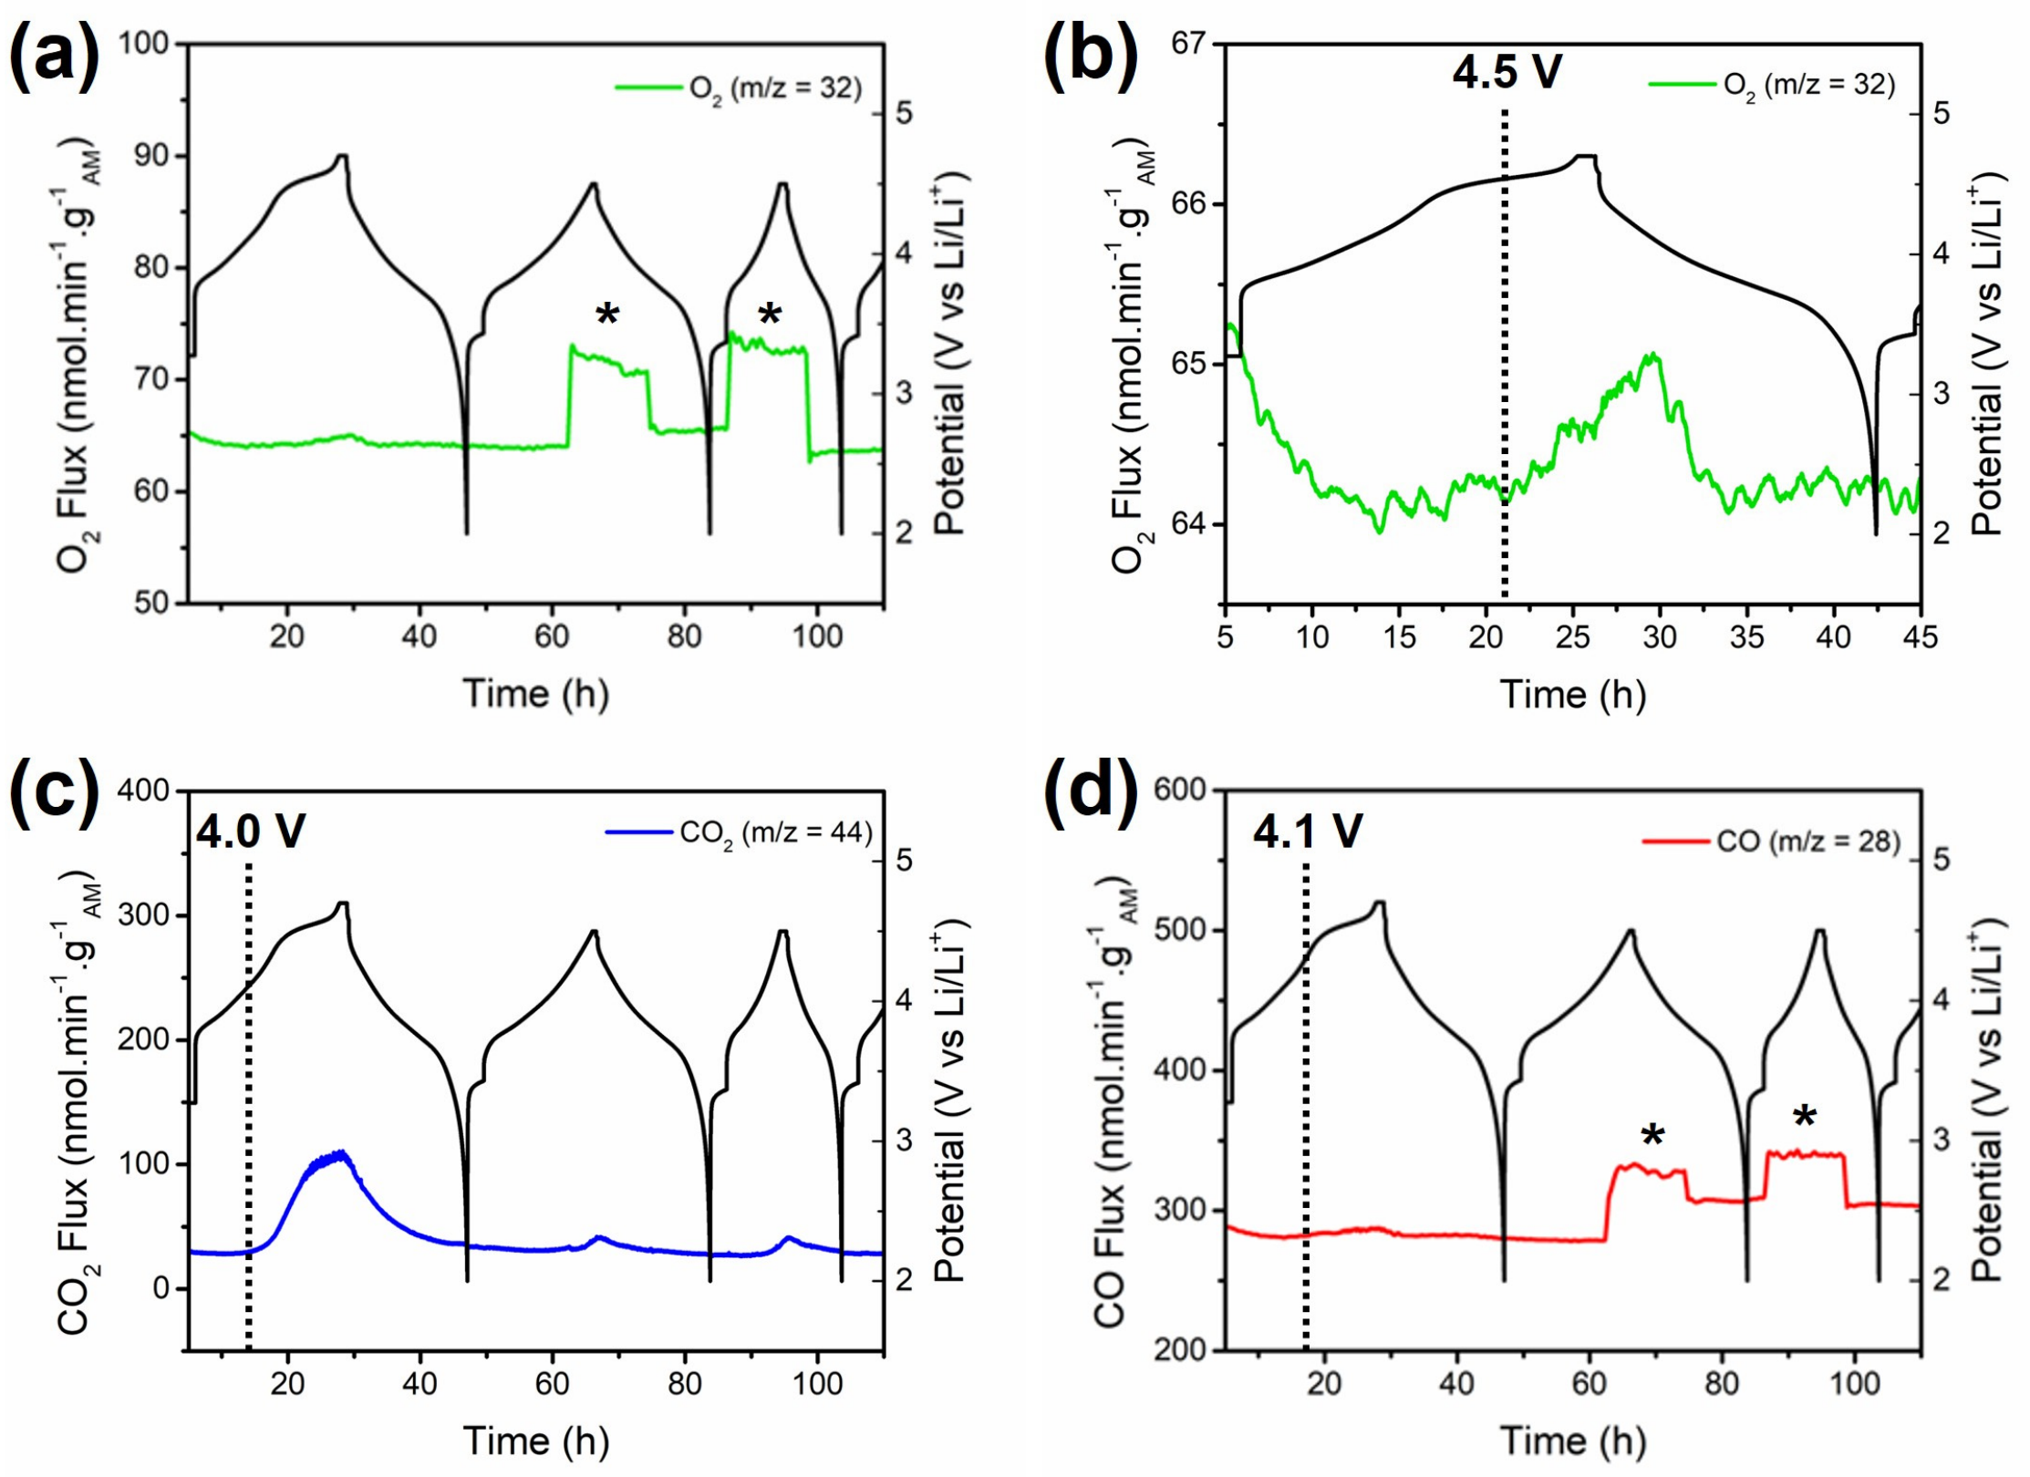
It was interesting to investigate the stability of the HLM material towards gas release during cycling (i) to understand the acceptable voltage window for cycling of a LIB containing this active material and (ii) to assess its possible degradation pathways. To this end, OEMS analysis was performed to confirm the phenomenon of oxygen evolution from the HLM cathode by following the m/z = 32 signal. The electrochemical performance associated with the OEMS experiment is illustrated in Figure S4a, showing a classic first charge profile of the layered oxide cathodes. A voltage plateau appears at ~4.5 V, as shown by the prominent oxidation peak on the corresponding ICA curve in Figure S4b. For this cell, a first charge capacity of 245 mAh g−1HLM was reached, with a first cycle efficiency (FCE) of 79.5%. These values are slightly lower compared to those for the HLM HCC (262 mAh g−1HLM and 82.0%, respectively). These differences were attributed to the lower upper voltage potential (4.7 V in the OEMS method vs. 4.8 V in HCC). In fact, the capacity at 4.7 V vs. Li/Li+ was 249.7 mAh g−1HLM for HCC. As shown in Figure 4a,b, oxygen release begins at an onset potential of approximately 4.5 V, consistent with prior reports on layered cathode materials. Following this onset, the signal increases sharply as the potential approaches the 4.7 V cutoff. After reaching this upper limit, a slight additional buildup was observed before the evolved oxygen was gradually evacuated from the cell and gas line during discharge. The total amount of evolved oxygen is 0.37 µmol·g−1HLM in the first cycle (Figure 4b), which is lower than values typically reported for lithium-rich layered oxide materials, commonly in the range of tens of µmol g−1 [37,38,39], depending on composition and test conditions. The found value of 0.37 µmol·g−1HLM is consistent with reported oxygen release by NMC-based positive electrode materials with varying Ni content cycled up to 4.8 V vs. graphite (ca 0.3 µmol·g−1NMC) [40]. Considering the composition of the active material in this work, the Li1.15(Mn0.65Ni0.35)0.85O2 structure is not dominated by Li2MnO3 domains. Consequently, oxygen release, typically associated with the activation of Li2MnO3 [41], is strongly suppressed. Furthermore, Mn-rich oxides exhibit stronger Mn-O covalent/ionic bonding compared to Ni-rich systems. This raises the energy required to oxidize O2- to molecular O2, making oxygen release thermodynamically and kinetically unfavorable during the first charge. Finally, assuming a surface reconstruction depth of 3 nm based on literature data [37] and the Brunauer–Emmett–Teller (BET) surface area of 0.98 m2 g−1, the experimentally observed oxygen release represents roughly less than 1% of the theoretical upper limit upon conversion of a surface layer of MO2 to MO, indicating the absence of bulk or extended surface collapse. The oxygen evolution likely concerns a minor fraction of the active material particle surface sites. In parallel, the m/z = 44 signal was tracked to monitor CO2 evolution, one of the most abundant gaseous species released in LIBs. The onset of CO2 evolution occurs at approximately 4.0 V, preceding that of oxygen. This earlier onset is attributed to the decomposition of residual Li2CO3 on the surface of the active material. Furthermore, lattice oxygen release can further promote the formation of CO2 through chemical oxidation of EC [42,43]. After the first cycle, CO2 evolution persists into the second and third cycles but with significantly lower intensities, as shown in Figure 4c. This means that minor electrolyte oxidation at high voltage can contribute to the overall aging of a battery containing HLM active material when the positive electrode reaches a 4.5 V cutoff. The amount of CO2 released is 67.2 µmol g−1HLM, 5.1 µmol g−1HLM, and 4.5 µmol g−1HLM in cycle 1, cycle 2, and cycle 3, respectively. In addition to O2 and CO2, the formation of CO (m/z = 28) was also followed during the experiment. As shown in Figure 4d, a small CO peak appears during the first cycle, amounting to 3.0 µmol g−1HLM, with an onset potential at 4.1 V. Since the amounts of evolved CO2 and CO are very low at a cut-off of 4.5 V vs. Li/Li+ (4.4 V vs. graphite), and a large excess of the electrolyte used, the electrolyte consumption at high voltages cannot be the main reason for the capacity fade observed for the cells cycled up to 4.2 V and 4.4 V vs. graphite in this study.
In conclusion, the HLM material investigated demonstrates important potential for practical implementations in real-life Li-ion batteries due to very limited oxygen release from its structure upon activation and negligible upon cycling. However, attention should be paid to the adjustment of the upper voltage cutoff limit for the positive electrode to be below 4.5 V vs. Li/Li+ (4.4 V vs. graphite) since oxidation of carbonate-based electrolyte is observed in these conditions, leading to accumulation of decomposition products in the cell.

3.3. Electrochemical Impedance Spectroscopy

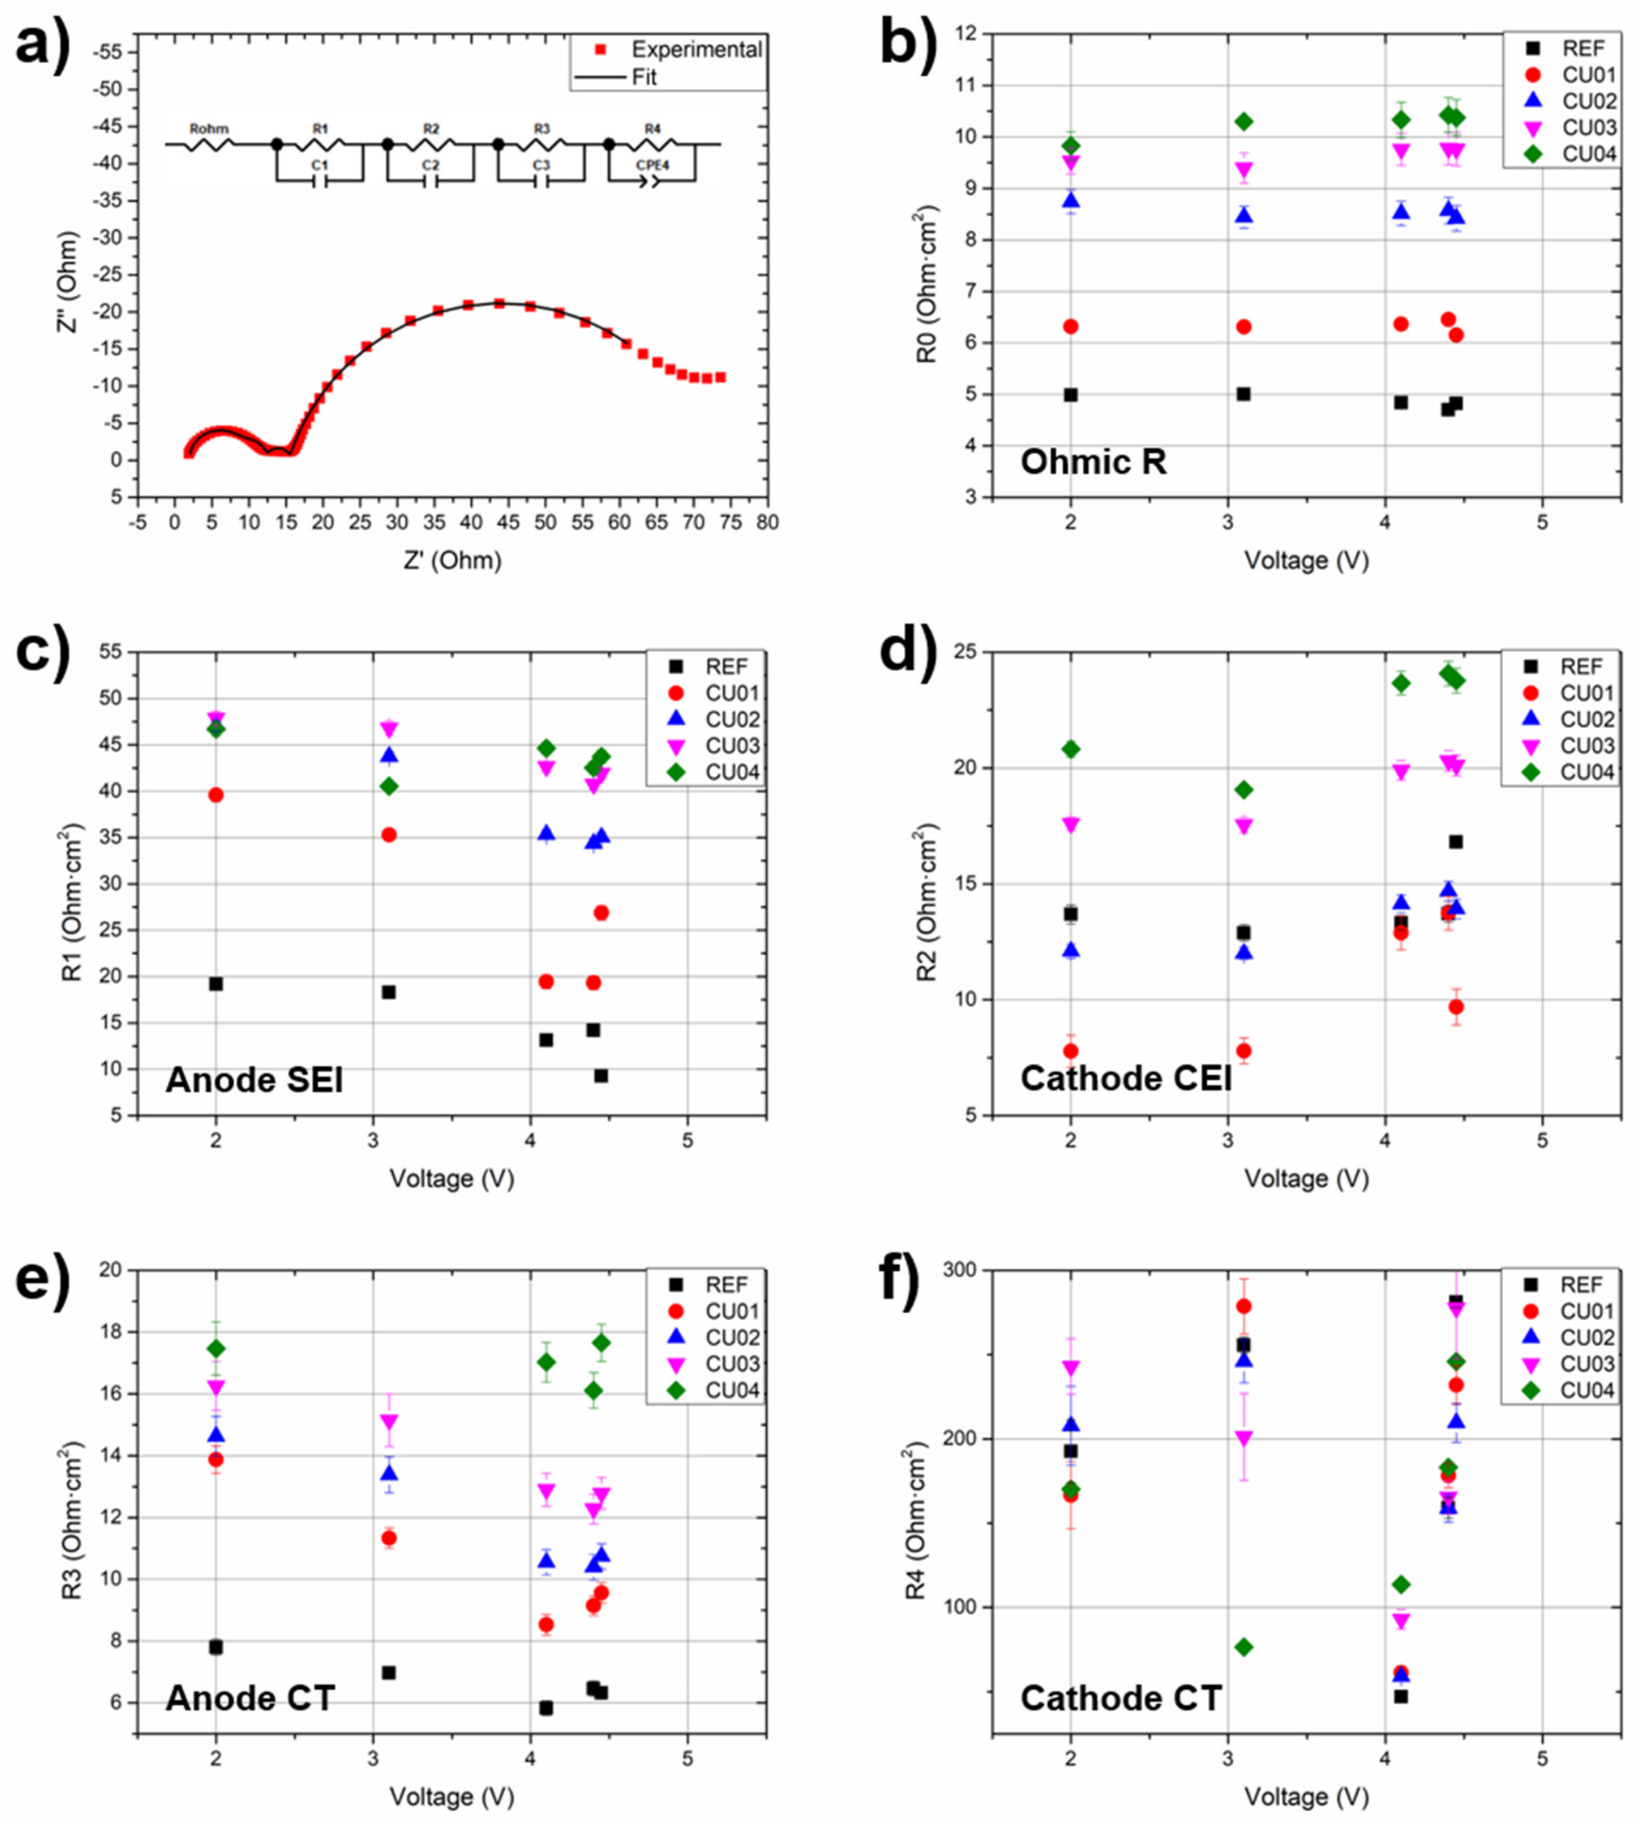
To further explore the evolution of the different components, EIS analyses were conducted at different voltages during discharge (first point at 4.4 V with a CV step, then 3.1 V, and finally at 2.0 V) and during the following charge (4.1 V and 4.4 V). The results are displayed in Figure 5.
Figure 5a shows an example of the Nyquist diagrams obtained in the different EIS analyses. It consisted of two main depressed semicircles with an intermediate valley. The equivalent circuit used for fitting, included as an inset, was proposed based on previous assignments reported in the literature [34,44]. The intercept of the spectra on the x-axis was assigned to the ohmic resistance, R0, mainly related to the electrolyte resistance. The high-frequency semicircle was fitted with two parallel R-C in series (R1 and R2). R1 was ascribed to the SEI of the anode, while R2 was assigned to the surface layer generated on the surface of the HLM cathode (cathode electrolyte interphase, CEI). The intermediate valley and the semicircle at the lowest frequency were assigned to the anode and the cathode charge transfer resistances, respectively. The anode charge transfer resistance was fitted using a resistance (R3) and a capacitor in parallel, while a constant phase element (CPE) was used in parallel with a resistance (R4) for the cathode. A diffusion element is usually included at the lowest frequencies, which is represented in the Nyquist diagram as a tail [45]. In this work, the lower frequency limit selected (10−2 Hz) was not low enough to obtain sufficient data to analyze the diffusion processes. A decrease in the lower frequency limit was discarded due to excessive measurement time. To be able to analyze the diffusion coefficient, cyclic voltammetry experiments were conducted. More details on these experiments can be found in Figure S5. The diffusion coefficient ranged between 1.81·10−17 (BoL) and 3.14·10−18 cm2 s−1 (EoL), lower than those in the literature, usually between 10−13 and 10−14 [22,24]. The reason for the lower values obtained could be the high areal loading or the use of full cells in this work. The evolution of R0 has been represented in Figure 5b: R0 increased with cycling, attributed to a gradual reaction of the electrolyte. For a given checkup cycle, R0 remained stable at the different voltages, suggesting that the resistance increase is mainly accumulated during long-term cycling rather than within a single cycle. Conversely, the increase in the anode SEI and cathode CEI resistances was not constant for the same cycle. R1 (SEI resistance, Figure 5c) decreased with increasing SoC. In the full-cell charge, graphite anodes are lithiated and volumetrically expanded, causing fractures in the SEI and facilitating electrolyte permeation. This is in good agreement with the decrease in the SEI resistance observed with increasing SoC. Conversely, R1 decreased after the CV stage in the reference cycle, while it increased after this stage in the checkups. The DVA in Figure 3b already shows a decrease in the anode capacity from the reference to the checkup cycles. In this context, lithium could be plated instead of intercalated, leading to an increase in the double-layer resistance. When opening the coin cells at their EoL, the glass fiber separator was stacked on the anode, which could be indicative of some lithium plating (Figure S6). Nevertheless, this lithium could not be detected by means of XRD or FE-SEM. XRD analysis (Figure S7) revealed the presence of highly crystalline graphitic carbon (graphite active material) and less crystalline graphite carbon black (CB). Also, the reflections corresponding to the copper current collector were visible, but no lithium or other lithium-based compounds (such as carbonate) could be detected. FE-SEM and EDX analysis of the anode after 29 and 129 cycles (Figure S8) revealed massive SEI generation in the negative electrode after 129 cycles (EoL). Graphite particles of ~20 mm observable after 29 cycles (Figure S8a) were not visible anymore at the EoL (Figure S8b). In addition, both coatings were fragile and peeled off from the current collector (in fact, the collector is not present in the cross-section images in Figure S8b,f). The anodes cycled until the EoL were cracked (Figure S8f). Both Mn and Ni were detected after cycling to 29 and 129 cycles Figure S8c,d,g,h). Cross-section EDX mapping of the anode after 29 cycles revealed that both transition metals could be found in the electrode side exposed to the separator, while their concentration was significantly lower (almost undetectable) in the rest of the electrode (Figure S8c,d). After 129 cycles, Mn and Ni concentrations were also the highest on the anode side exposed to the cathode, but they were more easily observable in the rest of the electrode. The Ni content measured by EDX was kept almost constant from cycle 29 to cycle 129 (17–25% as maxima), while the maximum concentration of Mn rose significantly (from 16% to 61%), evidencing continuous Mn dissolution, migration, and deposition. The total atomic concentration of Ni and Mn in the EDX mapping after 29 cycles was 0.5% and 0.9%, respectively, and they increased to 7.4% and 15.6% after 129 cycles. The SEI resistance increased with cycling (R1, Figure 5c), in good agreement with the massive SEI observed at the EoL in Figure S8e,f. This SEI could be catalyzed by the TMs [46].
CEI resistance (R2, Figure 5d) decreased from the reference cycle to CU01, increasing almost linearly in the subsequent checkups. Teufl et al. [33] observed a decrease in the first cycles attributed to the vacancies formed due to the oxygen evolution. However, they reported that after several cycles, this outer layer is gradually converted to a resistive spinel-like structure. For the same checkup cycle, R2 increased when charging from 4.1 V to 4.4 V, but the value was lower than after the CV stage. Since more oxygen evolution would be expected with increasing SoC, the results would be in good agreement with newly created oxygen vacancies. However, OEMS measurements did not show any oxygen evolution after the formation cycle (Figure 4). On the contrary, some CO2 evolution was observed, which was attributed to the elimination of residual Li2CO3 from the surface of the HLM. This could be the cause of the decrease in the interphase resistance of HLM at the BoL. XRD was conducted on the HLM cathode at three different stages of the cycle life: in the pristine state, after cycling for 29 cycles, and at the EoL (Figure S9), the latter two discharged to 2.0 V before cell opening. Three different phases were included in the fitting of the diffractograms: the a-NaFeO2 crystal structure typical of the layered oxides (Electrochem 07 00018 i001 space group), the characteristic honeycomb-like superstructure originating from the Li2MnO3 (C2/m space group), and the contribution of the CB in the cathode (P63mc space group) [8,47]. As can be observed, only the pristine sample kept the reflection at 2θ = 20.7°, typical of the Li2MnO3 superstructure, evidencing the (at least partial) consumption of this component even at the BoL, in good agreement with other works [15]. No peaks associated with spinel-like structure could be detected in the diffractogram of the EoL sample. In any case, this was expected since XRD is not sensitive enough to detect nanometer-scale layers formed from surface reconstruction [32]. In addition, the intensity ratio between the (003) and the (104) peaks, at 2θ = 18.6 and 44.4°, respectively, was kept almost constant from the pristine electrode (1.46) to that cycled for 129 cycles (1.56), evidencing negligible Li+/Ni2+ mixing [48]. Furthermore, FE-SEM images of the cathodes (Figure S10) did not reveal any surface reconstruction, additional fracture, or modification. There were some fractured HLM particles in all the samples, including the pristine, attributed to the calendering of the electrodes. The original morphology of HLM, i.e., spherical particles formed by smaller secondary particles, was kept stable upon cycling. Teufl et al. [33] highlighted the need for powerful characterization techniques such as high-resolution transmission electron microscopy to characterize the surface variation in HLM electrodes. Nevertheless, such characterization is beyond the scope of this work.
The charge transfer resistance of the anode (R3, Figure 5e) also increased with the number of cycles, consistent with the LAManode identified by DVA. For a given cycle, R3 decreased with increasing SoC, as expected for progressive graphite lithiation. In contrast, the cathode charge-transfer resistance, R4, did not show a simple trend with cycling (Figure 5f). During charge (2.0 V → 4.1 V → 4.4 V → 4.4 V CV), the resistance decreased from 2.0 V to 4.1 V and significantly increased above 4.1 V. In this range, TMs are supposed to be oxidized while delithiated, and above 4.1 V, these oxidation reactions are combined with the Li2MnO3 redox activity, which causes a rearrangement of the crystal structure [15]. These reactions seem to cause an increase in the charge transfer resistance. In the discharge from 3.1 V to 2.0 V, the charge transfer resistance decreased at the BoL, while it started to increase in CU03 and significantly increased in CU04. At the BoL, Mn redox reactions are activated, and there is electrochemical activity below 3.1 V. On the contrary, this activity was not present anymore below 3.1 V in the last two checkups (Figure 2), as it was shifted to higher voltages. Additionally, the R4 values at 4.4 V + CV and 3.1 V were similar in the reference and the first two checkup cycles, and decreased in the last two. Thus, there was a minimum in R4 at 3.1 V. Considering this, the SoC (i.e., lithiation) of the HLM cathode at 3.1 V might not be the same throughout the cycle life of the cells. As can be observed in the charges between 4.1 V and 4.4 V, R4 was dependent on the lithiation degree of HLM, and it has been evidenced that the HLM potential was shifted to a higher cell voltage with the number of cycles. Thus, this could be the reason behind the change in the trend between 3.1 V and 2.0 V observed for the last CUs. Overall, the interpretation of the EIS data is not straightforward since the evolution of the cathode double-layer resistance (R2) is unexpected (a decrease in the beginning and an increase afterwards), and the charge transfer resistance (R4) evolution of the cathode is affected by the voltage slippage. As previously mentioned, several assignments of impedance components rely on literature assumptions. A more accurate method to unequivocally conduct this assignment is to build symmetrical cells with electrodes obtained from FCC at different SoC and SoH. Nevertheless, this work aimed to provide a guide to interpreting the electrochemical response of the HLM||graphite cells, and such an extended experimental procedure is out of the scope of this work.

3.4. GITT

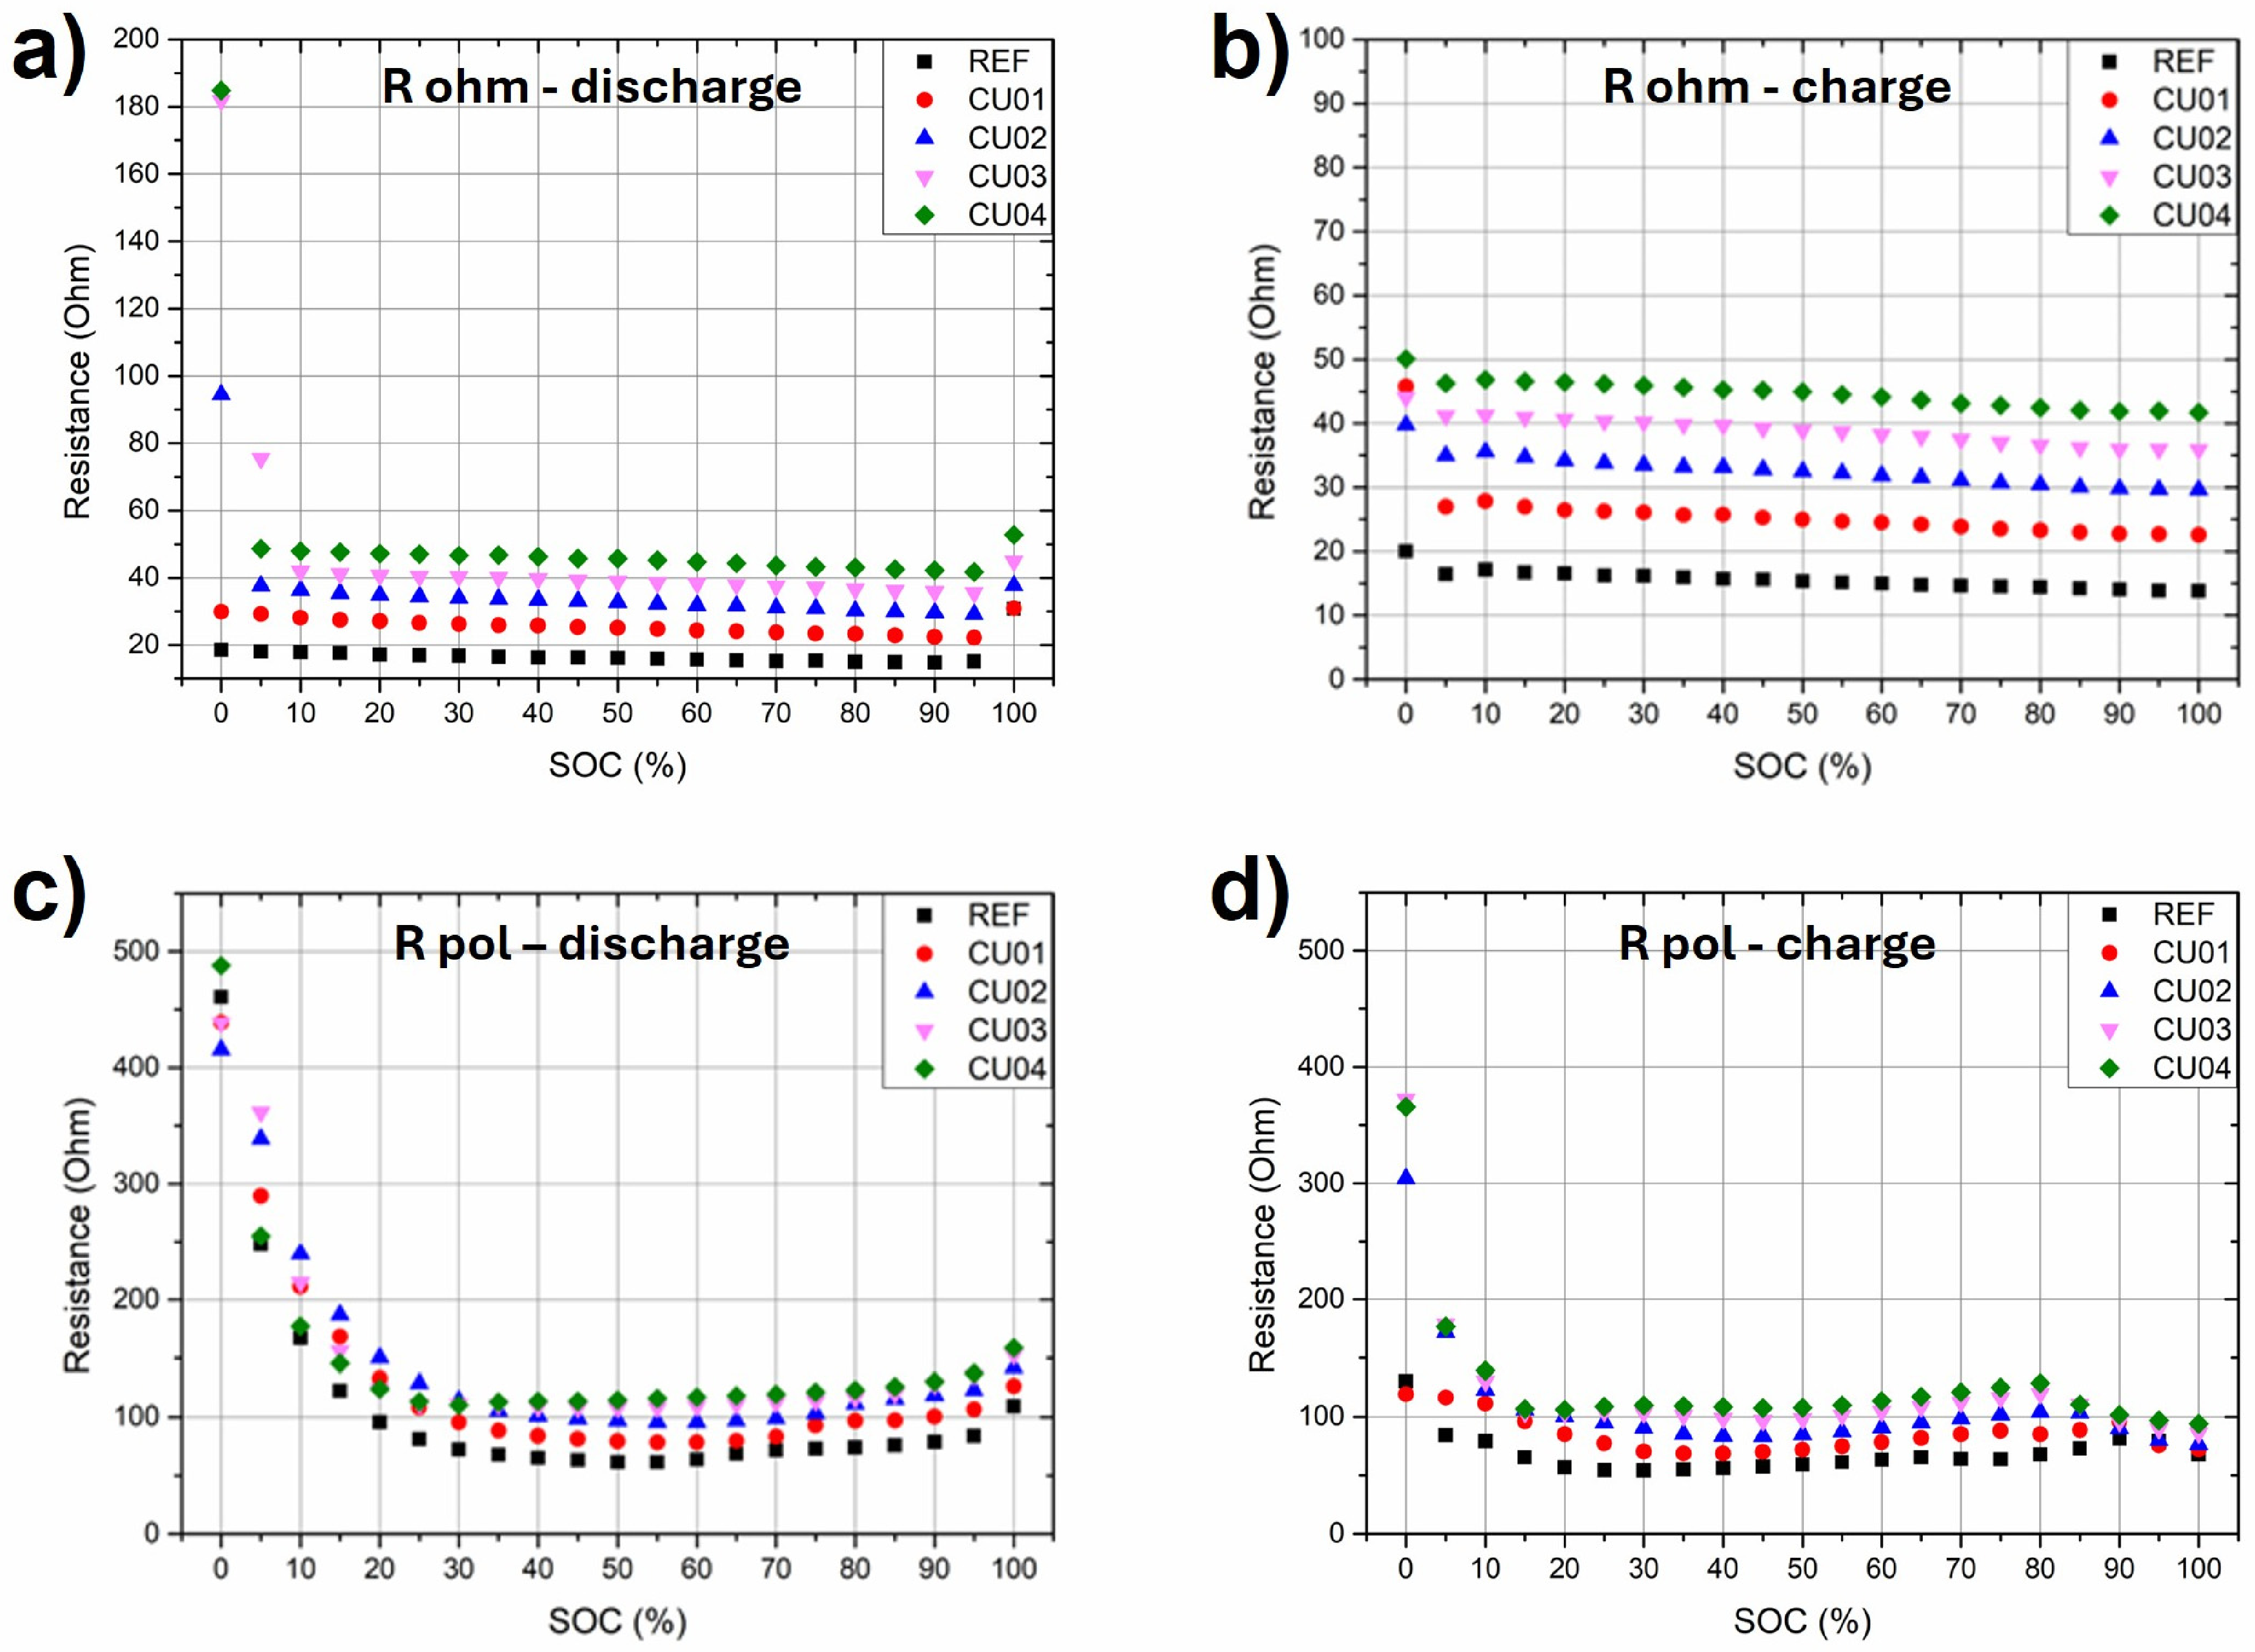
GITT experiments were performed to track the evolution of the resistance of the cells at every 5% SoC (Figure 6). This complements the EIS experiment at fixed voltage values. The GITT experiment in CU02 is included as an example in Figure S11.
The ohmic (Rohm) and polarization (Rpol) were calculated based on the works by Kim et al. [49] and Ryll et al. [50]. Rohm, attributed to the pure electric resistance, was obtained from the voltage difference during the first 2 ms of the pulse. On the other hand, Rpol, consisting of the diffusion and the charge transfer resistance and attributed to the electrochemical reactions, was calculated from the voltage difference after 6.7 s. During discharge (from 100% to 0% SoC, Figure 6a), Rohm was higher at both the high and low SoC values and increased with cycling. This is in good agreement with an increase in the electrolyte degradation, as observed by EIS. The increase of 0% SoC during the cycle life was significantly pronounced. The origin of this increase could be the dissolution of TMs after full discharge, considering the progressive increase in the voltage of the Mn redox plateau with increasing cycle count. During charge (Figure 6b), Rohm was already significantly lower after the 1 h rest after the last full discharge and decreased gradually with increasing SoC. The resistance values increased during the cycle life of the cells, confirming the progressive build-up of irreversible cell resistance.
Rpol was also the highest at the lowest SoC (Figure 6c), in good agreement with the increase in the resistance of the electrochemical reactions (lithiation of HLM, delithiation of graphite) with decreasing SoC [20]. Between 25% and 5% SoC, CU02 and CU03 showed the highest Rpol values, coinciding with the strongest low-voltage Mn plateaus in the lowest voltage range. Voltage slippage would explain the lower resistance values for CU04 in this SOC range, since the Mn redox activity had already shifted to a higher voltage. Above 30% SoC, Rpol was higher with increasing the number of cycles, consistent with an increased resistance to the electrochemical reactions with increasing the cycle count (expected with the progressive LAM). Rpol decreased with the SoC during charge (Figure 6d) once the CV step was achieved. This is in good agreement with Li2MnO3 evolution (consumption) dominating the CV step, creating vacancies and promoting charge transfer and diffusion.

3.5. Discussion on Voltage Slippage

Voltage slippage has been punctually mentioned in different stages of the manuscript, and the authors believe that this topic deserves a focused subsection. Voltage slippage was mainly evidenced by the progressive displacement of Mn-related redox features during cycling. In the discharge ICA curves, the Mn-associated peak initially appeared at ~3.0 V in CU01 and CU02, but shifted to ~3.30 V in CU03 and ~3.45 V in CU04. This corresponds to an accumulated shift of approximately +450 mV for this redox contribution. Similarly, in charge, the feature initially located at ~3.35 V shifted to ~3.6 V, corresponding to an additional shift of approximately +250 mV. Therefore, the voltage slippage in these HLM||graphite cells is not a uniform displacement of the full profile but a redox-specific displacement, particularly affecting the Mn-related contribution activated after Li2MnO3 involvement.
DVA supports this interpretation by showing that the Mn contribution does not disappear during cycling. Instead, it shifts in capacity/voltage space while retaining approximately constant capacity. Thus, the apparent loss of the Mn feature in ICA is not caused by loss of cathode active material, but by the displacement of this contribution to a different voltage region. This distinction is important because a simple BoL/EoL comparison could incorrectly suggest either the disappearance of Mn redox activity or the splitting of the main redox peaks.
The voltage slippage also affects the interpretation of impedance data. In EIS, the cathode charge-transfer resistance R4 does not follow a simple aging trend because measurements performed at the same full-cell voltage do not necessarily correspond to the same HLM lithiation state throughout cycling. As the HLM potential shifts during aging, fixed-voltage EIS points probe different cathode states of charge. This explains why R4 is especially difficult to assign and why its evolution should not be interpreted as direct evidence of cathode active material loss.

3.6. Cell Assembly with Post-Mortem Electrodes

The results indicate LAManode as the main degradation mechanism and suggest that it might be accelerated by voltage slippage. To further analyze this, three FCC cycled until SoH = 80% were opened inside the glove box, and the electrodes were used to assemble anode and cathode HCCs. These HCCs were cycled with the same testing protocols as the HCC with pristine electrodes. The results are shown in Table 1.
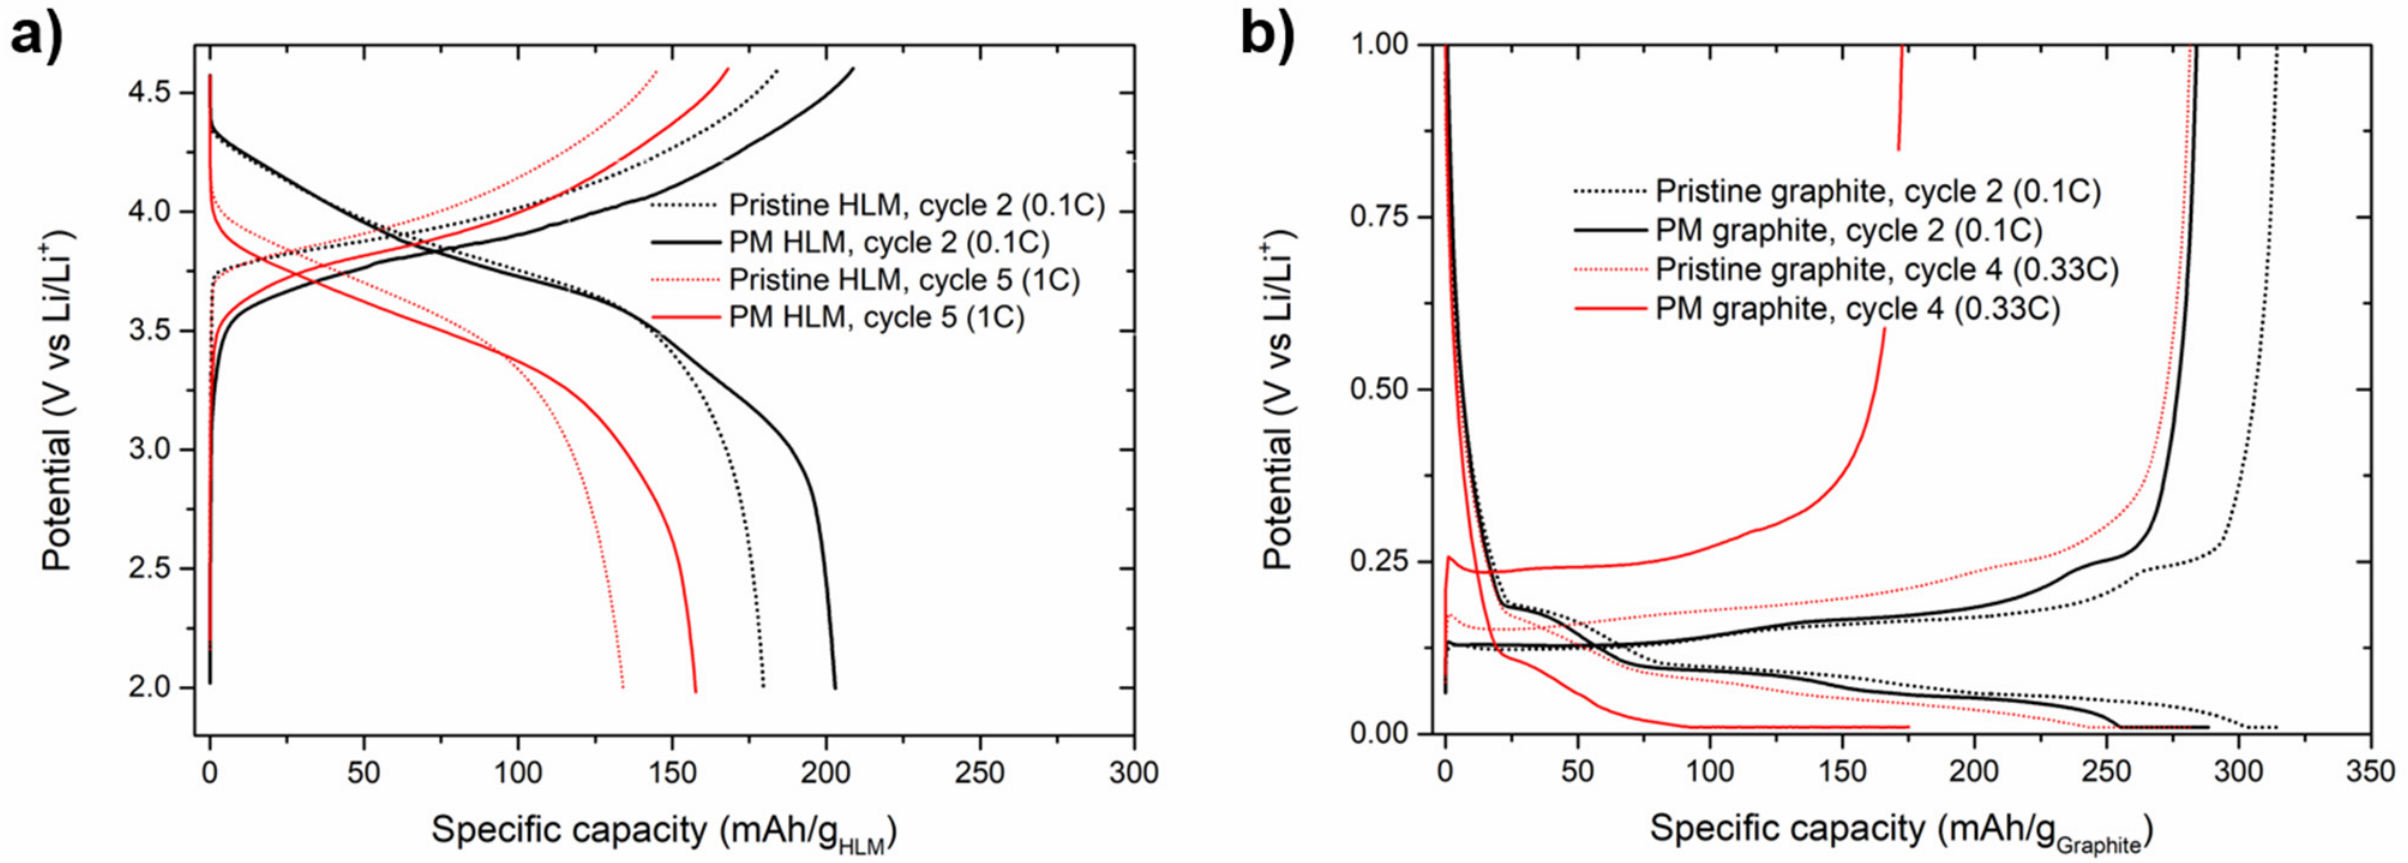
The last 0.1 C discharge (cathode lithiation, anode delithiation) of the full cell delivered 2.71 ± 0.07 mAh cm−2. When the recovered HLM cathodes were tested in half-cells, 3.09 ± 0.03 mAh cm−2 was obtained in the first delithiation of the cathode until 4.8 V vs. Li/Li+. The charge was conducted until this upper cutoff voltage to compare the results with those obtained with the pristine cells. During this charge, the capacity at 4.5 V vs. Li/Li+ (4.4 V vs. graphite) was 2.73 ± 0.05 mAh cm−2, which is almost the same capacity achieved in the last discharge in FCC. This evidences negligible capacity loss due to FCC opening, electrode manipulation, and reassembly. The capacity in the first discharge with the postmortem (PM) HLM cathode (229 ± 4 mAh g−1) was higher than with the pristine HLM electrodes (210 ± 1 mAh g−1). The same trend was observed in the second cycle. This confirms that the recovered HLM cathode was not severely degraded and that the additional capacity originates from Mn redox activity already activated during full-cell cycling. The same was observed in the second cycle of these cathode HCCs. The second full cycle of both the graphite anode and the HLM cathode HCCs has been represented in Figure 7. The increase in the discharge capacity with the PM HLM electrode can be clearly ascribed to Mn redox activity (Figure 7a), and negligible polarization can be observed in this discharge. Conversely, the charge occurs at a lower potential with the PM electrode, likely attributed to the vacancies due to the oxygen evolution and successful HLM activation. When increasing the C-rate to 1 C, slight polarization was observed for the PM electrode in comparison to the pristine electrode. However, this polarization is lower than that in FCC when comparing the BoL and the EoL (Figure S3b).
On the graphite anode side (Figure 7b), no polarization was observed at 0.1 C with the PM electrode despite the massive SEI formation. This (combined with the results of the cathode HCCs) is in good agreement with the absence of polarization increase in FCC in the 0.1 C checkup cycles in Figure 2. However, when increasing the C-rate to 0.33 C (1 C was not evaluated in anode HCCs), the polarization significantly increased, with a remarkable contribution of the CV stage in the discharge (lithiation). Based on this, the anode is pointed out as being responsible for the increase in the polarization of the FCCs at 1 C (Figure S3b) and is in good agreement with an increase in the resistance caused by the thick SEI formed by the EoL (Figure S6).
Finally, the areal capacity achieved with the anodes was lower than with the cathode in each half cycle (after the first half cycle). Despite the extra lithium availability (due to the use of a lithium counter electrode in the new HCC), the PM graphite anodes could not provide the same capacity as the pristine graphite electrodes. Considering that the PM graphite anodes underwent a maximum of 129 cycles in FCC, much less than with other cathode chemistries (NMC, LFP…), it is evident that the lithium intercalation capacity of these anodes was severely affected. This is well evidenced by the shortening of the (de)intercalation plateaus in Figure 7b.
Overall, a strong correlation between the TM metal migration and the anode degradation has been evidenced. In any case, it has to be stressed that this is not unequivocal proof of causality. Quilty et al. [46] observed that the TM dissolution and deposition on the graphite negative electrode were higher when using polycrystalline NMC811 than with single-crystal NMC. The capacity retention was lower for the former, which was attributed to a more resistive SEI. Based on the literature, the TM dissolution is promoted by the redox activity of Mn (which is activated by the redox activity of Li2MnO3) [12]. The anode is responsible for the increased polarization at intermediate-high C-rates, likely due to the SEI.

3.7. Influence of the Voltage Limits

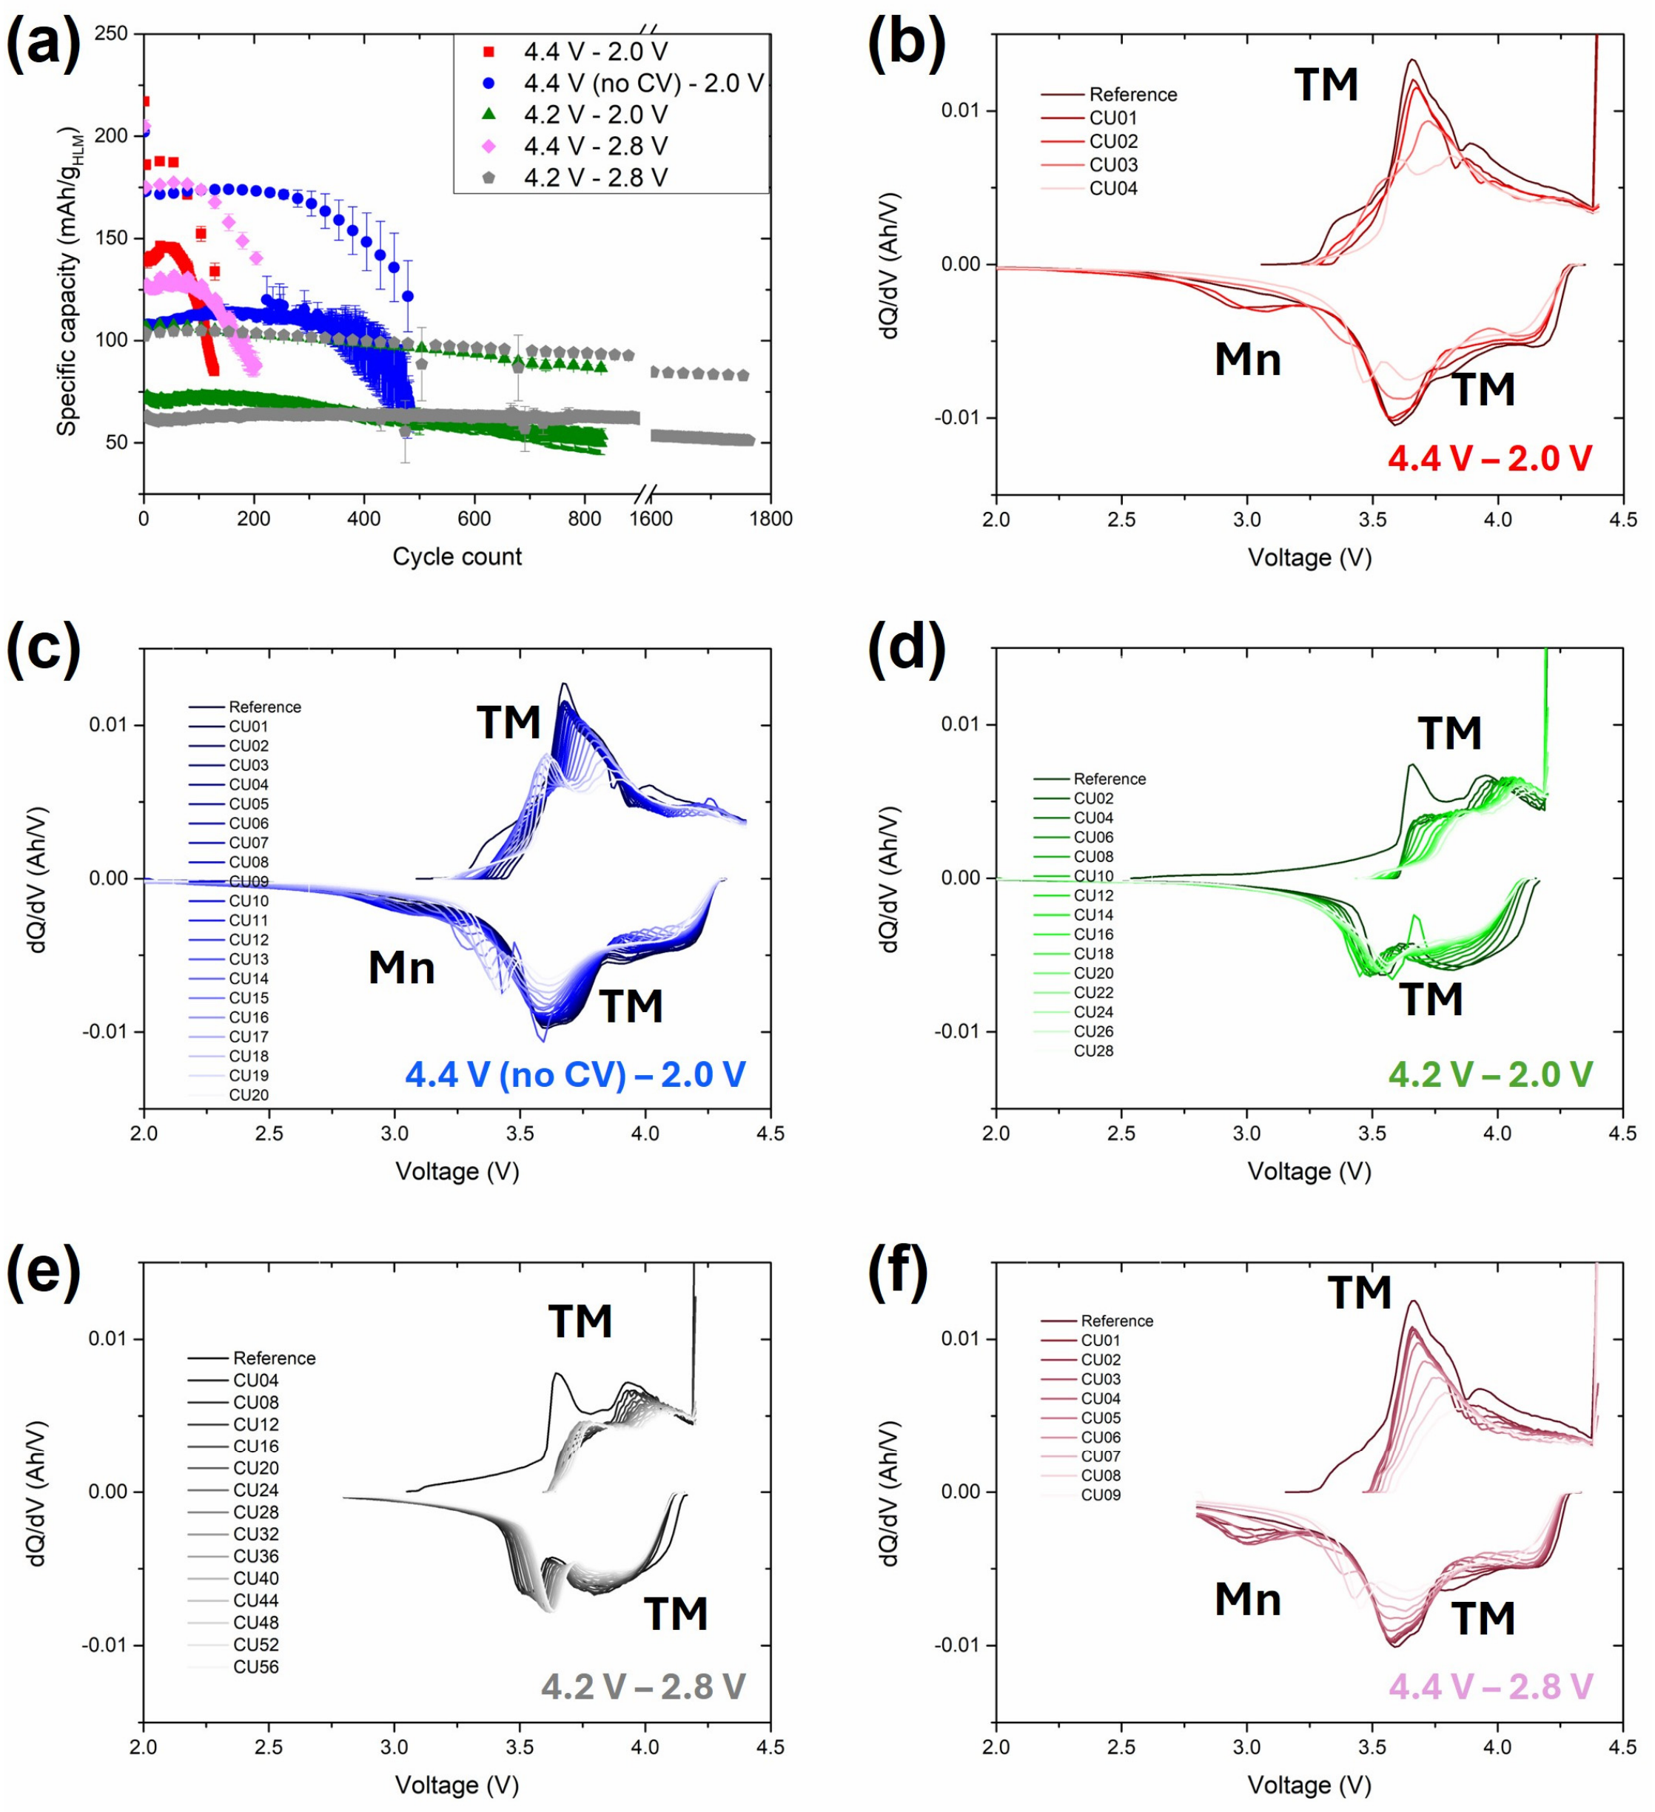
Previous work by Peralta et al. [18] showed that limiting the upper and lower cutoff potentials (partial or shallow cycling) in HLM HCC can mitigate the capacity fade. In addition, Qiu et al. [15] mitigated the oxygen redox activity upon delithiation of the HLM by adjusting the UCV, leading to lower structural disorder and, therefore, to a more feasible structural recovery of the original structure. In the present work, different upper and lower cutoff voltages have been proposed to analyze the balance between capacity, HLM activation, and lifetime. The assumptions for the voltage range and the electrochemical results for each one are shown in Table 2 and Figure 8, respectively. The alternative voltages (4.2 V in charge, 2.8 V in discharge) were selected based on a typical working voltage of an NMC||graphite cell [51], allowing the comparison of these two cathode chemistries.
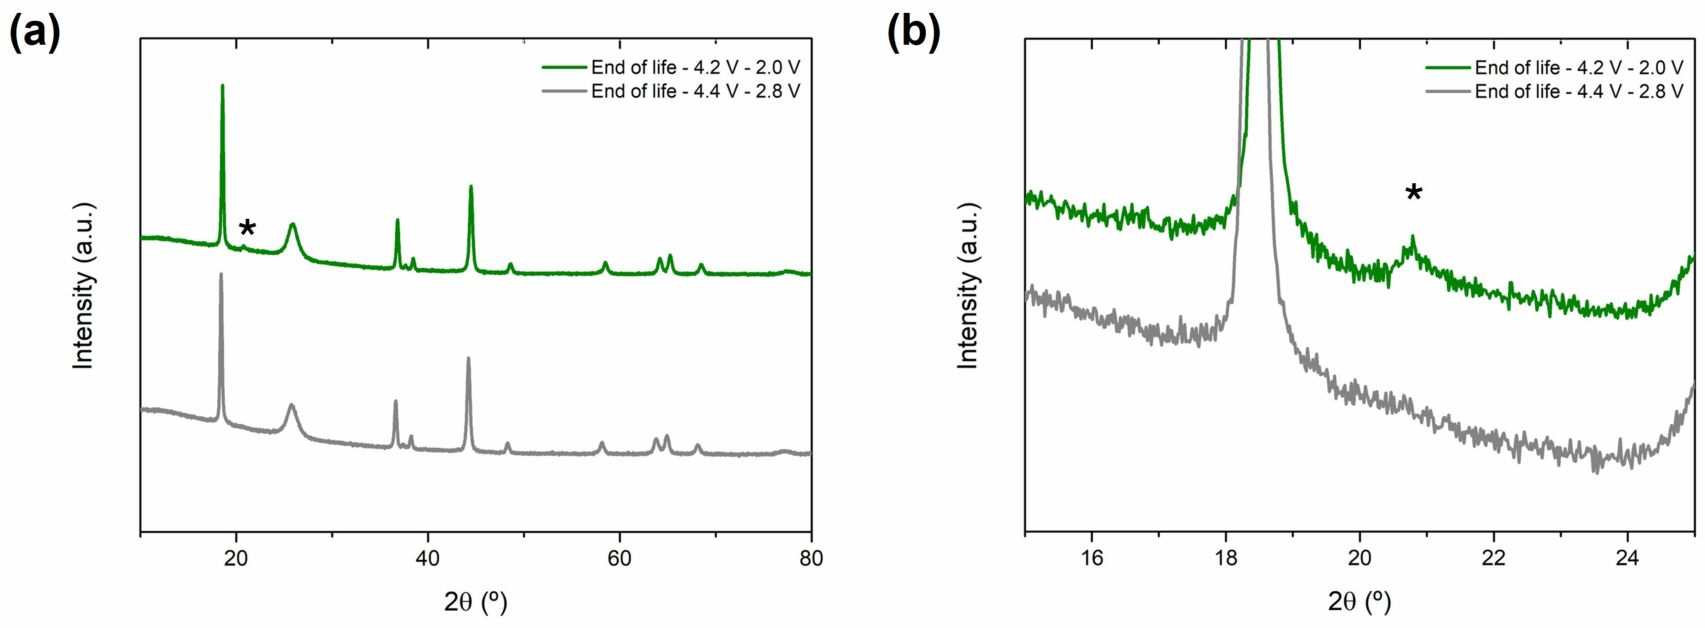
All the tests were stopped after reaching 80% SoH based on the BoL reference cycle at 0.1 C. As expected, based on the work by Peralta et al. [18], the capacity retention was enhanced with shallow cycling (Figure 8a), but the accessible discharge capacity. The ICA of the checkup cycles at 0.1 C with the baseline voltage range (4.4 V, CCCV—2.0 V) is included in Figure 8b as a baseline to evaluate the ICA with the rest of the voltage ranges. By eliminating the CV from the 4.4 V charge, the discharge capacity was decreased compared with the cells with CV. It is expected that in this CV step, both layered oxide and Li2MnO3 redox activity occur, with a higher presence of Li2MnO3 redox. By removing the redox activity in the CV step, the delithiation of HLM was lower, and accordingly, the lithiation in the subsequent discharge was lower. This allowed achieving 479 cycles above SoH = 80% in the 0.1 C cycles, almost four-fold compared to the baseline experiment. Without CV, the increase in the capacity at the BoL due to Li2MnO3 activation was delayed, and stable capacity retention was achieved until ~225 cycles. This can be seen in more detail in the ICAs of the checkup cycles represented in Figure 8c. The Mn redox activity was slowly initiated at 3.0 V with a maximum after 5 CUs. Even though the shift in this redox peak (voltage slippage) was visible, this was less accelerated than with the CV step (Figure 8b). Gradual polarization and shortening of the discharge and charge plateaus were observed. Hu et al. [25] reported that the TM redox activation of the lower voltage region, attributed to the previous activation of the oxygen redox activity, was responsible for the voltage fade in LMR-based cells. The results observed after removing the CV step are in good agreement with this assumption. However, no oxygen evolution was found in this work by means of OEMS. The gradual polarization and the capacity fade were accelerated after CU09-CU10. Therefore, by removing the CV step, the Li2MnO3 activity was mitigated, delaying the activation of the Mn redox activity and the activation of the degradation mechanisms (LAManode and voltage slippage). These trends were even more evident when decreasing the UCV from 4.4 V (CC) to 4.2 V (CCCV). Eliminating the higher voltage charge region significantly decreased the discharge capacity and increased the capacity retention to 879 cycles (Figure 8d). No perceptible bump in the capacity was observed in Figure 8a at the BoL. All the features except the discharge peak at 4.15 V were gradually shifted to higher voltages (including an extension of the CV step). The discharge voltage of the plateau at 4.15 V decreased until CU08 and remained stable after this checkup, with a progressive decrease in the capacity of this plateau. In addition, a shoulder appeared in the discharge at 3.4 V, similar to that observed in CU03 in Figure 8b, which was associated with Mn redox activity. Thus, it cannot be discarded that some Li2MnO3 activation occurred despite decreasing the UCV to 4.2 V (CCCV). This was further confirmed by keeping the UCV at 4.2 V (CCCV) and increasing the lower cutoff voltage (LCV) to 2.8 V (Figure 8e). The aim of this experiment was to avoid the Mn redox activity and the high ohmic resistance stage (principally at 0% SOC and EoL) observed in Figure 6. No Mn activity was observed at the lower voltage region of the discharge, and the capacity retention was doubled to 1754 cycles with slightly lower discharge capacity than in the 4.2 V, CCCV—2.0 V range. Again, a gradual shift to higher voltages for all features except for that at 4.25 V in the discharge was observed. Finally, the use of a voltage range of 4.4 V, CCCV—2.8 V aimed to mitigate the Mn redox activity (and to avoid a high Rohm range). This caused an increase in the cycling life to 229 cycles, almost double the baseline (4.4 V, CCCV—2.0 V). Thus, minimizing the Mn redox activity contributed to decreasing the major cause of capacity fade: the LAManode caused by the TM migration. The ICA for the cells cycled between 4.4 V (CCCV) and 2.8 V (Figure 8f) exhibits a similar evolution to the cells cycled between 4.4 V (CCCV) and 2.0 V, but the evolution is slower (the maximum in the Mn redox peak is achieved later), and >100 cycles were achieved before slippage. This indicates that limiting Mn redox activity slows the degradation pathway but does not prevent Li2MnO3 activation when the cell is still charged to 4.4 V. To further analyze this, the HLM cathodes harvested from the cells cycled between 4.2 V, CCCV—2.0 V, and 4.4 V, CCCV—2.8 V were subjected to XRD at their EoL (879 and 229 cycles, respectively). The corresponding diffraction patterns are shown in Figure 9.
The reflections in the diffractograms are the same as those shown in Figure S9. In that case, the reflection from the Li2MnO3 superstructure (2θ = 20.7°) disappeared after 25 cycles charged to 4.4 V (CCCV). This was the same for the HLM cathode cycled for 229 cycles between 4.4 V (CCCV) and 2.8 V. Thus, the increase in the lower cutoff voltage did not contribute to the preservation of Li2MnO3. Conversely, the feature at 20.7° was present in the XRD pattern after 879 cycles between 4.2 V (CCCV) and 2.0 V. Thus, when charged to 4.2 V, Li2MnO3 is not activated and it remains in the cathode at the end of life, while when charged to 4.4 V it is activated (consumed) providing extra capacity. This clearly shows that the upper cutoff voltage plays a key role in the activation of Li2MnO3, which later affects the capacity (higher with Li2MnO3 activation) and the capacity retention (lower with Li2MnO3 activation). To get a better overview of this trade-off, the total capacity throughput was calculated for the different voltage ranges and included in Table 3. Other important parameters, such as the initial capacity at different C-rates, the average discharge voltage, the energy density, and the energy retention, are also added. The results with an NMC811-based cell are included as a reference (the evolution of the capacity during cycling is displayed in Figure S12).
As previously mentioned, the capacity of the HLM-based cells was more severely affected by the UCV than by the LCV. The total capacity throughput was the lowest for the HLM-based cells charged to 4.4 V with CCCV. The total capacity throughput was similar for the cells with the protocols 4.4 V (CC)—2.0 V and 4.2 V (CCCV)—2.0 V. Even though the number of cycles before reaching 80% SoH was almost half for the former. In this case, there was a balance between the number of cycles and the capacity achieved in each of these cycles. The highest total capacity throughput was achieved with the HLM-cells with the most restrictive voltage window: 4.2 V (CCCV)—2.8 V. For all the voltage windows studied, the average discharge voltage was similar both at the BoL and the EoL (a bit lower for the 4.4 V, CCCV—2.8 V voltage window), and, therefore, the energy density followed the same trend as the capacity. It has to be mentioned that the average discharge voltage drop was lower for the HLM-based cells than for the NMC-based cells. The energy retention did not follow a specific trend; it was the lowest for those cells cycled between 4.4 V (both CC and CCCV) and 2.0 V, while the highest retention was achieved with the 4.4 V (CCCV)—2.8 V and 4.2 V (CCCV)—2.0 V protocols. The number of cycles and the total capacity throughput were higher for HLM-based cells than for the NMC811-based ones cycled in the same voltage range (4.2 V, CCCV—2.8 V). It is worth noting that 195, 190, and 157 mAh g−1NMC were achieved at 0.05 C, 0.1 C, and 1 C at the BoL with the NMC811-based cells, while 104, 102, and 63 mAh g−1HLM were achieved at the same C-rates with HLM. Nevertheless, HLM is a more sustainable, cheaper, and safer alternative and, therefore, might be interesting for some specific applications requiring lower energy density. Conversely, when working in the full voltage region (4.4 V, CCCV—2.0 V), 760 Wh kg−1HLM were achieved with HLM at 0.05 C, while 734 Wh kg−1NMC were obtained with NMC811 (between 4.2 V, CCCV and 2.8 V). Therefore, HLM remains interesting because of its lower cost, improved sustainability, and potentially safer chemistry. Nevertheless, its practical use requires mitigation of transition-metal dissolution and anode poisoning. Protective coatings are a promising route. For example, Mallick et al. [20] showed that Li3PO4 coatings on LMR particles reduced Mn migration and deposition on the anode, especially when the coating was homogeneous. Future work should focus on such surface-protection strategies to decouple HLM activation from rapid graphite degradation.

4. Conclusions

In this work, LIBs based on high lithium and manganese oxide (HLM) have been tracked during their cycle life with different electrochemical techniques (galvanostatic cycling, EIS, OEMS, and GITT). The data obtained have been evaluated with different analysis methods (ICA, DVA), and these results have been complemented with postmortem materials characterization. Furthermore, the results have been discussed by drawing on relevant bibliographical works. Firstly, it has been observed that the interpretation of the electrochemical results can be challenging unless they are validated by different techniques. For example, Mn redox evolution is difficult to follow unless DVA is conducted, while EIS interpretation at different voltages is hardly interpretable unless combined with ICA, DVA, and materials characterization. Loss of active anode material has been identified as the main degradation route, in good agreement with other works in the literature, poisoning by TM dissolution from the cathode and migration to the anode. Other degradation mechanisms, such as impedance built-up due to massive SEI formation or voltage slippage, have also been identified. In addition, by limiting the voltage window, the degradation reactions have been mitigated. This finding has been corroborated by the results of the OEMS study showing electrolyte decomposition on the HLM positive electrode at 4.5 V even after the first cycle. However, the achievable specific capacity has also decreased. The main use, compatibility with other techniques, and main limitations for each of the characterization methods have been summarized in Table S6. This trade-off in terms of capacity and cycling performance can be interesting from the point of view of the final application of the cells. Depending on the voltage window selected, HLM-based LIBs outperform NMC811 cells (with a voltage window of 4.2–2.8 V) in terms of capacity retention, energy density, or total capacity throughput, but never in all three parameters at the same time. Avoiding TM dissolution is the key factor for making HLM electrodes implementable in commercial LIBs. This article aims to provide a guide to interpreting the electrochemical results obtained in HLM||graphite cells, discussing and comparing them with those in the literature. Nevertheless, more advanced materials characterization techniques are recommended to unequivocally verify them.

Supplementary Materials

The following supporting information can be downloaded at: https://www.mdpi.com/article/10.3390/electrochem7030018/s1, Table S1. Summary of the experimental protocol with HLM HCC; Table S2. Summary of the experimental protocol with NMC811 HCC; Table S3. Summary of the experimental protocol with graphite HCC; Table S4. Summary of the baseline experimental testing protocol with HLM||graphite FCC; Table S5. Summary of the experimental protocol with NMC||graphite FCC; Table S6. Summary of the characterization techniques used in this study, pointing out their main use, compatibility with other techniques, and their main limitations; Figure S1. Galvanostatic curves of the HLM-based HCC at 0.1 C: cycle 2 (dashed line) vs. cycle 31 (continuous line); Figure S2. DVA representation of different discharges at 0.1 C: HLM HCC at the BoL (red) and after 8 cycles (blue); Figure S3. (a) Evolution of the voltage at the end of the resting step (10 min) following each discharge. (b) Galvanostatic curves of every 5 cycles at 1 C; Figure S4. (a) Specific gravimetric capacity and (b) the corresponding ICA curves of HLM||delithiated LFP cells cycled at 25 °C with 1.3 M LiPF6 in EC electrolyte; Figure S5. Cyclic voltammetry experiments. (a) Voltammograms at different scan rates in the reference checkup, (b) comparison of the voltammograms at 2 mV s−1 scan rate in the different checkups, (c) example of the use of the Randles-Sevcik equation, and (d) evolution of the diffusion coefficient during the cycle life of the cells; Figure S6. Pictures of electrodes obtained from FCCs after cycling to 80% SoH. (a) HLM cathode and (b) graphite anode; Figure S7. X-ray diffraction patterns and fittings of the graphite electrodes after cycling for 29 (blue) and 129 (red) cycles (end of life). The theoretical reflections for graphite, (graphitic) carbon black (CB), and Cu are included; Figure S8. FE-SEM and EDX mapping images obtained from the graphite anodes after 29 (a–d) and 129 (e–h) cycles. (a,e) top view image, (b,f) cross-section image, (c,g) mapping of Ni, and (d,h) mapping of Mn. Current collector (CC) and separator (SEP) sides are indicated for the cross-section images; Figure S9. X-ray diffractograms of the pristine HLM electrodes (green), and the HLM electrodes cycled for 29 cycles (blue) and until 80% SoH (129 cycles, end of life) (green), and their corresponding fittings (same but lighter colors). The theoretical reflections for the layered oxides (R-3m), the graphitic carbon (P63mc), and the Li2MnO3 phase (C2/m) are included as a reference; Figure S10. FE-SEM images of the pristine HLM electrodes (a,b), and the HLM electrodes cycled for 29 cycles (c,d) and 129 cycles (until 80% SoH) (e,f) at different magnifications (×5000 in the left column, ×10,000 in the right column); Figure S11. Example of a GITT curve of an HLM||graphite FCC, in this case, corresponding to CU02; Figure S12. Evolution of the capacity with the number of cycles for NMC811||graphite cells cycled between 4.2 V and 2.8 V.

Author Contributions

Conceptualization, I.L.-M. and I.d.M.; methodology, I.L.-M. and I.d.M.; formal analysis, I.L.-M., A.M.-S., K.A., G.K., S.S.-I. and P.C.S.; investigation, I.L.-M., A.M.-S., K.A., G.K., S.S.-I., P.C.S., I.P. and I.d.M.; resources, H.-J.G.; data curation, I.L.-M., K.A. and S.S.-I.; writing—original draft preparation, I.L.-M., K.A. and I.P.; writing—review and editing, I.L.-M., A.M.-S., K.A., G.K., S.S.-I., P.C.S., I.P. and I.d.M.; supervision, I.P. and I.d.M.; project administration, I.L.-M.; funding acquisition, E.A. and I.d.M. All authors have read and agreed to the published version of the manuscript.

Funding

This work has received funding from the European Union’s Horizon EU research and innovation programme under grant agreement No 101147312 (SAGELi).

Data Availability Statement

The data presented in this study are available on request from the corresponding author due to restrictions in terms of confidentiality by one of the materials suppliers.

Acknowledgments

The authors gratefully acknowledge Judith Perez from CIDETEC for the HLM electrode preparation and coin cell assembly, as well as CIDETEC CELLS for the NMC811 and graphite electrode supply. The authors acknowledge Quentin Bizot (Umicore) for the HLM supply and the discussions on the interpretation of the results with this material. During the preparation of this manuscript, the authors used ChatGPT v5.5 for the purposes of generating the graphical abstract and simplifying the text in the revision stage. The authors have reviewed and edited the output and take full responsibility for the content of this publication.

Conflicts of Interest

The authors declare no conflicts of interest. The funders had no role in the design of the study; in the collection, analyses, or interpretation of data; in the writing of the manuscript; or in the decision to publish the results.

Abbreviations

The following abbreviations are used in this manuscript:
HLMHigh lithium and manganese oxide
LMR, LMROLithium- and manganese-rich oxide
SoAState-of-the-art
LIBLithium-ion battery
LFPLiFePO4
NMCLiNixMnyCozO2
TMTransition metal
CAMCathode active material
LROLithium-rich oxide
UCVUpper cutoff voltage
CBCarbon black
SWCNTSingle-wall carbon nanotubes
PVDFPoly-vinylidene fluoride
NMC811LiNi0.8Mn0.1Co0.1O2
HCCHalf coin cell
FCCFull coin cell
ECEthylene carbonate
EMCEthyl methyl carbonate
VCVinylene carbonate
CCConstant current
CVConstant voltage
SoHState-of-health
CUCheck-up
GITTGalvanostatic intermittent titration technique
EISElectrochemical impedance spectroscopy
SoCState-of-charge
OEMSOnline Electrochemical Mass Spectrometry
dLFPDelithiated LiFePO4
BETBrunauer-Emmett-Teller
DMCDimethyl carbonate
FE-SEMField emission scanning electron microscope
EDXEnergy-dispersive X-ray spectroscopy
XRDX-ray diffraction
SEIsolid electrolyte interphase
BoLBeginning of life
ICAIncremental capacity analysis
EoLEnd of life
DVADifferential voltage analysis
LAMLoss of active material
FCEFirst cycle efficiency
CEICathode electrolyte interphase
RResistor
CCapacitor
CPEConstant phase element
RohmOhmic resistance
RpolPolarization resistance
PMPostmortem
LCVLower cutoff voltage

References

  1. Link, S.; Neef, C.; Wicke, T. Trends in Automotive Battery Cell Design: A Statistical Analysis of Empirical Data. Batteries 2023, 9, 261. [Google Scholar] [CrossRef] [Scilit]
  2. Stapf, N.; Schneider, N.; Zhan, M.; Mehlich, C.; Birke, K.P.; Fill, A. Is Silicon Replaceable? A Physical, Chemical, and Electrochemical Analysis of Different Commercial Lithium-Ion Battery Cells. J. Electrochem. Soc. 2025, 172, 060513. [Google Scholar] [CrossRef] [Scilit]
  3. Hamed, H.; Choobar, B.G.; Hamtaei, S.; D’Haen, J.; Vermang, B.; Safari, M. Experimental Investigation of a 64 Ah Lithium-Ion Pouch Cell. J. Electrochem. Soc. 2024, 171, 020510. [Google Scholar] [CrossRef] [Scilit]
  4. Günter, F.J.; Wassiliadis, N. State of the Art of Lithium-Ion Pouch Cells in Automotive Applications: Cell Teardown and Characterization. J. Electrochem. Soc. 2022, 169, 030515. [Google Scholar] [CrossRef] [Scilit]
  5. Volta Foundation. The Battery Report 2025. 2026. Available online: https://volta.foundation/battery-report-2025/ (accessed on 15 May 2026).
  6. Xiao, J.; Cao, X.; Gridley, B.; Golden, W.; Ji, Y.; Johnson, S.; Lu, D.; Lin, F.; Liu, J.; Liu, Y.; et al. From Mining to Manufacturing: Scientific Challenges and Opportunities behind Battery Production. Chem. Rev. 2025, 125, 6397–6431. [Google Scholar] [CrossRef] [Scilit] [PubMed]
  7. Houache, M.S.E.; Yim, C.H.; Karkar, Z.; Abu-Lebdeh, Y. On the Current and Future Outlook of Battery Chemistries for Electric Vehicles—Mini Review. Batteries 2022, 8, 70. [Google Scholar] [CrossRef] [Scilit]
  8. Gan, J.; Fang, H.; Li, S.; Wu, Z.; Zheng, C.; Li, C.; She, L.; Qi, F.; Xue, X.; Li, Z.; et al. Suppressed Degradation in Semiconducting Lithium-Rich Oxide Cathode Materials via Phase Structure Engineering. ACS Appl. Mater. Interfaces 2025, 17, 28076–28083. [Google Scholar] [CrossRef] [Scilit] [PubMed]
  9. Wu, G.; Zhao, C.; You, Y.; Wu, F.; Lü, T.; Cao, X.; Zhu, Z.; Wu, S. Exploring Structural Evolution and Lattice Oxygen Bonding Variation in Li-Rich NCM Cathode Materials. J. Electrochem. Soc. 2025, 172, 030501. [Google Scholar] [CrossRef] [Scilit]
  10. Yu, J.H.; Köster, K.; Voronina, N.; Kim, S.; Shin, H.J.; Kim, K.S.; Ihm, K.; Kim, H.; Jung, H.G.; Yazawa, K.; et al. Elevating Li-Ion Battery Paradigms: Sophisticated Ionic Architectures in Lithium-Excess Layered Oxides for Unprecedented Electrochemical Performance. eScience 2025, 5, 100376. [Google Scholar] [CrossRef] [Scilit]
  11. Kou, P.; Zhang, Z.; Wang, Z.; Zheng, R.; Liu, Y.; Lv, F.; Xu, N. Opportunities and Challenges of Layered Lithium-Rich Manganese-Based Cathode Materials for High Energy Density Lithium-Ion Batteries. Energy Fuels 2023, 37, 18243–18265. [Google Scholar] [CrossRef] [Scilit]
  12. Kipfer, T.; Berk, R.B.; Riewald, F.; Piana, M.; Gasteiger, H.A. Correlation Between Reversible Anionic Redox and Open-Circuit-Voltage Hysteresis in Co-Free Li-Rich Layered Oxides. J. Electrochem. Soc. 2025, 172, 100505. [Google Scholar] [CrossRef] [Scilit]
  13. Thackeray, M.M.; Vu, A.D.; Tornheim, A.P.; Mallick, S.; Shi, B.; Chen, J.; Gim, J.; Lee, E.; Croy, J.R. Recent Developments in Lithium-Manganese-Nickel Oxide Electrochemistry: The Alchemy of LiMn0.5Ni0.5O2. J. Electrochem. Soc. 2025, 172, 050503. [Google Scholar] [CrossRef] [Scilit]
  14. Ko, W.-Y.; Chen, C.-C.; Cao, Z.-P.; Tsai, J.-K.; Chuang, L.-W.; Wang, R.-L.; Lin, K.-J. CNT-bridged 3D hierarchical MnO2 nanospheres as anode materials for lithium-ion batteries. J. Power Sources 2026, 688, 240607. [Google Scholar] [CrossRef] [Scilit]
  15. Qiu, B.; Zhou, Y.; Liang, H.; Zhang, M.; Gu, K.; Zeng, T.; Zhou, Z.; Wen, W.; Miao, P.; He, L.; et al. Negative Thermal Expansion and Oxygen-Redox Electrochemistry. Nature 2025, 640, 941–946. [Google Scholar] [CrossRef] [Scilit] [PubMed]
  16. Marie, J.J.; House, R.A.; Rees, G.J.; Robertson, A.W.; Jenkins, M.; Chen, J.; Agrestini, S.; Garcia-Fernandez, M.; Zhou, K.J.; Bruce, P.G. Trapped O2 and the Origin of Voltage Fade in Layered Li-Rich Cathodes. Nat. Mater. 2024, 23, 818–825. [Google Scholar] [CrossRef] [Scilit] [PubMed]
  17. Wang, C.C.; Tsai, J.H.; Lai, T.H.; Chang, C.Y. Investigation of Structures and Electrochemical Performances of Synergetic ZnO-Al2O3 Nanolaminated Coatings for Li-Rich Layered Oxide Cathodes. J. Energy Storage 2024, 103, 114331. [Google Scholar] [CrossRef] [Scilit]
  18. Peralta, D.; Colin, J.F.; Boulineau, A.; Simonin, L.; Fabre, F.; Bouvet, J.; Feydi, P.; Chakir, M.; Chapuis, M.; Patoux, S. Role of the Composition of Lithium-Rich Layered Oxide Materials on the Voltage Decay. J. Power Sources 2015, 280, 687–694. [Google Scholar] [CrossRef] [Scilit]
  19. Li, Z.; Li, H.; Cao, S.; Guo, W.; Liu, J.; Chen, J.; Guo, C.; Chen, G.; Chang, B.; Bai, Y.; et al. Reversible Anionic Redox and Spinel-Layered Coherent Structure Enable High-Capacity and Long-Term Cycling of Li-Rich Cathode. Chem. Eng. J. 2023, 452, 139041. [Google Scholar] [CrossRef] [Scilit]
  20. Mallick, S.; Pathak, R.; Sultanov, M.; Wen, J.; Ito, Y.; Elam, J.W.; Croy, J.R. Mitigating Transition Metal Dissolution from Mn-Rich Cathodes: Influence of Processing and Testing Methods. J. Electrochem. Soc. 2025, 172, 050527. [Google Scholar] [CrossRef] [Scilit]
  21. Zhang, Y.; Guo, F.; Li, A.; Li, Z.; Yuan, P.; Xu, J.; Hu, Z.; Yin, L.; Zhao, H.; Bai, Y.; et al. Revisiting the Roles of Foreign Magnesium Dopants in Governing the Properties of Li-Rich Mn-Based Oxide Cathodes for Li-Ion Batteries. Small 2025, 21, 2411490. [Google Scholar] [CrossRef] [Scilit]
  22. Kaewmala, S.; Kamma, N.; Buakeaw, S.; Limphirat, W.; Nash, J.; Srilomsak, S.; Limthongkul, P.; Meethong, N. Impacts of Mg Doping on the Structural Properties and Degradation Mechanisms of a Li and Mn Rich Layered Oxide Cathode for Lithium-Ion Batteries. Sci. Rep. 2023, 13, 4526. [Google Scholar] [CrossRef] [Scilit] [PubMed]
  23. Li, H.; Li, Z.; Liu, J.; Cao, S.; Chen, J.; Hu, H.; Guo, C.; Zhang, X.; Wang, X. Improving the Electrochemical Performance of Co-Free Li-Rich Layered Oxides via a Dual Modification of Nb5+ Doping and Oxygen Vacancy Regulation. ACS Appl. Energy Mater. 2023, 6, 10773–10783. [Google Scholar] [CrossRef] [Scilit]
  24. Shen, C.; Hu, L.; Duan, Q.; Liu, X.; Huang, S.; Jiang, Y.; Li, W.; Zhao, B.; Sun, X.; Zhang, J. Understanding Lattice Oxygen Redox Behavior in Lithium-Rich Manganese-Based Layered Oxides for Lithium-Ion and Lithium-Metal Batteries from Reaction Mechanisms to Regulation Strategies. Adv. Energy Mater. 2023, 13, 2302957. [Google Scholar] [CrossRef] [Scilit]
  25. Hu, E.; Yu, X.; Lin, R.; Bi, X.; Lu, J.; Bak, S.; Nam, K.W.; Xin, H.L.; Jaye, C.; Fischer, D.A.; et al. Evolution of Redox Couples in Li- and Mn-Rich Cathode Materials and Mitigation of Voltage Fade by Reducing Oxygen Release. Nat. Energy 2018, 3, 690–698. [Google Scholar] [CrossRef] [Scilit]
  26. Hu, E.; Bak, S.M.; Liu, Y.; Liu, J.; Yu, X.; Zhou, Y.N.; Zhou, J.; Khalifah, P.; Ariyoshi, K.; Nam, K.W.; et al. Utilizing Environmental Friendly Iron as a Substitution Element in Spinel Structured Cathode Materials for Safer High Energy Lithium-Ion Batteries. Adv. Energy Mater. 2016, 6, 1501662. [Google Scholar] [CrossRef] [Scilit]
  27. Yang, M.; Zeng, T.; He, D.; Jiao, Z.; Chen, S.; Zhao, W.; Li, Y.; Chen, Z.; Pu, Y.; Mu, Y.; et al. Morphology Engineering in Cobalt-Free Li-Rich Oxides for High-Capacity and Strain-Tolerant Cathodes. Small 2025, 21, 2502469. [Google Scholar] [CrossRef] [Scilit]
  28. Wei, L.; Zhang, J.; Lin, H.; Li, J.; Qu, K.; Yang, Z.; Ren, Y.; Ding, Z. Nano-Single-Crystal Co-Free Li-Rich Mn-Based Layered Cathode for Long-Cycling High-Energy Lithium-Ion Batteries. J. Colloid Interface Sci. 2026, 701, 138697. [Google Scholar] [CrossRef] [Scilit] [PubMed]
  29. Zhou, S.; Liao, J.; Zhang, W.; Dai, P.; Yu, C.; Gao, T.; Hou, T.; Cao, G.; Zhao, S. High-Entropy Li-Rich Layered Cathodes with Negligible Voltage Decay through Migration Retardation Effect. Adv. Mater. 2025, 37, 2505189. [Google Scholar] [CrossRef] [Scilit]
  30. Narayan, R.; Profatilova, I.; Kapun, G.; Tchernychova, E.; Addes, E.; Dominko, R. Tuning the Surface Stabilization of LiNiO2 Cathode via Mixed Conductive Carbon Nanotube/Lithium Polyacrylate Coatings—Electrochemical Performance and Operando Gas Evolution Analysis. Energy Storage Mater. 2025, 79, 104316. [Google Scholar] [CrossRef] [Scilit]
  31. Rajagopalan, B.; Pichardo, M.; de Meatza, I.; Profatilova, I.; Osa, U.; Sananes-Israel, S.; Paillard, E. An Ethylene Carbonate/Propylene Carbonate Electrolyte for Improved Cycle Life and Safety of Silicon-Graphite/NMC (Ni = 80–83 %) High-Energy Lithium-Ion Battery Cells. J. Power Sources 2025, 627, 235778. [Google Scholar] [CrossRef] [Scilit]
  32. Rodríguez-Carvajal, J. Recent Advances in Magnetic Structure Determination by Neutron Powder Diffraction. Phys. B Phys. Condens. Matter 1993, 192, 55–69. [Google Scholar] [CrossRef] [Scilit]
  33. Teufl, T.; Strehle, B.; Müller, P.; Gasteiger, H.A.; Mendez, M.A. Oxygen Release and Surface Degradation of Li- and Mn-Rich Layered Oxides in Variation of the Li2MnO3 Content. J. Electrochem. Soc. 2018, 165, A2718–A2731. [Google Scholar] [CrossRef] [Scilit]
  34. Kiran, I.; Azzam, M.; Endisch, C.; Butt, N.Z.; Lewerenz, M. Evaluation of Calendar Aging in Cells with Graphite: Silicon Anode Using Float Current Analysis Under the Influence of Voltage Hysteresis. J. Electrochem. Soc. 2025, 172, 100529. [Google Scholar] [CrossRef] [Scilit]
  35. Majherova, V.; Fiamegkou, E.; Nakhanivej, P.; Bree, G.; Gott, J.A.; Menon, A.S.; Paez Fajardo, G.J.; Widanalage, W.D.; Dimitrijevic, A.; Belekoukia, M.; et al. Revealing How Silicon Oxide Accelerates Calendar Ageing of Commercial 21700 Nickel-Rich Lithium-Ion Cells. J. Electrochem. Soc. 2025, 172, 090505. [Google Scholar] [CrossRef] [Scilit]
  36. Peralta, D.; Salomon, J.; Reynier, Y.; Martin, J.F.; De Vito, E.; Colin, J.F.; Boulineau, A.; Bourbon, C.; Amestoy, B.; Tisseraud, C.; et al. Influence of Al and F Surface Modifications on the Sudden Death Effect of Si-Gr/Li1.2Ni0.2Mn0.6O2 Li-Ion Cells. Electrochim. Acta 2021, 400, 139419. [Google Scholar] [CrossRef] [Scilit]
  37. Strehle, B.; Kleiner, K.; Jung, R.; Chesneau, F.; Mendez, M.; Gasteiger, H.A.; Piana, M. The Role of Oxygen Release from Li- and Mn-Rich Layered Oxides during the First Cycles Investigated by On-Line Electrochemical Mass Spectrometry. J. Electrochem. Soc. 2017, 164, A400–A406. [Google Scholar] [CrossRef] [Scilit]
  38. Streich, D.; Guéguen, A.; Mendez, M.; Chesneau, F.; Novák, P.; Berg, E.J. Online Electrochemical Mass Spectrometry of High Energy Lithium Nickel Cobalt Manganese Oxide/Graphite Half- and Full-Cells with Ethylene Carbonate and Fluoroethylene Carbonate Based Electrolytes. J. Electrochem. Soc. 2016, 163, A964–A970. [Google Scholar] [CrossRef] [Scilit]
  39. Pham, H.Q.; Kondracki, Ł.; Tarik, M.; Trabesinger, S. Correlating the Initial Gas Evolution and Structural Changes to Cycling Performance of Co-Free Li-Rich Layered Oxide Cathode. J. Power Sources 2022, 527, 231181. [Google Scholar] [CrossRef] [Scilit]
  40. Jung, R.; Metzger, M.; Maglia, F.; Stinner, C.; Gasteiger, H.A. Oxygen Release and Its Effect on the Cycling Stability of LiNixMnyCozO2 (NMC) Cathode Materials for Li-Ion Batteries. J. Electrochem. Soc. 2017, 164, A1361. [Google Scholar] [CrossRef] [Scilit]
  41. Liu, T.; Liu, J.; Li, L.; Yu, L.; Diao, J.; Zhou, T.; Li, S.; Dai, A.; Zhao, W.; Xu, S.; et al. Origin of Structural Degradation in Li-Rich Layered Oxide Cathode. Nature 2022, 606, 305–312. [Google Scholar] [CrossRef] [Scilit] [PubMed]
  42. Jung, R.; Metzger, M.; Maglia, F.; Stinner, C.; Gasteiger, H.A. Chemical versus Electrochemical Electrolyte Oxidation on NMC111, NMC622, NMC811, LNMO, and Conductive Carbon. J. Phys. Chem. Lett. 2017, 8, 4820–4825. [Google Scholar] [CrossRef] [Scilit] [PubMed]
  43. Rinkel, B.L.D.; Vivek, J.P.; Garcia-Araez, N.; Grey, C.P. Two Electrolyte Decomposition Pathways at Nickel-Rich Cathode Surfaces in Lithium-Ion Batteries. Energy Environ. Sci. 2022, 15, 3416–3438. [Google Scholar] [CrossRef] [Scilit] [PubMed]
  44. Raccichini, R.; Amores, M.; Hinds, G. Critical Review of the Use of Reference Electrodes in Li-Ion Batteries: A Diagnostic Perspective. Batteries 2019, 5, 12. [Google Scholar] [CrossRef] [Scilit]
  45. Meddings, N.; Heinrich, M.; Lee, J.; Ruiz, V.; Napolitano, E.; Seitz, S.; Hinds, G.; Raccichini, R.; Gaber, M.; Park, J. Application of Electrochemical Impedance Spectroscopy to Commercial Li-Ion Cells: A Review. J. Power Sources 2020, 480, 228742. [Google Scholar] [CrossRef] [Scilit]
  46. Quilty, C.D.; Luo, J.; Rodriguez-Campos, A.; Liu, S.; West, P.J.; Tong, X.; Kiss, A.; Yang, Y.; Jaye, C.; Fischer, D.A.; et al. Capacity Fade of Graphite/NMC811: Influence of Particle Morphology, Electrolyte, and Charge Voltage. J. Electrochem. Soc. 2024, 171, 080515. [Google Scholar] [CrossRef] [Scilit]
  47. Landa-Medrano, I.; Eguia-Barrio, A.; Sananes-Israel, S.; Lijó-Pando, S.; Boyano, I.; Alcaide, F.; Urdampilleta, I.; De Meatza, I. In Situ Analysis of NMC ∣ Graphite Li-Ion Batteries by Means of Complementary Electrochemical Methods. J. Electrochem. Soc. 2020, 167, 090528. [Google Scholar] [CrossRef] [Scilit]
  48. Wang, Q.; Shen, C.H.; Shen, S.Y.; Xu, Y.F.; Shi, C.G.; Huang, L.; Li, J.T.; Sun, S.G. Origin of Structural Evolution in Capacity Degradation for Overcharged NMC622 via Operando Coupled Investigation. ACS Appl. Mater. Interfaces 2017, 9, 24731–24742. [Google Scholar] [CrossRef] [Scilit]
  49. Kim, J.; Park, S.; Hwang, S.; Yoon, W.S. Principles and Applications of Galvanostatic Intermittent Titration Technique for Lithium-Ion Batteries. J. Electrochem. Sci. Technol. 2022, 13, 19–31. [Google Scholar] [CrossRef] [Scilit]
  50. Ryll, K.; Hoffmann, L.; Landrath, O.; Lienesch, F.; Kurrat, M. Key Figure Based Incoming Inspection of Lithium-Ion Battery Cells. Batteries 2021, 7, 9. [Google Scholar] [CrossRef] [Scilit]
  51. Sananes-Israel, S.; Urdampilleta, I.; Kvasha, G.; Landa-Medrano, I.; de Meatza, I. Development and Upscaling of a Waterborne Formulation for High-Energy Density NMC811 Cathodes. Batter. Supercaps 2024, 7, e202400358. [Google Scholar] [CrossRef] [Scilit]
Figure 1. (a) Galvanostatic curves of the formation (0.05 C, continuous line) and one conditioning (0.1 C, dashed line) cycle of the HLM||graphite full cells. (b) Evolution of the discharge capacity with the number of cycles. Error bars indicate the standard deviation within three cells.
Electrochem 07 00018 g001
Figure 2. Checkup (CU) cycles conducted at 0.1 C every 25 cycles in HLM||graphite cells: (a) galvanostatic representation, and (b) the corresponding incremental capacity analysis (ICA).
Electrochem 07 00018 g002
Figure 3. Differential voltage analysis (DVA) representation of different discharges at 0.1 C: (a) HLM||graphite FCC reference cycle, HLM HCC at BoL, and the calculated profile of the graphite HCC; (b) HLM||graphite FCC in the reference and checkup (CU) cycles.
Electrochem 07 00018 g003
Figure 4. Overlay of the voltage vs. time curve of the HLM vs. dLFP cell, along with (a,b) O2 (m/z = 32), (c) CO2 (m/z = 44), and (d) CO (m/z = 28) evolution while cycling at 25 °C in 1.3 M LiPF6 in EC electrolyte. (* shift in baseline due to changes in the operating mode of the dry room).
Electrochem 07 00018 g004
Figure 5. Results of the EIS experiments at different voltages in reference (REF) and the different checkup (CU) cycles. (a) Representative Nyquist plot of an impedance spectrum (red squares), the equivalent circuit used for fitting, and the fitting line (black line). Evolution of (b) R0 (ohmic R), (c) R1 (anode SEI), (d) R2 (cathode CEI), (e) R3 (anode CT), and (f) R4 (cathode CT).
Electrochem 07 00018 g005
Figure 6. Resistance values obtained from the GITT at the different SoCs for the different CUs: ohmic resistance in (a) the discharge and (b) the charge scans; polarization (pol) resistance in (c) the discharge and (d) the charge scans.
Electrochem 07 00018 g006
Figure 7. Galvanostatic curves of the HCC with the pristine (dotted lines) and postmortem (PM, continuous lines) at 0.1 C (black), 0.33 C for graphite anodes (red), and 1 C for the HLM cathode (red). (a) HLM cathode HCC and (b) graphite anode HCC.
Electrochem 07 00018 g007
Figure 8. Experiments with HLM||graphite FCC limiting the upper and the lower cutoff voltage. (a) Evolution of the discharge capacity with the number of cycles and the different cutoff voltages, and ICA of some checkup (CU) cycles with (b) 4.4 V, CCCV—2.0 V, (c) 4.4 V, CC—2.0 V, (d) 4.2 V, CCCV—2.0 V, (e) 4.2 V, CCCV—2.8 V, and (f) 4.4 V, CCCV—2.8 V cutoff voltages.
Electrochem 07 00018 g008
Figure 9. XRD patterns at the EoL of the HLM cathodes subjected to cycling between 4.2 V, CCCV—2.0 V (green) and 4.4 V, CCCV—2.8 V (grey). (a) Full diffraction patterns and (b) detail of the patterns between 2θ = 15° and 25°. * is used to highlight the reflection of Li2MnO3.
Electrochem 07 00018 g009
Table 1. Areal and specific capacity (Q) values achieved with the postmortem (PM) and pristine electrodes in HCCs. Experiments in HCCs start with delithiation for the HLM electrodes and with lithiation for the graphite electrodes. An and Cat refer to anode and cathode, respectively.
ElectrodeQ in the Last Discharge in FCC (0.1 C)/mAh cm−2Q 1st Half Cycle 1 in HCC (0.05 C)/mAh cm−2Q 2nd Half Cycle 1 in HCC (0.05 C)/mAh cm−2Q 1st Half Cycle 2 in HCC (0.1 C An, 0.25 C Cat)/mAh cm−2Q 2nd Half Cycle 2 in HCC (0.1 C)/mAh cm−2
PM Gr2.71 ± 0.073.87 ± 0.083.66 ± 0.093.33 ± 0.143.43 ± 0.02
PM HLM3.09 ± 0.03 until 4.8 V; 2.73 ± 0.05 until 4.5 V4.21 ± 0.053.84 ± 0.143.66 ± 0.15
ElectrodeQ in the last discharge in FCC (0.1 C)/mAh g−1Q 1st half cycle 1 in HCC (0.05 C)/mAh g−1Q 2nd half cycle 1 in HCC (0.05 C)/mAh g−1Q 1st half cycle 2 in HCC (0.1 C An, 0.25 C Cat)/mAh g−1Q 2nd half cycle 2 in HCC (0.1 C)/mAh g−1
PM Gr138 ± 9319 ± 9302 ± 7274 ± 5283 ± 12
PM HLM169 ± 2229 ± 4210 ± 9200 ± 9
Pristine Gr-388 ± 3353 ± 3362 ± 3359.7 ± 0.4
Pristine HLM-261.6 ± 0.4210 ± 1191 ± 1183 ± 1
Table 2. Voltage ranges selected for shallow cycling experiments and the explanation for the selection of each voltage range.
Voltage RangeExperiment
4.4 V, CCCV—2.0 VBaseline experiment
4.4 V, CC—2.0 VSlightly limited Li2MnO3 activation
4.2 V, CCCV—2.0 VLimited Li2MnO3 activation
4.4 V, CCCV—2.8 VLimited Mn redox activity
4.2 V, CCCV—2.8 VLimited Li2MnO3 activation and Mn redox activity
Table 3. Number of cycles achieved above 80% SoH, total capacity throughput for these cycles, initial capacity at different C-rates, average discharge voltage at BoL and EoL, energy retention at BoL at different C-rates, and energy retention at 80% SoH with HLM||graphite FCCs and the different voltage cutoffs. The results with NMC811||graphite cells are included as a reference.
Voltage RangeNumber of Cycles Above 80% SoHTotal Capacity Throughput/mAh g−1Initial Capacity at 0.05 C/0.1 C/1 C/mAh g−1Average Discharge Voltage BoL/EoL in 0.1 C Cycles/VEnergy Density BoL at 0.05 C/0.1 C/1 C/Wh kg−1Energy Retention at 80% SoH (0.1 C)/%
4.4 V, CCCV—2.0 V12917,084217/186/1393.65/3.61793/675/47572.1
4.4 V, CC—2.0 V47952,613202/173/1063.69/3.66745/632/36270.4
4.2 V, CCCV—2.0 V87957,501106/106/72.53.69/3.68390/386/24279.3
4.4 V, CCCV—2.8 V22924,492205/175/1283.70/3.66760/645/44480.0
4.2 V, CCCV—2.8 V1754108,067104/102/633.72/3.66387/378/22074.3
NMC811 reference (4.2 V, CCCV—2.8 V)77996,438196/191/1573.77/3.63734/714/52980.6
Disclaimer/Publisher’s Note: The statements, opinions and data contained in all publications are solely those of the individual author(s) and contributor(s) and not of MDPI and/or the editor(s). MDPI and/or the editor(s) disclaim responsibility for any injury to people or property resulting from any ideas, methods, instructions or products referred to in the content.