Article

Investigation of Geometrical and Numerical Parameters on Ultra-High-Performance Concrete Link Slab Performance Using Finite Element Modeling


1
Department of Civil, Environmental and Infrastructure Engineering, George Mason University, Fairfax, VA 22030, USA
2
Department of Civil and Environmental Engineering, College of Engineering and Architecture, Howard University, Washington, DC 20059, USA
*
Author to whom correspondence should be addressed.
Appl. Mech. 2026, 7(1), 14; https://doi.org/10.3390/applmech7010014
Submission received: 17 October 2025 / Revised: 3 January 2026 / Accepted: 3 February 2026 / Published: 4 February 2026
(This article belongs to the Topic Advances on Structural Engineering, 3rd Edition)

Abstract

Traditional expansion joints in bridge structures are prone to durability problems, such as leakage, corrosion, and high maintenance demands, which can significantly reduce service life. To overcome these limitations, ultra-high-performance concrete (UHPC) link slabs have emerged as an effective jointless solution; however, their mechanical performance and sensitivity to key design and modeling parameters are not yet fully understood. This study presents a nonlinear finite element investigation of UHPC link slabs using the Concrete Damaged Plasticity (CDP) model in ABAQUS. A baseline model, validated against the experimental results, was established with a link slab length of 1100 mm and representative material and detailing properties. A systematic sensitivity analysis was then performed by varying five geometrical parameters (link slab length and thickness, debonding length, reinforcement diameter, and reinforcement spacing) and five numerical/material parameters (non-debonding and debonding interface friction coefficient, UHPC and normal concrete compressive strength, and steel yield strength). For each case, the load–displacement response was examined through initial stiffness (K0), yield and peak load–deformation values (Py, Δy and Pu, Δu), and ductility ratio (μ). The results highlight the dominant role of reinforcement detailing; larger bar diameters and closer spacing substantially increased stiffness and strength while maintaining ductility. Debonding length emerged as a critical tuning parameter, with longer debonding improving ductility but slightly reducing strength. Slab thickness primarily influenced stiffness, whereas overall length showed minor effects on peak capacity. On the numerical side, steel yield strength proved to be the most influential input, affecting all response measures, while the non-debonding interface friction coefficient strongly governed yield capacity. Variations in the debonding friction coefficient, UHPC compressive strength, and normal concrete strength exhibited secondary influence within the tested ranges. Overall, the findings provide practical guidance for both the designing and detailing of UHPC link slabs and the calibration of FEM (finite element modeling) models. By clarifying which parameters most strongly govern stiffness, strength, and ductility, this study supports more reliable structural design and efficient numerical modeling of UHPC link slabs in accelerated bridge construction applications.

1. Introduction

Bridge structures are critical to modern infrastructure, ensuring connectivity and facilitating economic growth. However, the durability and service life of these structures are often compromised due to the degradation of key elements such as expansion joints. Expansion joints, typically installed at the ends of simple-supported girders, accommodate thermal and mechanical movements. However, their susceptibility to chloride infiltration, water leakage, and debris accumulation often leads to severe deterioration, causing corrosion of reinforcement and concrete spalling [1,2,3]. This warrants frequent maintenance, significantly increasing lifecycle costs.
Jointless bridges have emerged as a promising solution to address these challenges. A key component in such bridges is the link slab, which replaces traditional expansion joints and provides continuity between adjacent spans. Conventional reinforced concrete (RC) link slabs, however, are prone to cracking due to their low tensile strength and the complex stress states induced by traffic loads, thermal variations, creep, and shrinkage [4,5,6]. To address these limitations, advanced materials such as ultra-high-performance concrete (UHPC) have been introduced. UHPC, with its superior tensile strength, high strain capacity, and enhanced durability, offers many advantages over conventional RC, particularly in limiting crack widths and improving structural longevity [7,8,9,10,11].
Recent studies have provided deeper insights into the behavior and design optimization of UHPC link slabs. Lepech and Li [6] demonstrated the crack control capabilities of engineered cementitious composites (ECCs) and UHPC, highlighting their potential to reduce maintenance demands. Lin et al. [1] performed numerical analyses showing that UHPC link slabs exhibit significantly higher tensile stiffness and load-carrying capacity when compared to RC link slabs, with enhanced resistance to environmental degradation. Further, Shan et al. [7] studied the flexural performance of UHPC thin slabs reinforced with steel bars, revealing improved durability in extreme conditions, which is particularly relevant for bridge applications.
Experimental research has played an important role in validating the performance of UHPC link slabs. Briseghella et al. [8] conducted monotonic tension tests, demonstrating that UHPC link slabs achieve 2.6 times the tensile stiffness and 2.4 times the ultimate load capacity compared to RC link slabs. Additionally, UHPC link slabs exhibited a higher number of cracks with significantly smaller crack widths, improving crack control and durability. These findings highlight the material’s potential for extending bridge service life and reducing maintenance costs.
Further advancements have explored the role of reinforcement detailing and debonding techniques in optimizing UHPC link slabs. Au et al. [12] investigated the effectiveness of debonding layers in reducing stress concentrations at girder interfaces, leading to enhanced crack control and durability. Sun et al. [13] studied the flexural performance of ultra-high-performance concrete-normal concrete composite slabs, providing insights into the material’s structural behavior under different loading conditions. Additionally, Hossain et al. [14] evaluated the long-term behavior of ECC-incorporated UHPC link slabs in joint-free bridge decks, confirming their effectiveness in enhancing structural resilience.
The research presented in this paper builds upon the experimental study conducted by Briseghella et al. [8], incorporating detailed Finite Element Modeling (FEM) to predict the mechanical behavior of UHPC link slabs under realistic conditions. Additionally, previous finite element investigations on pre-stressed UHPC girders have demonstrated the capability of advanced nonlinear modeling approaches to accurately capture the flexural behavior, crack propagation, and material response of UHPC structural members under service and ultimate load conditions [9]. The validated FEM model forms the foundation for a comprehensive parametric study, examining the influence of geometrical parameters—including link slab length, thickness, reinforcement diameter, and debonding length—as well as numerical parameters such as friction coefficients, compressive strengths of UHPC and normal concrete, and steel reinforcement yield strength on the structural performance of UHPC link slabs. The goal is to provide design optimization strategies for UHPC link slabs, ensuring cost-effective and durable solutions for bridge construction and rehabilitation.

2. Materials and Methods

2.1. Overview of Experimental Work

Briseghella et al. [8] conducted an experimental study to investigate the tension mechanisms of UHPC link slabs under monotonic tensile loading. The study aimed to compare the mechanical response of UHPC link slabs to that of conventional reinforced concrete (RC) link slabs in terms of stiffness, crack development, and load-bearing capacity.
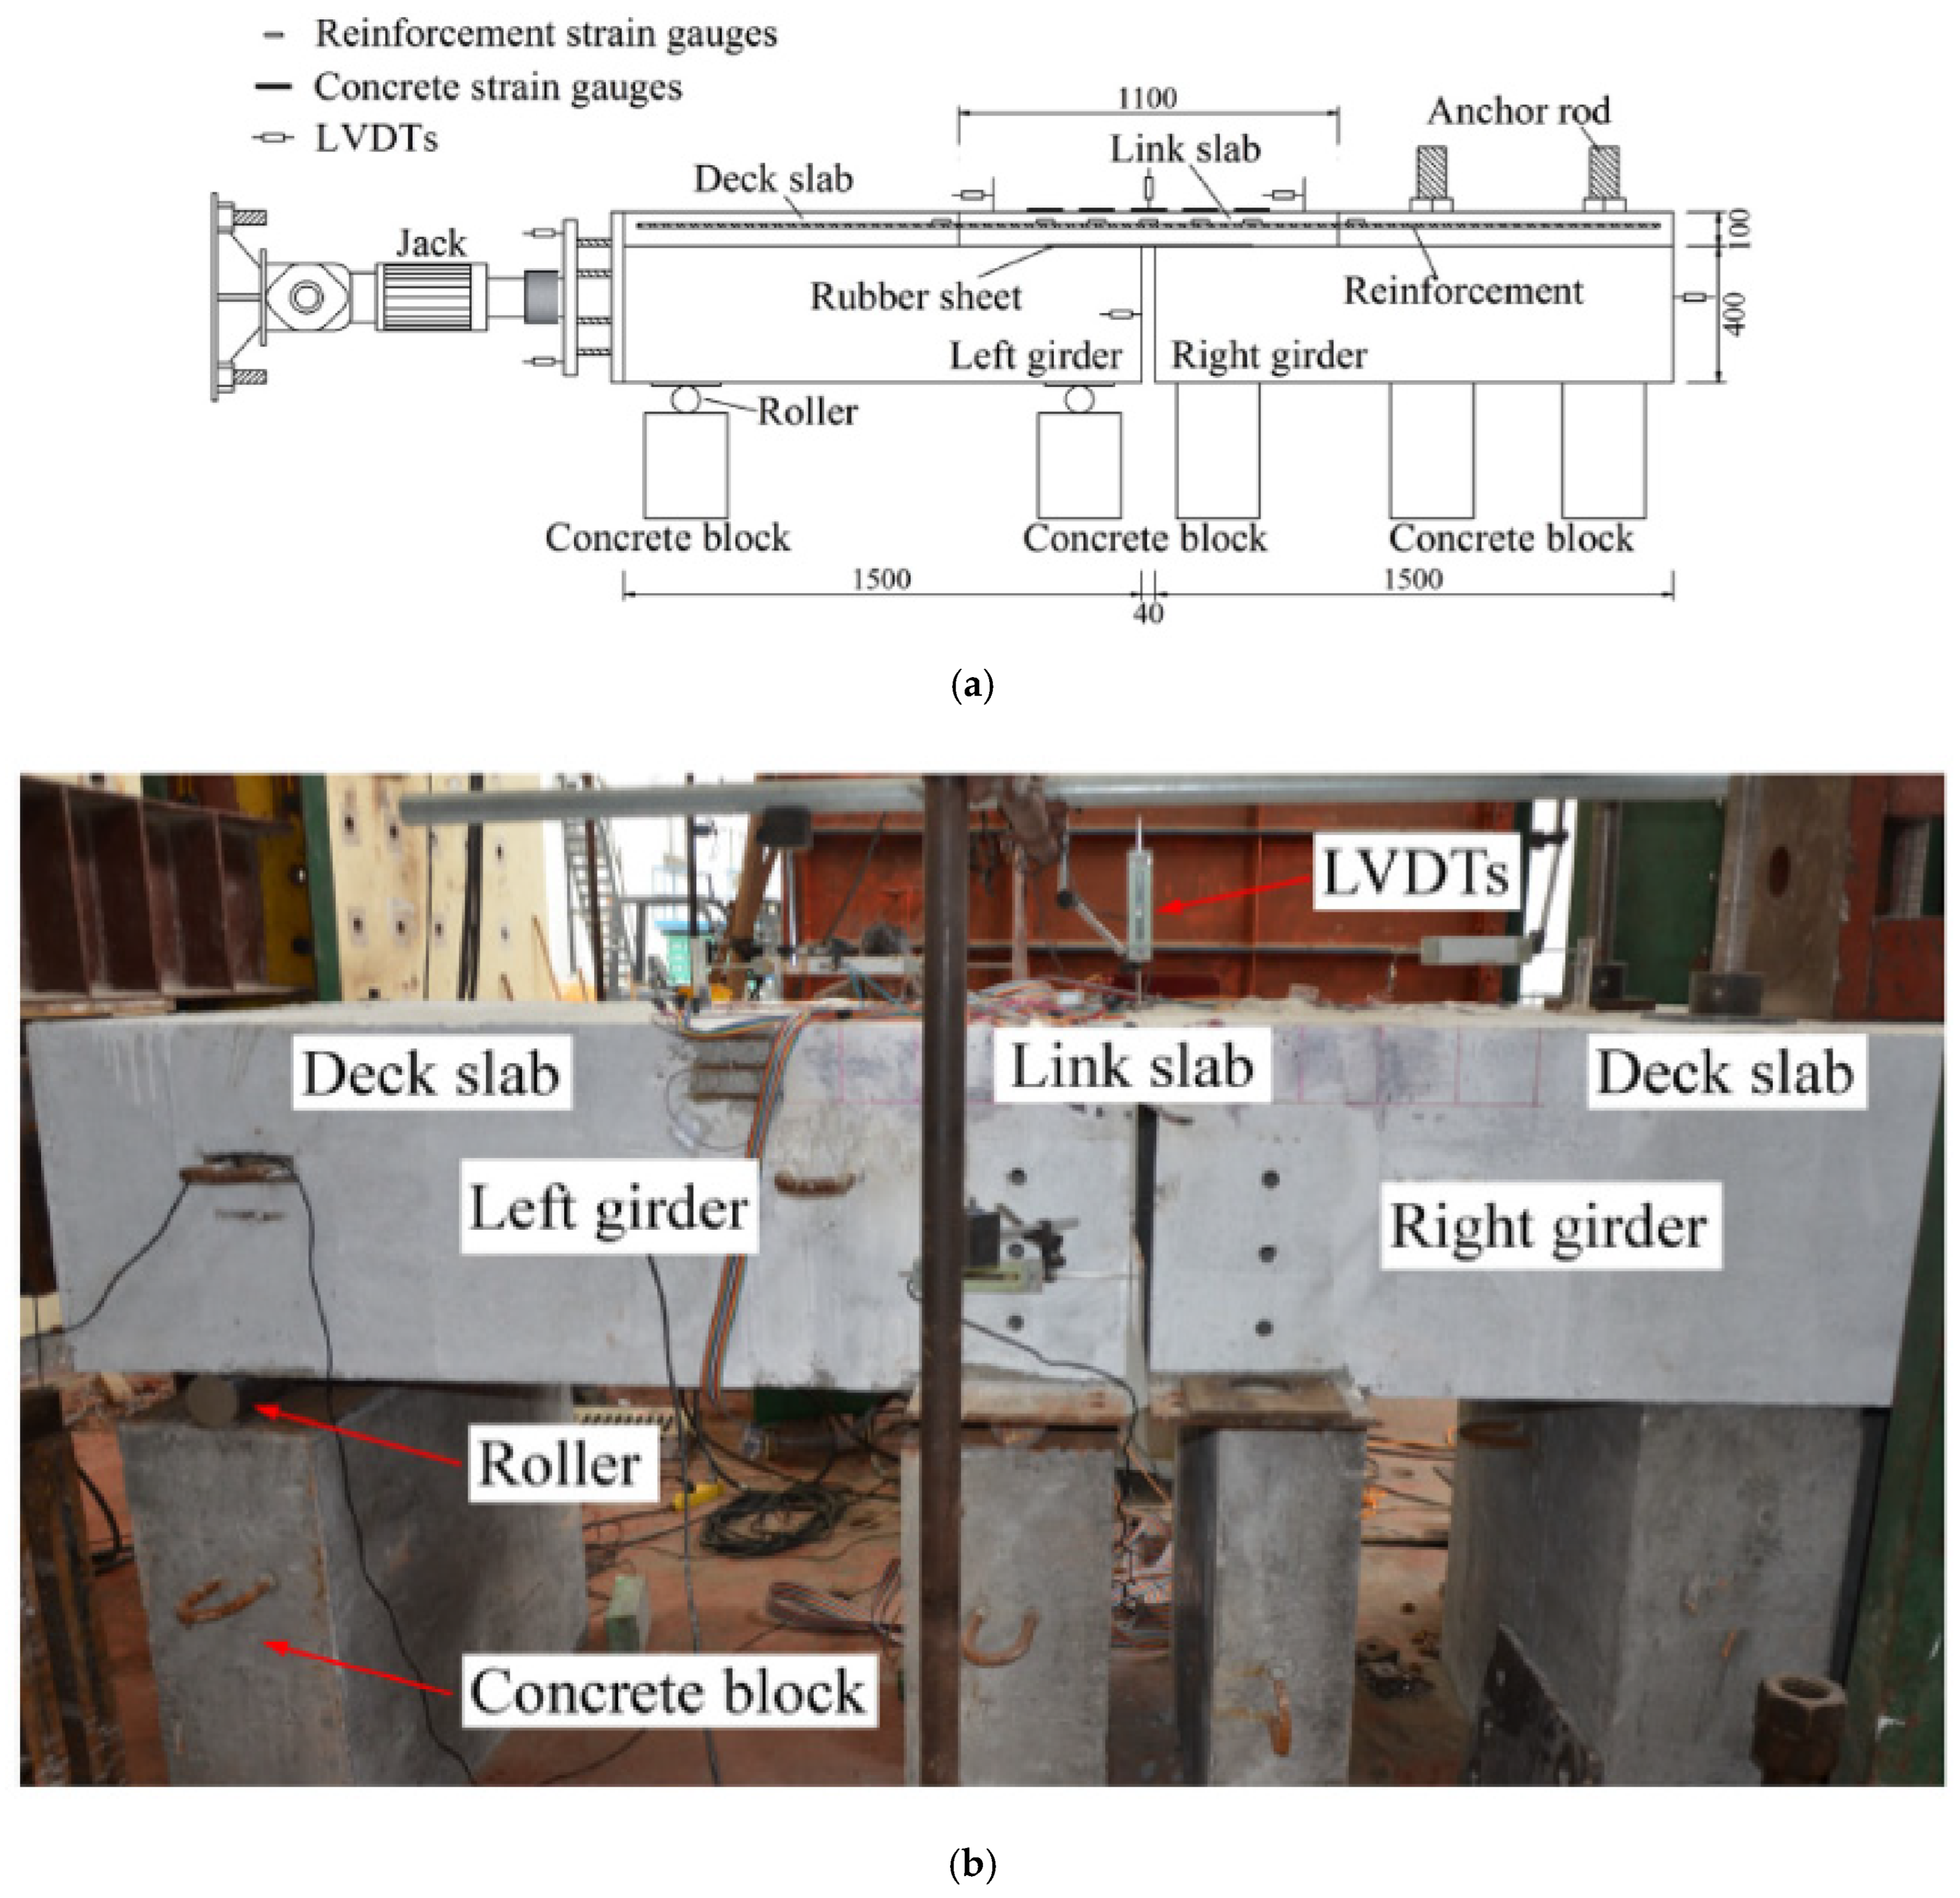
The experimental program involved testing two specimens, each consisting of two C40 concrete girders, two C40 concrete deck slabs, and one link slab. The primary difference between the specimens was the material used in the link slab: one was constructed with conventional concrete (C40), while the other utilized UHPC. The test setup included girders with a length of 1500 mm and a height of 400 mm, deck slabs measuring 970 mm in length and 100 mm in height, and link slabs with a length of 1100 mm and a height of 100 mm. The overall specimen width was 1000 mm. A rubber debonding layer with a thickness of 3 mm and a length of 600 mm was introduced between the link slab and the adjacent girders to simulate practical field conditions and reduce stress concentrations at the interface. These dimensions are illustrated in Figure 1a [8].
The test specimens were subjected to a horizontal tensile force applied using a hydraulic jack, simulating the longitudinal deformation induced by uniform temperature changes in bridge decks. The applied load was incrementally increased, and displacement-controlled loading was used to capture the structural response. Figure 1 presents an elevation view and the actual test setup [8].
The UHPC mix design consisted of a pre-blended powder matrix, silica fume, quartz sand, superplasticizers, steel fibers, and water. The mix included cement, silica fume, fine and coarse aggregates, superplasticizers, and steel fibers to enhance durability and tensile capacity. Material characterization tests determined the mechanical properties of both UHPC and conventional concrete, confirming the superior strength and ductility of UHPC compared to traditional concrete [8]. Additionally, the reinforcement consisted of HRB335 steel bars with an elastic modulus of 200 GPa, a yield strength of 342 MPa, and an ultimate strength of 520 MPa [8].
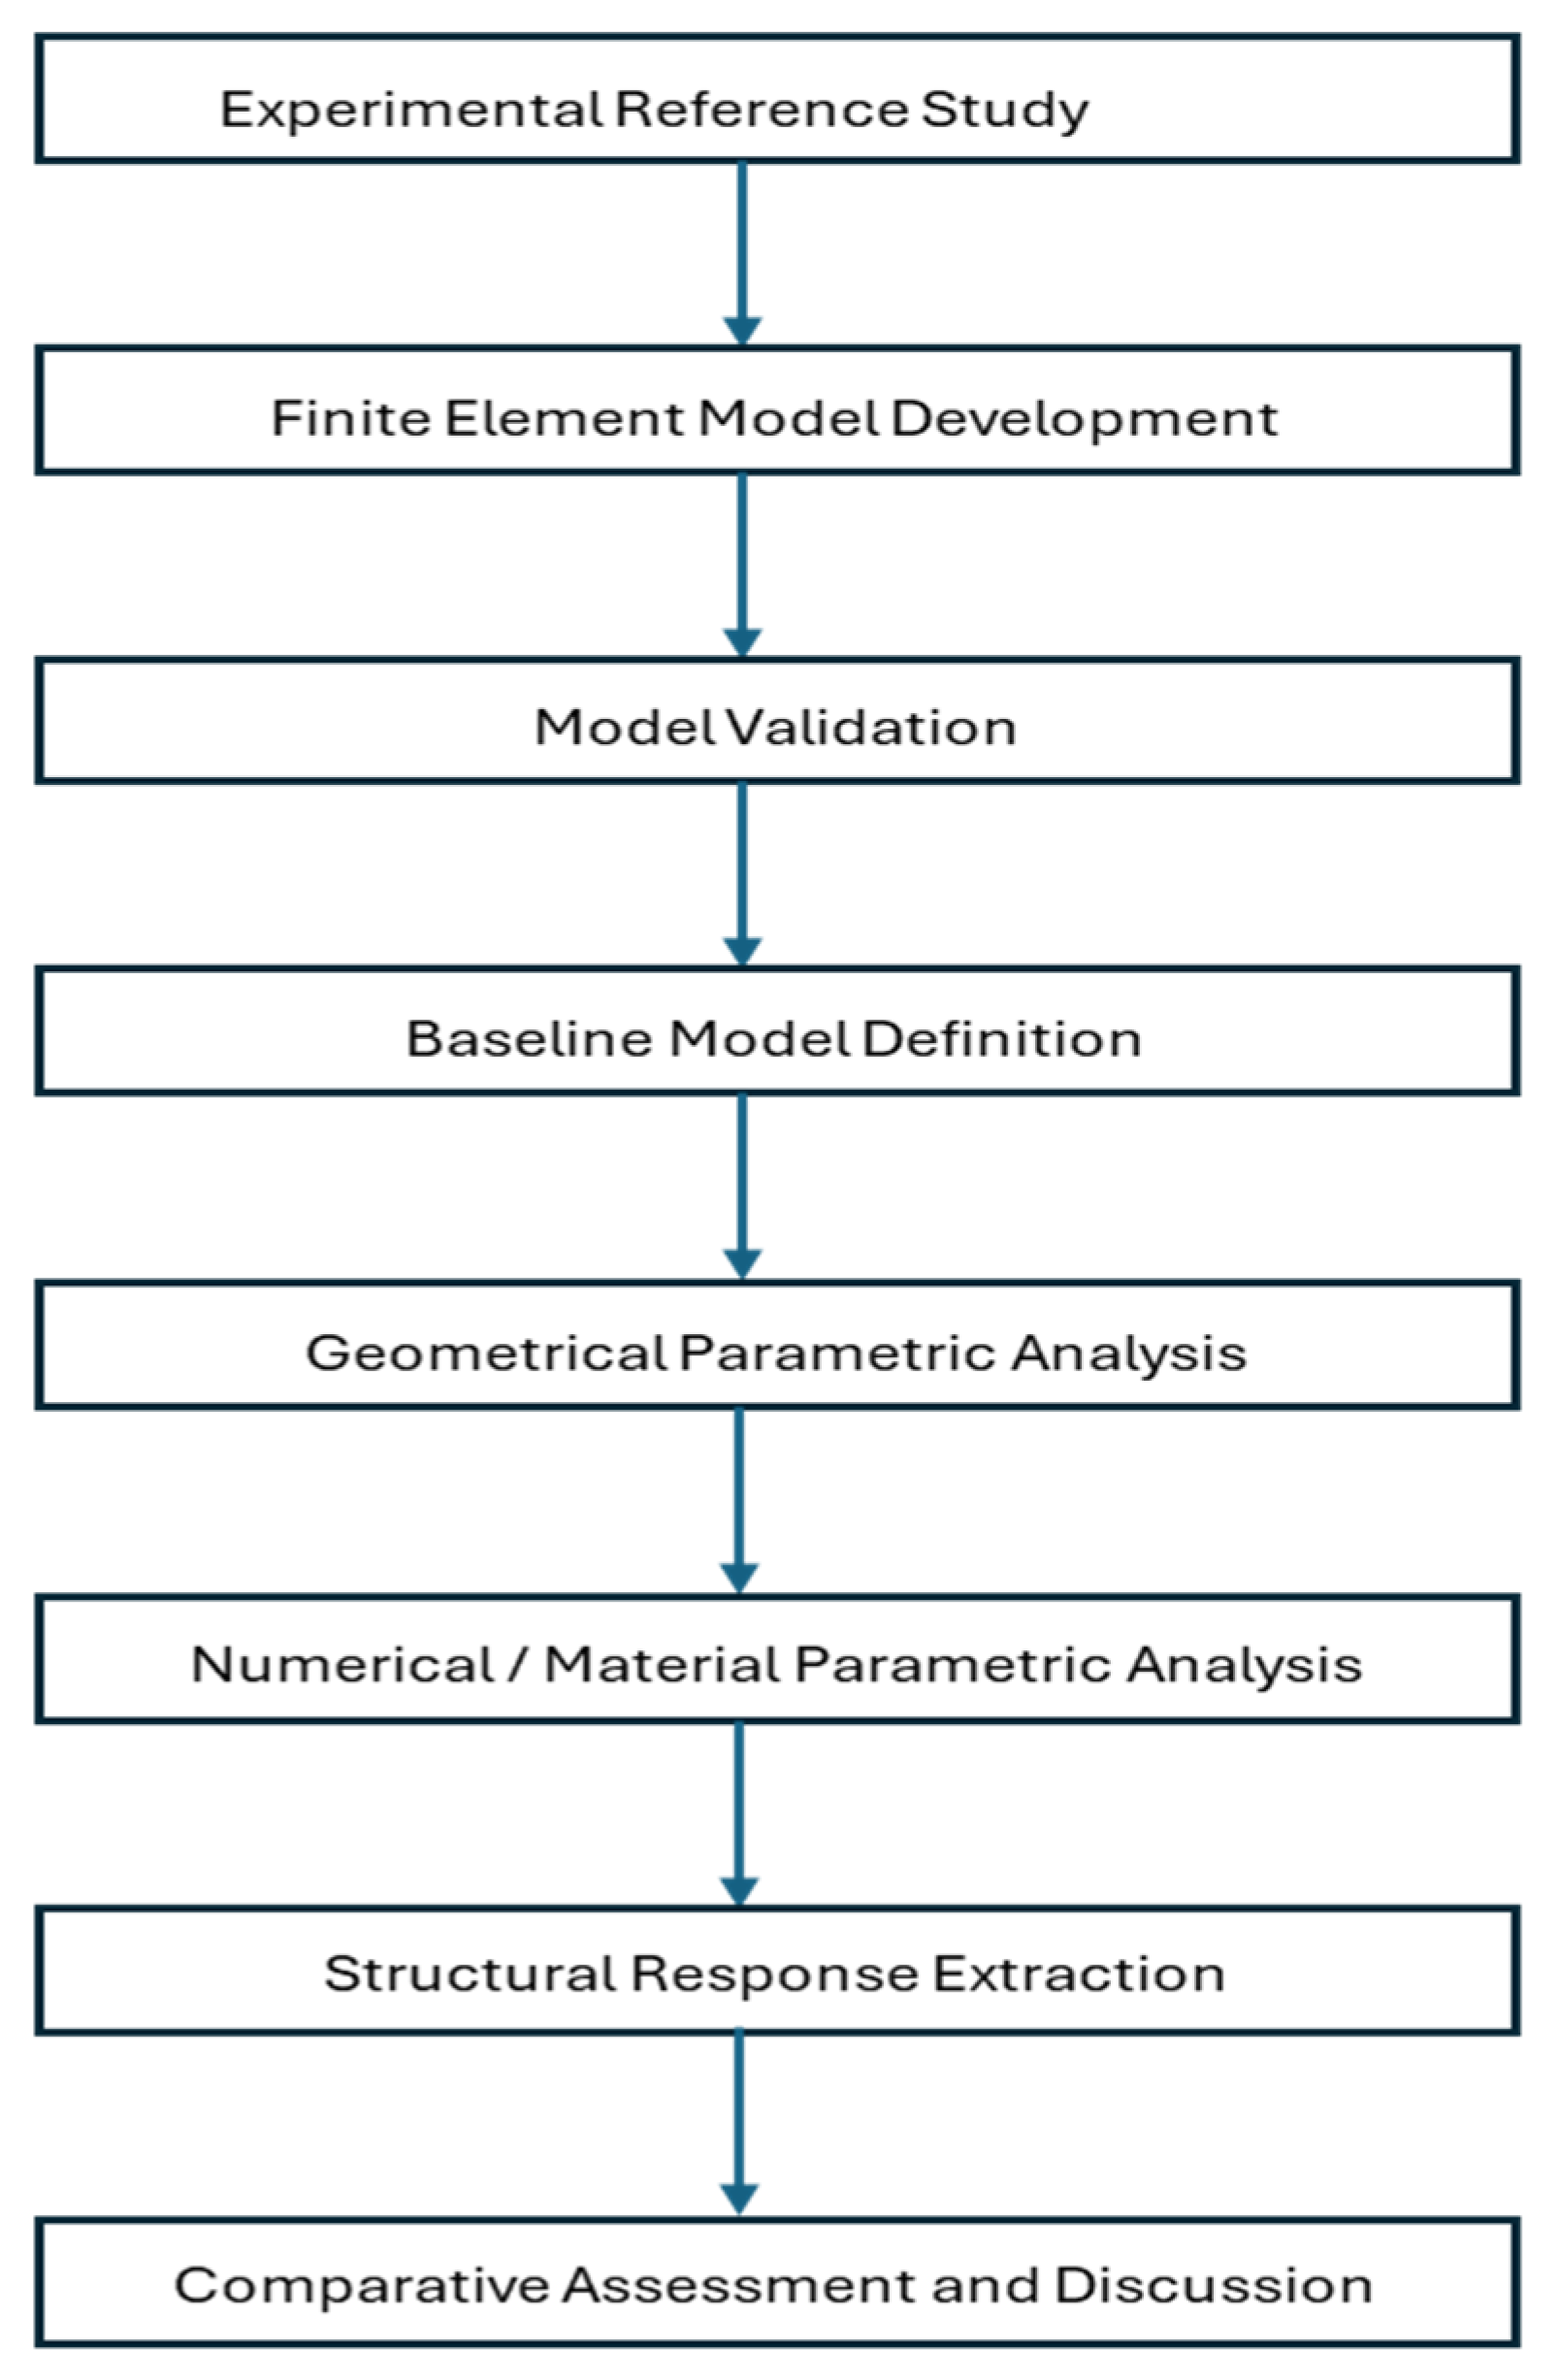
To improve clarity and provide a structured overview of the research methodology, a flowchart summarizing the overall research process is presented in Figure 2. The flowchart outlines the sequential steps followed in this study, from the selection of the experimental reference and development of the finite element model to model validation, baseline definition, and subsequent geometrical and numerical parametric analyses.
As illustrated in Figure 2, the experimentally validated finite element model serves as the foundation for the subsequent parametric investigations. Following validation, the baseline configuration is defined, and systematic variations of key geometrical and numerical parameters are performed. The resulting structural responses are then extracted and compared to quantify the influence of each parameter on the mechanical behavior of UHPC link slabs.

2.2. Finite Element Model

A comprehensive Finite Element Analysis (FEA) was conducted to examine the structural behavior of the laboratory-scale experimental model, which consists of multiple components, including girders, deck slabs, a UHPC link slab, reinforcement, and a rubber debonding sheet. ABAQUS 2023 [15] was utilized to develop the numerical model, ensuring appropriate replication of the experimental setup. The investigation focused on capturing key structural responses, including the load versus maximum displacement of the link slab, crack propagation patterns, and the relationship between load and both UHPC and reinforcement strain under displacement-controlled loading. After validating the FE numerical model against the experimental results, a parametric study was conducted to optimize UHPC link slab design by analyzing the influence of slab thickness, reinforcement ratios, and debonding techniques.
The development of the numerical model encompassed essential considerations such as geometry, material model implementation, discretization techniques, defining interactions between different materials, establishing appropriate boundary conditions, and utilizing displacement-controlled loading. These factors were carefully implemented to ensure an accurate representation of the experimental behavior. The subsequent sections provide further details of the FEA.

2.2.1. Geometry and Discretization

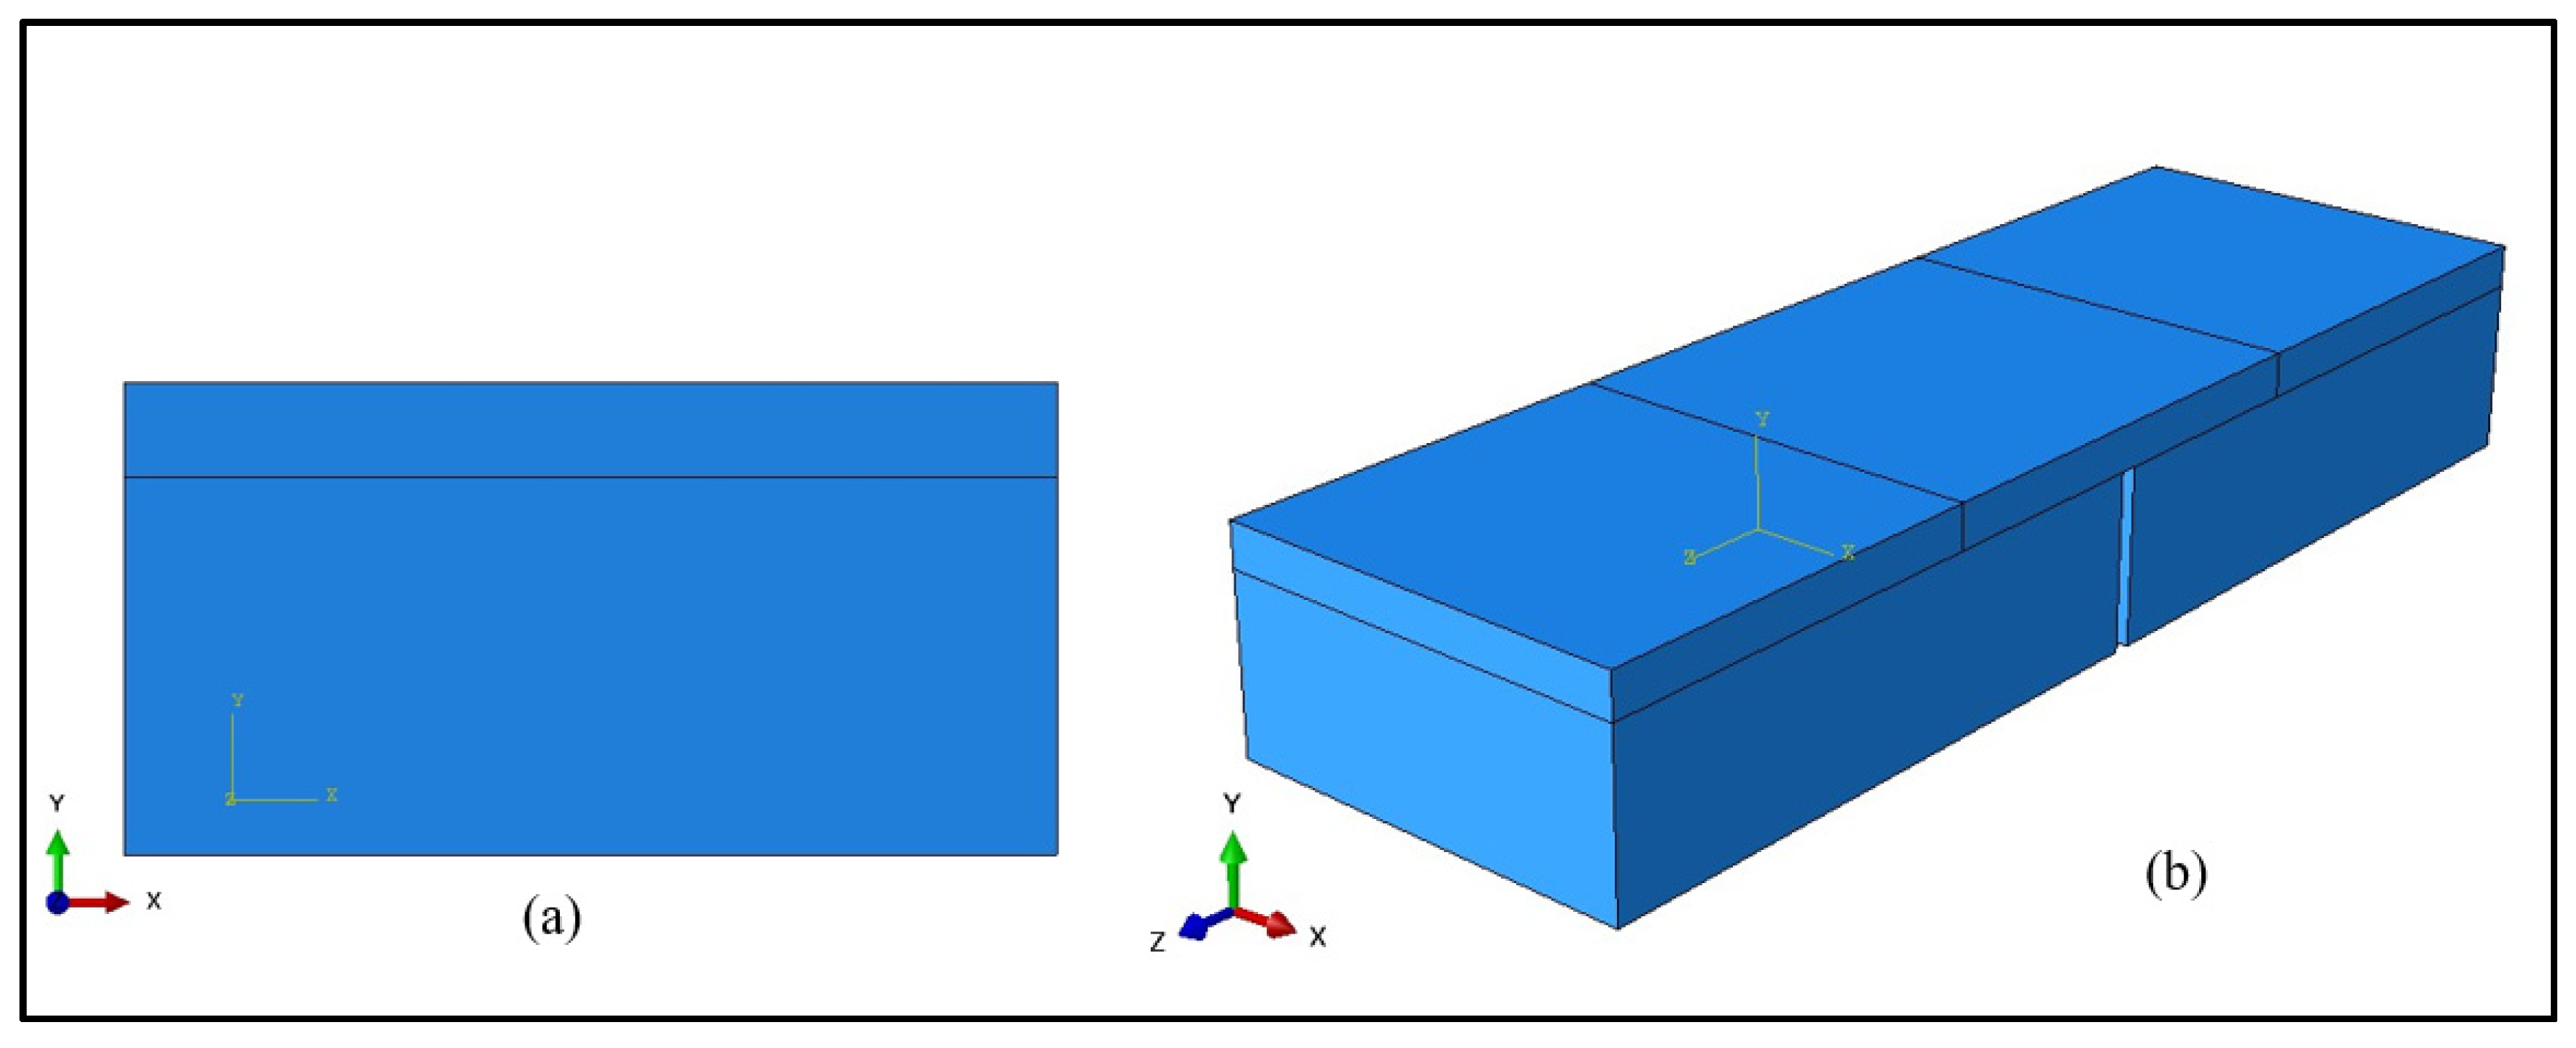
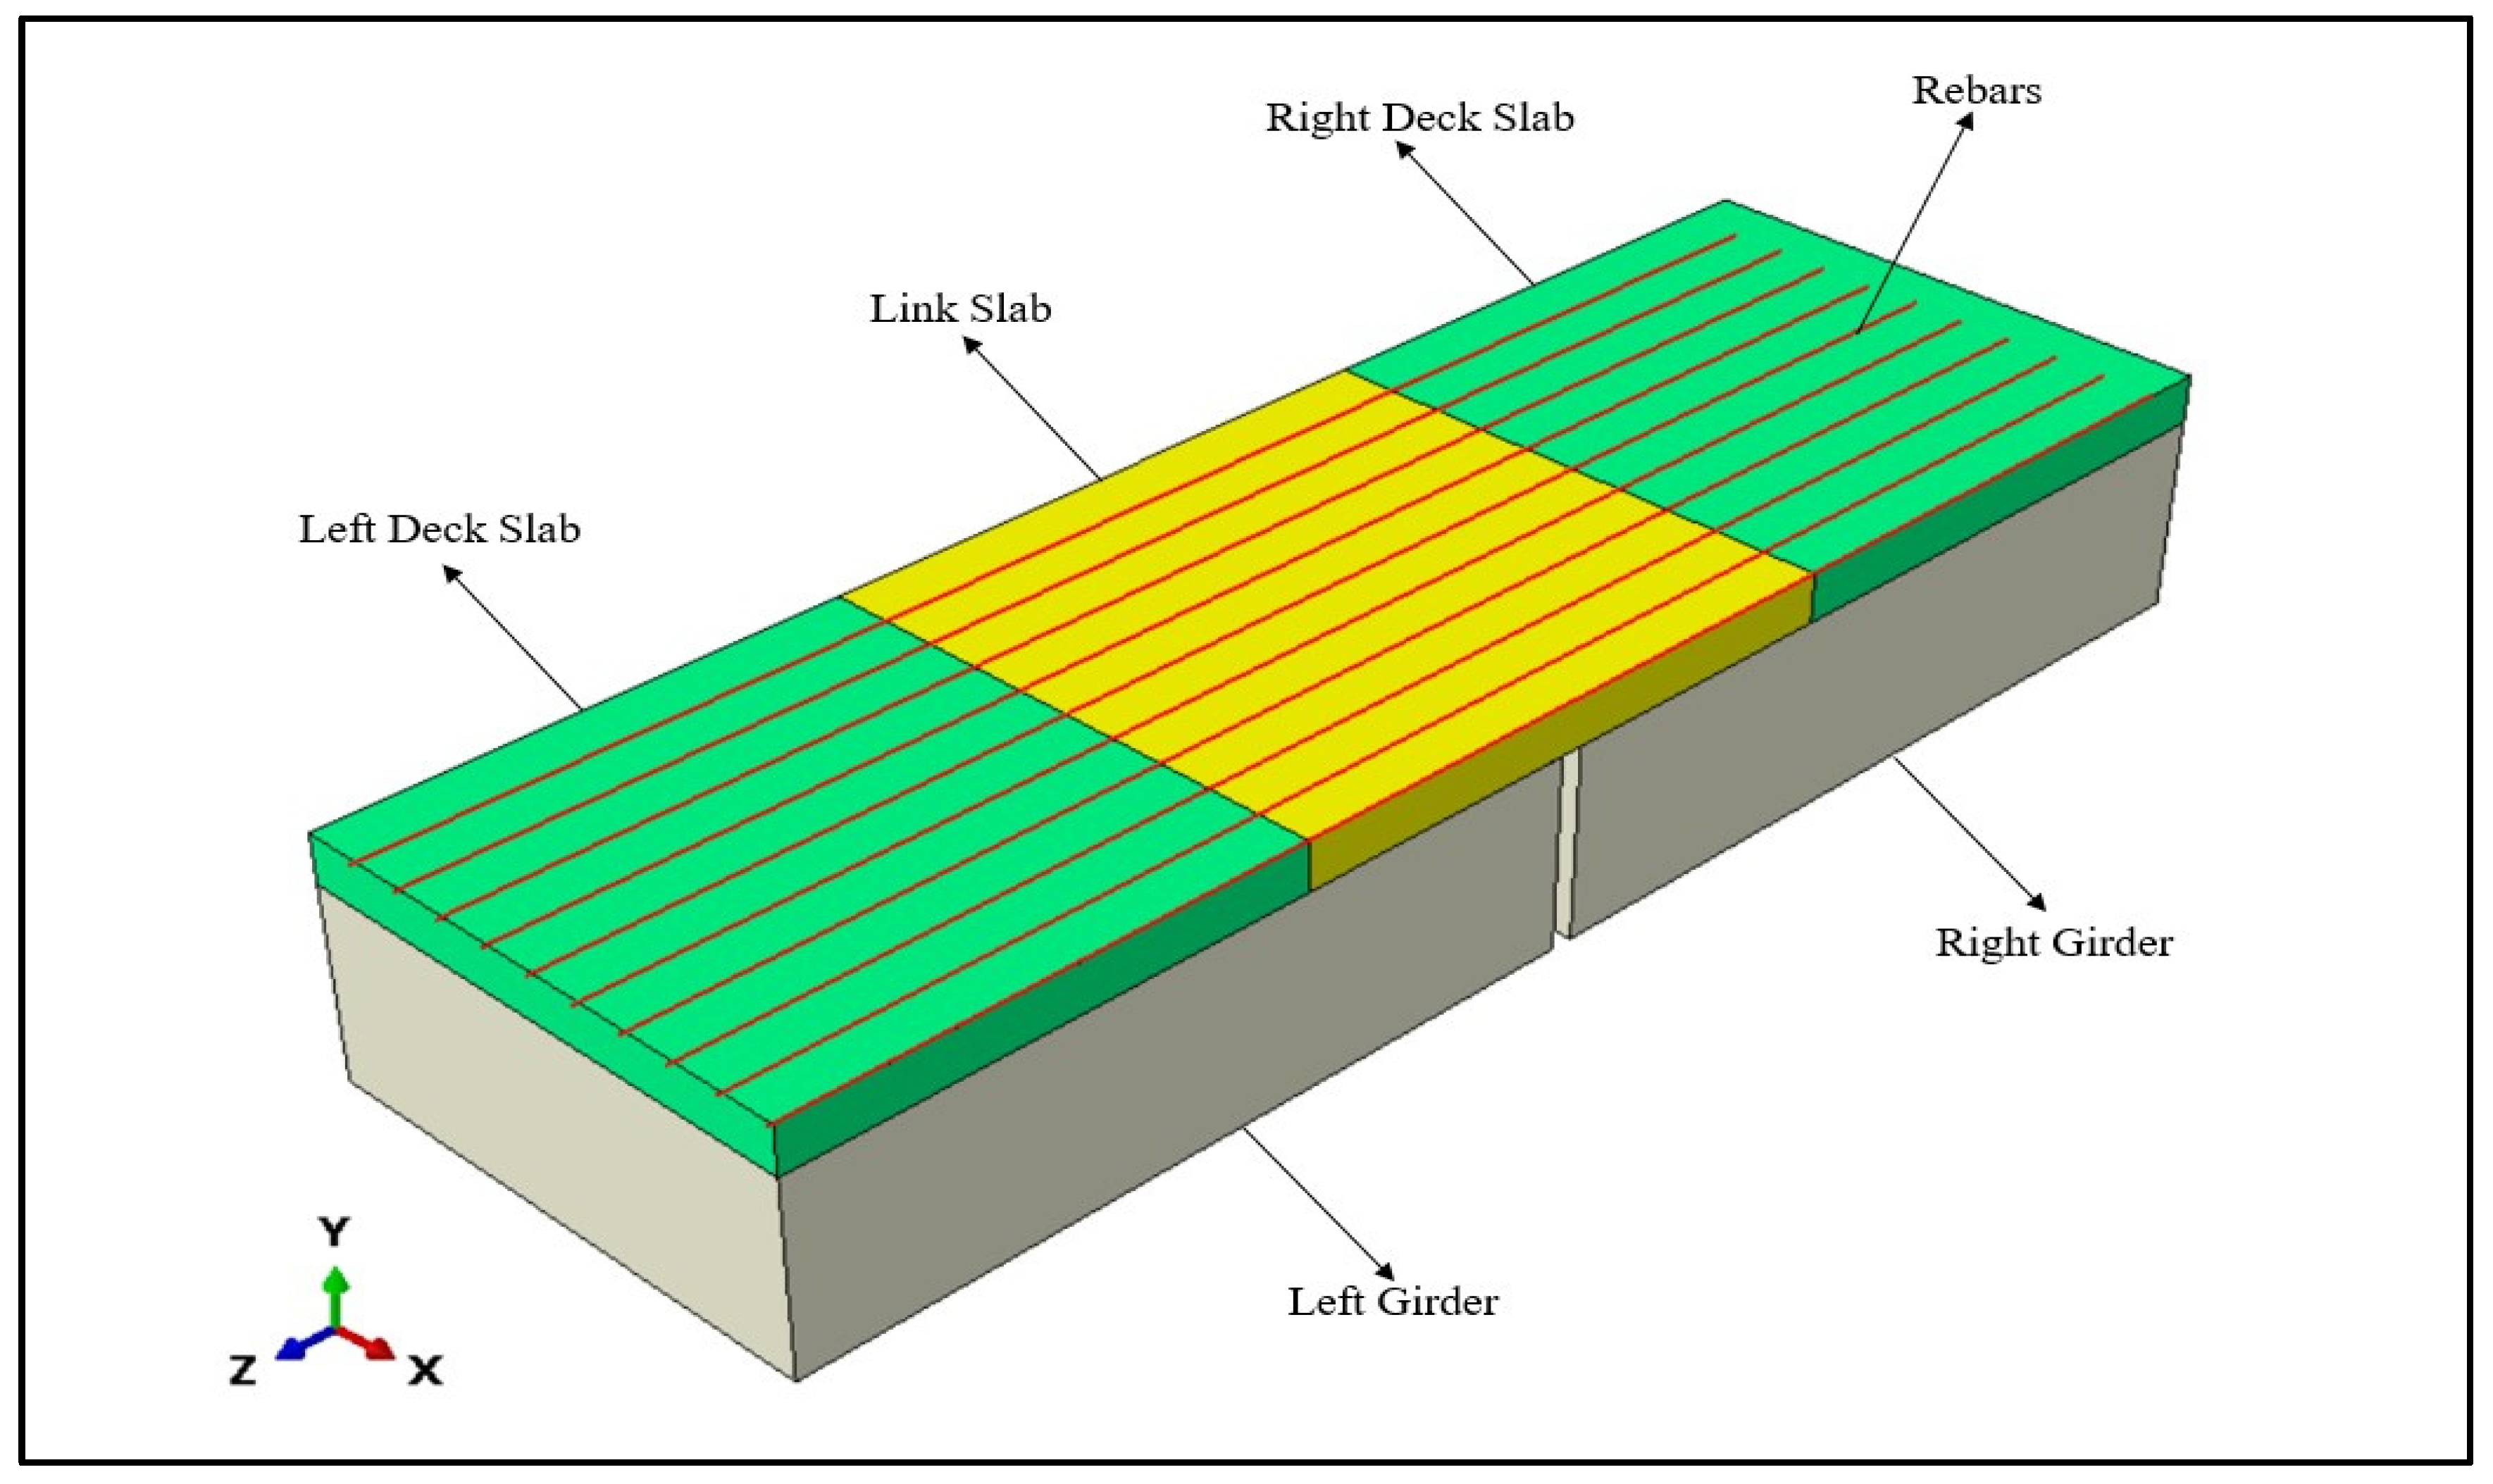
The geometric representation of the UHPC link slab system was developed in ABAQUS to accurately replicate the experimental setup. The model includes two girders, two deck slabs, a UHPC link slab, and a reinforcement layout, with each component precisely defined to reflect its physical dimensions. Figure 3 illustrates the overall geometric configuration of the model, providing different views to showcase the structural arrangement. Additionally, Figure 4 presents a detailed breakdown of the individual components, including the left and right girders, left and right deck slabs, reinforcement layout, and UHPC link slab, ensuring a comprehensive understanding of the modeled system.
The discretization process employed an appropriate element formulation to accurately capture the structural behavior. The UHPC link slab, girders, and deck slabs were meshed using eight-node reduced integration brick elements (C3D8R). These elements, possessing eight nodes with three degrees of freedom in the x, y, and z directions, are well-suited for modeling the complex behavior of concrete, including tensile cracking, compressive crushing, and large deformations [15]. The steel reinforcement was represented using two-node truss elements (T3D2), with each strand’s cross-sectional properties explicitly defined within the 3D solid. T3D2 elements are specifically designed to simulate one-dimensional strands, assuming deformation occurs primarily through axial stretching [15].
A structured meshing strategy was implemented to achieve an optimal balance between computational efficiency and numerical accuracy. A finer mesh size of 20 mm was applied to the UHPC link slab to capture localized stress distributions and crack propagation, while a coarser mesh size of 40 mm was assigned to the girders, deck slabs, and reinforcement to enhance computational efficiency. The final FEM consisted of 37,471 elements, ensuring a high-resolution representation of the entire structural system.
During model development, a mesh-sensitivity check was performed by refining the mesh in critical regions of the link slab to verify that the global force–displacement response and key response measures were not governed by discretization. The adopted mesh sizes (20 mm in the UHPC link slab and 40 mm in the remaining components) were selected because further refinement did not lead to meaningful changes in the global response while substantially increasing computational demand.

2.2.2. Constitutive Model for UHPC and Normal Concrete

ABAQUS provides three constitutive models for simulating the behavior of concrete structures: the Concrete Damaged Plasticity (CDP) model, the concrete smeared cracking model, and the concrete brittle cracking model [15]. The brittle cracking model is typically applied to plain concrete or structures with minimal reinforcement, such as those found in dam engineering. Conversely, both the CDP model and the smeared cracking model are suitable for reinforced concrete structures, with the CDP model offering superior computational efficiency and convergence behavior compared to the smeared cracking model [16]. Given these advantages, the CDP model was adopted in this study to simulate both conventional concrete and UHPC materials.
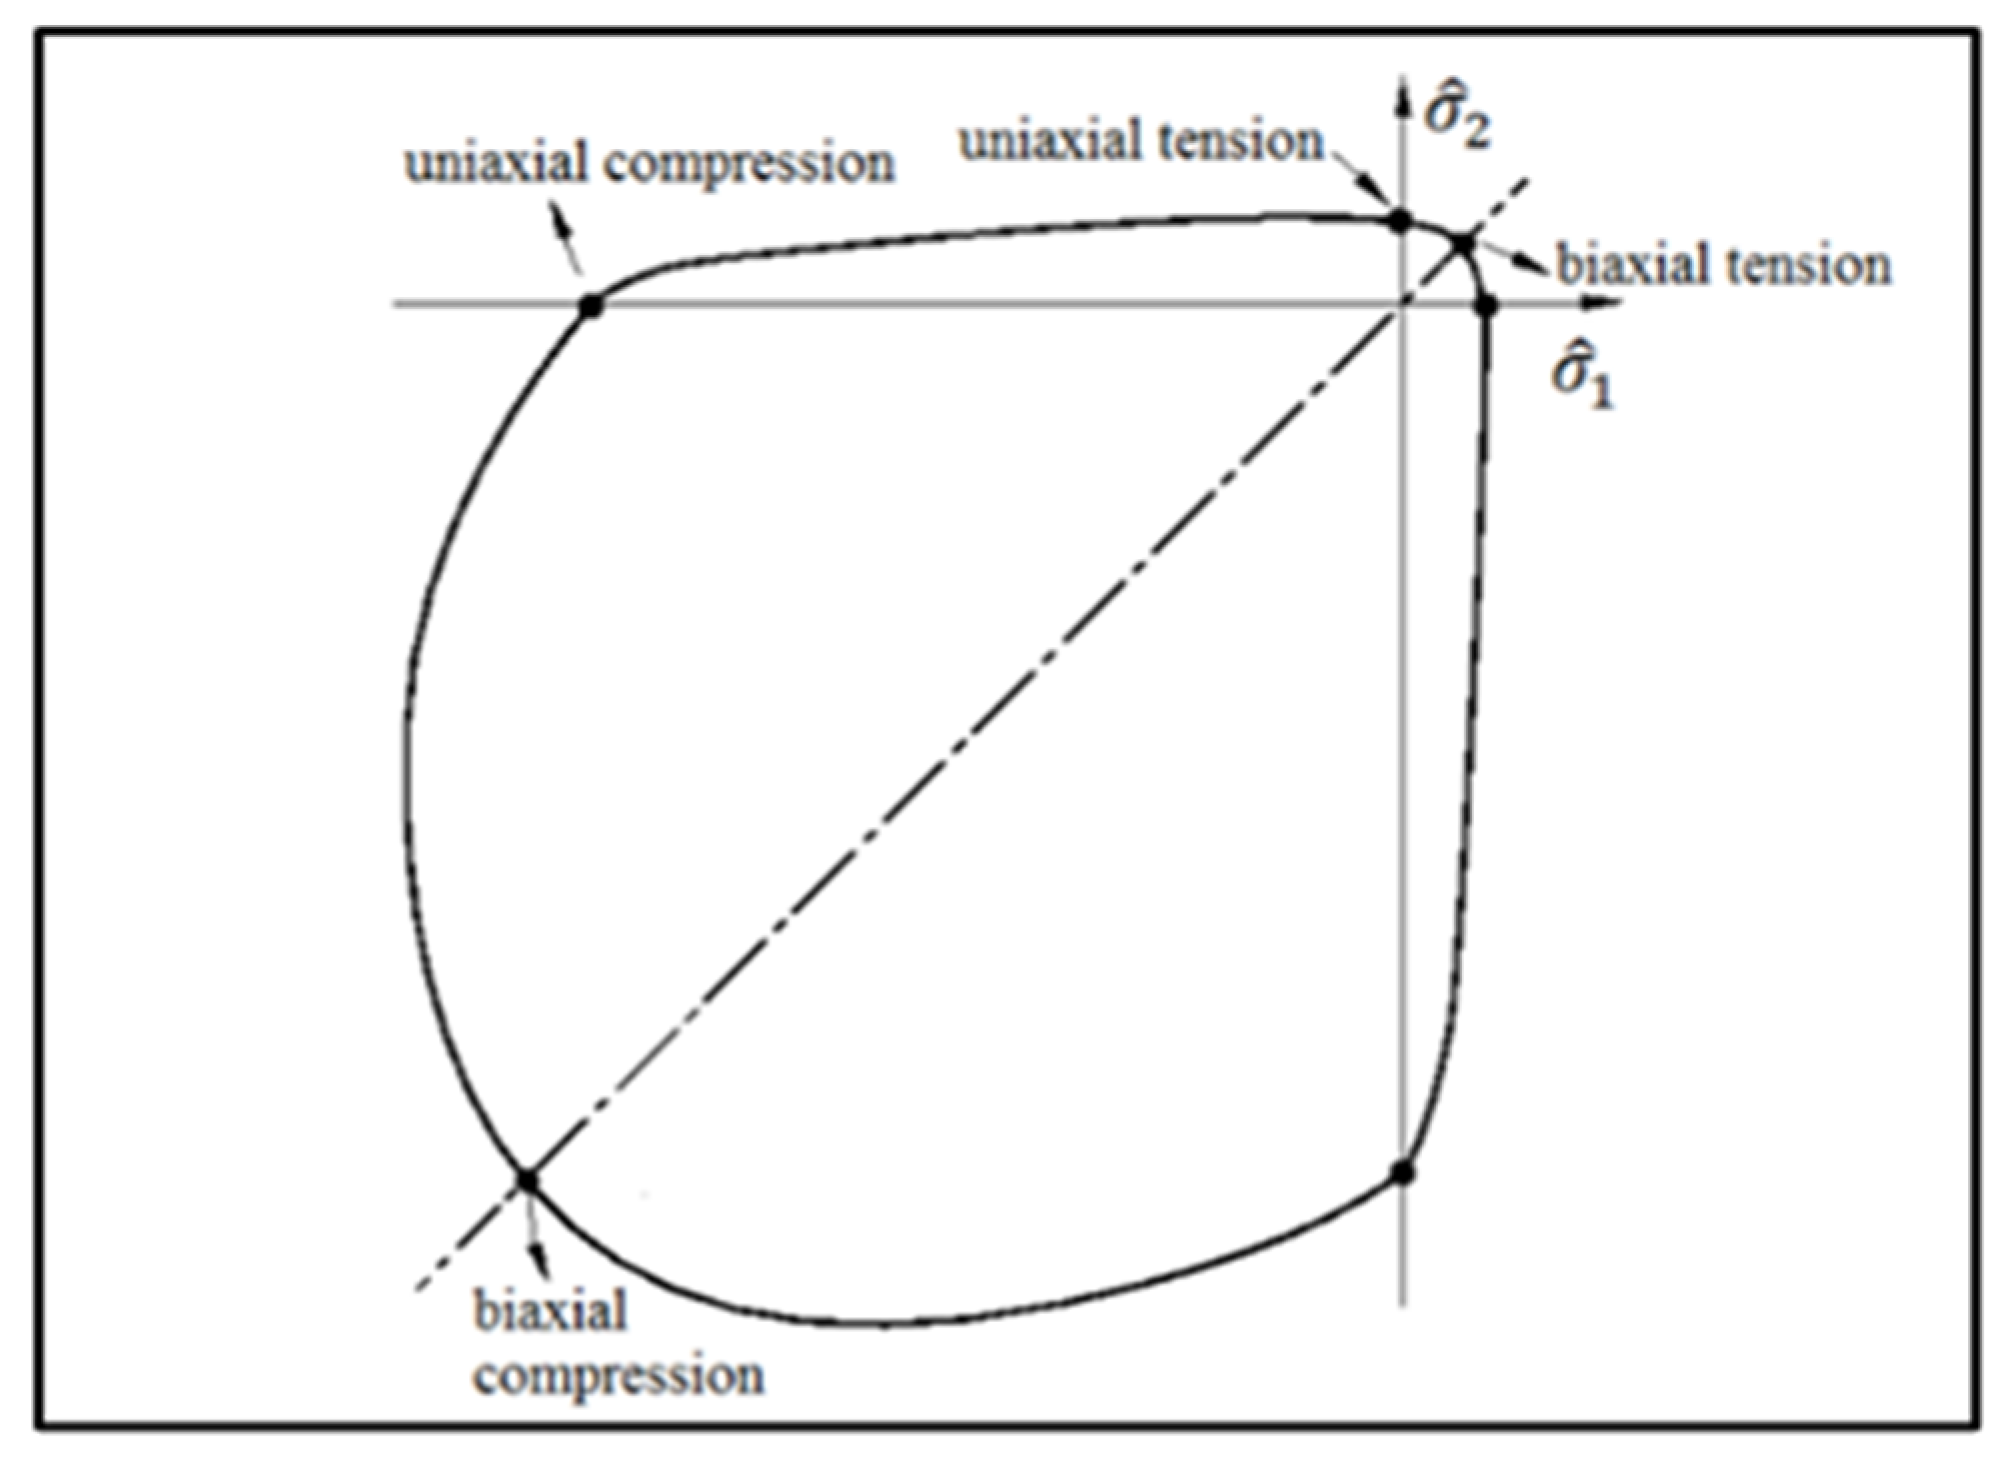
The CDP model is a smeared crack-based constitutive model that operates within the framework of plastic flow theory [17]. Its yield surface is derived from the formulation proposed by Lubliner et al. [18], with modifications introduced by Lee and Fenves [19] to differentiate between the evolution of material strength under tensile and compressive loading. Figure 5 illustrates the yield surface of the CDP model under plane stress conditions.
This material model integrates isotropic damage evolution with isotropic tensile and compressive plasticity to effectively represent the inelastic behavior of concrete. It accounts for strain hardening in compression, strain stiffening in tension, and independent damage initiation and accumulation in both tension and compression. The CDP model employs a non-associated flow rule and a plastic potential function to define its inelastic behavior. It considers two primary failure mechanisms: tensile cracking and compressive crushing of concrete. The evolution of the failure surface is controlled by two hardening parameters, which are associated with the plastic strain under tensile and compressive loading, respectively. To accurately define the material behavior using the CDP model, essential material properties such as compressive hardening, tensile stiffening, elastic modulus, Poisson’s ratio, and density must be specified for both UHPC and conventional concrete [15,17,20,21].
The CDP model for UHPC requires five key parameters to define its plasticity behavior: σb0/σc0, kc, ψ, ζ, μ, and μ. The ratio σb0/σc0 represents the biaxial compressive strength relative to the uniaxial compressive strength and plays a crucial role in shaping the yield surface under plane stress conditions. The parameter kc influences the failure surface in the deviatoric plane by determining the ratio of distances from the hydrostatic axis to the tensile and compressive meridians.
The parameters ψ and ζ govern the characteristics of the non-associated potential flow. The dilation angle ψ defines the inclination of the failure surface relative to the hydrostatic axis within the meridional plane, whereas ζ controls the divergence of the hyperbolic plastic potential from its asymptote. Lastly, the viscosity parameter μ is employed for viscoelastic regularization, enhancing the numerical stability of the concrete constitutive equations [15,17,21,22].
The CDP parameters for both normal concrete and UHPC were determined based on a preliminary parametric calibration informed by available experimental evidence and the established literature, aiming to ensure accurate material representation under monotonic loading. The selected values for the CDP parameters are as follows for normal concrete and UHPC, respectively: σb0/σc0 = 1.16 and 1.16, kc = 0.666 and 0.5, ψ = 35 and 35, ζ = 0.1 and 0.1, and μ = 0.0001 and 0.0001. Furthermore, a Poisson’s ratio of 0.2 was assigned to both normal concrete and UHPC. The material densities were specified as 2500 kg/m3 for normal concrete and 2482 kg/m3 for UHPC [1,8].
In this calibration, the CDP parameters were selected to reproduce the monotonic global response of the experimental benchmark (initial stiffness, yielding, peak capacity, and post-yield softening trend) while maintaining stable convergence for nonlinear damage evolution. Parameters governing plastic flow and volumetric dilation (e.g., dilation angle and eccentricity) primarily influence inelastic deformation characteristics and damage progression, whereas k c and σ b 0 / σ c 0 control the shape of the yield surface and the relative strength evolution under multiaxial stress states. The viscosity parameter was retained at a small value to improve numerical robustness without altering the intended quasi-static response.
The CDP model accounts for stiffness degradation in both tension and compression for concrete. This degradation is characterized using scalar damage variables, which increase as plastic strains develop and intensify with higher strain levels. These variables represent the reduction in material stiffness due to applied loading, ranging from zero (0) for an undamaged state to unity (1) for complete material failure. In tension, the damage parameter becomes active once the material surpasses its peak tensile strength. Consequently, damage contours indicate the onset and propagation of tensile cracking, with greater strain and load levels leading to more extensive damage and crack widening. To capture the effect of stiffness reduction due to cracking, a tension damage parameter is incorporated into the finite element model, as expressed in Equation (1). This parameter assumes that the tension damage variable is a function of plastic strain, remaining zero (indicating no damage) when plastic strain is absent. Similarly, the CDP model integrates stiffness degradation in compression, which is represented by Equation (2) [20,21,22], where σ t , f t , σ c , E c , and ε c i n are tensile stress, tensile strength, compressive stress, elastic modulus, and inelastic compressive strain, respectively.
d t = 1 σ t f t
d c = 1 [ σ c E c 0.2 × ε c i n + σ c E c ]
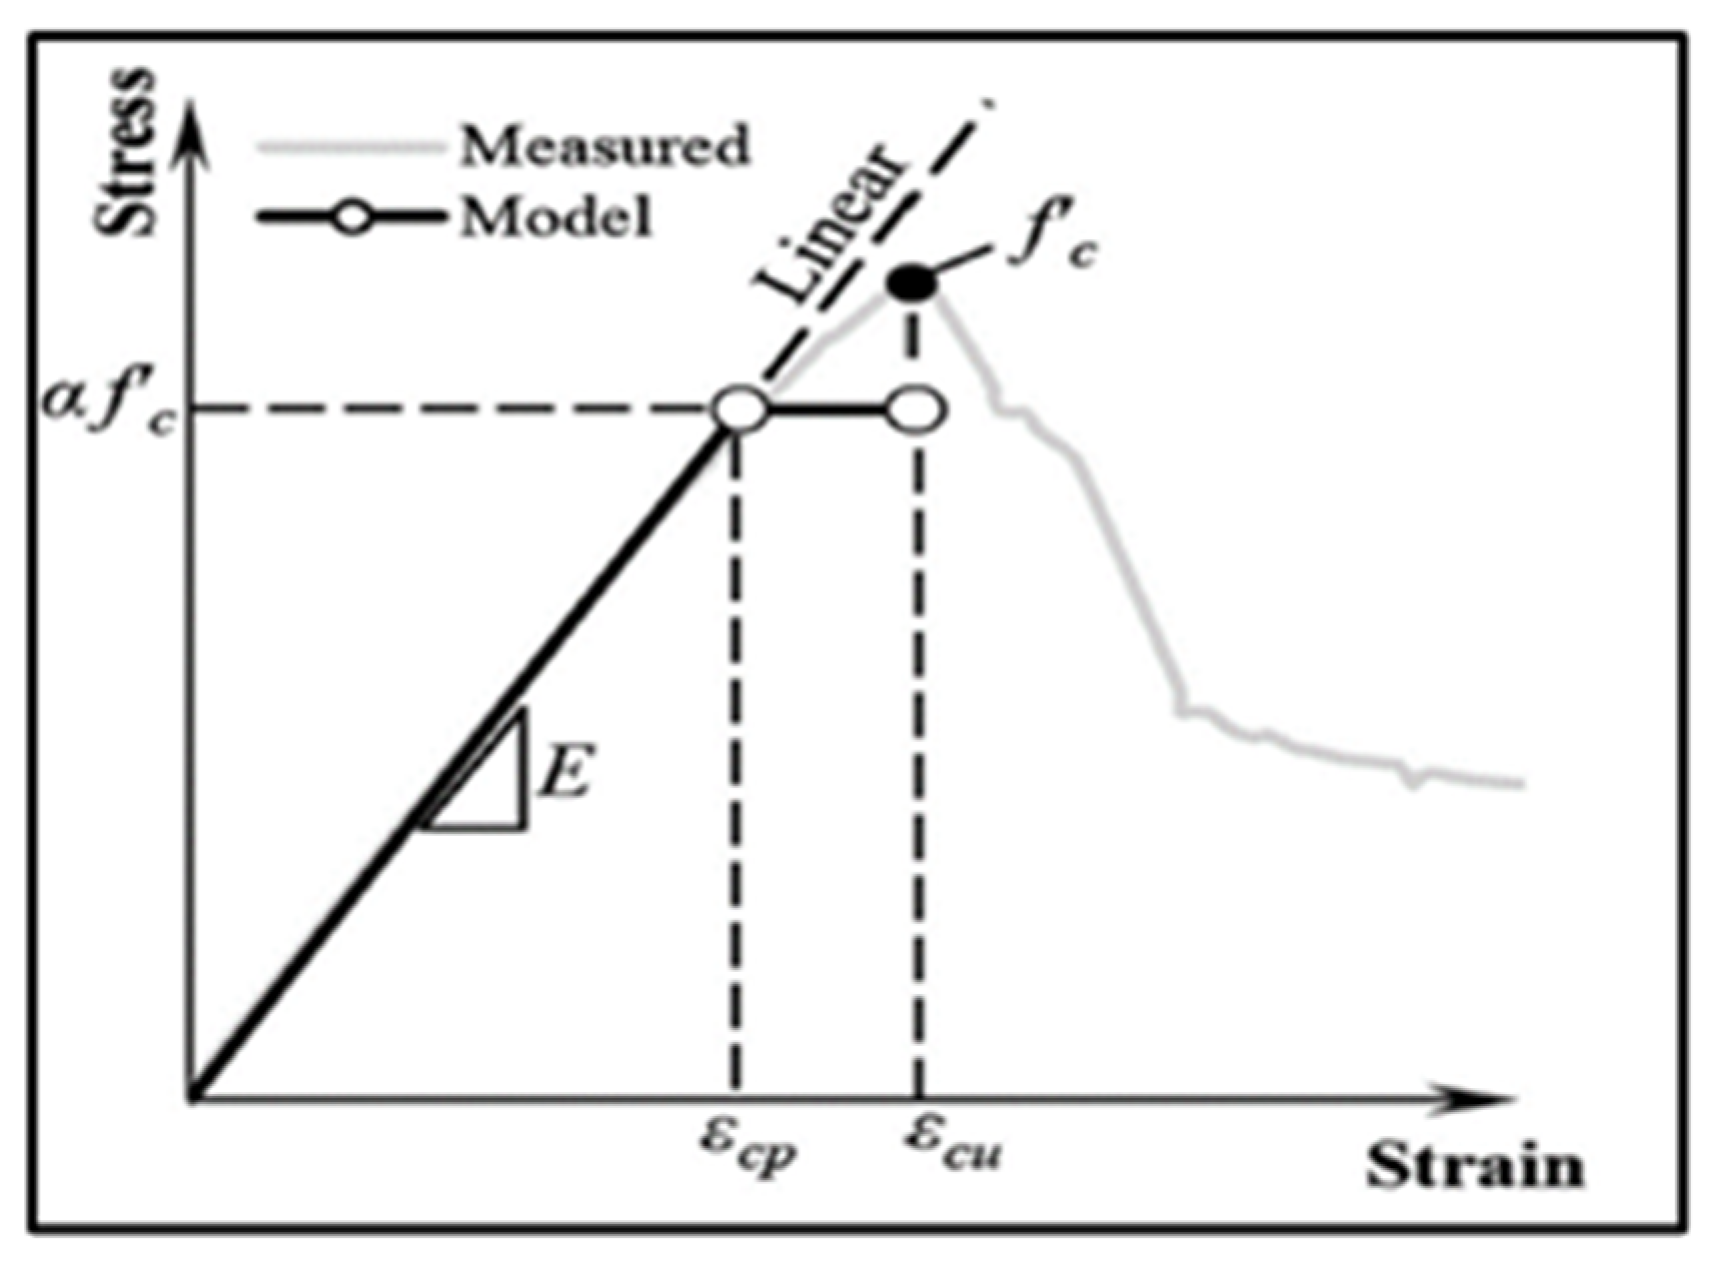
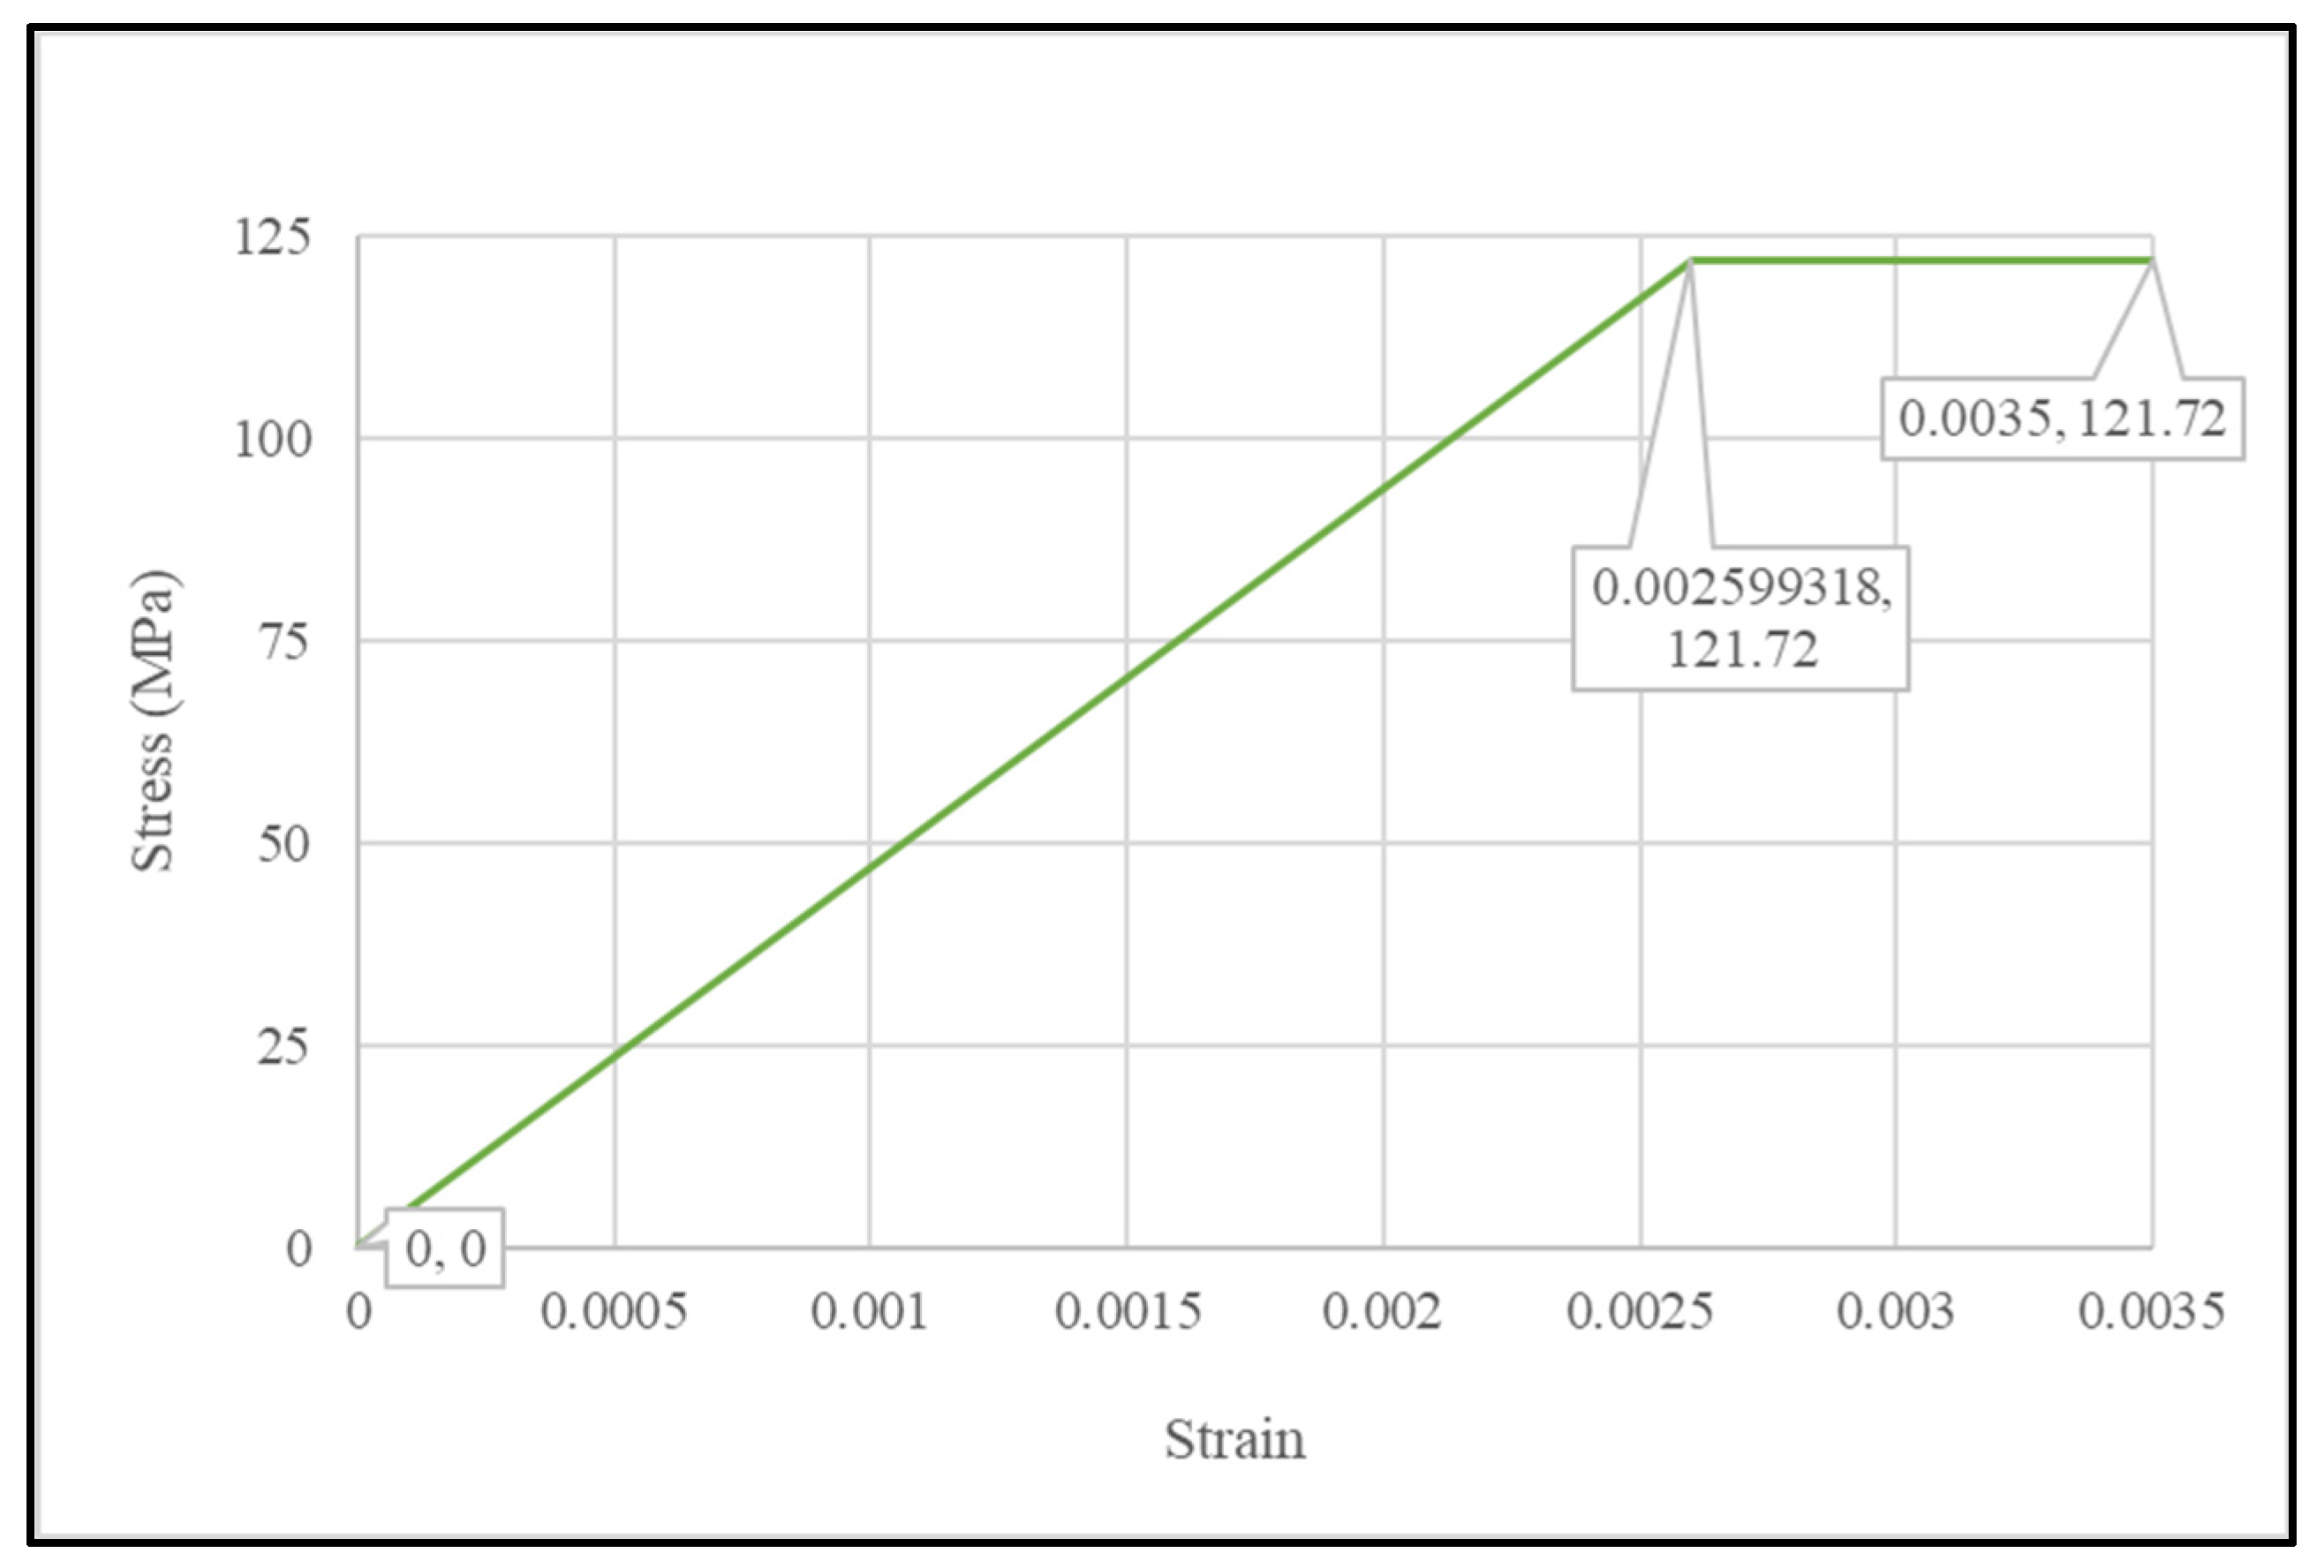
The availability of experimental data and well-established models for defining the uniaxial compressive stress–strain response of UHPC remains limited. In this study, a compression design model proposed by El-Helou et al. [23] is adopted to characterize the compressive behavior of UHPC. The model, depicted in Figure 6, is superimposed on an experimentally measured stress–strain curve for comparison. Designed to capture the fundamental characteristics of UHPC’s compressive response, this model is particularly appealing due to its simplicity, making it practical for engineering applications [23].
The compression model relies on four input parameters and comprises two distinct branches: a linear–elastic ascending branch and a perfectly plastic branch. The linear-elastic phase is solely defined by the elastic modulus, Ec, with the transition from elasticity to plasticity occurring once the material reaches a reduced compressive strength. This reduced strength is obtained by multiplying the compressive strength, f′c, by a reduction factor α. The strain at this transition point, εcp, is calculated using Hooke’s law based on the reduced compressive strength, α f′c. The plastic phase of the model extends up to the ultimate compressive design strain, εcu, which corresponds to the strain at peak compressive stress. The permissible range for εcu is relatively narrow and is determined through experimental compression tests [23].
The linear elastic branch provides a reasonable approximation of the UHPC compressive behavior up to 85% of the compressive strength, f′c. To account for this limitation in engineering design, a reduction factor, α, of 0.85 is recommended. For the ultimate compressive design strain, εcu, a value of 0.0035 is suggested, as it falls below the average value observed in multiple experimental tests [23]. Figure 7 illustrates the compressive stress–strain relationship of the UHPC utilized in the reference experimental work of this study. This curve was derived using the material properties specified by Briseghella et al. [8] and applying the compression model proposed by El-Helou et al. [23].
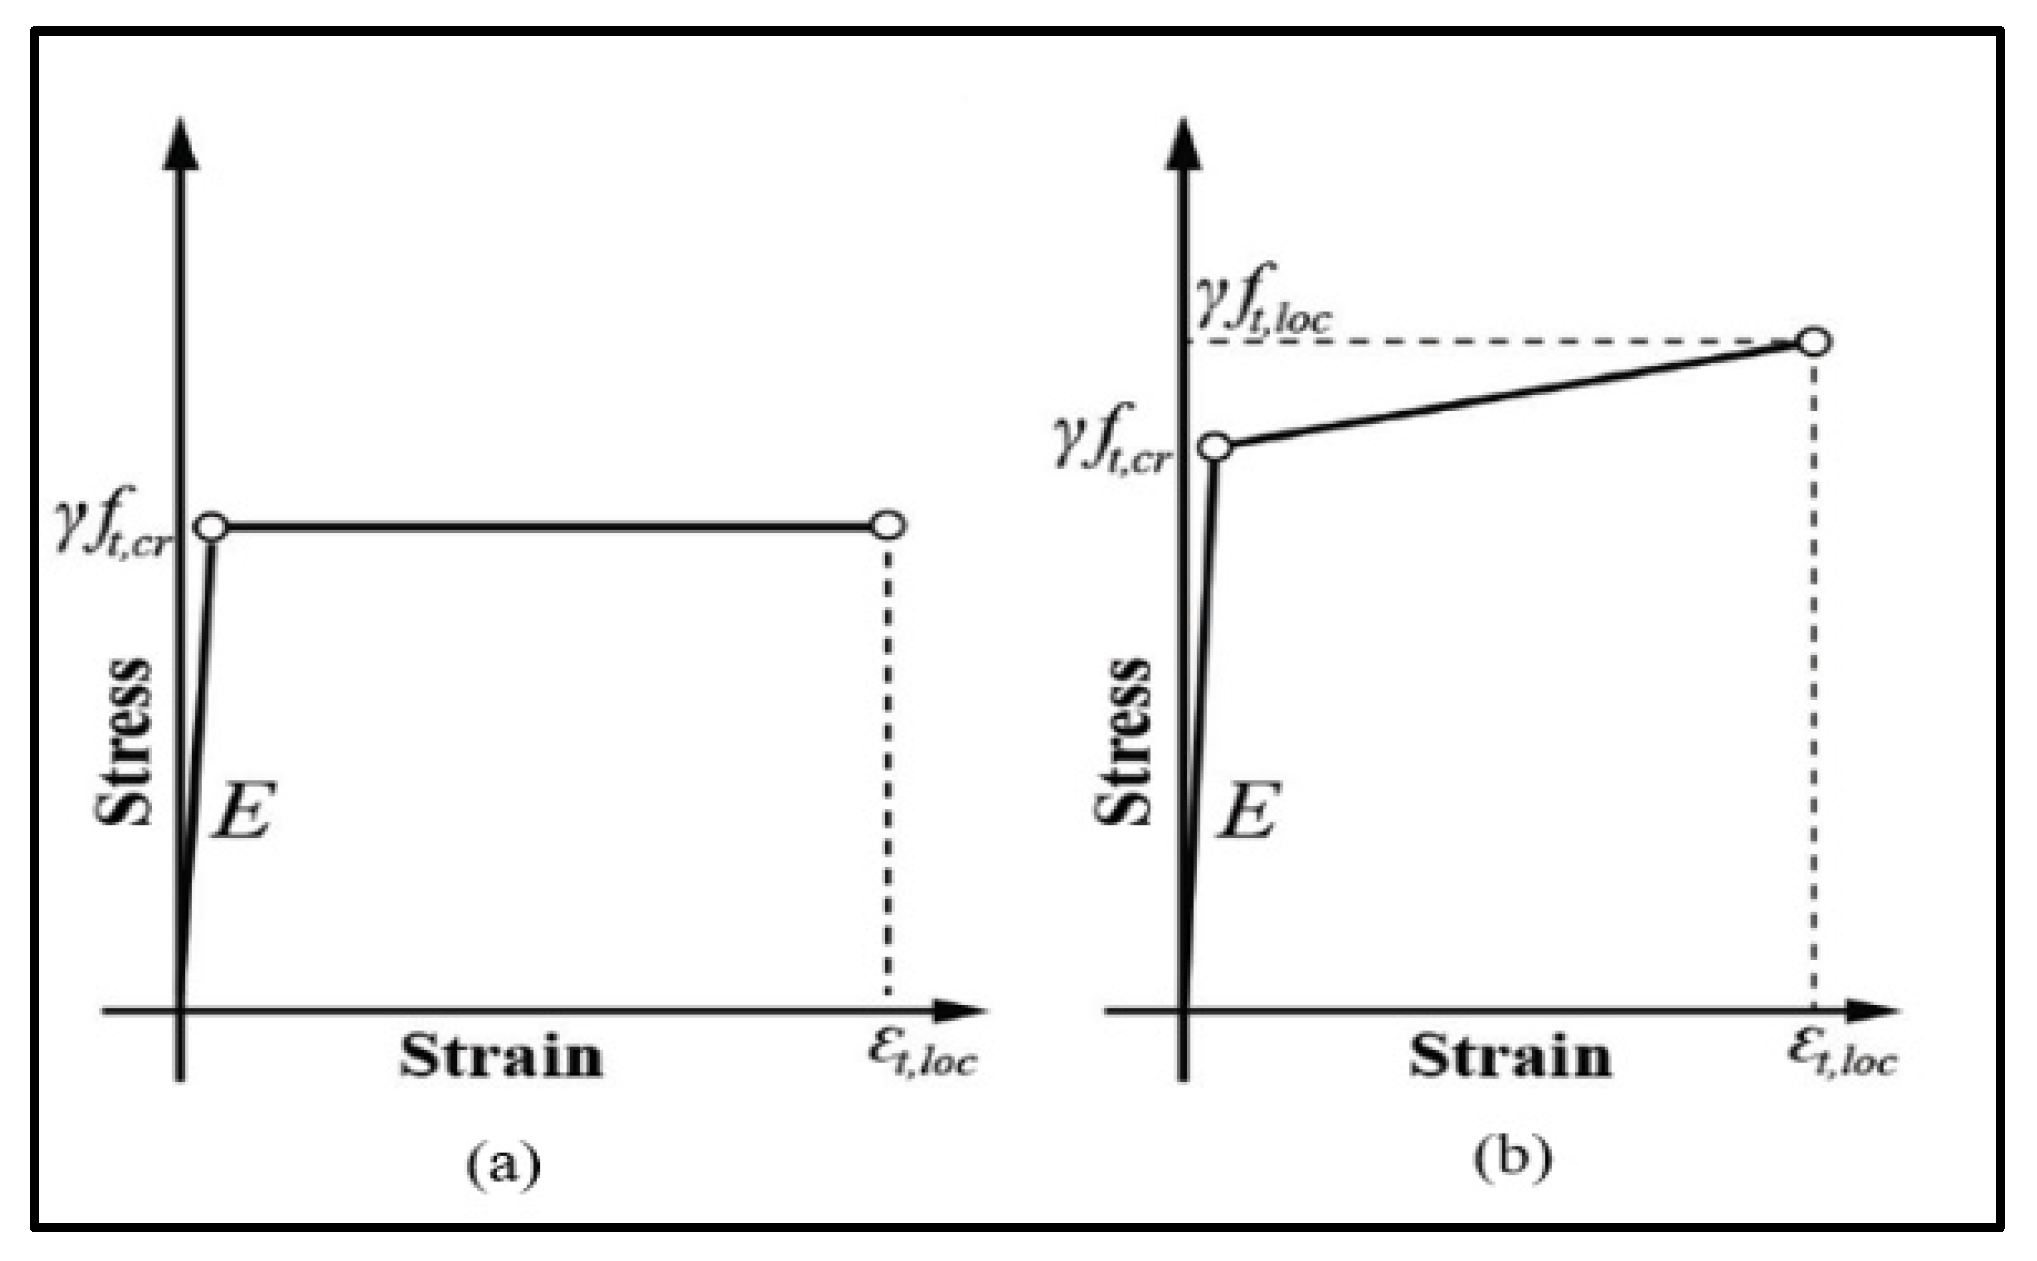
El-Helou et al. [23] identified two distinct tensile stress–strain behaviors in UHPC. The first behavior features a stress plateau, where the post-cracking stress remains relatively stable until strain localization occurs. This response is well represented by an elastic–plastic stress–strain model. The second behavior is observed in UHPC materials, where the post-cracking stress continues to rise until reaching a peak at the strain corresponding to crack localization. This can be effectively modeled using a bilinear stress–strain approach. Figure 8 presents these two different types of tensile behavior for UHPC. Both models provide a general representation of the tensile response and incorporate a reduction factor (γ) to account for decreased tensile resistance. However, they do not consider the post-localization phase, which corresponds to the descending branch beyond the strain at crack localization. This exclusion is because post-localization behavior is influenced by crack opening and is unsuitable for a strain-based design methodology.
Figure 9 illustrates the tensile stress–strain relationship of the UHPC utilized in the reference experimental work of this study. This curve was derived using the material properties specified by Briseghella et al. [8] and applying the tensile model proposed by El-Helou et al. [23].
It should be noted that the tensile stress–strain model adopted from El-Helou et al. [23] defines the UHPC response up to crack localization and does not explicitly include a post-localization descending branch. This simplification is intentional, as post-localization softening is governed by crack opening and fracture processes that are mesh-dependent and require fracture energy regularization for objective numerical representation. In the present study, the adopted model is considered appropriate for capturing global structural response and comparative parametric trends, while detailed crack opening behavior is beyond the scope of the current investigation.
The normal concrete C40 used for modeling the girders and deck slabs has an elastic modulus, E, of 34.7 GPa, an ultimate compressive strength, fCU, of 43.2 MPa, a uniaxial compressive strength, f′C, of 32.8 MPa, and a tensile strength, ft, of 3.2 MPa, as reported by Briseghella et al. [8].

2.2.3. Constitutive Model for Reinforcement Layout

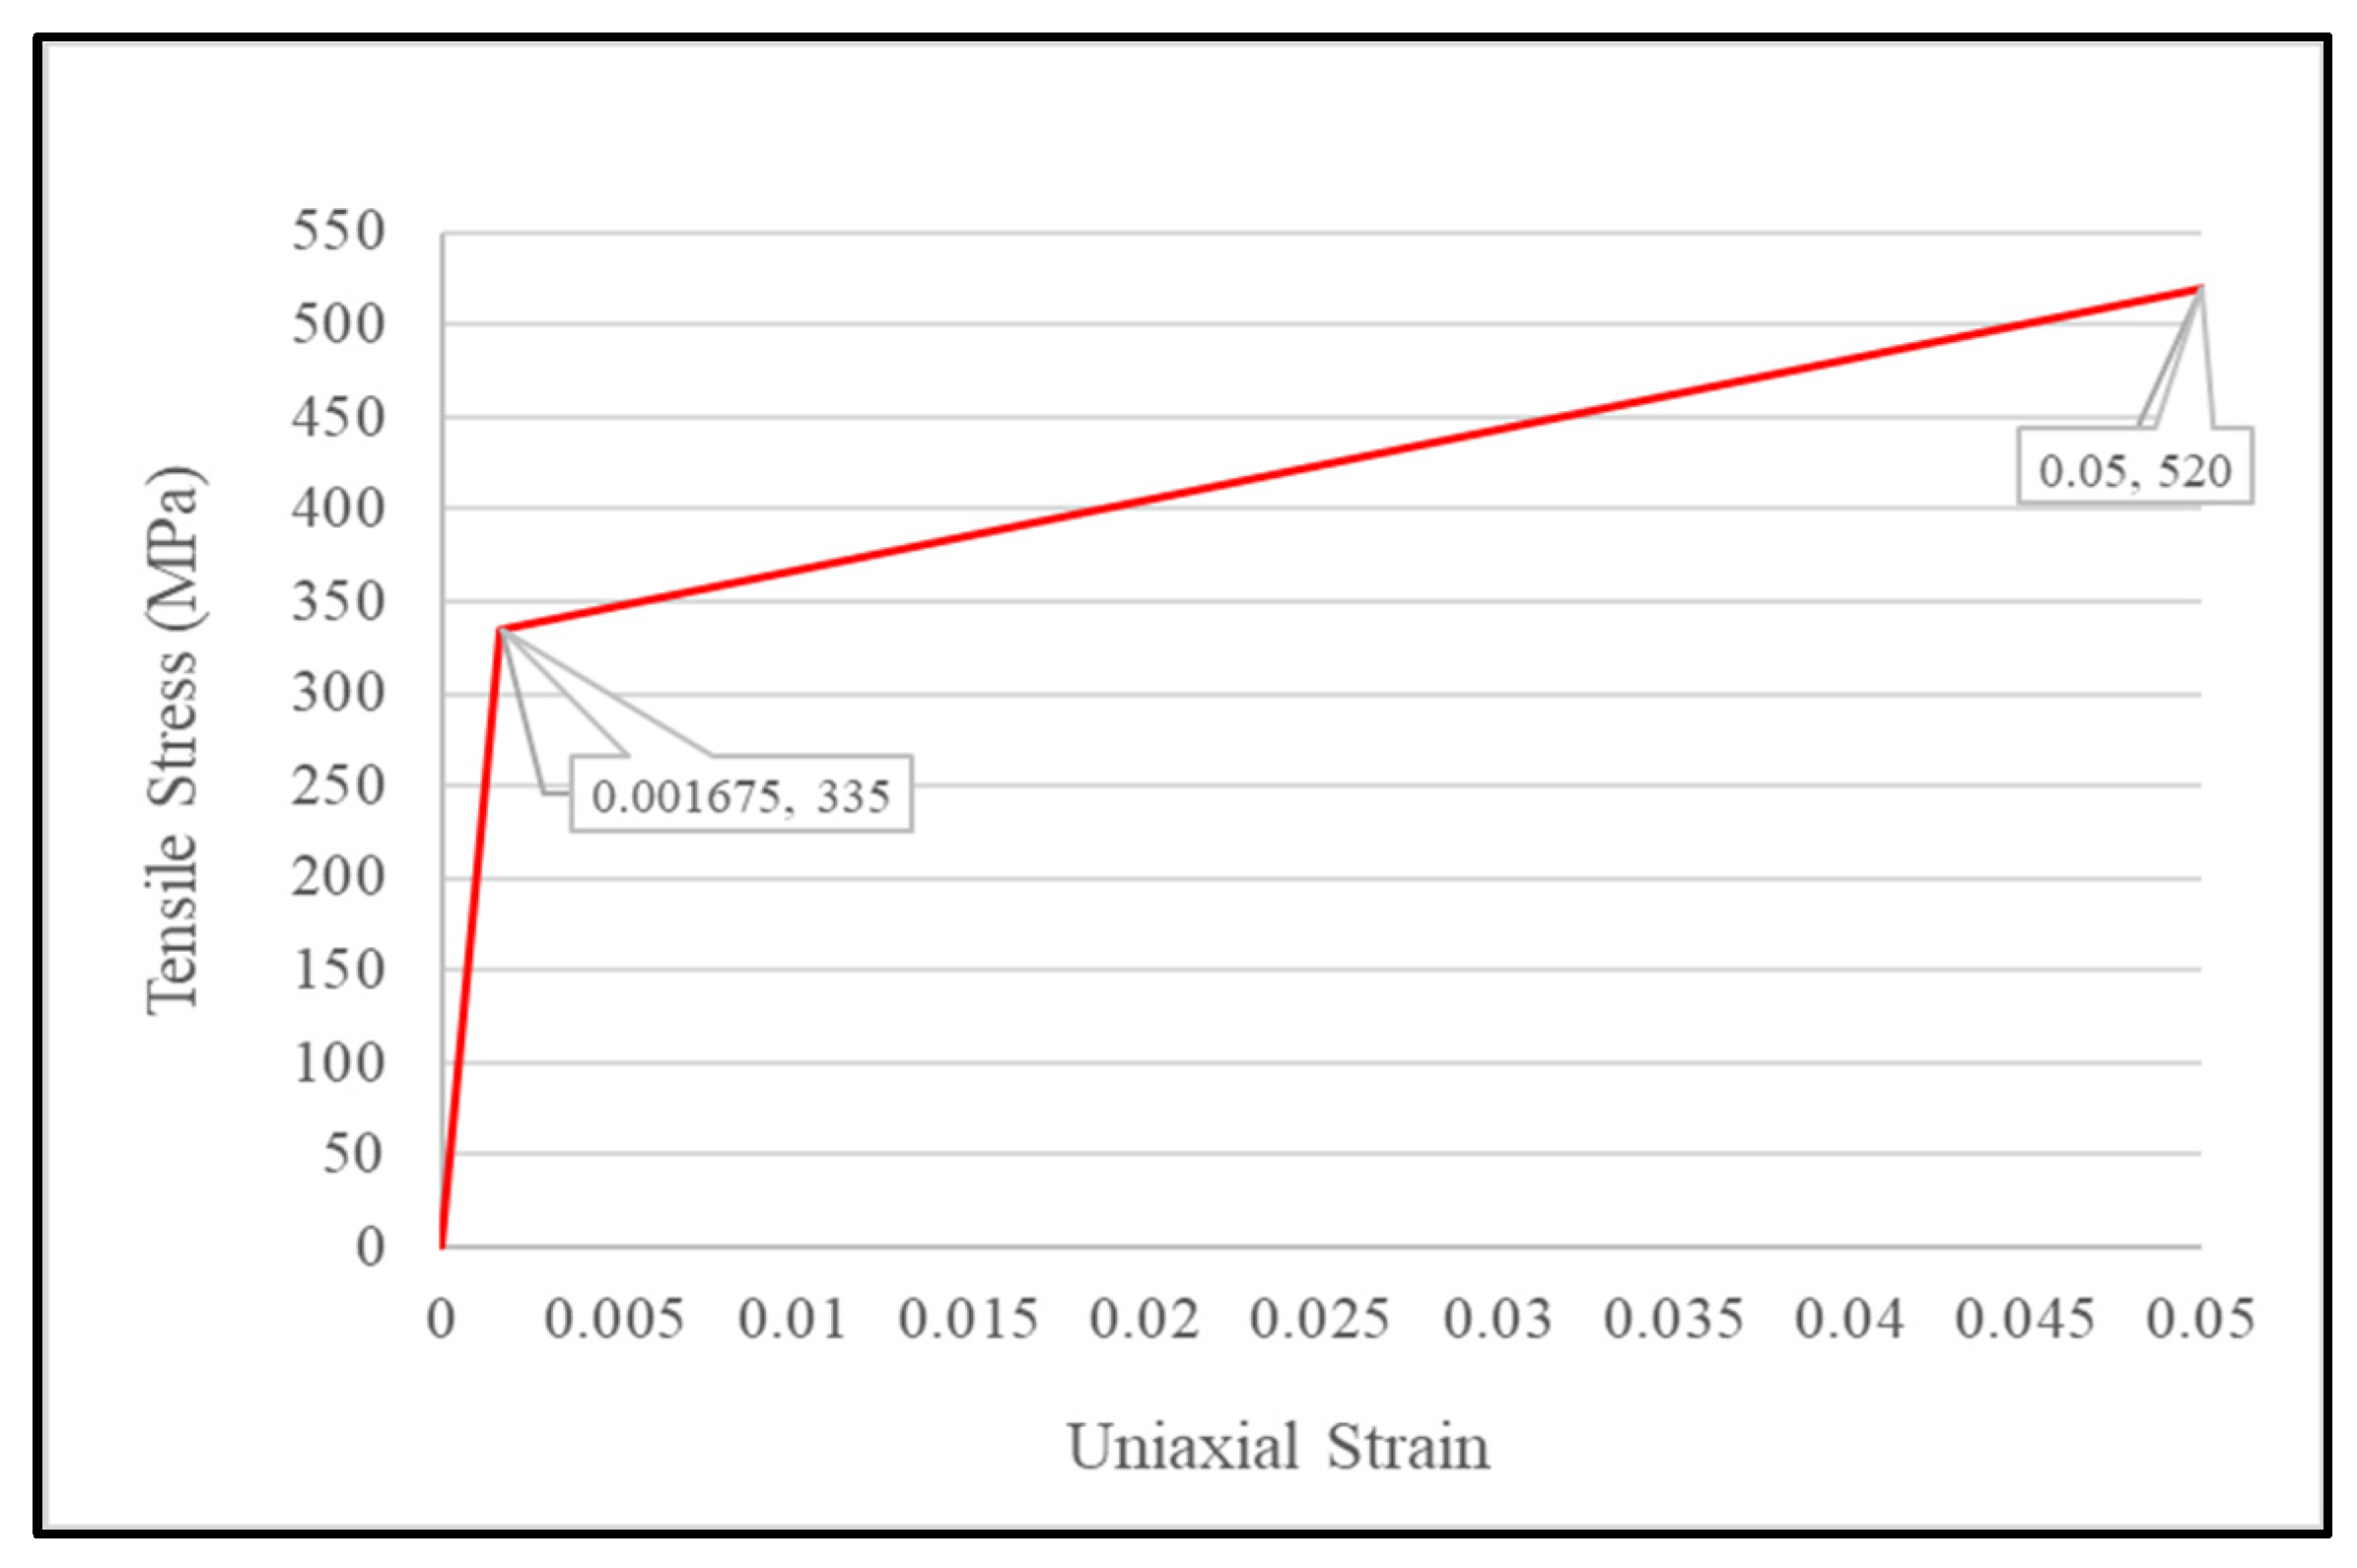
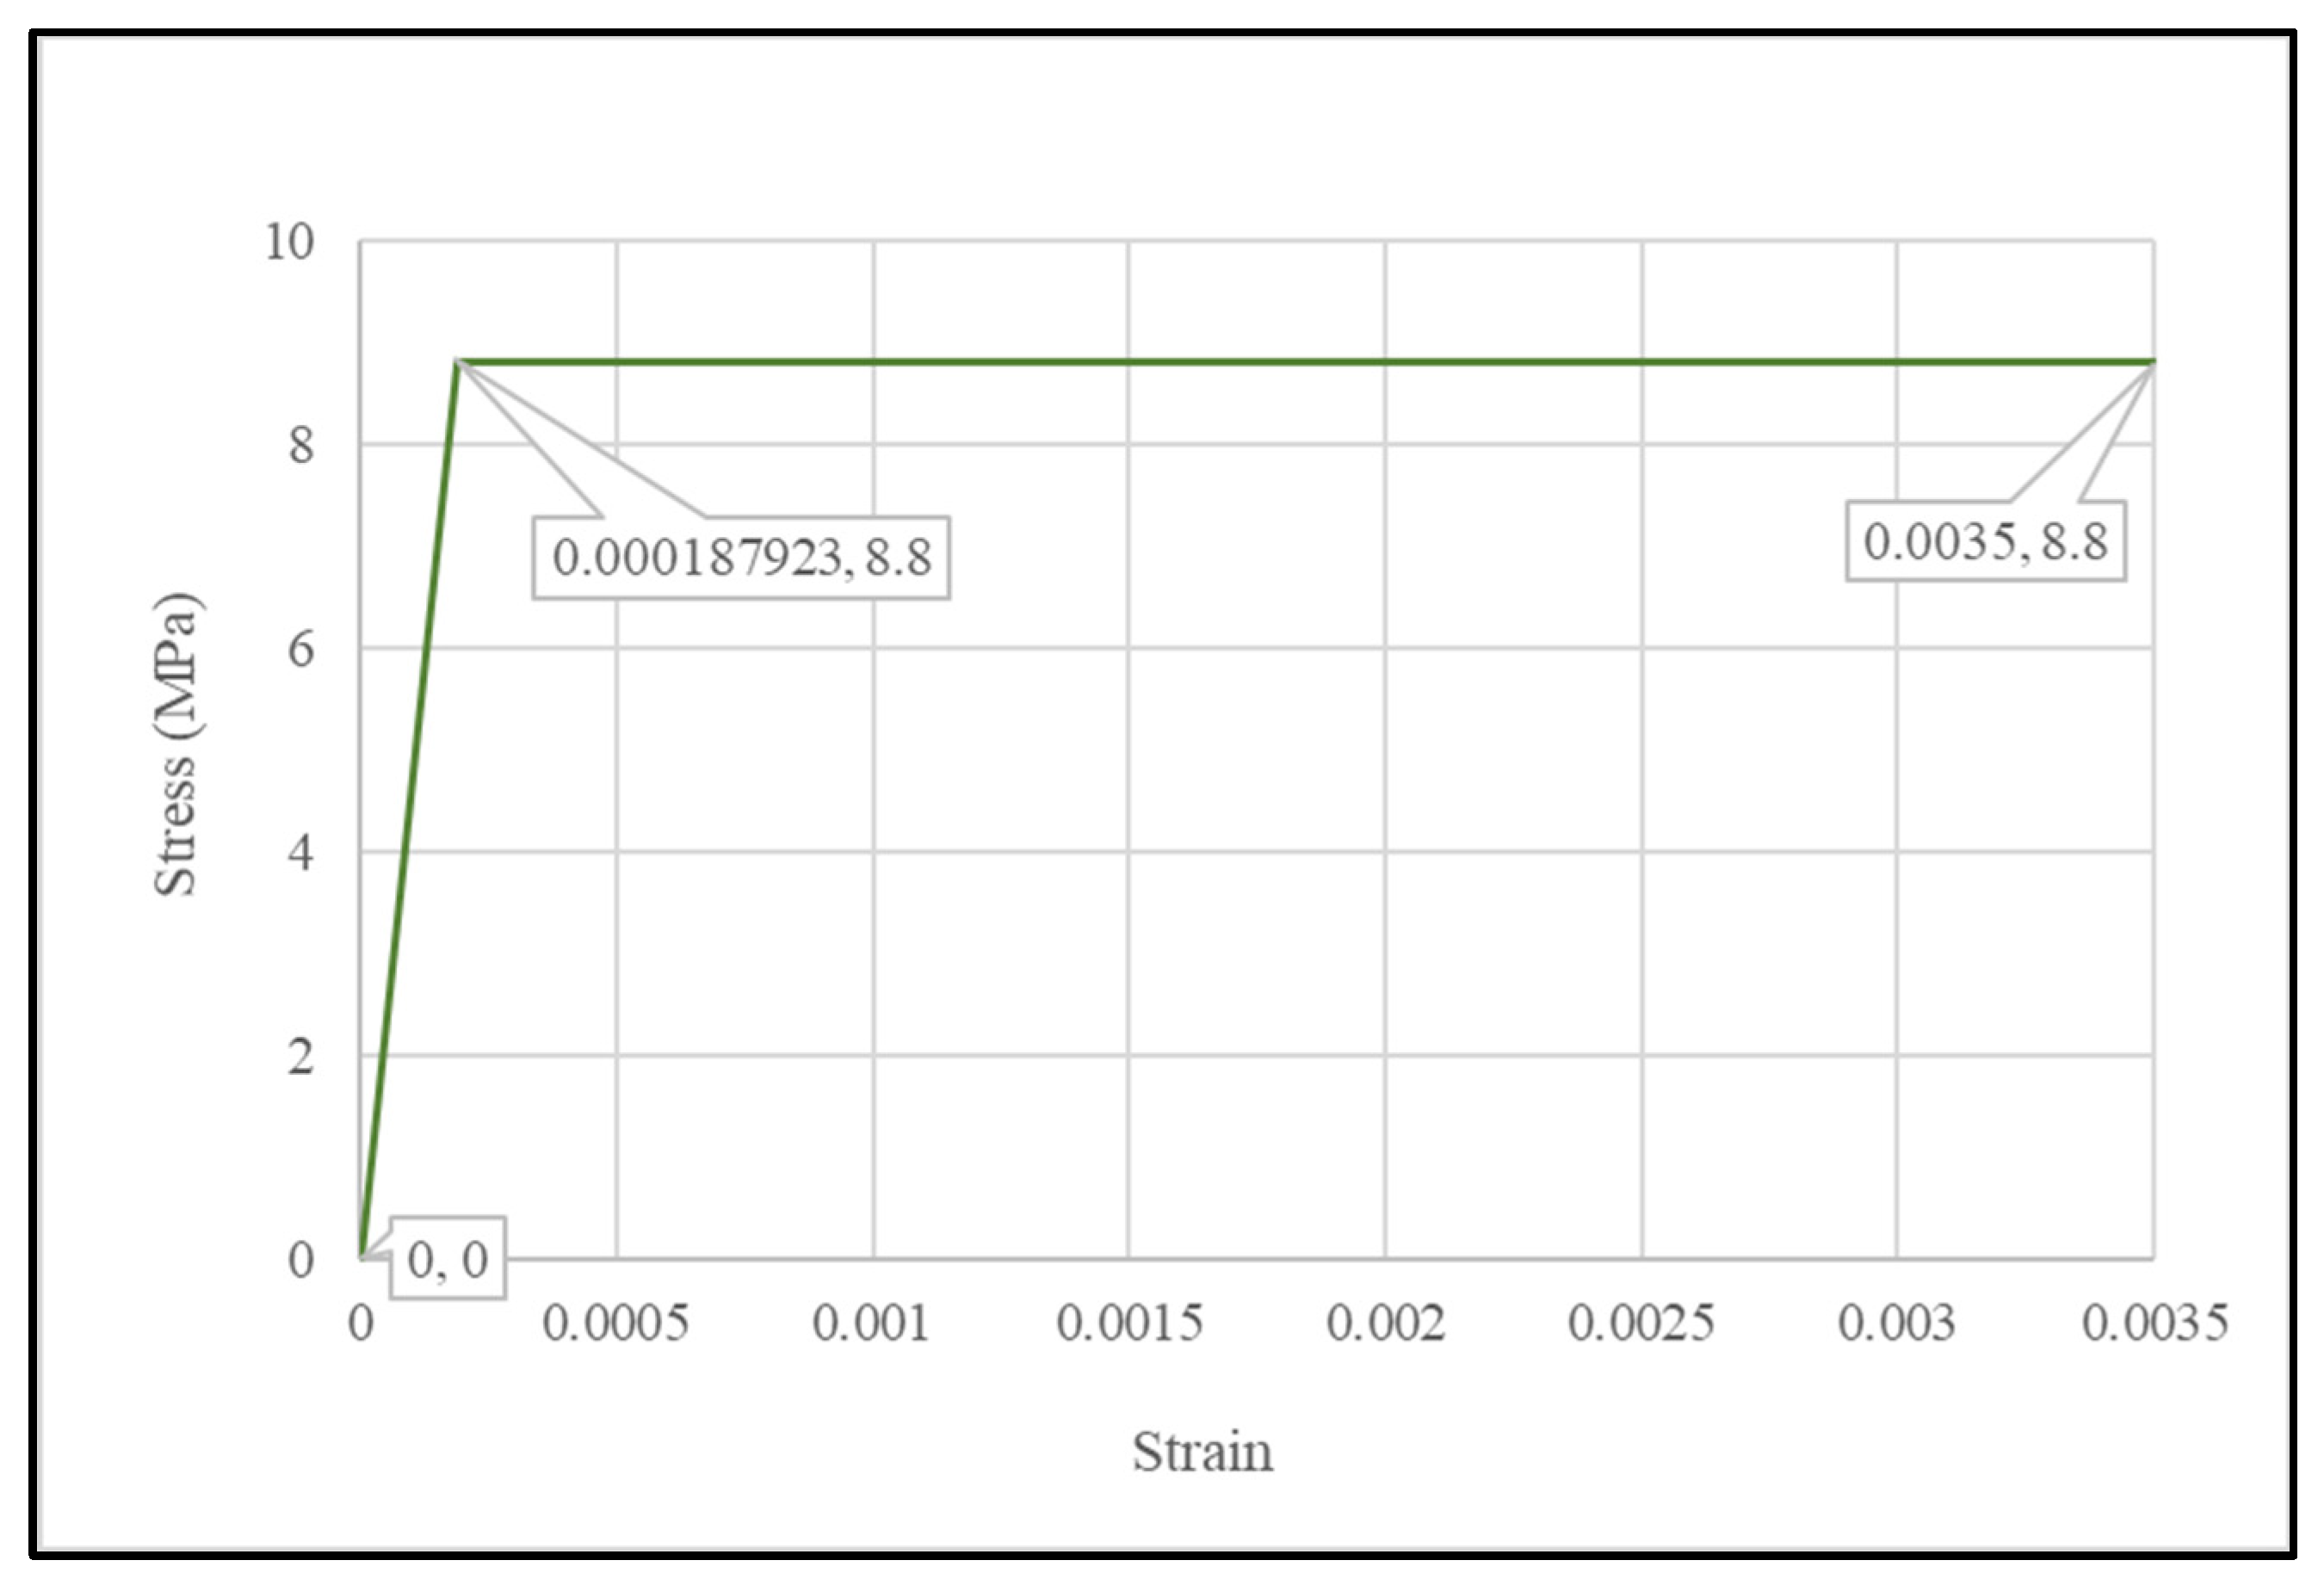
The reinforcement layout, depicted in Figure 4, consists of #3 hot-rolled ribbed steel rebars made of HRB335. It includes 10 rebars in the Z direction, each with a length of 2990 mm and spaced 100 mm apart. The mechanical properties of the HRB335 reinforcement used in this study are summarized as follows: an elastic modulus, E, of 200 GPa, a yield strength, fy, of 335 MPa, an ultimate tensile strength, fu, of 520 MPa, and a Poisson’s ratio of 0.3.
The constitutive modeling of the HRB335 steel rebars in this study employed a metal plasticity model [15]. This ABAQUS plasticity model is based on a Mises yield surface with associated plastic flow and isotropic hardening. The FEM defines the tensile stress–strain response of the rebars by adopting bilinear material behavior, as illustrated in Figure 10.

2.2.4. Constraints and Interactions

In the developed finite element model, appropriate constraints and contact interactions were employed to simulate the realistic behavior of the composite structural system. Tie constraints were applied to connect the deck slabs and girders, ensuring a fully bonded interface. Specifically, the left girder was tied to the left deck slab, and the right girder was tied to the right deck slab. Moreover, all longitudinal reinforcement bars were modeled using embedded region constraints to represent a perfect bond with the surrounding concrete in both the deck slabs and the link slab.
The interaction behavior among the structural components was defined through surface-to-surface contact formulations, with appropriate contact properties reflecting physical interface conditions. The interface between the link slab and the left and right deck slabs was modeled using a surface-to-surface contact with a tangential behavior defined by the Int-Prop-other, which employed a penalty friction formulation with a friction coefficient of 0.3.
For the interaction between the link slab and the girders beyond the debonding length, surface-to-surface contact with the Int-Prop-BL was applied. This property incorporated a penalty friction formulation with a higher friction coefficient of 0.4 to represent the bonded regions outside the debonded interface.
Within the debonding regions—where rubber sheets were used in the experiment to eliminate the bond between the girders and the link slab—a frictionless contact behavior was defined using the Int-Prop-DL. This accurately captured the slip behavior expected at the deboned interface and reflected the intended unbonded condition in the model.
The selected friction coefficients were chosen to reflect the physical interface conditions observed in the reference experimental study and commonly adopted ranges for concrete–concrete contact in bridge applications; their influence was subsequently evaluated through a systematic parametric analysis.

2.2.5. Boundary Conditions and Loading

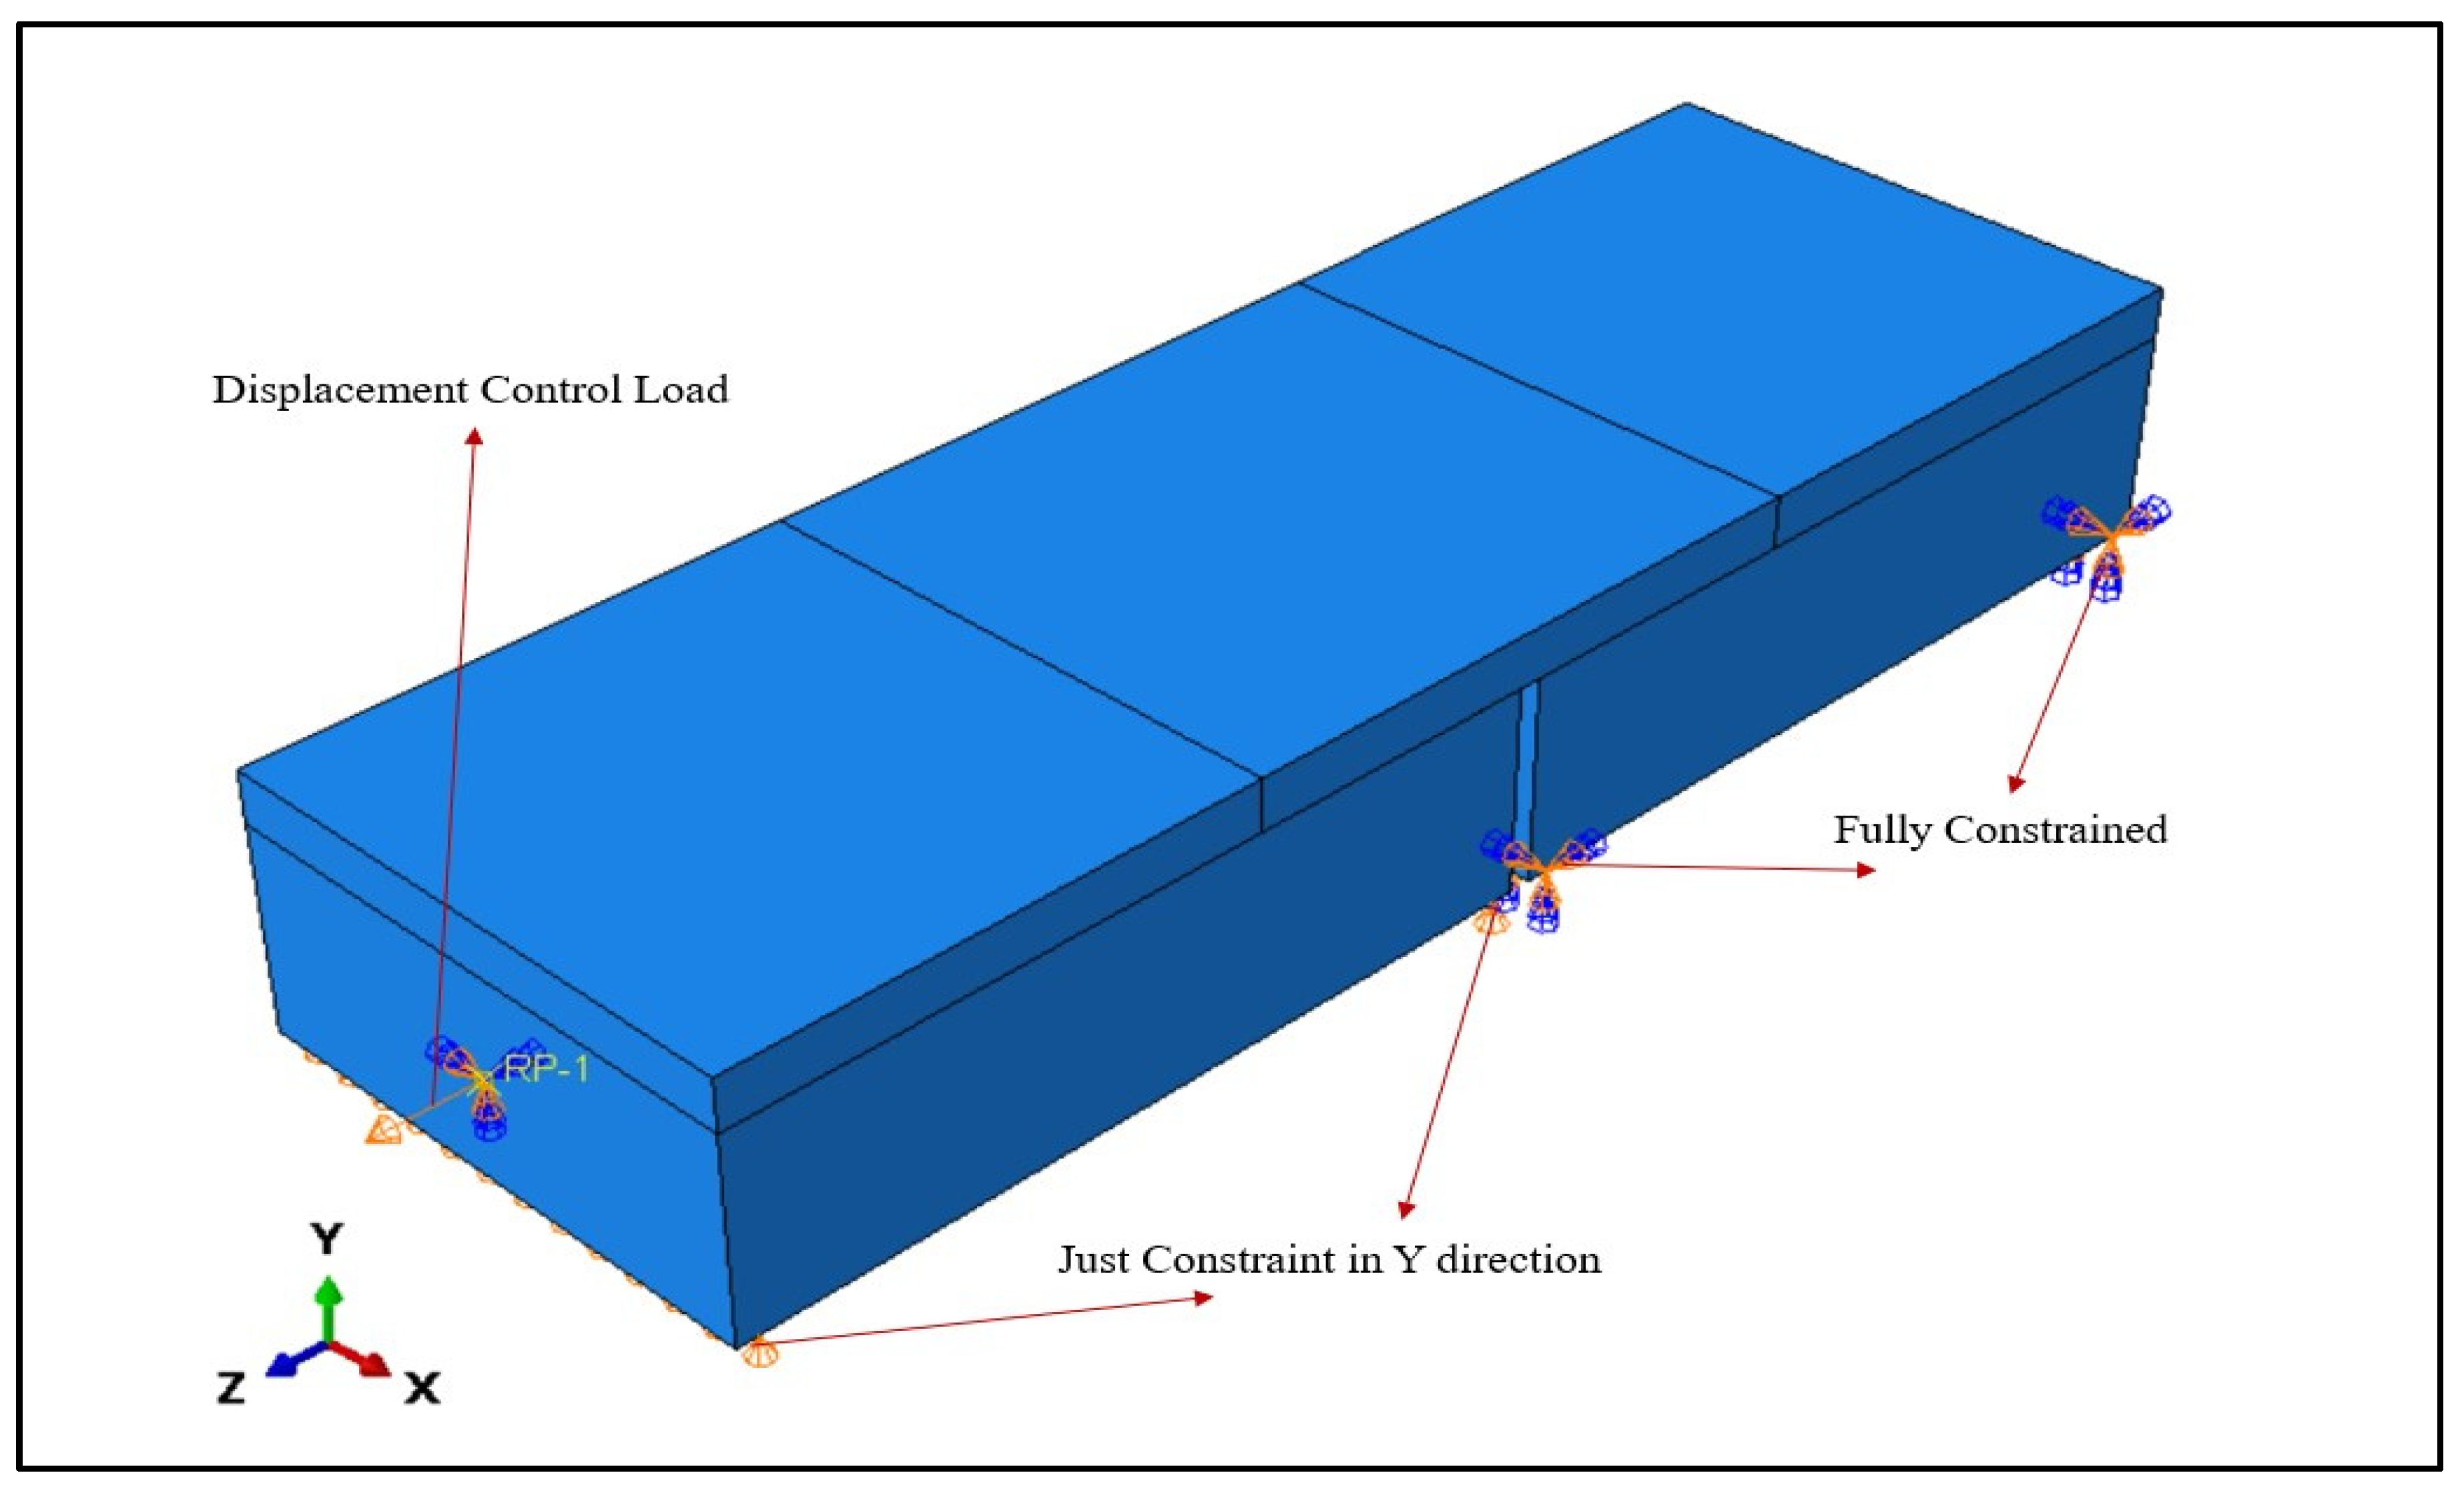
To accurately replicate the boundary conditions and loading configuration used in the experimental study by Briseghella et al. [8], the finite element model was assigned with corresponding constraints and load applications, as depicted in Figure 11. The right girder was fully constrained in all degrees of freedom to represent a fixed support. In contrast, the left girder was restrained only in the Y-direction to simulate the roller support condition applied in the physical test setup.
Since the experimental loading was displacement-controlled, the same methodology was adopted in the numerical model. A vertical displacement of 8 mm was applied in the Z-direction at a reference point (RP) located on the left end of the left girder. This reference point was coupled to the surface of the girder to accurately transfer the imposed displacement and replicate the loading condition observed in the experimental work.
It is noted that these boundary conditions are defined to replicate the experimental configuration used for model validation; while actual bridge systems may exhibit semi-continuous restraint, extending the model to such conditions would require additional system-level assumptions beyond the scope of the present validation-based parametric study.

2.2.6. Analysis Step

The developed FEM is inherently complex due to the inclusion of multiple components and materials, each exhibiting distinct mechanical properties and interactions. To accurately capture the structural response, a static analysis was performed, incorporating nonlinear geometric effects (Nlgeom) to account for large deformations and displacements. These effects were integrated into the numerical framework using the updated Lagrangian method [15]. The analysis was carried out using the full Newton–Raphson solution technique, which ensures convergence by iteratively solving for equilibrium in small displacement increments. This approach enhances the accuracy of the simulation and effectively captures the nonlinear behavior of the UHPC link slab system under applied loading conditions.

3. Results and Discussion

This section presents the numerical results obtained from FEM and compares them with the experimental findings reported by Briseghella et al. [8]. The discussion begins with a validation study through comparison of the force–displacement response, followed by an extensive parametric analysis divided into two main categories: geometrical parameters and numerical parameters. The influence of each parameter on the structural response is examined to provide deeper insight into link slab behavior under loading.

3.1. Model Validation

Force–Displacement Comparison

In the experimental program by Briseghella et al. [8], the maximum longitudinal displacement of the link slab was recorded using an LVDT (L-1) positioned along the span of the link slab, while the applied load was measured using a sensor installed in the hydraulic jack (Figure 1). This setup enabled precise measurement of the load–displacement behavior under displacement-controlled loading.
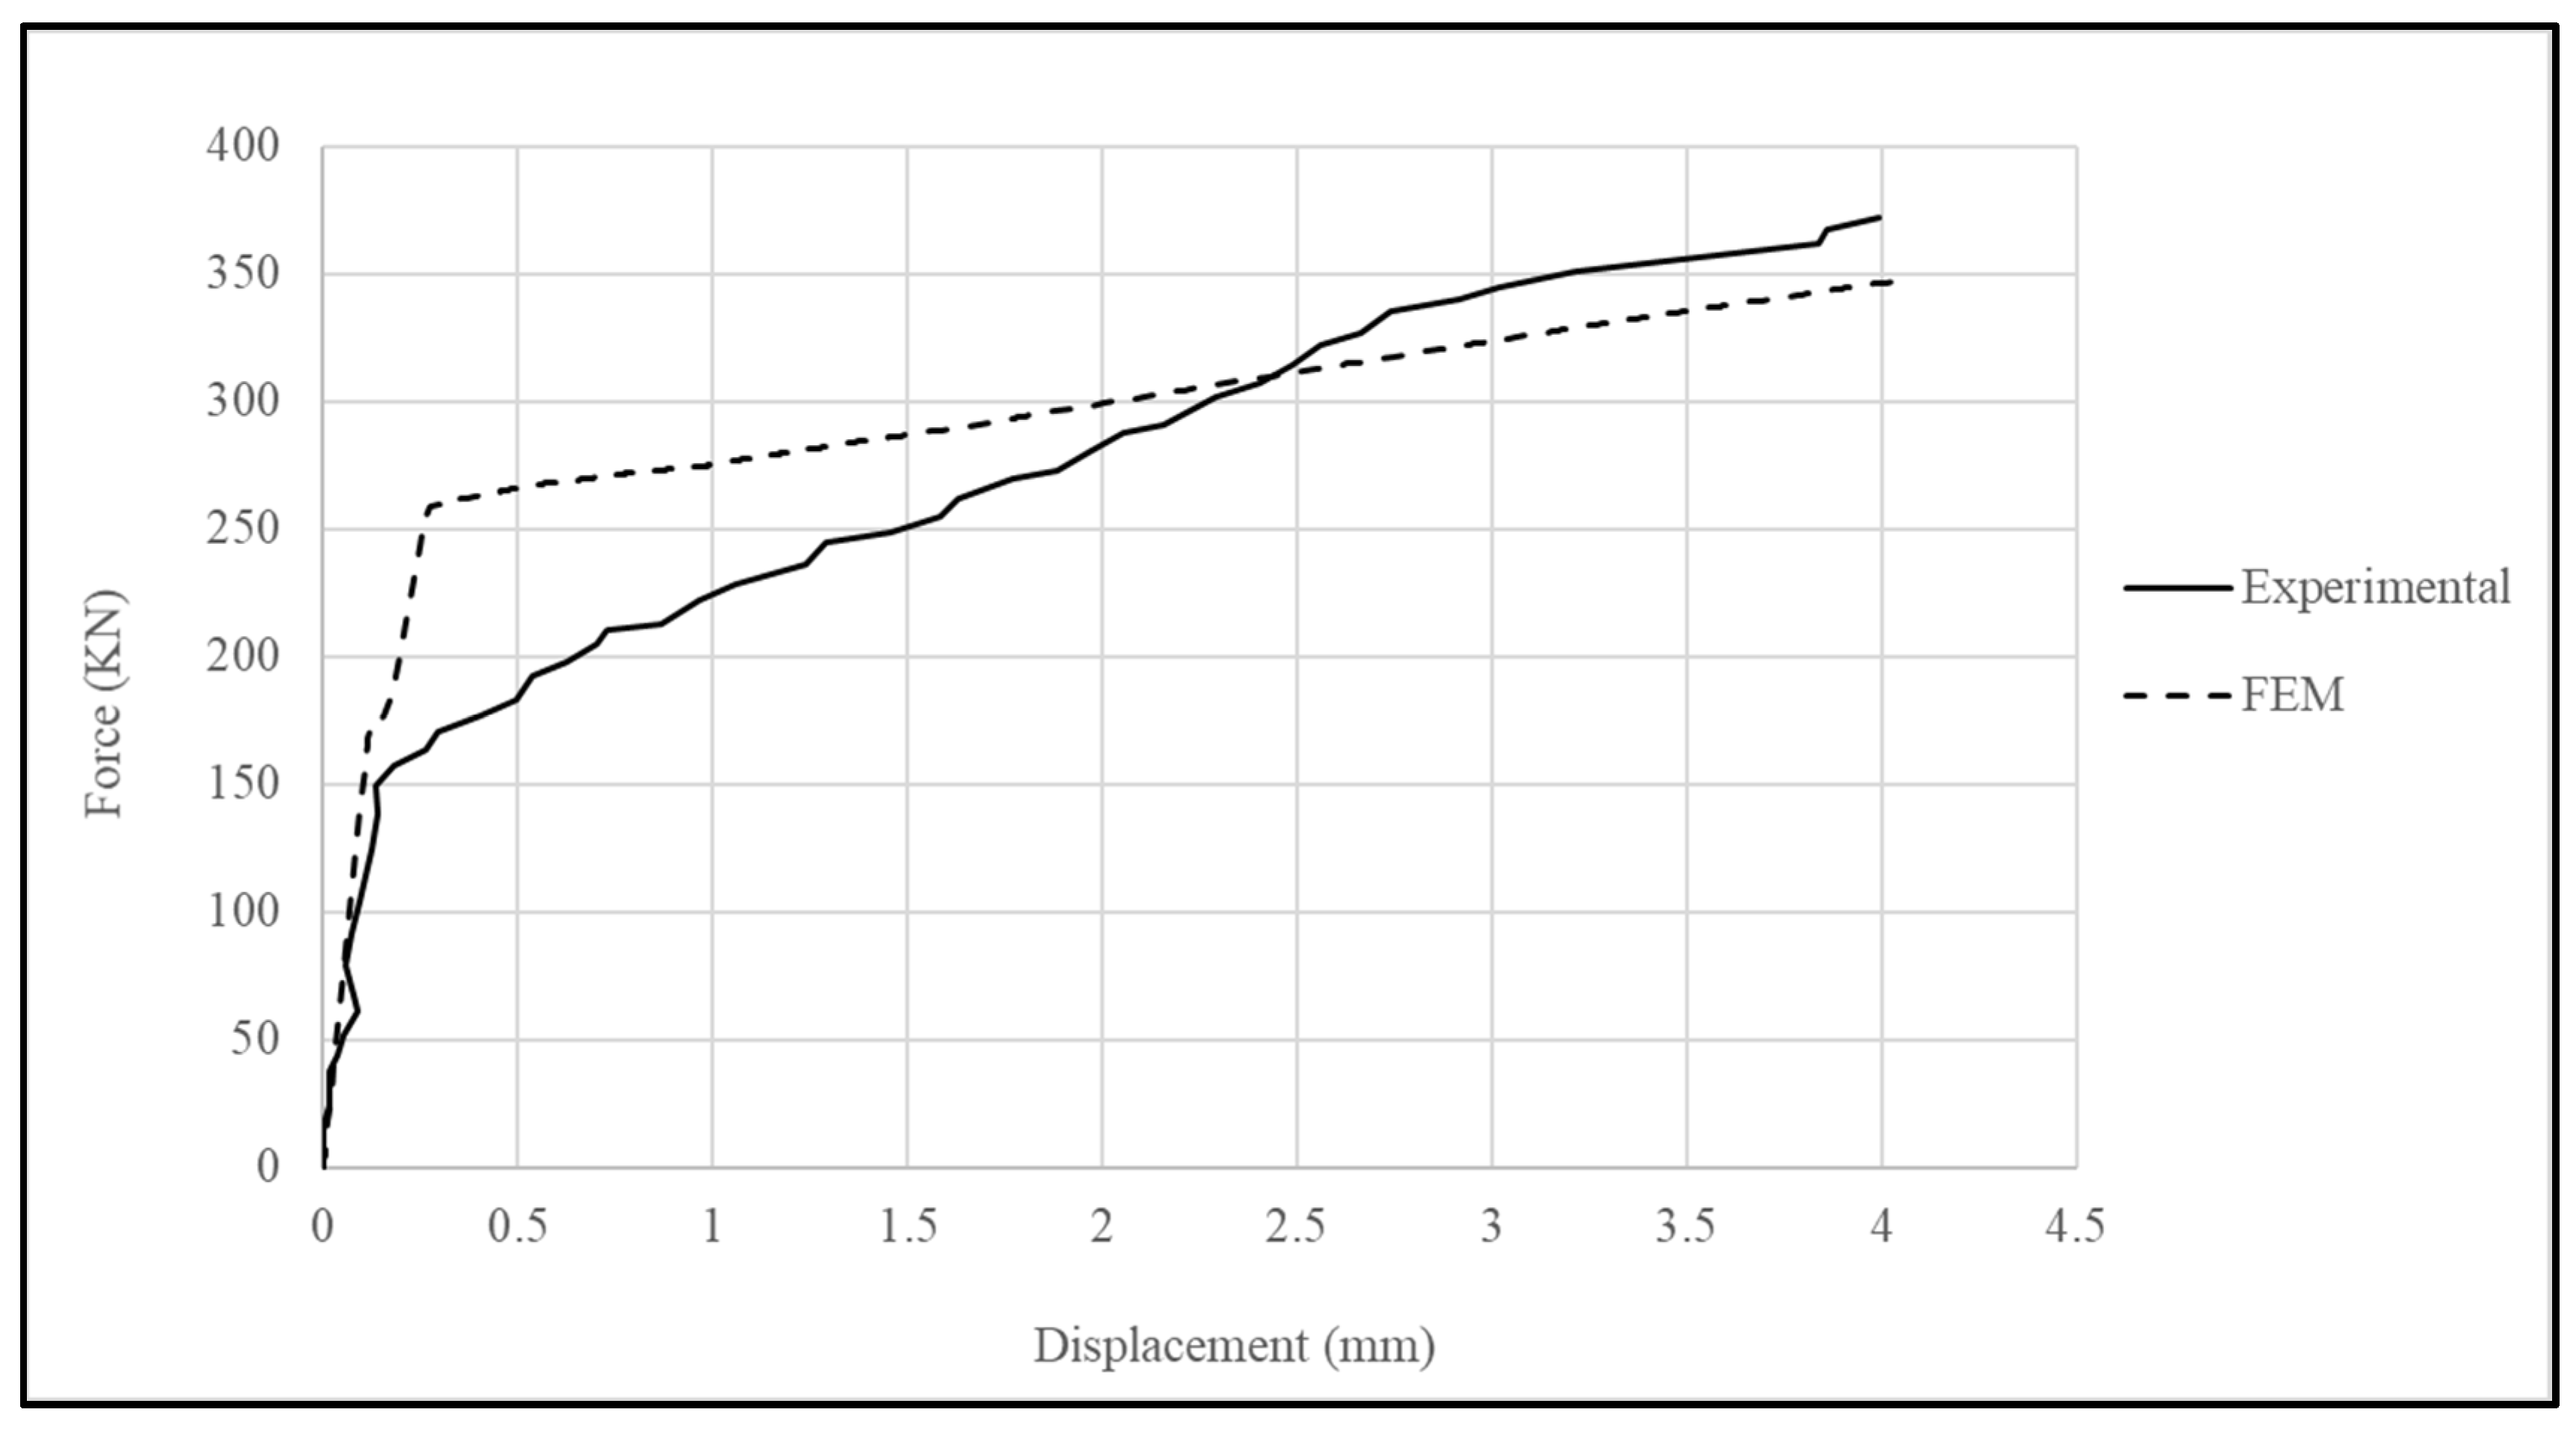
For the FEM, the displacement and reaction force were extracted at locations corresponding to the experimental instrumentation to ensure direct comparability. Figure 12 presents the experimental and numerical force–displacement curves. The FE model reproduces the overall shape and trend of the experimental response in both the elastic and inelastic ranges, accurately capturing the peak load, post-yield behavior, and overall stiffness characteristics. At the ultimate displacement of 4 mm, the FEM predicted a peak load of 372.05 KN compared to 347.53 KN in the experimental test, representing a deviation of only 7.05%. This close agreement in ultimate capacity further validates the model’s reliability in capturing the load-carrying behavior of the link slab system.
While the FE curve shows a slightly steeper initial slope and reaches the yield plateau earlier than the experimental curve, these differences are minor and fall within the expected variability for numerical simulations. Such variations can be attributed to factors such as localized cracking, microstructural heterogeneity, and measurement sensitivity in the experimental setup. Regarding the local difference in slope between the experimental and numerical curves in the early-to-intermediate displacement range (approximately 0.25–2.5 mm), this interval corresponds to the transition from the elastic stage to crack initiation and early crack development. In the experimental program, the load was applied in multi-stage increments with holding periods (about 5 min per increment), and the maximum longitudinal displacement was measured using an LVDT installed on the specimen; therefore, the recorded displacement may incorporate not only the link slab deformation but also contributions from jack/fixture compliance, support seating, and localized interface slip, particularly near the debonding layer. In addition, details required to fully define interface behavior, construction tolerances, and material heterogeneity are not completely available from the experimental report, which introduces uncertainty in reproducing the exact tangent stiffness in this transitional regime. By contrast, the FE model employs idealized boundary conditions and contact formulations (including an ideal frictionless debonding interface and simplified bonding assumptions) and does not explicitly represent time-dependent relaxation during load holding. These factors can lead to a slightly stiffer predicted response in this displacement interval, while the model remains validated in terms of the overall curve shape and ultimate capacity.
The close match in ultimate load capacity and displacement response confirms the robustness of the developed FE model, providing a reliable foundation for the subsequent parametric investigations.
Following validation, the model is used to conduct a systematic parametric investigation. It should be noted that direct comparison of parametric trends with prior UHPC link slab studies is limited by the scarcity of comparable parametric datasets in the literature.
It is noted that, beyond the experimental benchmark adopted for validation in this study [8], the available literature on UHPC link slabs provides limited parametric datasets or consistently reported response measures (e.g., initial stiffness, yield and peak points, and ductility) that would enable direct quantitative or qualitative comparison with the present comprehensive parametric results. In addition, the reference experimental study does not report local strain measurements or crack pattern data that would allow validation of localized damage or strain fields.
Accordingly, the studies cited in this work are primarily used to support the selection of influential geometrical and numerical parameters and to justify modeling assumptions, while the present study provides a unified validated FEM framework and corresponding parametric response dataset for UHPC link slabs.

3.2. Parametric Study

To gain deeper insight into the influence of key design and material parameters on the structural performance of the link slab system, a comprehensive parametric study was conducted based on the validated finite element model. The parameters were selected to represent both geometrical and numerical aspects that are critical to the behavior of link slabs under service and ultimate loading conditions.
The geometrical parameters include link slab length, link slab thickness, debonding length, reinforcement diameter, and reinforcement spacing. These parameters directly affect the stiffness, load distribution, crack development, and overall deformation capacity of the system. Their variation was defined to capture the range of practical design options and construction tolerances commonly encountered in bridge engineering practice [23,24].
The numerical parameters cover the friction coefficients at the link slab–girder interface (both non-deboned and deboned regions), the compressive strength of UHPC used in the link slab, the compressive strength of the normal concrete in the girders and decks, and the yield strength of the reinforcement steel. These parameters reflect the material characteristics and interface behaviors that strongly influence load transfer mechanisms, ductility, and failure modes [11,23,24].
Each parameter was varied systematically within a realistic range informed by relevant experimental data, established design provisions, and documented field applications [11,23,24,25]. The analysis focuses on the effects of these variations on the global force–displacement response and peak load capacity, providing targeted insights for optimizing link slab design to achieve both structural efficiency and long-term durability.
The following subsection begins with the evaluation of the geometrical parameters.

3.2.1. Geometrical Parameters

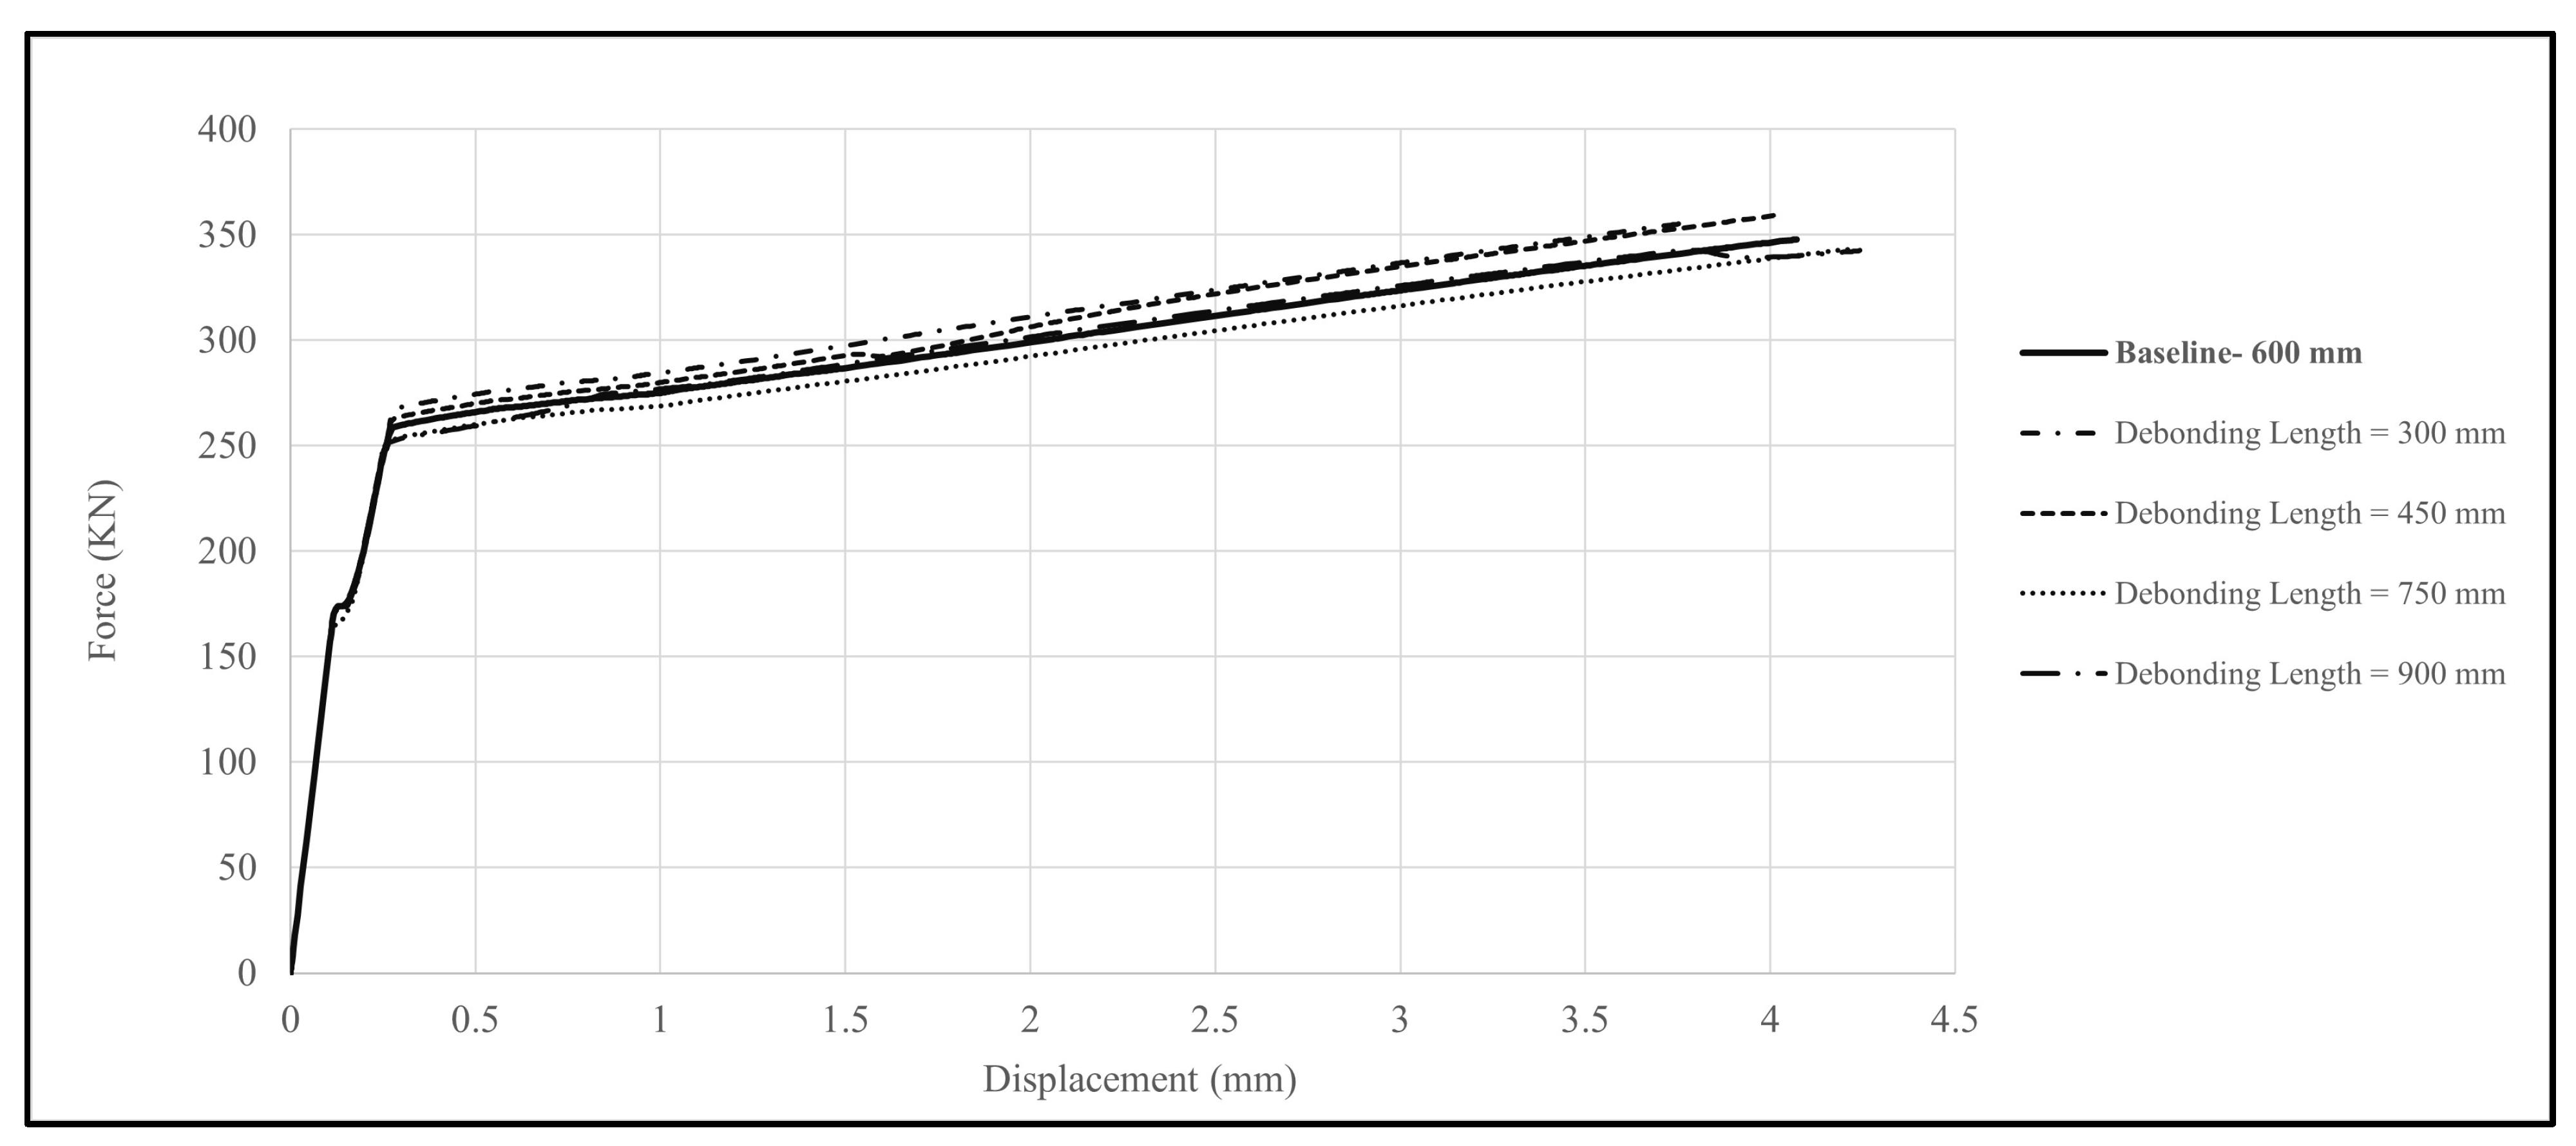
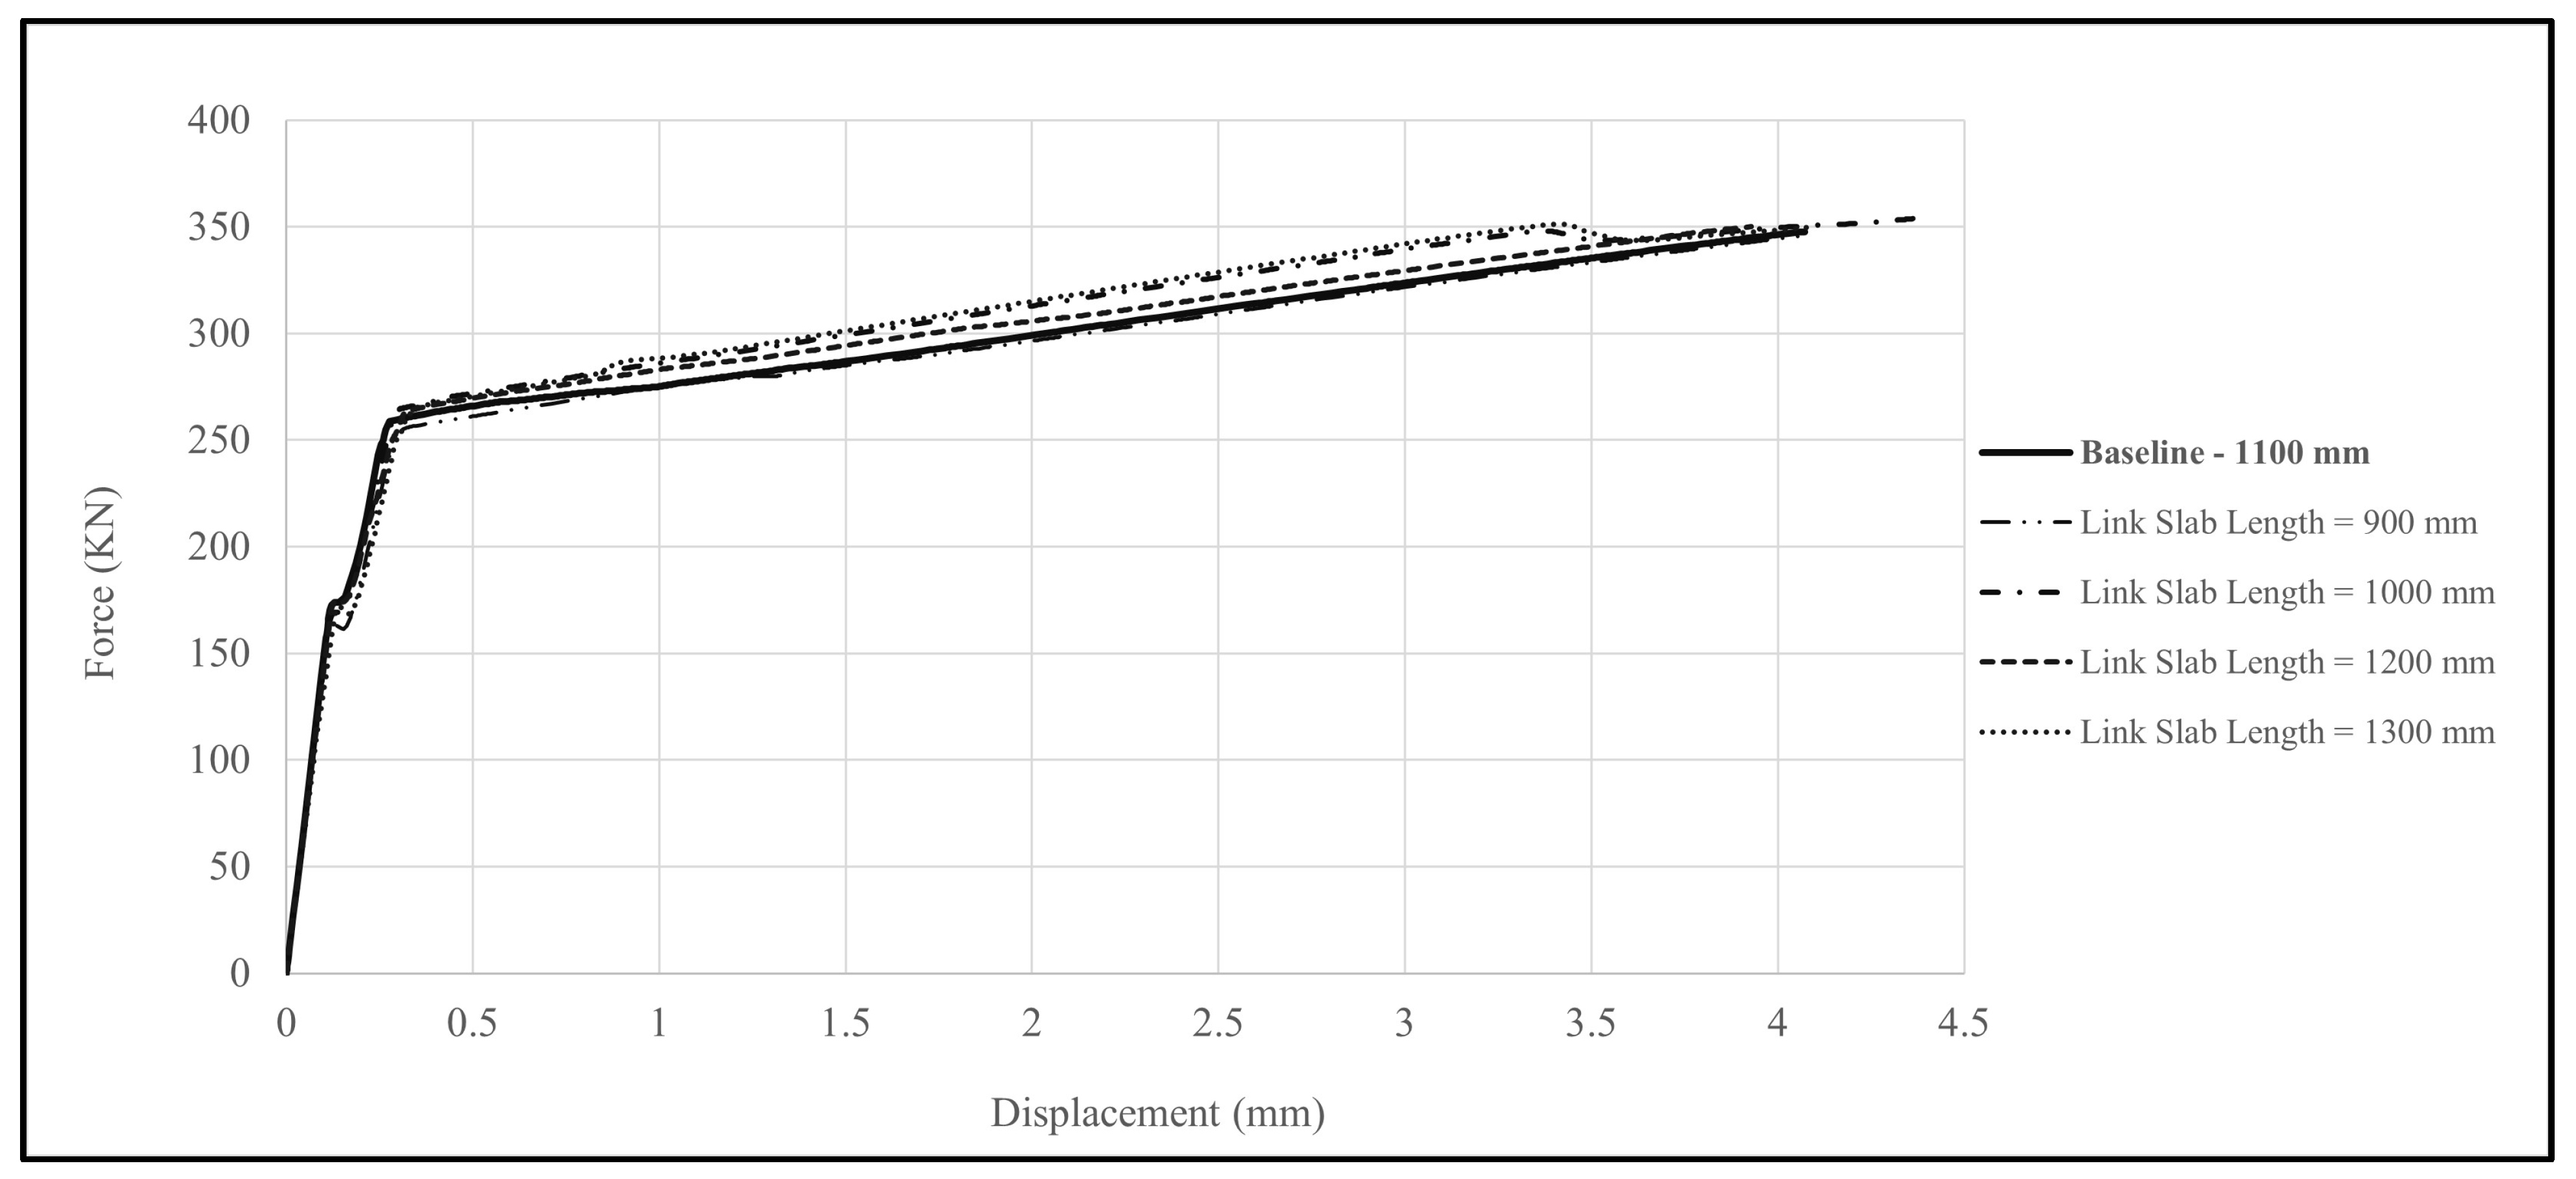
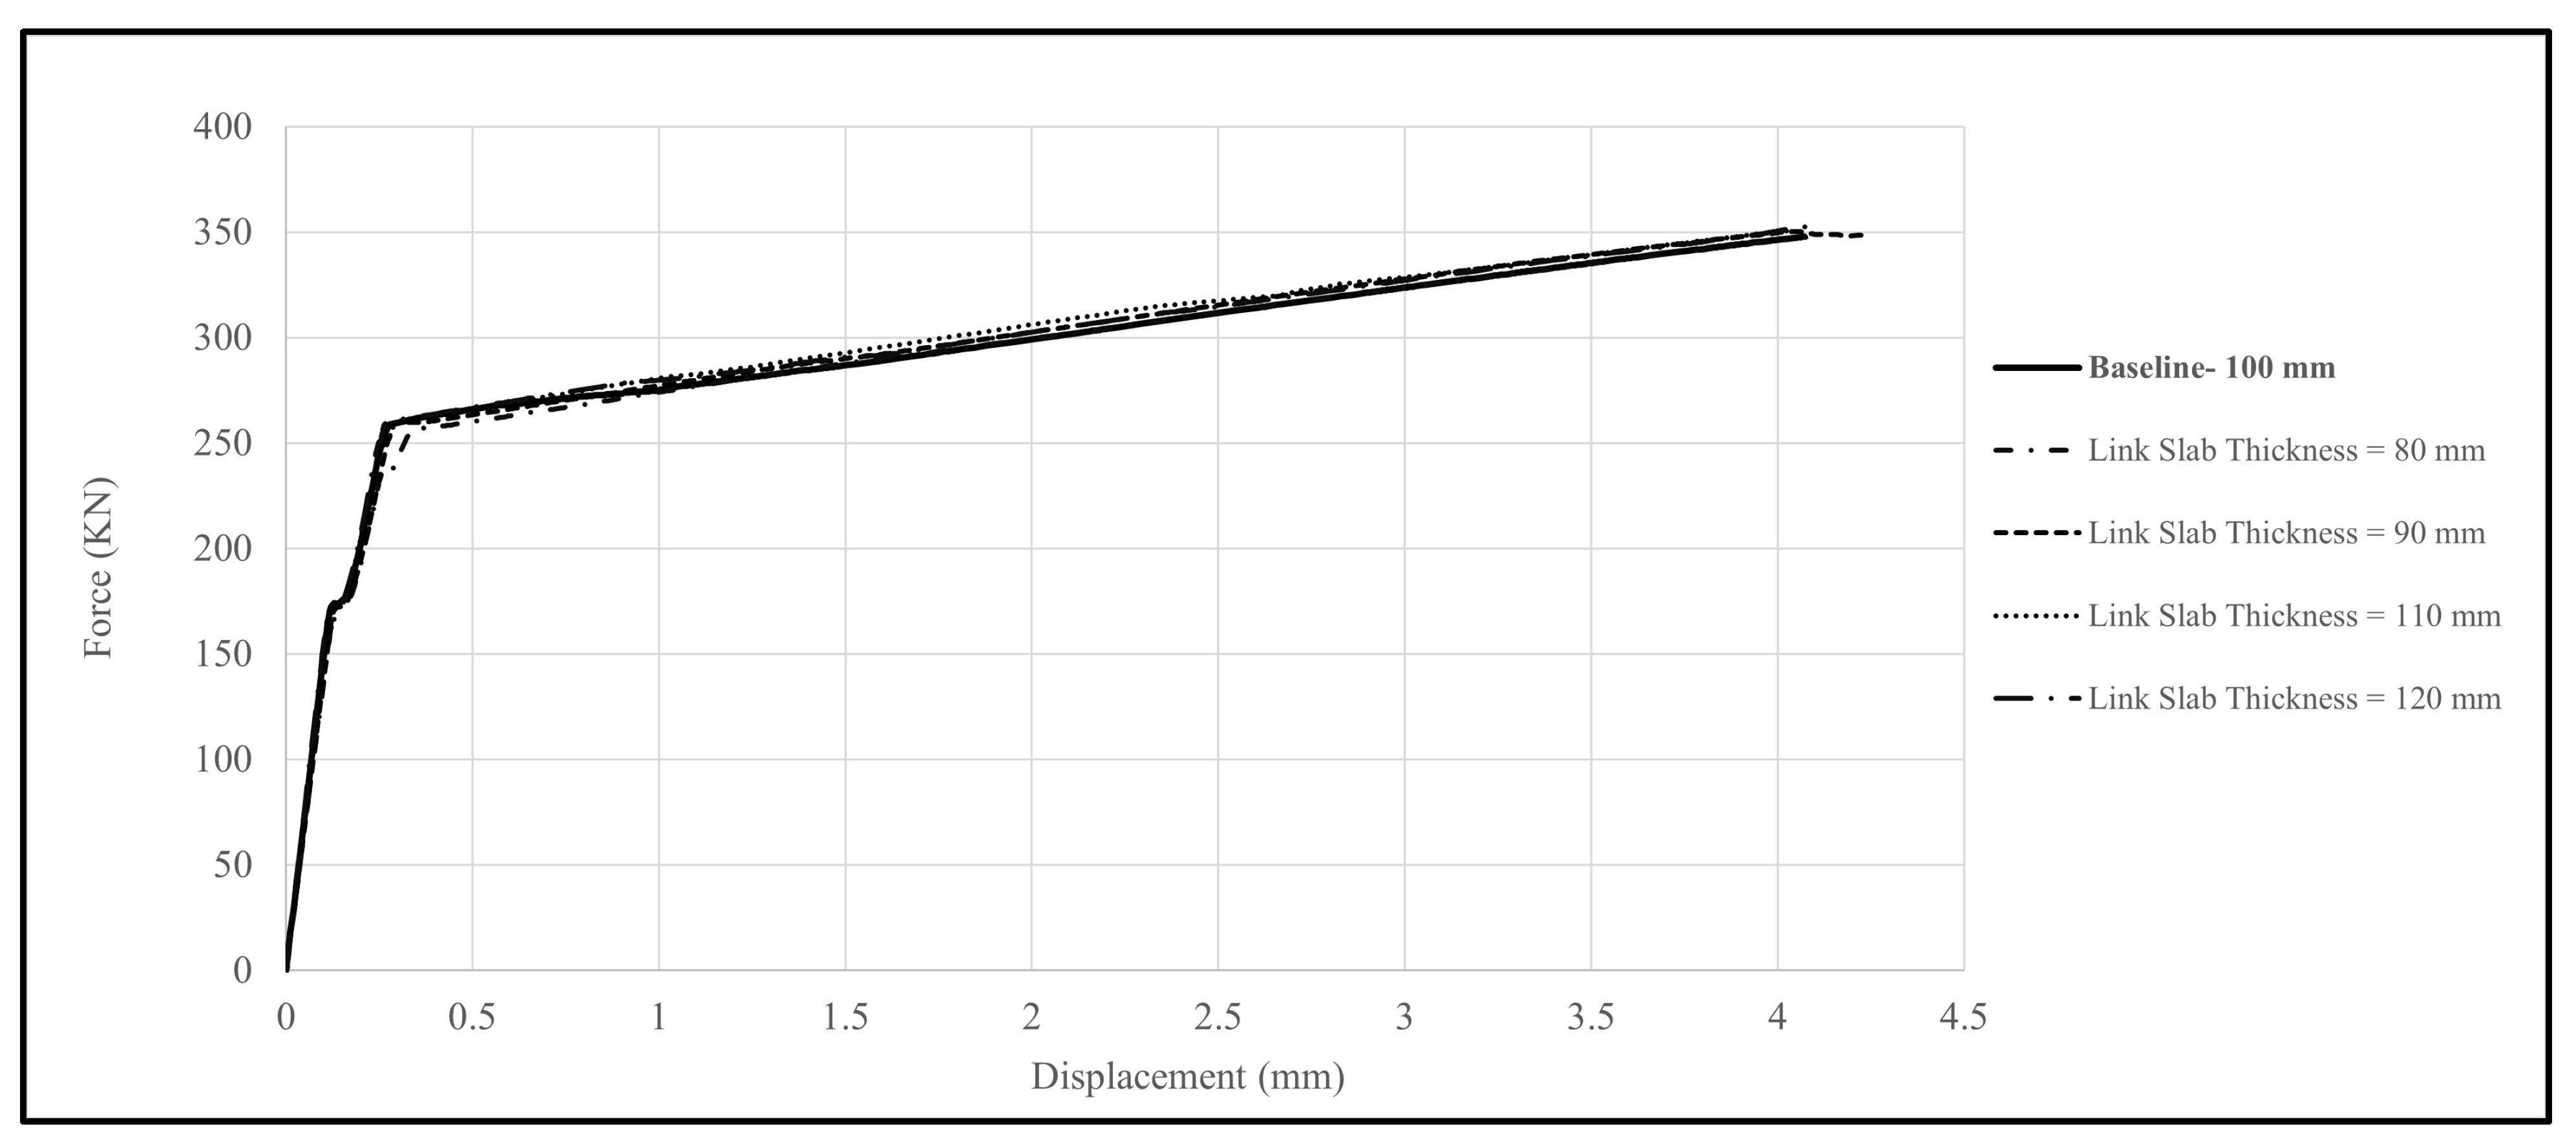
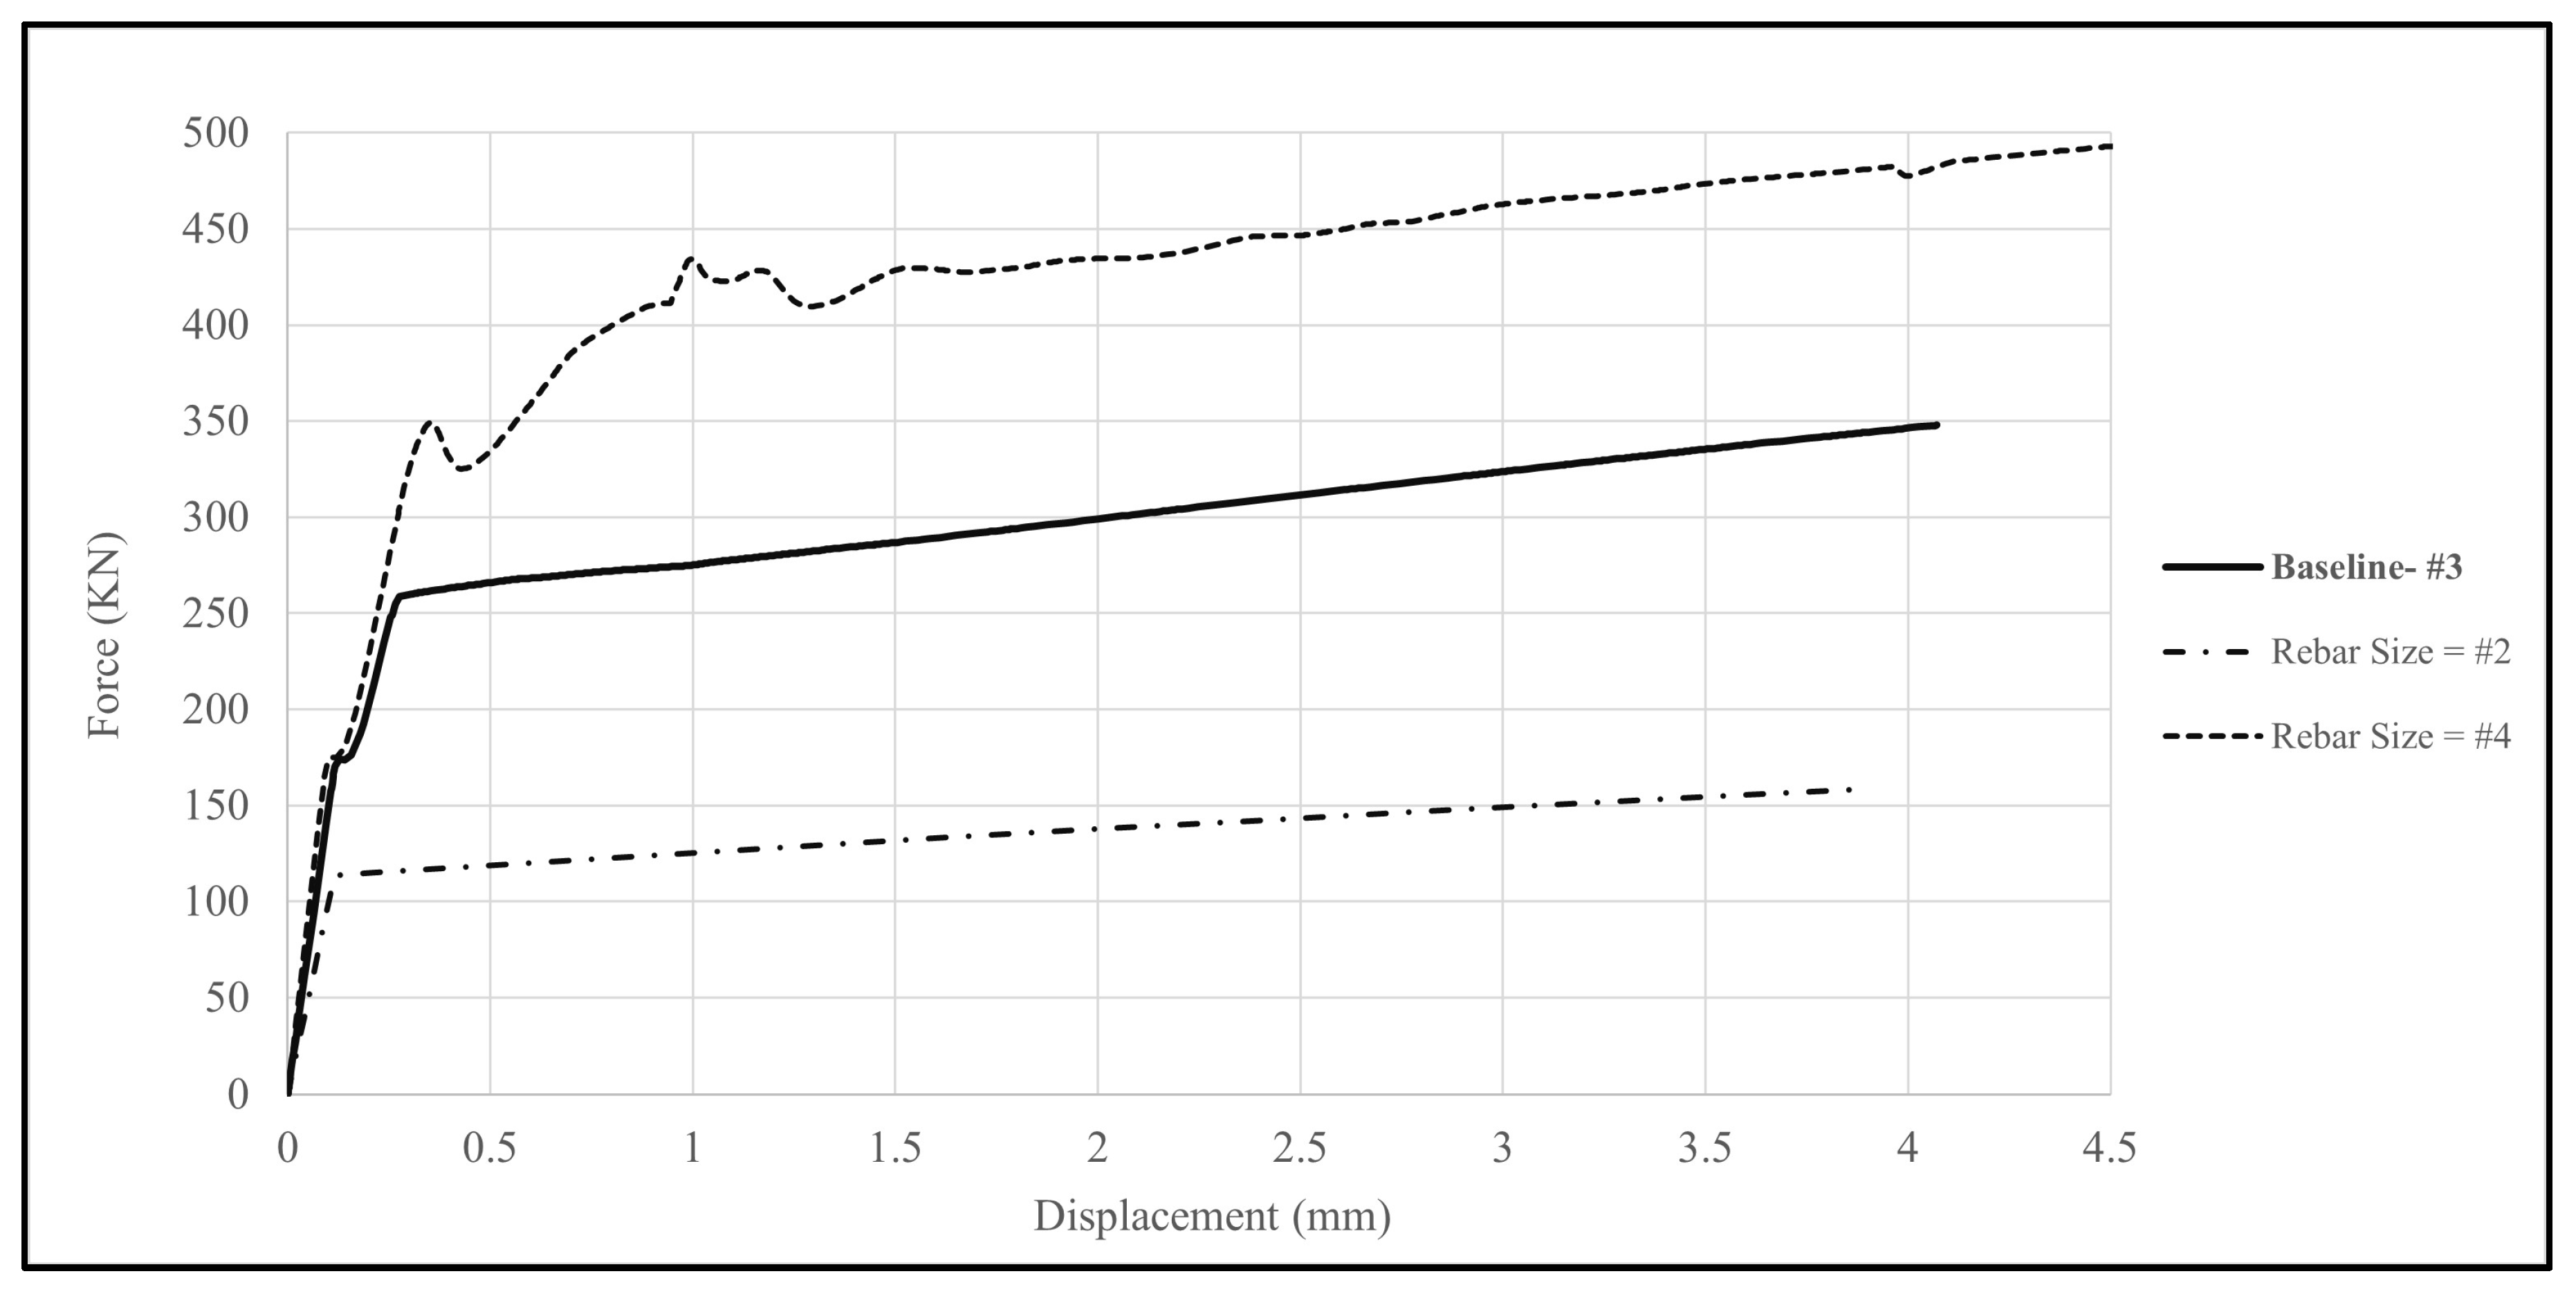
This subsection synthesizes the effects of the five geometrical variables studied, link slab length, link slab thickness, debonding length, bar diameter, and bar spacing, relative to the previously validated baseline model (link slab length = 1100 mm, link slab thickness = 100 mm, debonding length = 600 mm, and #3 bars at 100 mm spacing). For each parameter, the load–displacement responses are shown in Figure 13, Figure 14, Figure 15, Figure 16, Figure 17 and Figure 18, and the extracted response metrics (initial stiffness K0, yield load/displacement Py, Δy, ultimate load/displacement Pu, Δu, and ductility μ) are compiled in Table 1.
Rebar diameter produced the largest response shifts among all geometrical variables. Increasing the bar size from #3 to #4 (ϕ = 12.7 mm) substantially raised K0 (~ +30%), Py (~ +37%), and Pu (~ +48%) and extended Δu (~ +85%), with a meaningful gain in μ (~ +42%). Conversely, reducing to #2 (ϕ = 6.4 mm) severely reduced capacity (~ −55% in Pu) and stiffness (~ −27%). Notably, the very high μ observed for #2 is driven by a very small Δy and should not be interpreted as improved performance, given the pronounced loss of strength and stiffness. Overall, bar diameter governs both strength and deformability in this system.
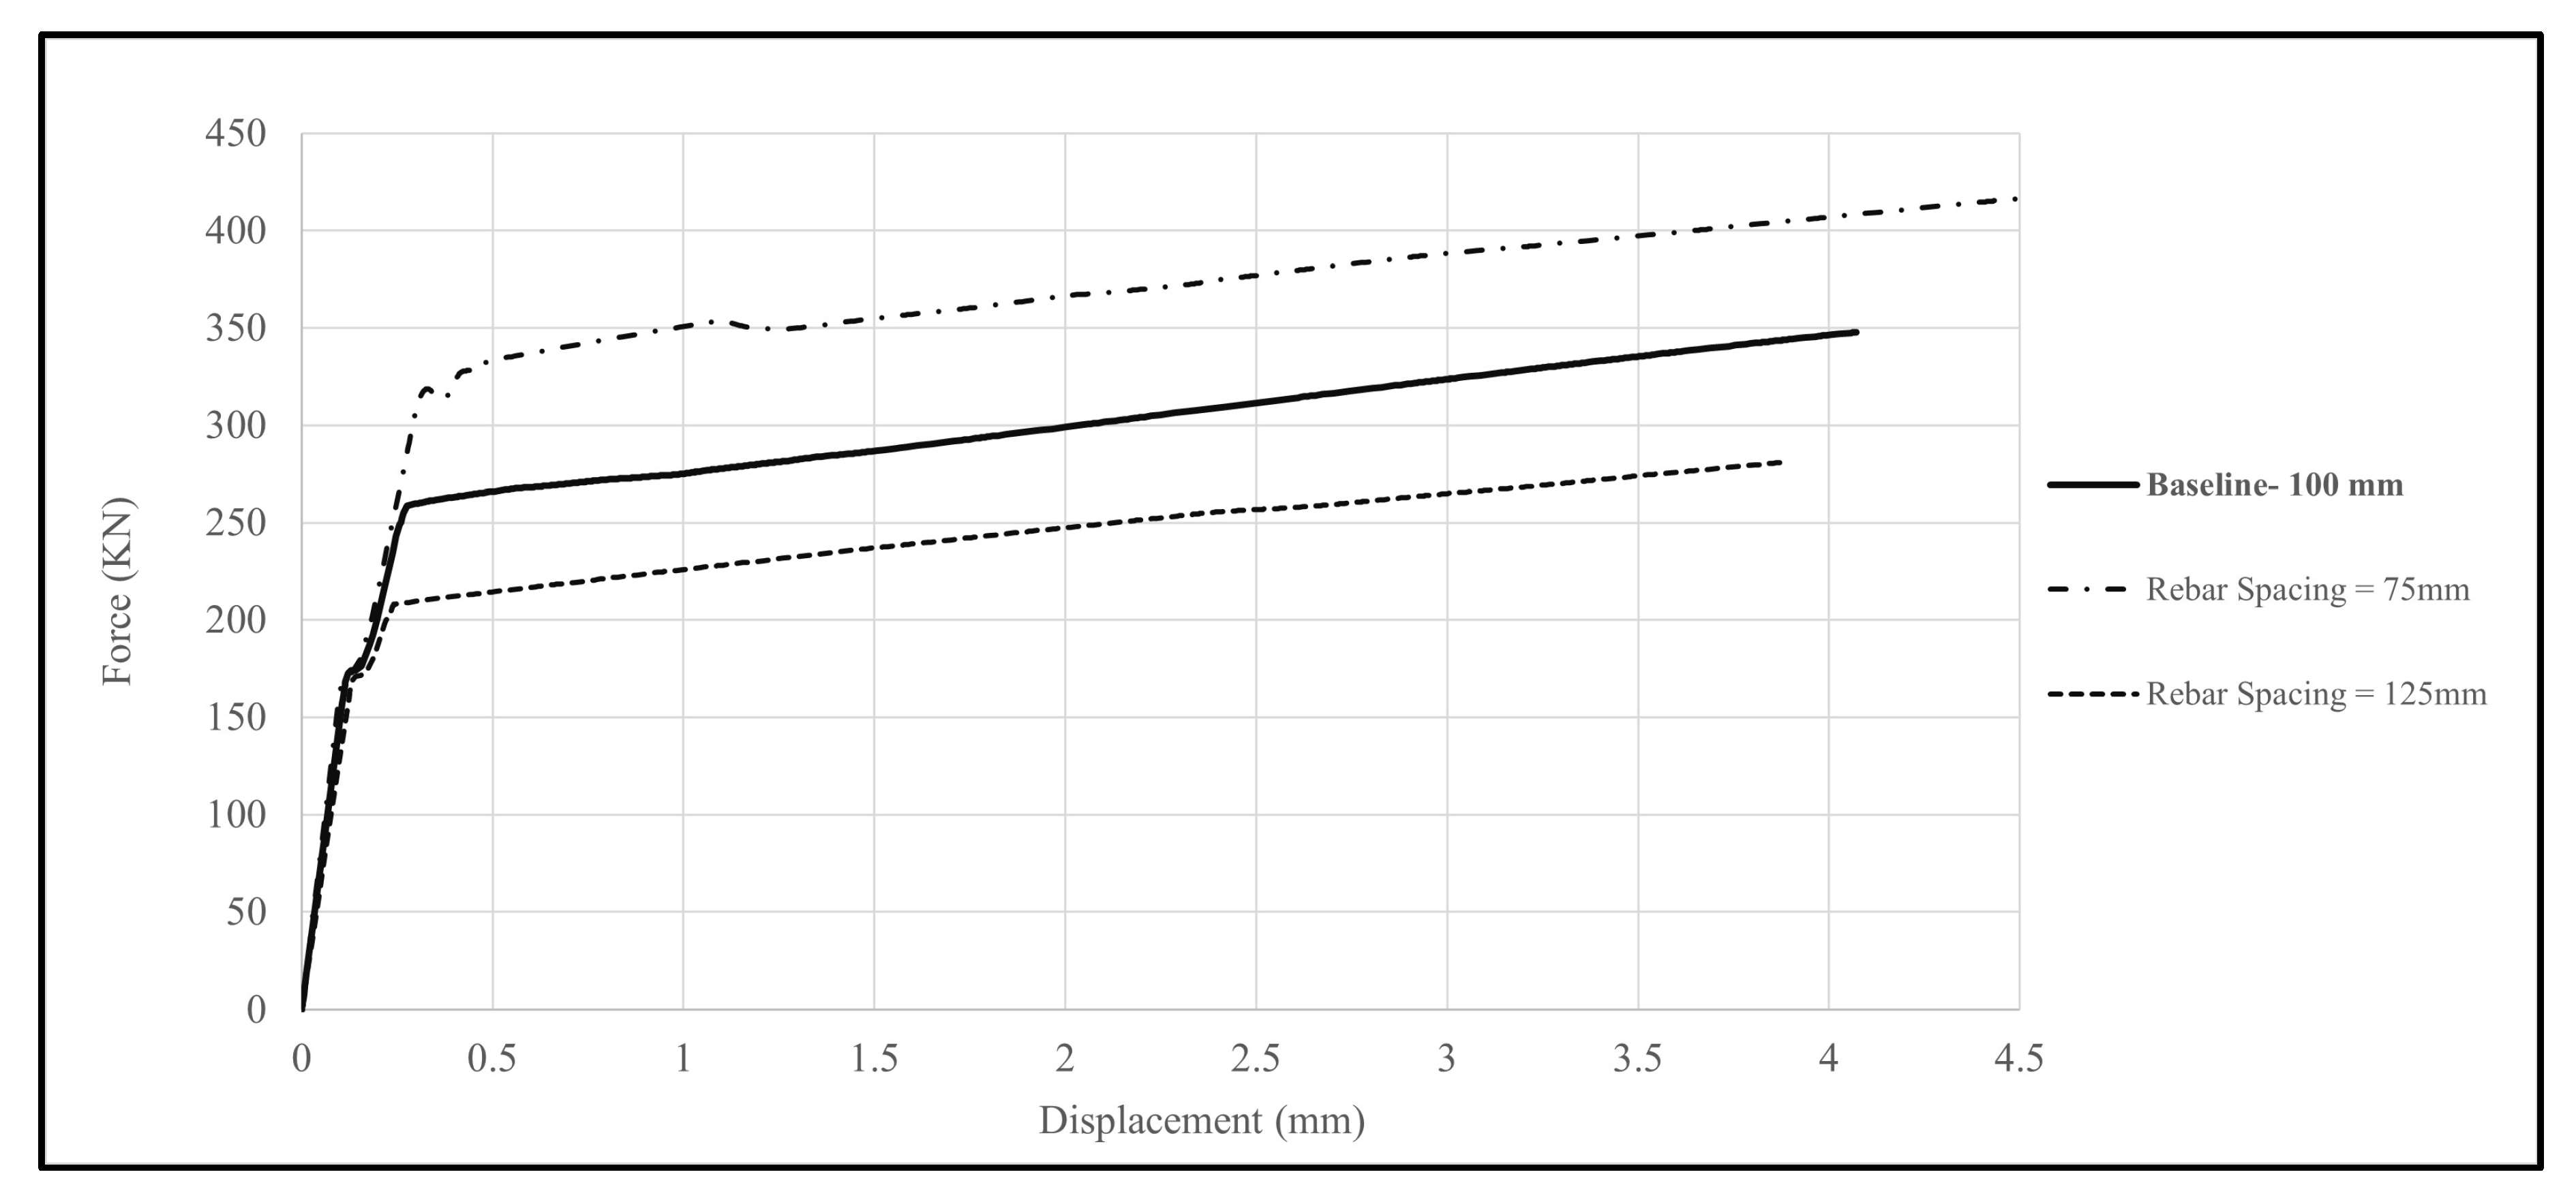
Rebar spacing ranked second in influence. Closer spacing (75 mm) increased K0 (~ +18%), Py (~ +25%), and Pu (~ +27%) and enlarged Δu (~ +39%), with a moderate rise in μ (~ +16%). Wider spacing (125 mm) reduced K0 (~ −10%), Py (~ −18%), and Pu (~ −19%) and slightly shortened Δu. These results indicate that reinforcement quantity and distribution (diameter and spacing) are the primary geometric levers for capacity and stiffness.
Debonding length mainly trades capacity for ductility. Shorter debonding (300–450 mm) delivered small increases in Pu (~ +2–3%) but reduced μ (~ −7–10%). Longer debonding (750–900 mm) slightly decreased Pu (~ −1–1.5%) while increasing μ (~ +2–4%) and Δu. Variation in K0 remained modest (within ~ ±8%). Practically, debonding length is an effective tuning parameter to shift the balance between capacity and deformation demand without large changes in stiffness.
Link slab thickness had a clear stiffness effect with limited impact on strength. Increasing thickness from 100 mm to 120 mm raised K0 (~ +10%) and produced only minor gains in Pu (~ +1–2%), with μ essentially unchanged. Thinning to 80 mm slightly lowered K0 (~ −2.5%) and reduced μ (~ −21%) due to a larger Δy. Thus, thickness primarily controls rigidity and yield characteristics rather than peak capacity.
Link slab length produced small changes in Pu (±2%) but a gradual reduction in K0 with increasing length (up to ~ −7.5% at 1300 mm). The validated 1100 mm case provided the highest ductility among the tested lengths; other lengths showed lower μ (~ 5–21% below baseline). Hence, length is a secondary geometric driver compared with reinforcement variables.
Therefore, among the geometrical factors, reinforcement detailing dominates the global response: bar diameter is the most influential on K0, Py, Pu, and Δu; spacing follows a similar but slightly smaller pattern. Debonding length is best used to tune ductility with minimal stiffness penalty, while thickness primarily adjusts stiffness and yield characteristics with minor strength change. Length has the least effect on capacity but affects stiffness and (to a lesser extent) ductility. For balanced performance—high capacity and stiffness with ample deformation capacity—the results support larger bars (or closer spacing) combined with a moderate debonding length and thickness ≥ 100–110 mm while retaining length near the validated 1100 mm.

3.2.2. Numerical Parameters

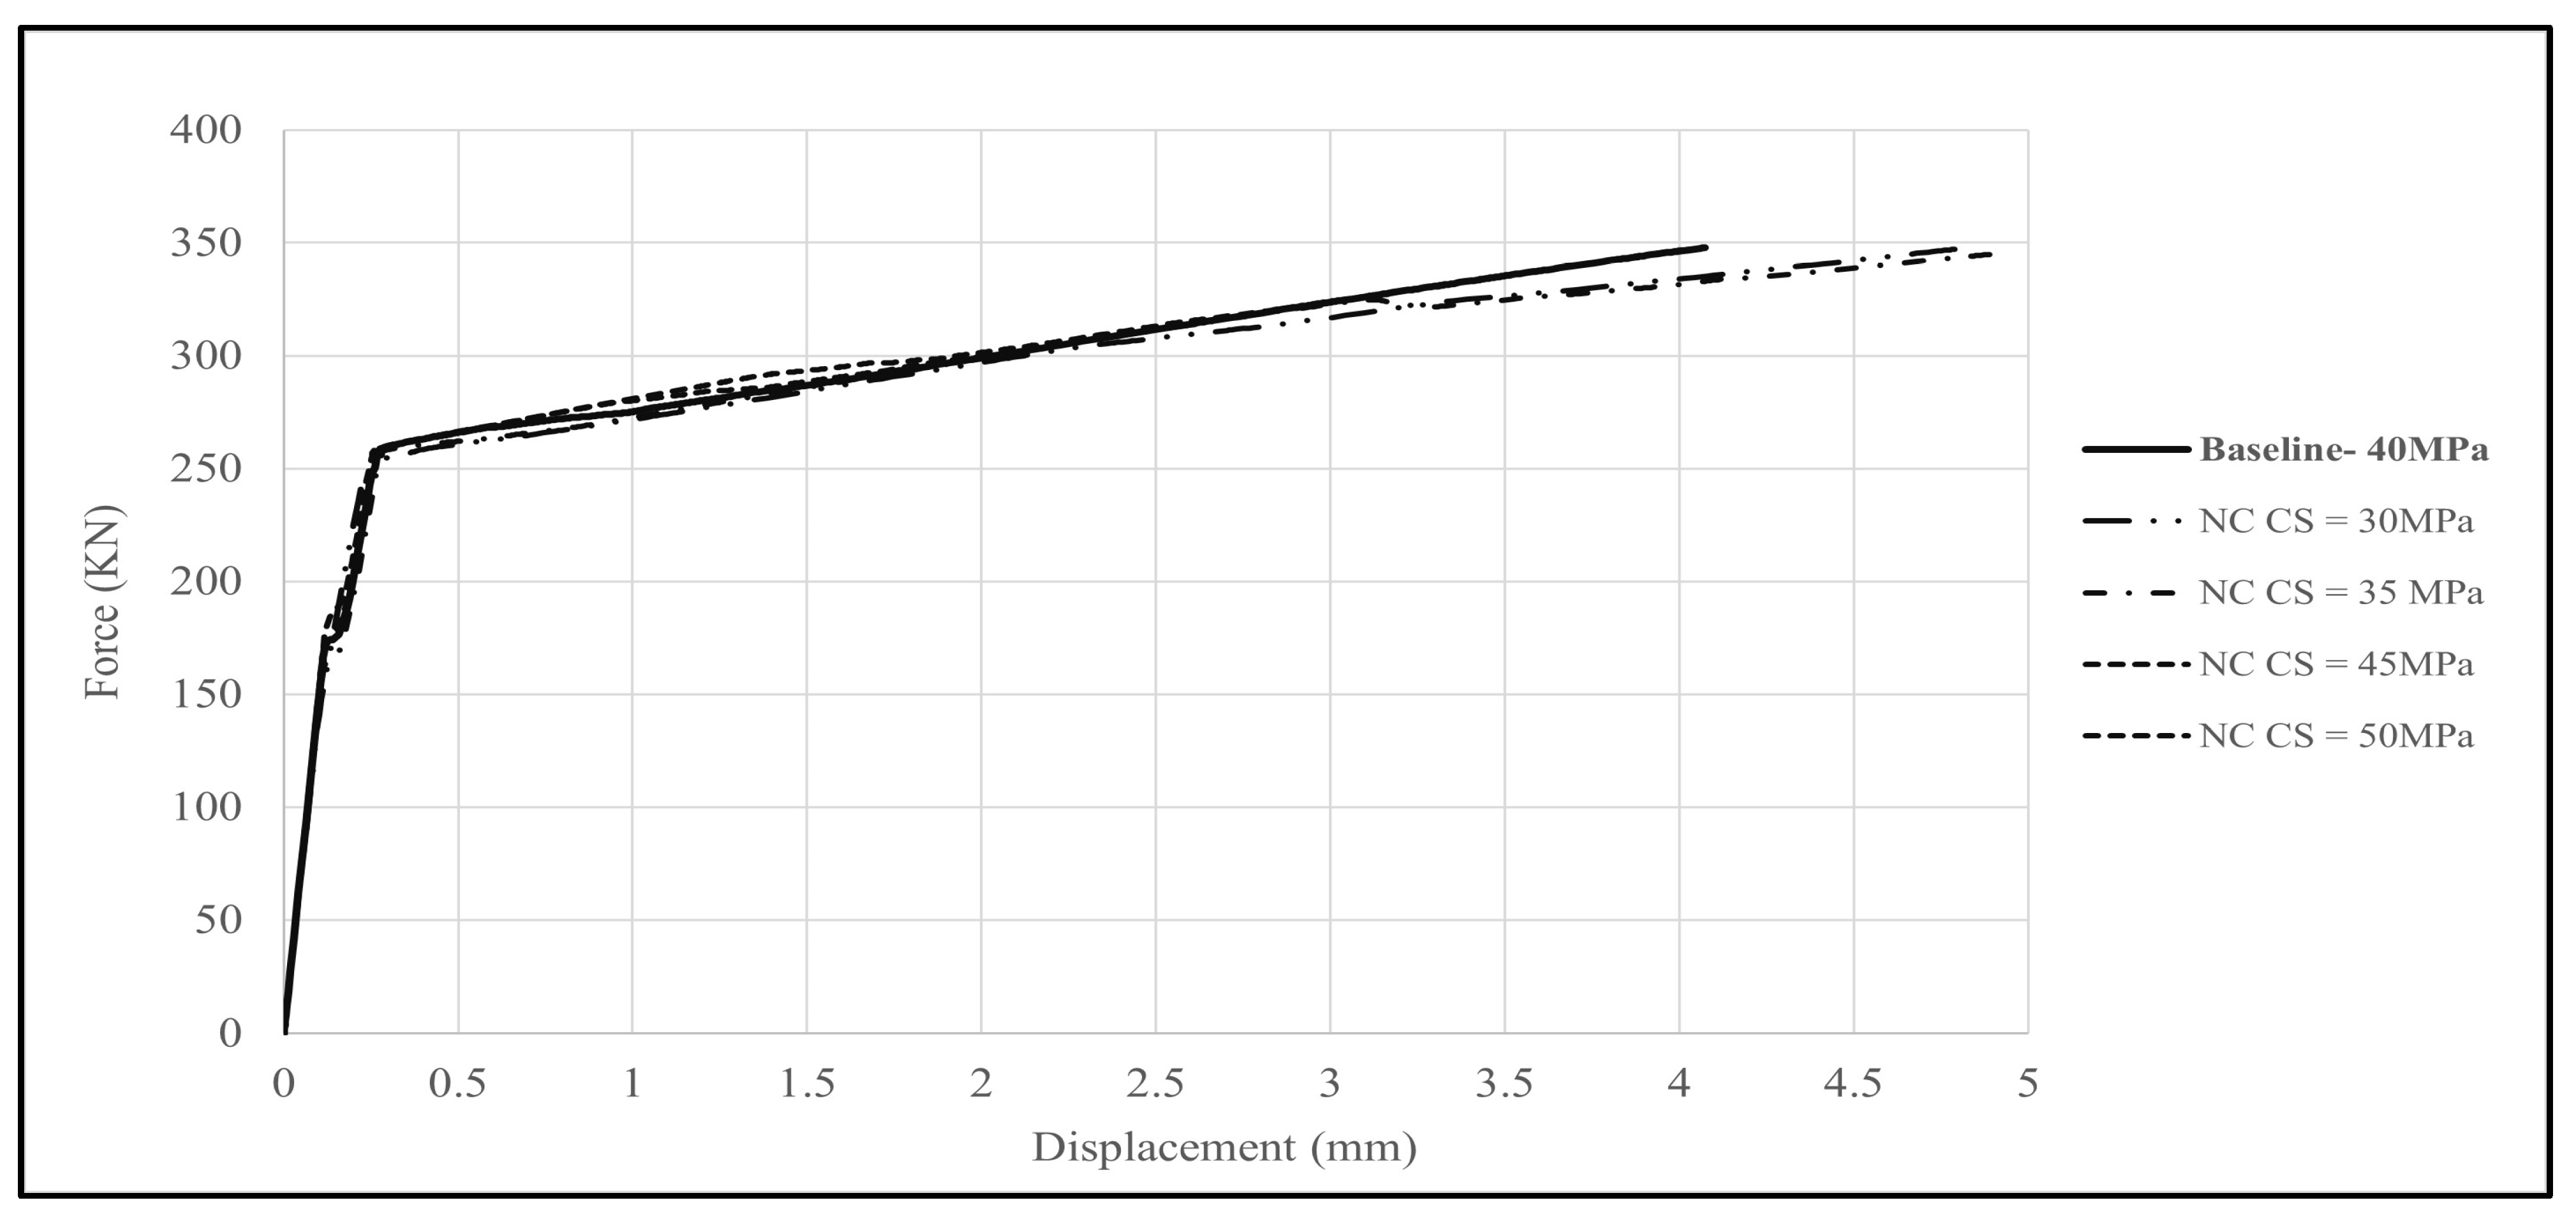
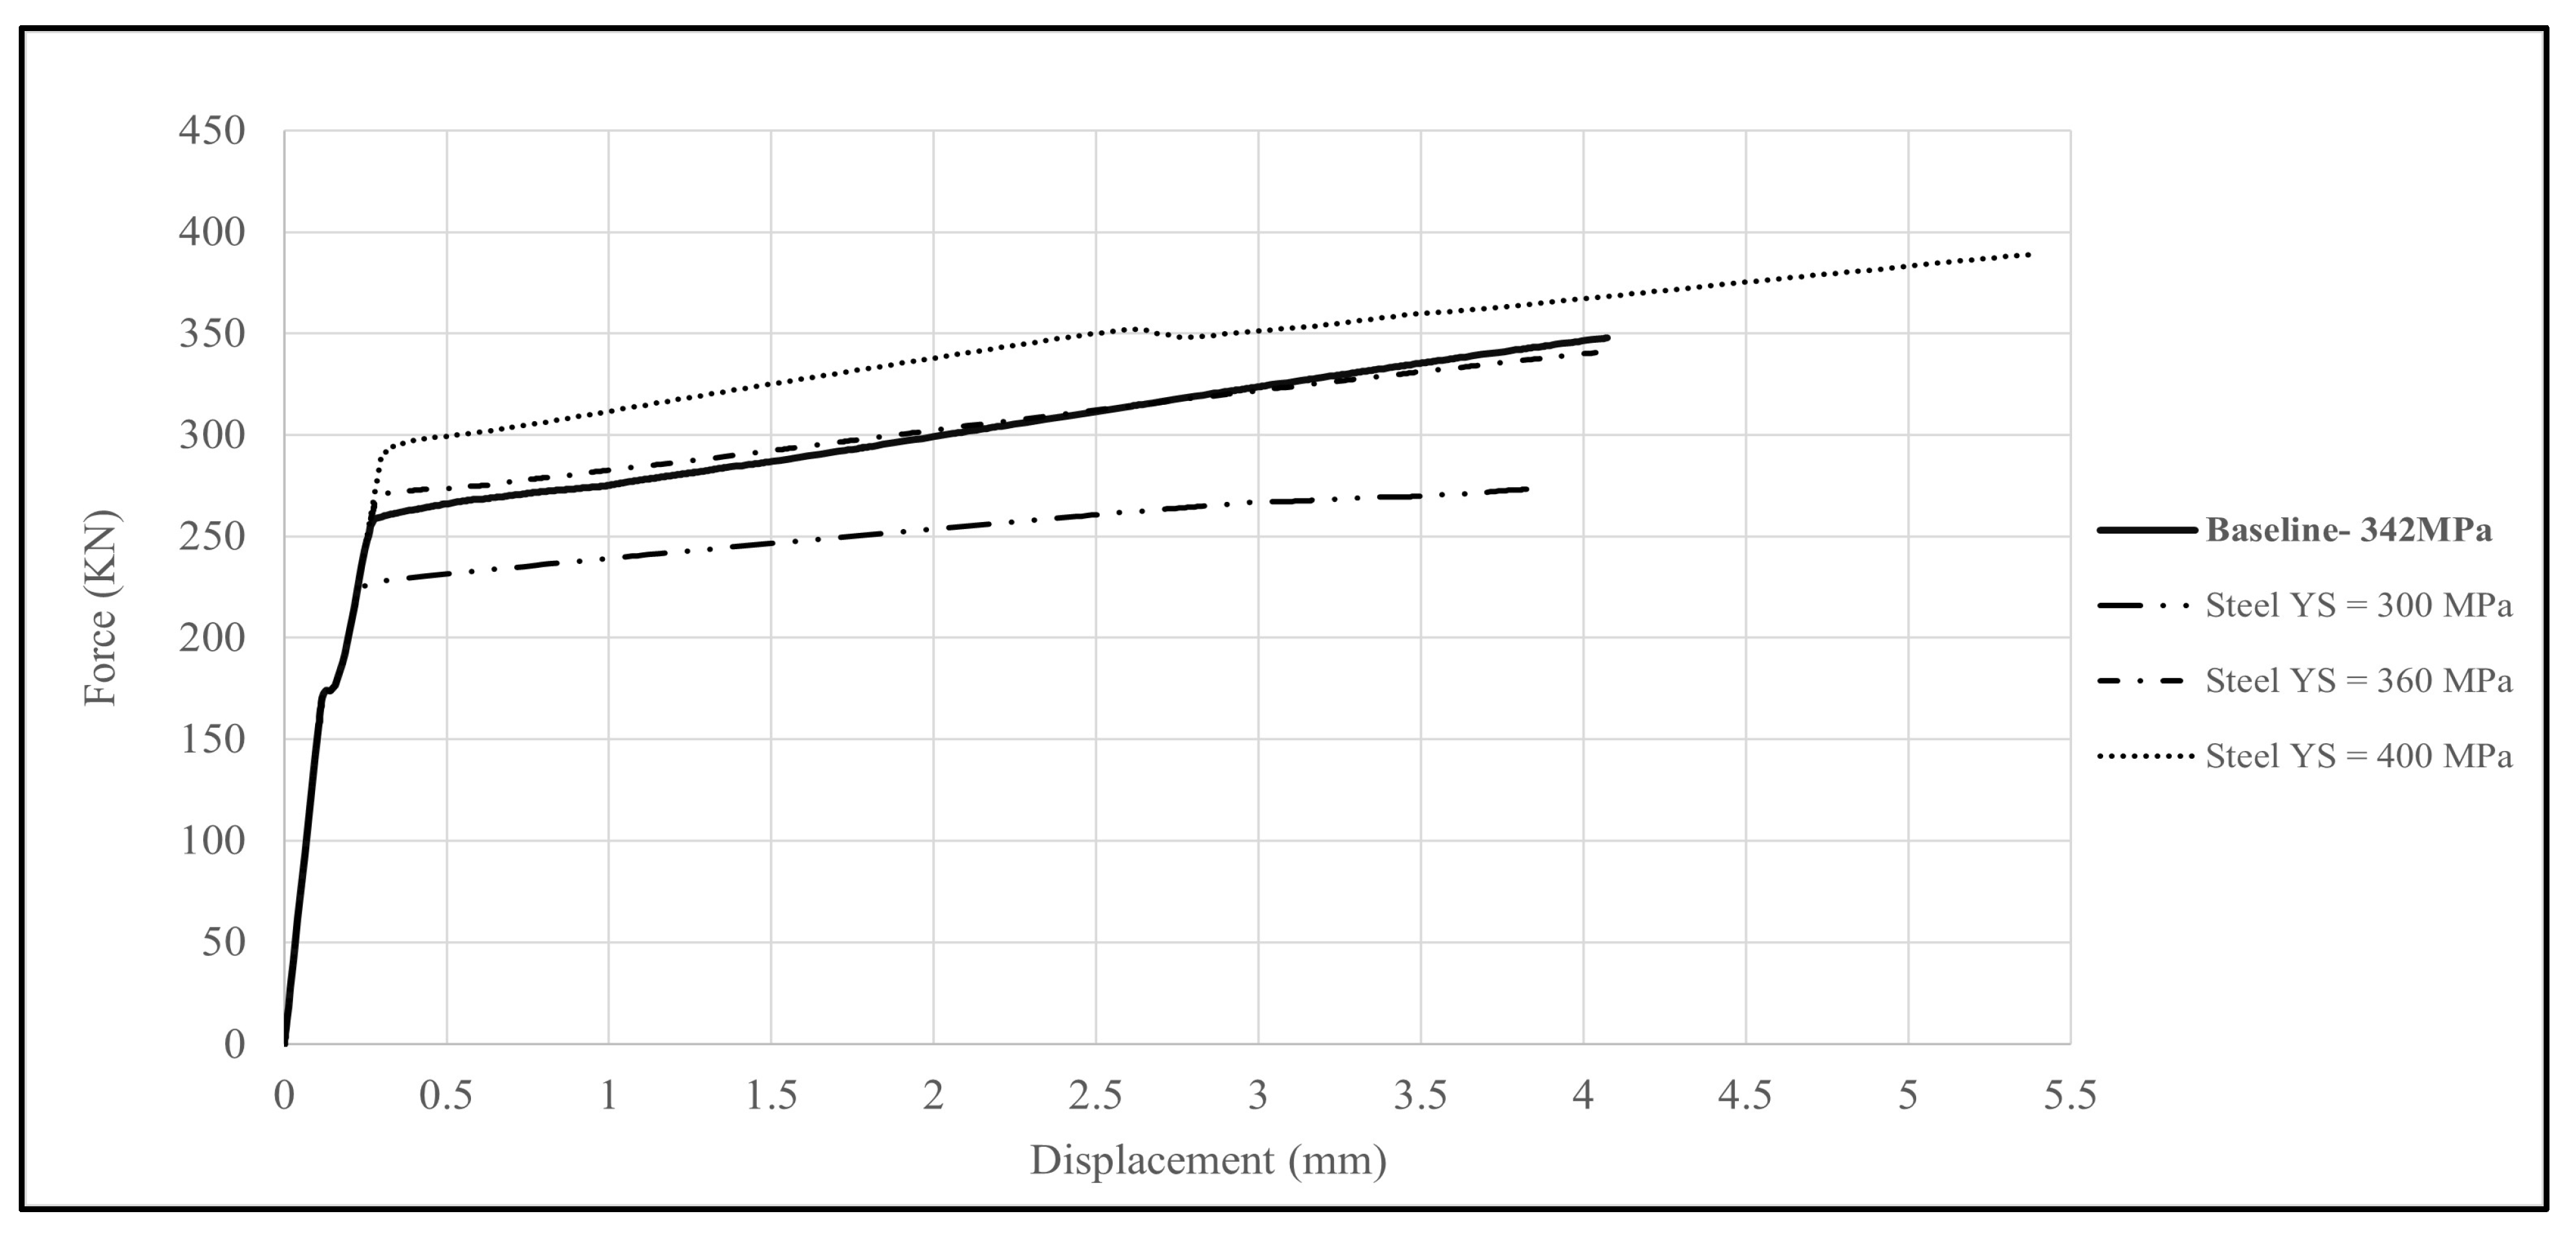
This subsection evaluates the influence of five numerical inputs, friction coefficient between link slab and girder interfaces (non-debonding zone), friction coefficient between rubber sheet and girder interfaces (debonding zone), compressive strength of UHPC (link slab), compressive strength of normal concrete (girders/decks), and steel yield strength, with respect to the previously validated baseline model (friction coefficient for non-debonding zone = 0.4, frictionless behavior for debonding interface, UHPC compressive strength = 143 MPa, normal concrete compressive strength = 40 MPa, and rebar yielding strength = 342 MPa). For each parameter, the load–displacement responses are shown in Figure 18, Figure 19, Figure 20, Figure 21 and Figure 22, and the extracted response metrics are compiled in Table 2.
Steel yield strength was the most influential numerical parameter. Increasing from 342 to 400 MPa produced marked gains in K0 (~ +5%), Py (~ +14%), and Pu (~ +12%), together with higher Δu and μ (~ +14%). Lowering fy to 300 MPa sharply reduced Pu (~ −20%) and K0 (~ −3–4%). These results confirm that reinforcement strength governs both the elastic and post-yield response of the system.
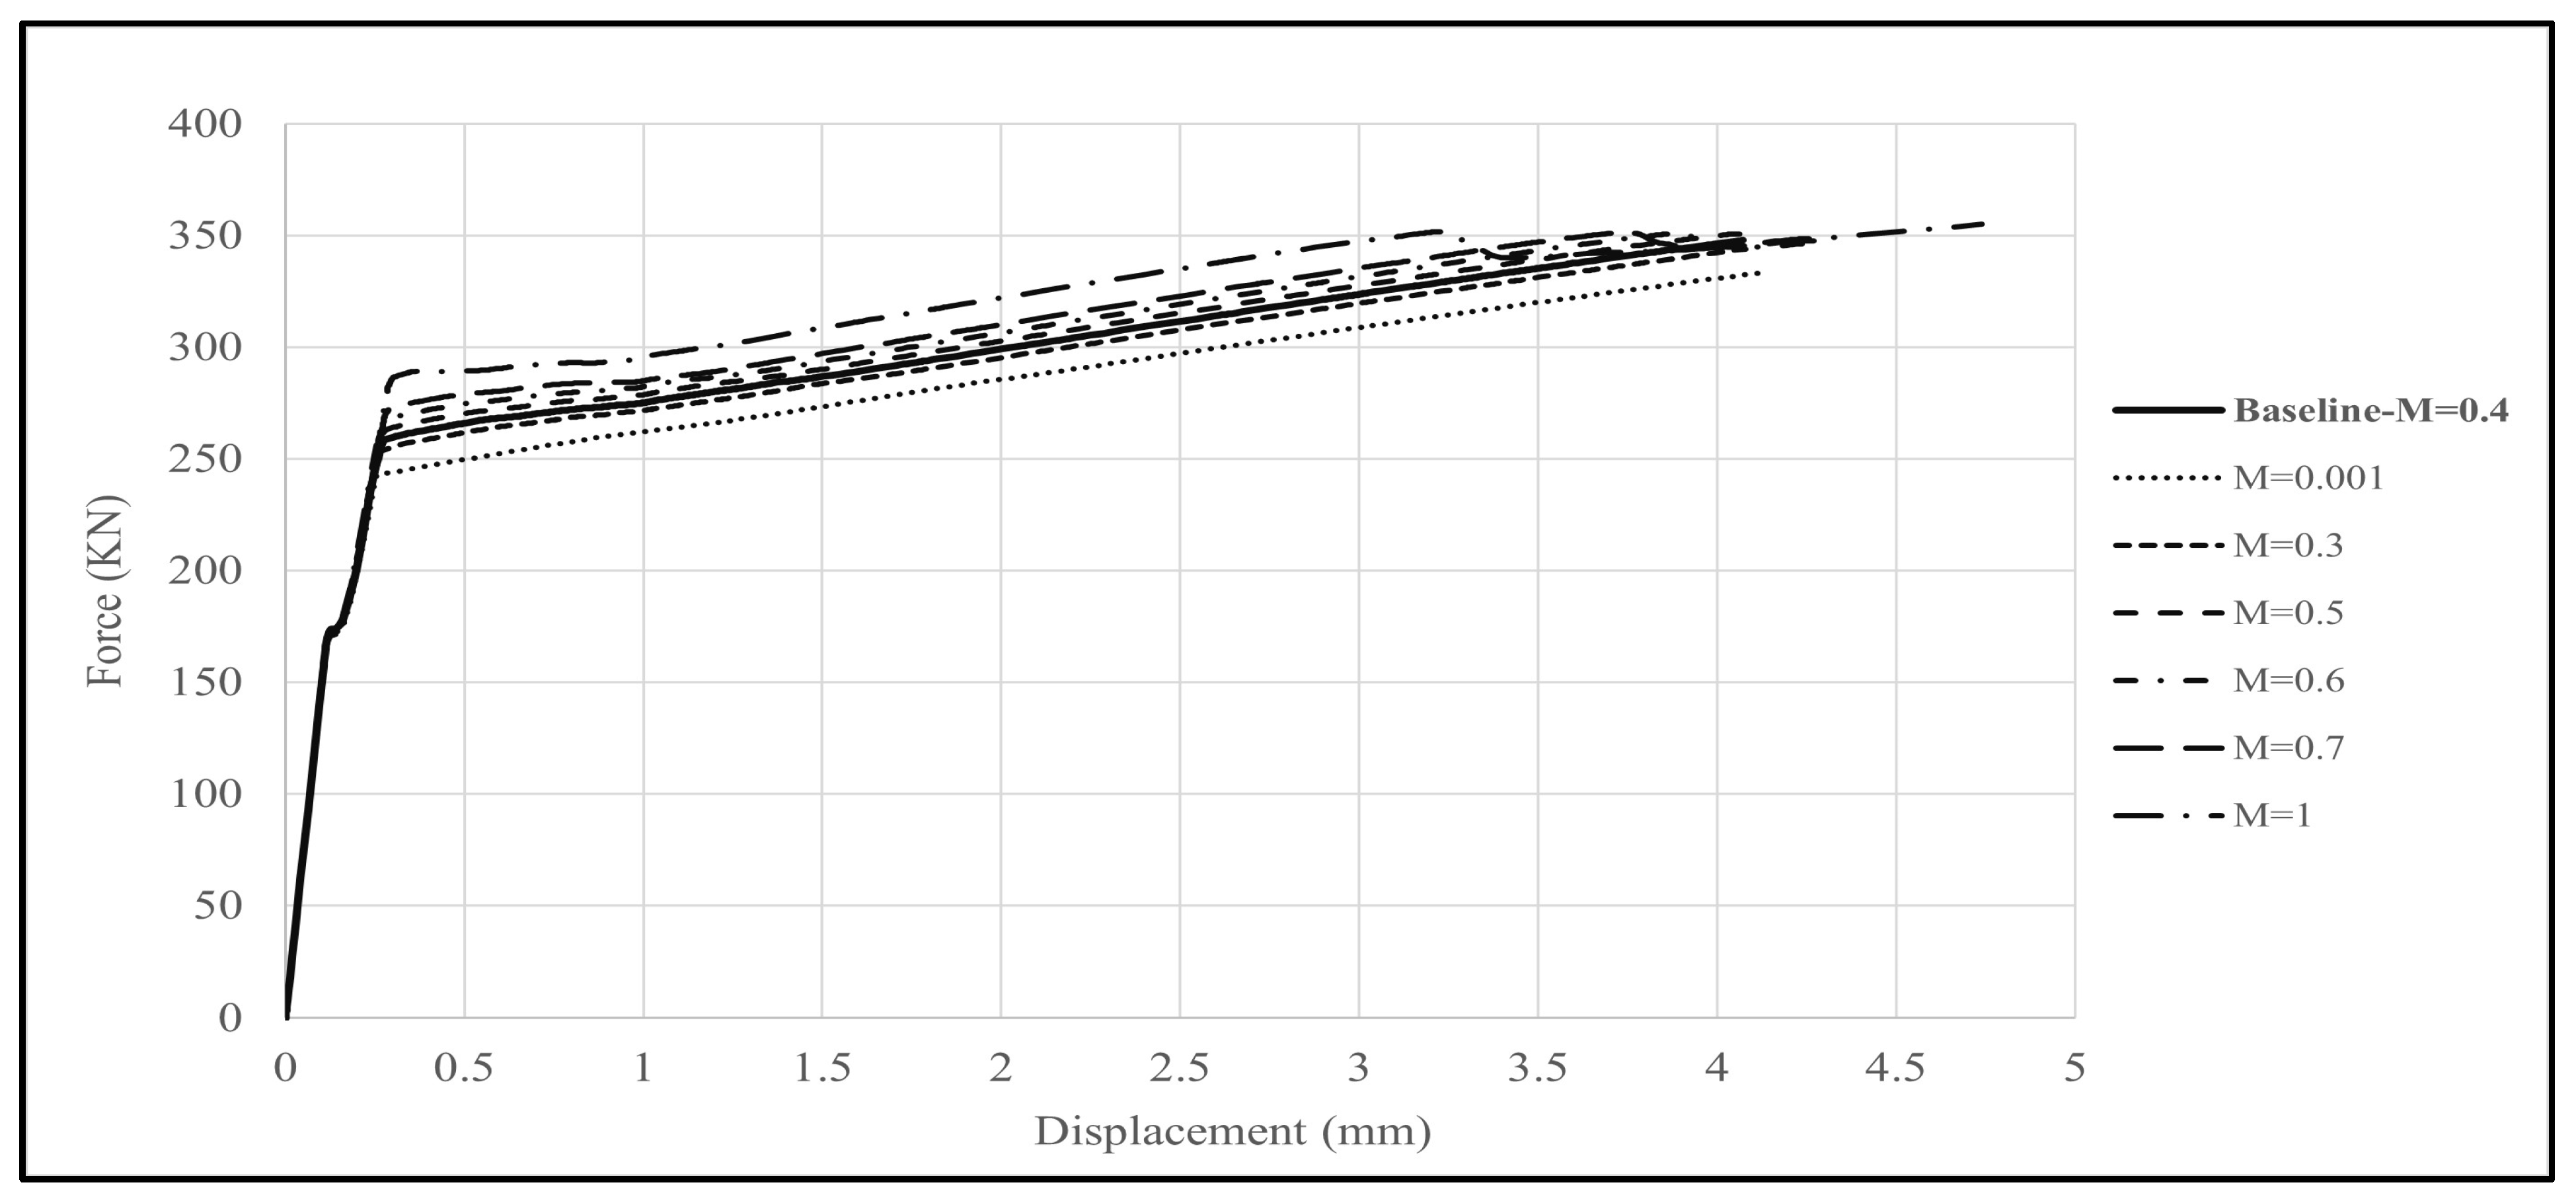
Friction coefficient at the non-debonding zone, between link slabs and girders, (0.001–1.0) produced moderate capacity changes and clear shifts in yield behavior. Relative to the baseline, 0.4, increasing to 1.0 raised Py (~ +12%) and Pu (~ +2%), with small increases in K0 and Δu; decreasing friction toward nearly zero diminished Py (~ −5%) and Pu (~ −4%). Ductility remained broadly similar (μ ~ 15–16). Thus, a higher interface friction coefficient at non-debonding regions primarily elevates the yield threshold and slightly augments capacity.
It should be noted that the extreme values adopted for the non-debonding interface friction coefficient (0.001 and 1.0) were included as bounding cases for sensitivity assessment rather than as physically representative interface conditions. Typical concrete–concrete friction coefficients in bridge applications generally fall within the range of approximately 0.3–0.7; the broader range employed here was used to evaluate the robustness of the global response and to confirm that the structural behavior of UHPC link slabs is not unduly sensitive to reasonable uncertainty in interface friction.
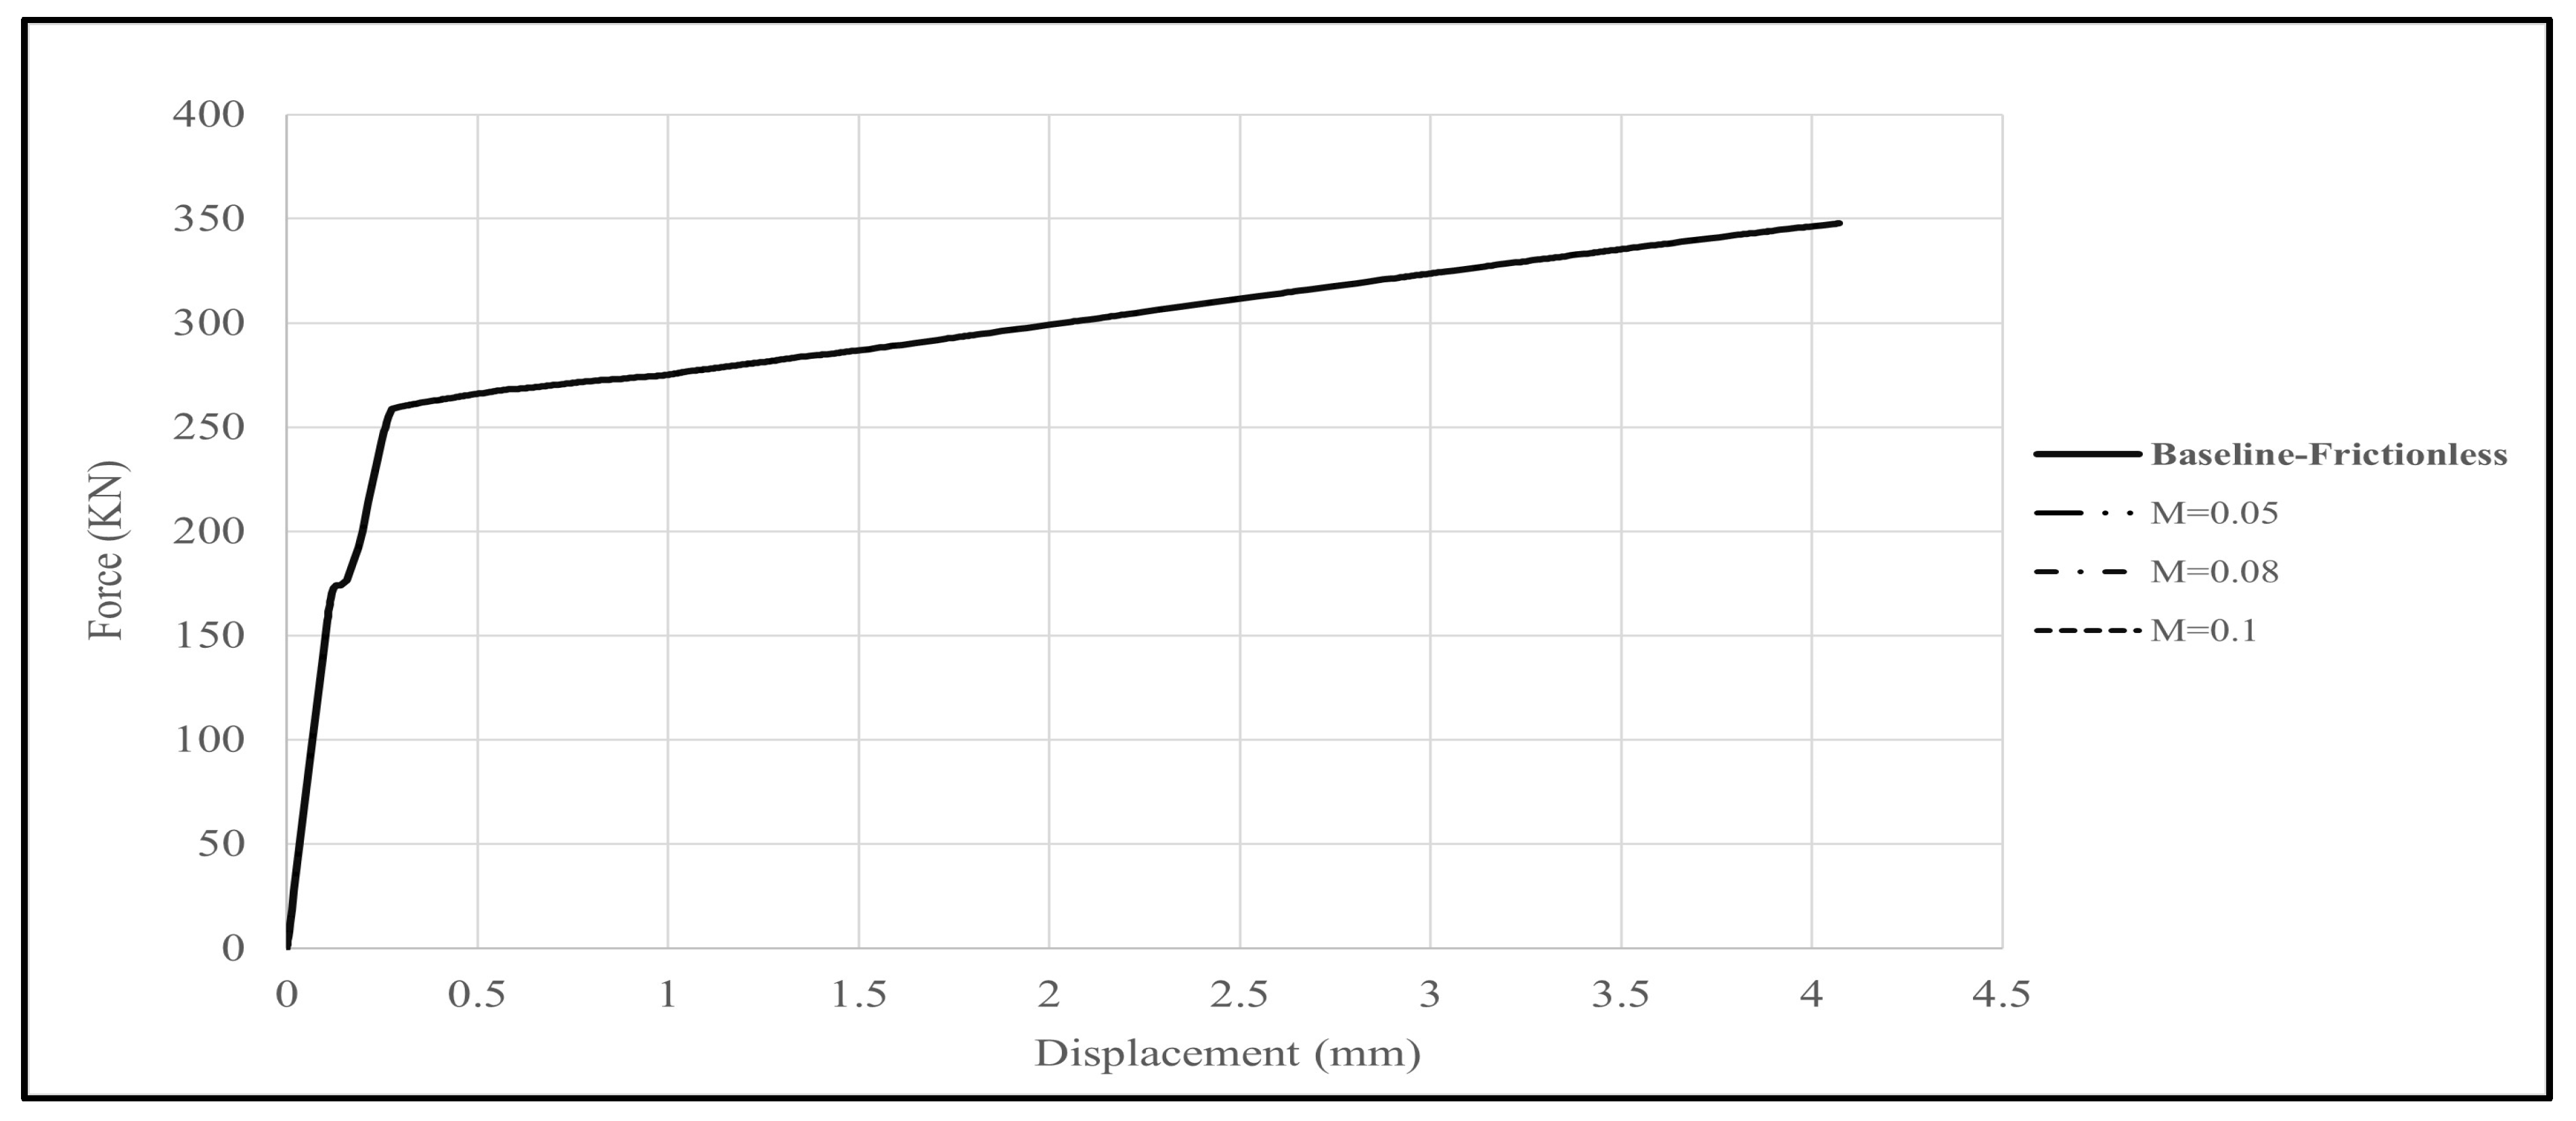
The debonding zone friction coefficient had a negligible global effect in the explored range (0.05–0.10); K0, Pu, and Δu changed by only ~ 0–1%, with minor variations in Py, Δy, and μ. This indicates that, once a compliant debonding layer is present, modest friction at that layer does not materially alter the system response.
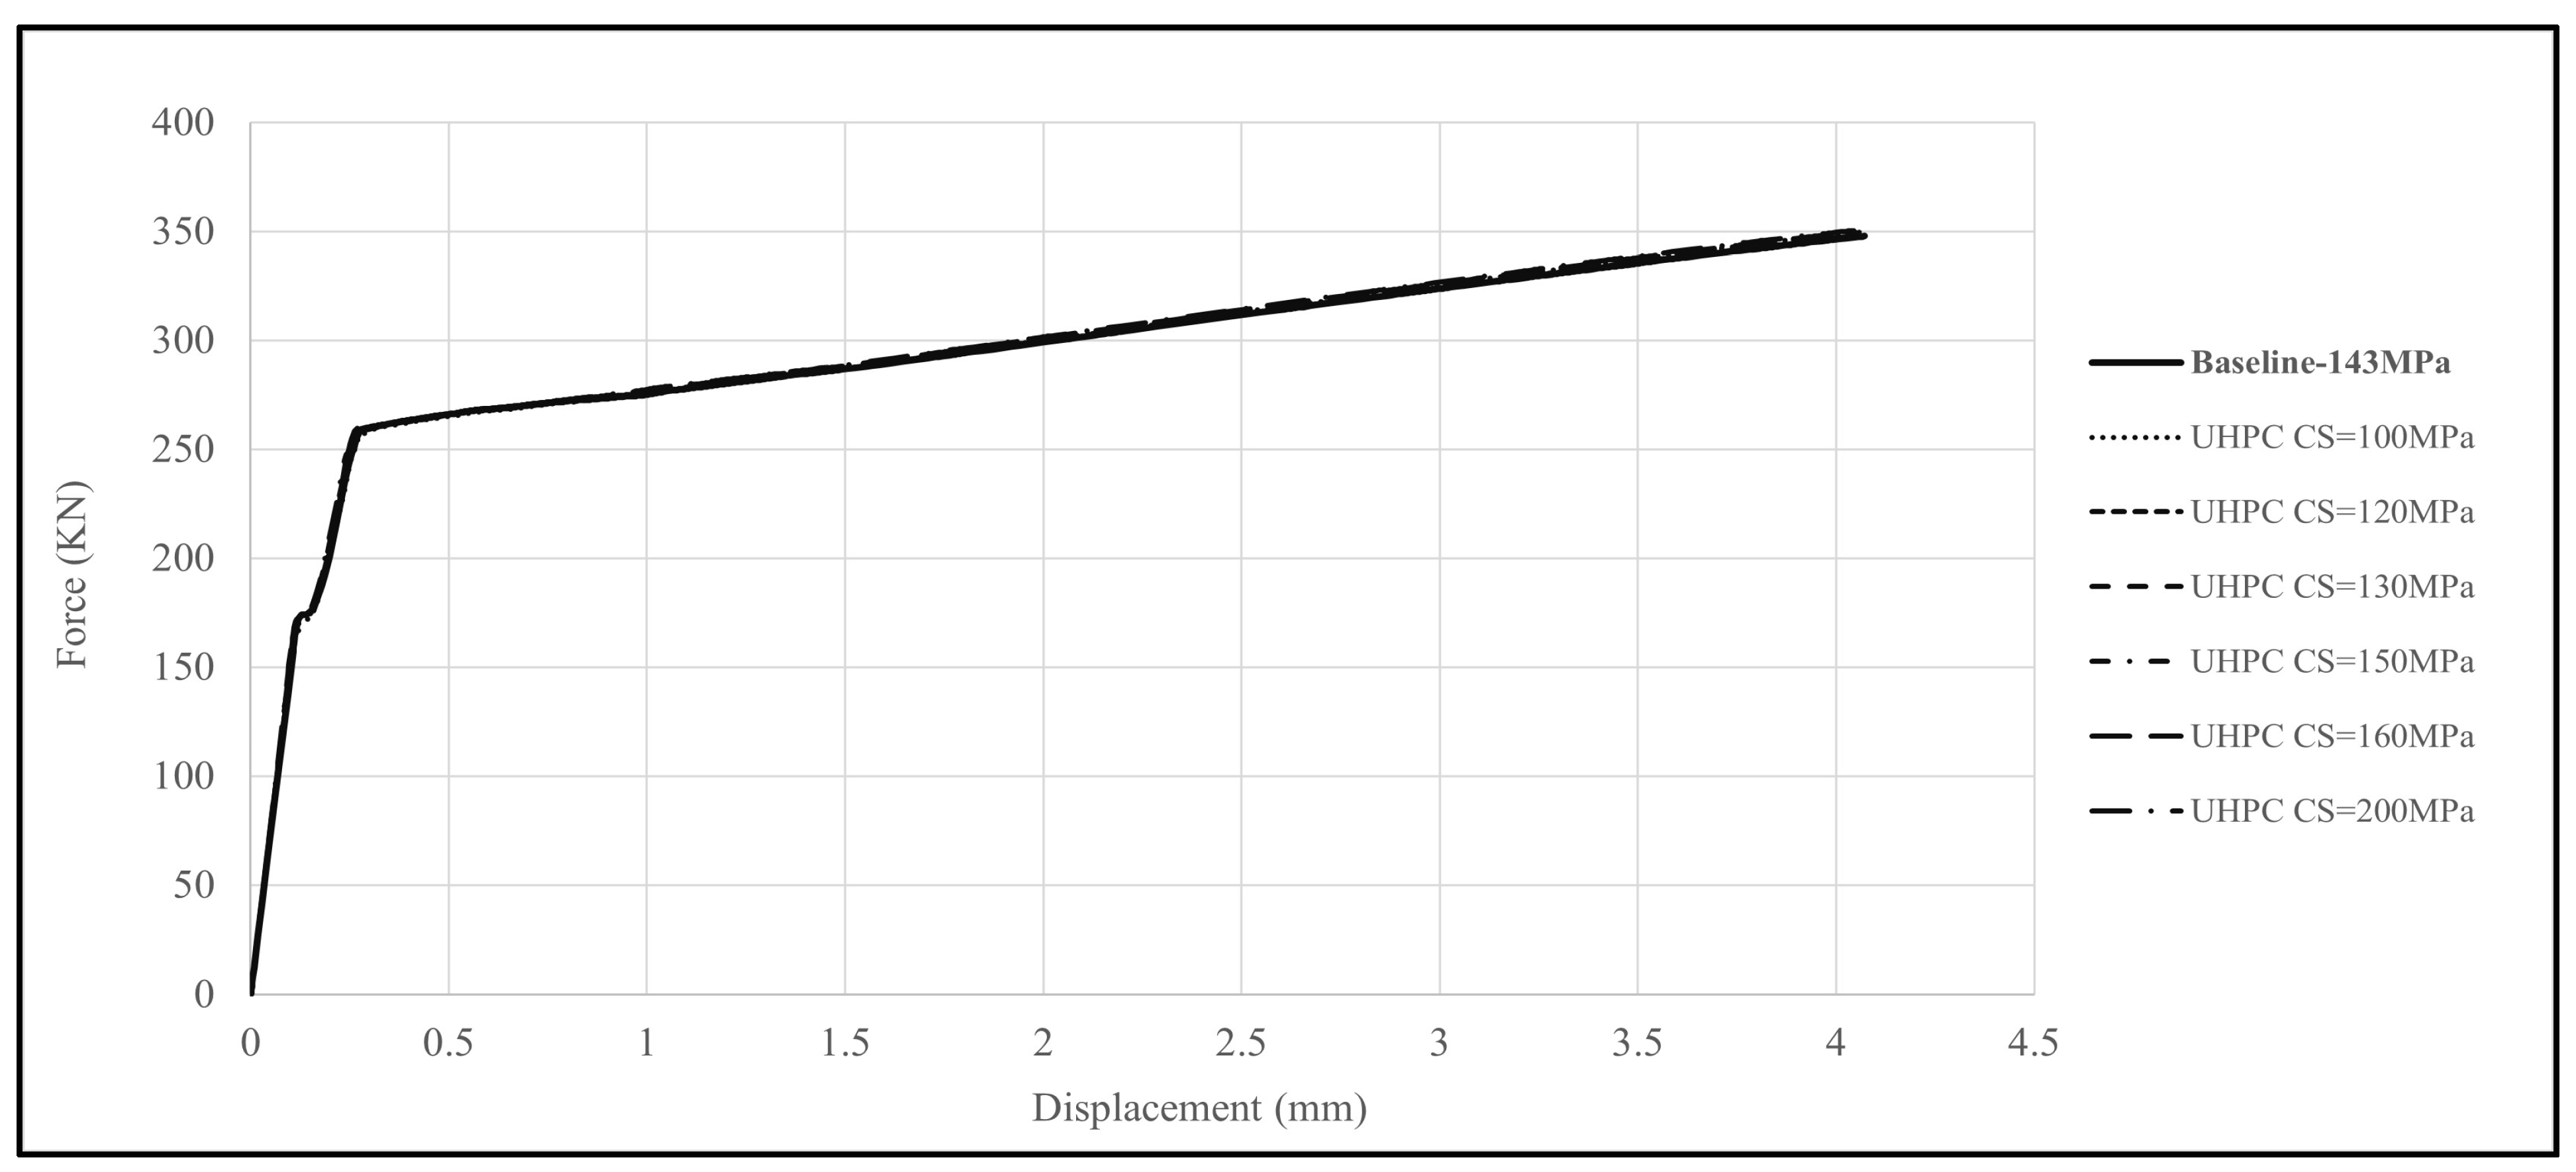
UHPC compressive strength (100–200 MPa) mainly influenced K0 (~ +7–8% from 100 to 200 MPa), while peak capacity changes were very small (|ΔPu| ≲ 1%), and μ remained essentially unchanged. This behavior is consistent with the load path being dominated by reinforcement and interface mechanics rather than the UHPC elastic modulus/strength within the tested range.
Normal concrete compressive strength in girders and decks (30–50 MPa) had a limited impact on capacity (|ΔPu| ≲ 1%) and a modest effect on K0 (~ +2–3% with higher strength), but it significantly affected deformation measures. Lower fc′ (e.g., 30 MPa) increased Δu and μ (~ +39% relative to 40 MPa), whereas higher fc′ reduced displacements and ductility. Hence, girder and deck strengths are effective tuning parameters for deformation demand without materially changing peak strength.
Thus, among numerical inputs, rebar yield strength exerts the strongest control on both stiffness and capacity and improves deformation capacity at higher values. The non-debonding interface friction coefficient provides a secondary lever that notably raises yield capacity and slightly increases ultimate capacity. The debonding zone friction coefficient is practically neutral in the tested range, while UHPC compressive strength and normal concrete strength primarily shape stiffness and ductility, with a negligible influence on Pu. For balanced performance, the results support maintaining a sufficiently high fy and appropriate non-debonding friction coefficient while using normal concrete strength (and, to a lesser extent, UHPC fc′) to calibrate stiffness and ductility without sacrificing peak load.
It should be noted that the present parametric investigation is intended to quantify the relative sensitivity of UHPC link slab response to practical variations in key geometrical and numerical parameters rather than to provide a probabilistic assessment of uncertainty. The influence of each parameter is evaluated using consistent response measures (K0, Py, Δy, Pu, Δu, and μ), allowing direct comparison of their relative effects. Within the investigated ranges, reinforcement detailing (bar diameter and spacing) and steel yield strength emerge as dominant drivers of stiffness, strength, and deformation capacity, whereas parameters such as the debonding zone friction coefficient, UHPC compressive strength, and normal concrete strength exhibit secondary influence. The bounded variation of material properties adopted in this study reflects realistic design and construction variability, providing practical insight into how real-world scatter may affect global structural response without resorting to stochastic modeling frameworks.
The parametric analyses were conducted by varying one parameter at a time to isolate first-order effects and establish a clear ranking of influential variables. While potential interactions among parameters such as reinforcement detailing, debonding length, and interface friction may exist, capturing these coupled effects would require a factorial analysis with substantially increased computational effort. Within the ranges investigated, the observed trends suggest largely separable physical roles for each parameter; nevertheless, multi-parameter interaction studies are identified as a valuable extension of the present work.

4. Conclusions

This study developed and validated a nonlinear finite element model of a UHPC link slab using the CDP framework and conducted a systematic parametric investigation around a validated baseline configuration. Consistent response metrics—including initial stiffness (K0), yield point (Py, Δy), ultimate capacity (Pu, Δu), and ductility ratio (μ)—were extracted to enable direct comparison across all cases.
Geometrical parameters: Among the geometrical variables, reinforcement detailing dominated the global response. Bar diameter exerted the strongest influence on stiffness, yield capacity, and ultimate load, with increases from #3 to #4 bars producing simultaneous gains in K0, Py, Pu, and Δu. Reinforcement spacing ranked second in influence, confirming that reinforcement quantity and distribution govern both strength and deformability of UHPC link slabs.
Debonding length primarily controlled deformation capacity rather than strength, enabling a targeted trade-off between ductility and peak capacity with a minimal effect on stiffness. Link slab thickness mainly affected stiffness and yield characteristics, while its influence on peak load remained limited. Link slab length showed the weakest influence on ultimate capacity within the investigated range, although increased length consistently reduced initial stiffness.
For example, increasing the reinforcement bar diameter from #3 to #4 resulted in an increase in ultimate load capacity in the order of 40–50%, whereas extending the debonding length over the investigated range reduced peak capacity by less than approximately 1–2%, while substantially improving ductility.
Numerical and material parameters: Steel yield strength emerged as the most influential numerical parameter, governing elastic stiffness, yield behavior, and ultimate capacity simultaneously. The friction coefficient at the non-debonding interface significantly affected yield capacity and load transfer efficiency, while its influence on ductility remained secondary. In contrast, friction at the debonding interface exhibited negligible impact on global response within the tested range, indicating that once debonding is introduced, small variations in interface friction are structurally insignificant.
UHPC compressive strength primarily affected stiffness but had a minimal effect on peak capacity, whereas the compressive strength of normal concrete in girders and decks influenced deformation capacity and ductility without materially altering ultimate strength.
Implications for design and modeling: For UHPC link slab design, capacity and stiffness are most effectively enhanced through reinforcement detailing (bar diameter and spacing), while debonding length should be selected to meet deformation and rotation demands without significant strength penalties. From a modeling perspective, an accurate definition of steel yield strength and non-debonding interface friction is critical for reliable response prediction, whereas uncertainties in UHPC compressive strength, debonding friction, and concrete strength are of secondary importance within practical ranges.

Author Contributions

Conceptualization, H.H. and G.U.; methodology, H.H.; software, H.H.; validation, H.H.; formal analysis, H.H.; investigation, H.H. and G.U.; resources, H.H. and G.U.; data curation, H.H.; writing—original draft preparation, H.H.; writing—review and editing, G.U.; visualization, H.H.; supervision, G.U.; project administration, G.U. All authors have read and agreed to the published version of the manuscript.

Funding

This research received no external funding.

Institutional Review Board Statement

Not Applicable.

Informed Consent Statement

Not Applicable.

Data Availability Statement

All data, models, or codes that support the findings of this study are available from the corresponding author upon reasonable request. The data are not public due to privacy.

Conflicts of Interest

The authors declare that they have no conflict of interest.

References

  1. Lin, J.H.; Briseghella, B.; Xue, J.Q.; Huang, F.Y.; Chen, B.C.; Nuti, C. Numerical analyses on tension behaviors of ultra-high performance concrete link slab for jointless bridges. In Life-Cycle Civil Engineering: Innovation, Theory and Practice; CRC Press: Boca Raton, FL, USA, 2021; pp. 1492–1496. [Google Scholar]
  2. Li, N. Performance of Link Slab Using ECC and UHPC. Master’s Thesis, University of Maryland, College Park, MD, USA, 2019. [Google Scholar]
  3. Reed, C. Evaluation of Functionality and Service Life of Ultra-High Performance Concrete Link Slab Connections for Bridges. Master’s Thesis, University of Oklahoma, Norman, OK, USA, 2022. [Google Scholar]
  4. Doiron, G.; White, P. UHPC link slab solutions in North America. In 3rd International Symposium on Ultra-High-Performance Fiber-Reinforced Concrete; Toutlemonde, F., Respendino, J., Eds.; RILEM Publications: Montpellier, France, 2017; pp. 975–982. [Google Scholar]
  5. Chen, B.C.; Ji, T.; Huang, Q.W.; Wu, H.Z.; Ding, Q.J.; Zhan, Y.W. Review of research on ultra-high-performance concrete. J. Archit. Civ. Eng. 2014, 31, 1–24. [Google Scholar]
  6. Lepech, M.D.; Li, V.C. Application of ECC for bridge deck link slabs. Mater. Struct. 2009, 42, 1185–1195. [Google Scholar] [CrossRef]
  7. Shan, Y.; Gong, Y.; Wang, Y.; Zhou, Q.; Li, X.; Ding, F.; Kuang, Y. Flexural behavior of ultra-high-performance concrete (UHPC) shaped thin-plate ribbed staircases: An experimental and numerical study. Mater. Struct. 2024, 57, 18. [Google Scholar] [CrossRef]
  8. Briseghella, B.; Lin, J.; Xue, J.; Pan, X.; Nuti, C. Experimental Study on Tension Mechanisms of UHPC Link Slab. In IABSE Congress Nanjing 2022-Bridges and Structures: Connection, Integration and Harmonisation; International Association for Bridge and Structural Engineering (IABSE): Zurich, Switzerland, 2022; Report 2022; pp. 600–606. [Google Scholar]
  9. Haghighi, H.; Urgessa, G. Finite Element Analysis of Pre-Stressed Ultra-High-Performance Concrete (UHPC) Girders. Engineering 2024, 5, 123. [Google Scholar] [CrossRef]
  10. Scarlata, J.; Bureau, P.S. UHPC Link Slab Design. In Proceedings of the Ultra High Performance Concrete Workshop; New York Department of Transportation: Albany, NY, USA, 2017. [Google Scholar]
  11. Graybeal, B. Design and Construction of Field-Cast UHPC Connections; Federal Highway Administration: Washington, DC, USA, 2014.
  12. Au, A.; Lam, C.; Au, J.; Tharmabala, B. Eliminating deck joints using deboned link slabs: Research and field tests in Ontario. J. Bridge Eng. 2013, 18, 768–778. [Google Scholar] [CrossRef]
  13. Sun, Z.; Li, X.; Liu, C. Study on the Flexural Performance of Ultra High-Performance Concrete–Normal Concrete Composite Slabs. Materials 2024, 17, 4675. [Google Scholar]
  14. Anwar Hossain, K.M.; Chu, K.; Lachemi, M. Fatigue performance of ECC link slab incorporated full RC girder joint-free bridges. Adv. Bridge Eng. 2024, 5, 5. [Google Scholar] [CrossRef]
  15. ABAQUS. Version 6.14 Documentation. 2014. Available online: http://62.108.178.35:2080/v6.14/index.html (accessed on 25 January 2026).
  16. Panahi, H.; Genikomsou, A.S. Comparative Investigation of Concrete Plasticity Models for Nonlinear Finite-Element Analysis of Reinforced Concrete Specimens. Pract. Period. Struct. Des. Constr. 2022, 27, 04021083. [Google Scholar] [CrossRef]
  17. Tysmans, T.; Wozniak, M.; Remy, O.; Vantomme, J. Finite element modelling of the biaxial behavior of high-performance fiber-reinforced cement composites (HPFRCC) using Concrete Damaged Plasticity. Finite Elem. Anal. Des. 2015, 100, 47–53. [Google Scholar] [CrossRef]
  18. Lubliner, J.; Oliver, J.; Oller, S.; Oñate, E. A plastic-damage model for concrete. Int. J. Solids Struct. 1989, 25, 299–326. [Google Scholar] [CrossRef]
  19. Lee, J.; Fenves, G.L. Plastic-Damage Model for Cyclic Loading of Concrete Structures. J. Eng. Mech. 1998, 124, 892–900. [Google Scholar] [CrossRef]
  20. Singh, M.; Sheikh, A.; Ali, M.M.; Visintin, P.; Griffith, M. Experimental and numerical study of the flexural behavior of ultra-high-performance fiber reinforced concrete beams. Constr. Build. Mater. 2017, 138, 12–25. [Google Scholar] [CrossRef]
  21. Mahmud, G.H.; Yang, Z.; Hassan, A.M.T. Experimental and numerical studies of size effects of Ultra High-Performance Steel Fiber Reinforced Concrete (UHPFRC) beams. Constr. Build. Mater. 2013, 48, 1027–1034. [Google Scholar] [CrossRef]
  22. Chen, L.; Graybeal, B.A. Modeling structural performance of second-generation ultrahigh-performance concrete pi-girders. J. Bridge Eng. 2012, 17, 634–643. [Google Scholar] [CrossRef]
  23. El-Helou, R.G.; Haber, Z.B.; Graybeal, B.A. Mechanical Behavior and Design Properties of Ultra-High-Performance Concrete. ACI Mater. J. 2022, 119, 181–194. [Google Scholar]
  24. ACI Committee 239. ACI 239R-18: Ultra-High-Performance Concrete—An Emerging Technology Report; American Concrete Institute: Farmington Hills, MI, USA, 2018. [Google Scholar]
  25. American Association of State Highway and Transportation Officials. AASHTO LRFD Bridge Design Specifications, 10th ed.; American Association of State Highway and Transportation Officials: Washington, DC, USA, 2024. [Google Scholar]
Figure 1. Test set-up and arrangement of gauges: (a) elevation view, (b) experimental work photo [8]. Please define LVDTs here.
Applmech 07 00014 g001
Figure 2. Flowchart illustrating the overall research methodology.
Applmech 07 00014 g002
Figure 3. Geometry of the FE model: (a) front view, (b) isometric view.
Applmech 07 00014 g003
Figure 4. Different parts of the FE model.
Applmech 07 00014 g004
Figure 5. Yield surface under plane stress conditions [18].
Applmech 07 00014 g005
Figure 6. Proposed compressive stress–strain model for UHPC design [23].
Applmech 07 00014 g006
Figure 7. Compressive stress–strain relationship of the UHPC used in the reference experimental study, generated by applying the compression model proposed by El-Helou et al. [23].
Applmech 07 00014 g007
Figure 8. Proposed tensile stress–strain models for UHPC design: (a) strain hardening with stress plateau, (b) strain hardening with continuous increase in post-cracking stress [23].
Applmech 07 00014 g008
Figure 9. Tensile stress–strain relationship of the UHPC used in the reference experimental study, generated by applying the compression model proposed by El-Helou et al. [23].
Applmech 07 00014 g009
Figure 10. Bilinear tensile stress–strain behavior of HRB335 steel reinforcement used in the FE model.
Applmech 07 00014 g010
Figure 11. Boundary conditions and load in FEM.
Applmech 07 00014 g011
Figure 12. Experimental and FEM force–displacement curves for the link slab.
Applmech 07 00014 g012
Figure 13. Load–displacement curves for different link slab lengths compared with the validated baseline.
Applmech 07 00014 g013
Figure 14. Load–displacement curves for different link slab thicknesses compared with the validated baseline.
Applmech 07 00014 g014
Figure 15. Load–displacement curves for different debonding lengths compared with the validated baseline.
Applmech 07 00014 g015
Figure 16. Load–displacement curves for different rebar sizes compared with the validated baseline.
Applmech 07 00014 g016
Figure 17. Load–displacement curves for different rebar spacings compared with the validated baseline.
Applmech 07 00014 g017
Figure 18. Load–displacement curves for different friction coefficients between link slabs and girders compared with the validated baseline.
Applmech 07 00014 g018
Figure 19. Load–displacement curves for different friction coefficients between the rubber sheet and girders compared with the validated baseline.
Applmech 07 00014 g019
Figure 20. Load–displacement curves for different compressive strengths of UHPC compared with the validated baseline.
Applmech 07 00014 g020
Figure 21. Load–displacement curves for different compressive strengths of normal concrete compared with the validated baseline.
Applmech 07 00014 g021
Figure 22. Load–displacement curves for different yield strengths of steel compared with the validated baseline.
Applmech 07 00014 g022
Table 1. Extracted mechanical response parameters for all geometrical variations compared with the validated baseline model.
ParameterStudied ValueInitial Stiffness, K0 (KN/mm)Yield Load Capacity, Py (KN)Yield Displacement, Δy (mm)Ultimate Load Capacity, Pu (KN)Ultimate Displacement, Δu (mm)Ductility Ratio, μ
Link Slab Length900 mm1339.797253.6510.307346.4244.09013.337
1000 mm1326.755264.0550.303354.4584.41514.563
1100 mm1349.721254.7970.266347.7864.07115.323
1200 mm1290.678259.5420.309350.1253.92812.734
1300 mm1248.979264.3780.338349.5634.07812.047
Link Slab Thickness801316.416254.5530.337347.2924.06212.060
901281.954259.2320.289348.4554.21614.590
1001349.721254.7970.266347.7864.07115.323
1101377.450259.1920.274350.5954.02914.693
1201485.488259.1840.266352.6174.08015.317
Debonding Length3001429.927266.3510.277356.4553.80513.723
4501424.418263.1850.282359.1944.01414.219
6001349.721254.7970.266347.7864.07115.323
7501438.381252.3710.269343.3294.22015.691
9001453.197251.5640.267342.4884.24115.901
Rebar Diameter
(For 10 Rebars)
#2 (ϕ = 6.4 mm)986.615112.4830.114158.4053.88534.080
#3 (ϕ = 9.5 mm)1349.721254.7970.266347.7864.07115.323
#4 (ϕ = 12.7 mm)1755.786348.5840.346514.3847.53721.768
Rebar Spacing
(For Rebar #3) mm
751589.744317.3430.318440.8745.64117.713
1001349.721254.7970.266347.7864.07115.323
1251216.036207.8520.241281.1973.89716.141
Table 2. Extracted mechanical response parameters for all numerical variations compared with the validated baseline model.
ParameterStudied ValueInitial Stiffness, K0 (KN/mm)Yield Load Capacity, Py (KN)Yield Displacement, Δy (mm)Ultimate Load Capacity, Pu (KN)Ultimate Displacement, Δu (mm)Ductility Ratio, μ
Friction Coefficient
(Link Slab–Girders, Non-Debonding)
0.0011389.830242.9020.256333.264.11916.099
0.31416.225253.4310.266343.9314.07815.340
0.41349.721254.7970.266347.7864.07115.324
0.51361.312261.8780.274350.5684.08214.904
0.61377.837266.3470.279346.4514.24915.249
0.71377.989272.1040.289347.6754.27914.784
11375.907286.3640.301355.0624.73915.750
Friction Coefficient
(Rubber Sheet–Girders, Debonding)
Frictionless1349.721254.7970.266347.7864.07115.324
0.051349.423258.6440.276347.7864.07114.735
0.081349.371258.6440.276347.6884.06714.716
0.11349.337258.6440.276347.7864.07114.735
Compressive Strength of UHPC
(Link Slab) (MPa)
1001400.710256.0730.271349.8774.07815.030
1201379.504258.6900.273347.8694.05414.827
1301450.962258.9130.272348.6634.07514.951
1431349.721254.7970.266347.7864.07115.324
1501426.223258.7580.269349.3464.04915.324
1601496.817258.7500.268349.6194.04515.324
2001505.562259.6300.271350.4614.04515.324
Compressive Strength of Normal Concrete (Girders/Decks) (MPa)301366.638245.9970.227348.0054.83421.269
351343.047256.9020.282345.6564.93817.502
401349.721254.7970.266347.7864.07115.324
451290.127255.6750.260347.4244.04315.324
501399.938257.9790.260346.8654.00915.324
Yield Strength of Rebars (MPa)3001349.501223.8980.233273.5033.85716.543
3421349.721254.7970.266347.7864.07215.324
3601349.501270.8440.294340.5834.03813.748
4001418.25939290.5400.309388.8995.38117.433
Disclaimer/Publisher’s Note: The statements, opinions and data contained in all publications are solely those of the individual author(s) and contributor(s) and not of MDPI and/or the editor(s). MDPI and/or the editor(s) disclaim responsibility for any injury to people or property resulting from any ideas, methods, instructions or products referred to in the content.